Embed Size (px)
Citation preview

40 volume 32 NumBeR 1 JANuARY 2014 nature biotechnology
Trade Commission Bureau of Economics, Abrantes-Metz et al.9 covered a wide num-ber of drugs over a 14 year period from 1989 to 2002, but did not provide the number or type of companies investigated. Although the impact of company size and experience on R&D productivity has been studied exten-sively10–13, success rates established by DiMasi et al.6, Kola et al.8 and Abrantes-Metz et al.9 remain the primary benchmarks for the drug development industry.
We believe it is of great value to report updated success rates that capture the diver-sity in drug development sponsor types as experience and technology vary widely out-side of traditional, large pharmaceutical cor-porations. Furthermore, the more recent time frame for this study provides insight into the latest industry productivity. A comparison of previously published reports with the current study is summarized in Table 3 and is dis-cussed below.
One key distinction of the study pre-sented here is our ability to evaluate all of a drug’s indications to determine success rates. Danzon et al.12 first considered suc-cess rates at the indication level, recognizing that FDA requires clinical trial evidence to establish efficacy for each approved indi-cation. Although these authors included data from 1988 to 2000, an observation period similar to Kola et al.8 and Abrantes-Metz et al.9, their success rates were sig-nificantly higher and lacked a characteristic decrease in phase 2 probability reported in previous studies as well as here. Danzon et al.12 concluded that higher clinical develop-ment success rates resulted from the analysis of all indications. Even so, evidence presented here strongly suggests that evaluating all indications results in lower probabilities of success across all phases of drug development.
Since the human genome was sequenced ten years ago, the number of compounds
in development has increased 62% and total R&D expenditures have doubled1–3. And yet, the average number of new drugs approved by the US Food and Drug Administration (FDA) per year has declined since the 1990s. In 2012, 39 novel drugs classified as new molecular entities (NMEs) and biologic license applications (BLAs) were approved by the FDA4. Although this represents the highest number of approvals since 1997 and is nearly 50% above the average of 26 approv-als per year over the past decade, 25% fewer NME and BLA drugs were approved on aver-age in the past 10 years compared with the 1990s5. Several possible explanations for the divergence of R&D spending and new product approvals have been offered by professionals in the industry, such as unbalanced regulatory risk-benefit assessments, higher regulatory efficacy hurdles, commercial and financial decisions driving project termination, and the increased complexity and cost of clinical trials6,7.
This article aims to measure clinical devel-opment success rates across the industry with a view to strengthening benchmarking met-rics for drug development. The study is the largest and most recent of its kind, examining success rates of 835 drug developers, includ-ing biotech companies as well as specialty and
large pharmaceutical firms from 2003 to 2011. Success rates for over 7,300 independent drug development paths are analyzed by clinical phase, molecule type, disease area and lead versus nonlead indication status.
Our results pinpoint weaknesses along the capital-intensive pathway to drug approval. Our hope is that they will prove useful in informing policy makers where to focus changes in regulation and strengthen valua-tion models used by industry and the invest-ment community.
Analyzing successTo measure clinical development success rates for investigational drugs, we analyzed phase transitions from January 1, 2003 to December 31, 2011, in the BioMedTracker database. The BioMedTracker data set contained 4,451 drugs with 7,372 independent clinical development paths from 835 companies and included 5,820 phase transitions. The development paths comprised lead (primary) and nonlead (sec-ondary) indications, with roughly 38% desig-nated as nonlead. A more detailed description of the data collection, composition and analy-sis methodology is described in Boxes 1–3 (see also Tables 1 and 2).
Unlike many previous studies that reported clinical development success rates for large pharmaceutical companies, this study pro-vides a benchmark for the broader drug devel-opment industry by including small public and private biotech companies and specialty phar-maceutical firms. The aim is to incorporate data from a wider range of clinical develop-ment organizations, as well as drug modalities and targets. Two landmark publications on the subject, DiMasi et al.6 and Kola et al.8 use 50 and 10 pharmaceutical company pipelines, respectively, to arrive at their conclusions. An important study published by the US Federal
Clinical development success rates for investigational drugs Michael Hay, David W Thomas, John L Craighead, Celia Economides & Jesse Rosenthal
The most comprehensive survey of clinical success rates across the drug industry to date shows productivity may be even lower than previous estimates.
Michael Hay and Jesse Rosenthal are at BioMedTracker, Sagient Research Systems, San Diego, California, USA; David W. Thomas and Celia Economides are at the Biotechnology Industry Organization (BIO), Washington, DC, USA; and John L. Craighead is at Biotech Strategy & Analytics, Rockville, Maryland, USA. e-mail: [email protected]
F E AT U R Enp
g©
2014
Nat
ure
Am
eric
a, In
c. A
ll rig
hts
rese
rved
.

nature biotechnology volume 32 NumBeR 1 JANuARY 2014 41
To illustrate the importance of using all indications to determine success rates, con-sider this scenario. An antibody is developed in four cancer indications, and all four indi-cations transition successfully from phase 1 to phase 3, but three fail in phase 3 and only one succeeds in gaining FDA approval. Many prior studies reported this as 100% success, whereas our study differentiates the results as 25% success for all indications, and 100% suc-cess for the lead indication. Considering the cost and time spent on the three failed phase 3 indications, we believe including all ‘develop-ment paths’ more accurately reflects success and R&D productivity in drug development.
Examining individual drug indications allows us to answer the question: “what is the probability that a drug developed for a specific indication will reach approval?” Whereas, using only the lead or most advanced indi-cation seeks to answer the question: “what is the probability that a drug will reach approval for any indication?” This study addresses both questions with emphasis on the findings of the former. In the following sections, we pres-ent the results of our analysis as they relate to overall phase success and likelihood of approval (LOA; see Box 2), to the type of ther-apeutic modality, to the disease being treated and to the type of drug application (whether orphan or Special Protocol Assessment (SPA) pathways).
Phase success and likelihood of approvalWe found that approximately one in ten (10.4%, n = 5,820) of all indication develop-ment paths in phase 1 were approved by FDA (Fig. 1 and Table 4). Examining the individual phase components of this compound prob-ability, phase I success (the number of phase 1 drugs that successfully transitioned to phase 2 divided by the total transitions in phase 1) was 64.5% (n = 1,918). Success in phase 2 (32.4%, n = 2,268) was substantially lower than in phase 1, but subsequently increased in phase 3 (60.1%, n = 975). The probability of FDA approval after submitting a new drug appli-cation (NDA) or biologic license application (BLA) was 83.2% (n = 659).
Success rates for lead indication develop-ment paths were higher than for all indica-tion development paths in every phase. Lead indications had a LOA from phase 1 of 15.3% (n = 3,688).
Success rates by drug classificationDrugs in the BioMedTracker data set were annotated by their FDA classification: new molecular entity (NME), non-NME, biologic and vaccine. However, owing to inconsistency in the FDA classifications, we also used our
Box 1 Data collection and composition
BioMedTracker, a subscription-based product of Sagient Research Systems (San Diego) introduced in 2002, tracks the clinical development and regulatory history of novel investigational drugs in the United States. Analysts with advanced degrees in the life sciences and medicine maintain the database using information from company press releases, analyst conference calls, and presentations at investor and medical meetings. BioMedTracker also uses other sources, including regular communication with companies conducting clinical trials, to ensure the accuracy and timeliness of the data.
Data included in this study were selected using BioMedTracker’s Probability of Technical Success (PTS) calculator, which identified 5,820 phase transitions from January 1, 2003, to December 31, 2011. Transitions in all phases of development were recorded in the early years of observation and resulted from clinical studies initiated before 2003. The data set contained 4,451 drugs from 835 companies and 7,372 independent clinical development paths in 417 unique indications.
The composition of these novel drug development sponsors included a wide range of company sizes and types (Table 1). Emerging biotech represented 85% (712) of the companies, whereas a small number (33) of large firms (4% of total) were responsible for 48% (3,573) of indications and 47% (2,075) of drugs in development. Similarly, private firms represented 49% (412) of the companies and fewer than 20% of indications and drugs included in the study.
These ownership classifications were recorded at the end of the analysis time period and underestimate the number of drugs and indications developed by biotech companies due to licensing and acquisitions during the study time frame. In addition, ownership was assigned to the licensee controlling and funding the majority of development. In cases where development and economics were shared equally, ownership was generally assigned to the larger organization, further contributing to the conservative estimate of drugs developed by small and private biotech companies. Although generic products were not included, generic manufacturers developing novel investigational drugs were represented.
The study also likely tracked a larger percentage of late-stage studies as these programs are more often in the public domain. Even so, small biotech companies often disclose ongoing phase 1 studies and we would expect their substantial representation in this study to partially offset the under-representation of early-stage discontinuation rates.Only company sponsored development paths designed for FDA approval were considered; investigator sponsored studies and combinations with other investigational drugs were excluded in this analysis.
In addition, this study analyzed development paths organized by disease area, biochemical composition, molecular size, FDA classification and regulatory status (SPA and orphan drug status). Given the increasing complexity of ownership and diversity of invention in the drug development industry, the study did not further classify the database on the discovery origin or licensing status of the drug.
Table 1 Analysis of company size and typeCompanies Indications Drugs
Number Percentage Number Percentage Number Percentage
Company size
Large pharma/biotech (>$5 billion sales)
33 4% 3,573 48% 2,075 47%
Small to mid-sized pharma/biotech ($0.1 billion– $5 billion sales)
90 11% 1,099 15% 724 16%
Emerging biotech (<$0.1 billion sales)
712 85% 2,700 37% 1,652 37%
Total 835 – 7,372 – 4,451 –
Company type
Private 412 49% 1,269 17% 841 19%
Public 423 51% 6,103 83% 3,601 81%
Total 835 – 7,372 – 4,451 –
FEATUREnp
g©
2014
Nat
ure
Am
eric
a, In
c. A
ll rig
hts
rese
rved
.

42 volume 32 NumBeR 1 JANuARY 2014 nature biotechnology
data to annotate drugs by their biochemi-cal composition (e.g., peptide, nucleic acid, monoclonal antibody (mAb)) and molecu-lar size (i.e., large and small molecules). For example, FDA often designates large- molecule biologics, such as proteins and pep-tides, as NMEs. Indeed, large molecules, as defined by the BioMedTracker biochemical categories, comprise 13% of the NME data set, making direct FDA NME to biologic classifica-tion comparisons somewhat imprecise. FDA’s biologic classification comprises a wider group that includes the Center for Drug Evaluation and Research (CDER) regulated products, such as antibodies, cytokines, growth fac-tors and enzymes, as well as the Center for
Biologics Evaluation and Research (CBER) regulated products including blood isolates, gene therapies and cell therapy.
FDA’s non-NME classification often includes drugs with the same molecular properties as NMEs, but which are frequently reformulations or combinations of approved products. The majority of non-NMEs also use the 505(b)(2) pathway to gain FDA approval. Vaccines were also treated as a separate class in this analysis, and generic and over-the-counter drugs were not included. A com-parative analysis of FDA classifications and BioMedTracker categories can be found in Supplementary Table 1. The metrics for the different therapeutic modality types is pro-
vided in Table 4.NMEs were found
to have the low-est success rates in every phase of devel-opment; biologics had nearly twice the LOA from phase 1 (14.6%, n = 1,173) as NMEs (7.5%, n = 3,496) for all indi-cations (Table 4). Similar results are seen when the data are reclassified into l a r g e - m o l e c u l e (excluding low molecular weight chemicals and ste-roids) and small-molecule NMEs: 13.2% (n = 1,834) and
7.6% (n = 3,029), respectively. In addition, the LOA from phase 1 for mAbs (14.1%, n = 639), a good proxy for CDER-regulated biologics, was also consistent with these broader defini-tions of biologics.
Non-NMEs had the highest LOA from phase 1 of 20.0% (n = 855), with success rates well above those of the NME and biologic classifications in every phase. However, many non-NMEs begin development in phase 2 or phase 3, so the actual approval rate is likely higher (assuming that successful phase 1 out-comes would contribute positively to the LOA from phase 1).
When analyzing lead indications only (i.e., on a per drug basis), we find similar rankings for NME, biologic and non-NME, but at much higher success rates. The LOA from phase 1 for biologics and non-NMEs are near one in four and NMEs approach one in eight (12.0%, n = 2,124), almost twice what was found when all indications were considered.
Success rates by diseaseWe found substantial variation in success rates among disease, as listed in Table 5 from high-est to lowest LOA from phase 1. Oncology drugs had the lowest LOA from phase 1 at 6.7% (n = 1,803). Drugs for the ‘other’ disease group, which combined allergy, gastroenterol-ogy, ophthalmology, dermatology, obstetrics-gynecology and urology indications due to small sample size, had the highest LOA from phase 1, at 18.2% (n = 720). Drugs for infec-tious disease and autoimmune-immunol-ogy groups had the next two highest LOAs from phase 1, at 16.7% (n = 537) and 12.7% (n = 549), respectively.
On a lead indication basis, also in Table 5, we found that cardiovascular drugs had the lowest LOA from phase 1 at 8.7% (n = 318) and the ‘other’ disease category again had the highest success rate at 24.5% (n = 499). The largest difference between lead and all- indication for LOA from phase 1 was observed in oncology: 6.7% (n = 1,803) for lead indica-tion and 13.2% (n = 796) for all indications. Oncology drugs also had the most nonlead indications (56% of all development paths compared with 28% of non-oncology indi-cations) as a result of the large number of cancers investigated using the same drug. Unfortunately, in oncology, when all indi-cations are considered, only around 1 in 15 drugs entering clinical development in phase 1 achieves FDA approval compared with close to 1 in 8 using the lead indication methodology. As noted above, the result for lead indications represents the most success-ful development path for a particular com-pound, thereby addressing LOA on a per drug
Lead indications
67% 64%
39%
32%
68%
60%
86%83%
15.3%10.4%
All indications
Phase 1 tophase 2
Phase 2 to phase 3
Phase 3 to NDA/BLA
NDA/BLA to approval
LOA fromphase 1
ba
Phase success
Figure 1 Phase success and LOA rates. (a) Phase success rates for lead and all indications. The rates represent the probability that a drug will successfully advance to the next phase. (b) LOA from phase 1 for lead and all indications. Rates denote the probability of FDA approval for drugs in phase 1 development.
Box 2 Metrics of success: ‘Phase Success’ and ‘Likelihood of Approval’
There are two different types of success rates reported in this study: ‘Phase Success’ and ‘Likelihood of Approval’ (LOA). ‘Phase Success’ is calculated as the number of drugs that moved from one phase to the next phase divided by the sum of the number of drugs that progressed to the next phase and the number of drugs that were suspended. The n value associated with the Phase Success represents the number of drugs that have advanced plus the number of drugs that have been suspended, which we label as phase transitions. For example, if there were 100 drugs in phase 2 development and 50 transitioned to phase 3, 20 were suspended and 30 remained in phase 2 development, the phase 2 Phase Success would be 71.4% (50/70; n = 70).
Our second metric, LOA, denotes the probability of reaching FDA approval from the current phase, and is also expressed as a percentage. LOA is calculated as the product of each Phase Success probability leading to FDA approval. The n value associated with LOA is the sum of the n values for each Phase Success included in the LOA calculation. For example, if a drug is currently in phase 2, and the Phase Success for phase 2 is 30% (n = 20), phase 3 is 50% (n = 10), and FDA approval is 80% (n = 5), then the LOA for the phase 2 drug would be 12% (30% × 50% × 80% = 12%, n = 35). This calculation is illustrated in Supplementary Figure 2.
F EATUREnp
g©
2014
Nat
ure
Am
eric
a, In
c. A
ll rig
hts
rese
rved
.

nature biotechnology volume 32 NumBeR 1 JANuARY 2014 43
Data used for this study were extracted from BioMedTracker using a probability of technical success (PTS) tool, which identified all ‘Advanced’ and ‘Suspended’ drugs by development phase from January 1, 2003, to December 31, 2011. BioMedTracker tracks the clinical development and regulatory history of investigational drugs to assess its Likelihood of Approval (LOA) from phase 1 by the FDA. The database is populated in near real-time with updated information from press releases, corporate earnings calls, investor and medical meetings, and numerous other sources. These data are recorded in BioMedTracker and tagged with a date.
Phase is defined as the stage of clinical development in the United States (Table 2). Although it is rare, drugs that were removed from development in the United States, but approved in Europe (e.g., vildagliptin for type II diabetes) were considered ‘suspended’ for the sake of our analysis. In this time period, 7,372 development paths were analyzed, encompassing 4,451 unique compounds. 5,820 unique phase transitions were used to determine the reported success rates. Table 4 includes the number of observed transitions by phase (a description of the success rate analysis is described). Phase 2 transitions accounted for the highest percentage of the data set with 39% (n = 2,268), compared with 33% in phase 1 (n = 1,918), 17% in phase 3 (n = 975) and 11% in NDA/BLA (n = 659). Nonlead indications comprise 38% (n = 2,132) of the 5,820 total transitions and success rates by phase can be found in Supplementary Table 2.
Development paths track a specific indication for each drug. For example, Rituxan (rituximab) in non-Hodgkin’s lymphoma qualifies as a development path different from Rituxan in multiple sclerosis (MS). BioMedTracker assigns a unique internal identifier that can be used to isolate all development paths. In addition to tracking the phase of development, BioMedTracker assigns ‘lead’ status to certain development paths. This is used to denote the most advanced indication in clinical development for a specific drug. Drugs can only have one lead development path, except in specific circumstances where two development paths are being developed simultaneously (e.g., type I and type II diabetes). For example, the Avastin (bevacizumab) colorectal cancer development path was marked as a ‘lead’ indication, and other Avastin development paths were labeled ‘nonlead’. Using this metric, Avastin clinical development can more accurately be viewed as a series of successes and failures, as opposed to simply one success and no failures. However, a drug’s lead indication may also change if it fails in development in the lead indication. The lead indication success rate will therefore be higher due to selection bias than the nonlead success rate. This bias does not affect the LOA from phase 1 rate for all indication development paths.
BioMedTracker also records a number of other variables including the following:
• FDA classification (e.g., NME, non-NME, biologic or vaccine)• Biochemical profile (e.g., small molecule, monoclonal
antibody, antisense)
• Disease area (e.g., autoimmune, cardiovascular, oncology)• Indication (e.g., diabetes, acute coronary syndrome)In contrast with many earlier studies, which included only a
limited sample of drugs from large companies, the current study included BioMedTracker data from small biotech companies as well as specialty and large pharmaceutical firms.
Phase success and LOA rates calculation. A common method of determining drug development success rates detailed in DiMasi et al.6 and Abrantes-Metz et al.9 was used in this study. Phase Success, defined as the probability of a drug moving from phase X to phase X + 1, was used as the basis for all analyses. To arrive at this value, the following questions are used to categorize each drug development path: first, was the drug development path ever in phase X? Second, if so, did it advance to phase X + 1? And third, was it ‘Suspended’? After categorizing all drug development paths, Phase Success is calculated by dividing the number of development paths that advanced from phase X to phase X + 1 by the sum of the number of development paths that advanced from phase X to phase X + 1 and the number of development paths that were suspended from phase X – Advanced/(Advanced + Suspended) = Phase Success.
Using this method, we arrived at the probabilities of an ‘average’ drug advancing from phase 1 to phase 2, from phase 2 to phase 3, from phase 3 to filing the NDA/BLA and from filing the NDA/BLA to FDA approval. We then compounded these probabilities to determine the probability (LOA) that a drug in phase X is approved. For example, the LOA for a drug which has entered phase 2 is the product of the phase success rates from phase 2, phase 3 and NDA/BLA. An example calculation is illustrated in Supplementary Figure 2.
For purposes of this analysis, all indications that were advanced or suspended in any phase during our collection time frame were included. In practice, this means a drug that ‘entered’ the analysis in 2003 in phase 2, and later advanced to phase 3, was included in the study. This method was selected because there are relatively few drugs that entered development in phase 1 in the range of years analyzed and have subsequently progressed through final FDA review, and there is less disclosure of drugs in phase 1 development. Abrantes-Metz et al.9 also used a similar method and stated, “We did it this way because the data set has very few drugs with complete information for all… phases.” Drugs that remained in the same phase were censored, as were those that moved back a phase but were not suspended9.
Box 3 Methods used in this study
Table 2 Definitions of terms used in this studyBioMedTracker term Description for purposes of this study
I Drug is currently in phase 1
I/II, II, IIb Drug is currently in phase 2
II/III, III Drug is currently in phase 3
NDA/BLA Application for approval has been submitted to the FDA and is currently under review
Approved, withdrawn from market, approved (Generic competition)
Drug has been approved for marketing in the United States
Suspended Drug is no longer in development
Approved in Europe, Approved in other than US/EU, Development, Development outside US
The company developing this drug does not plan to market it in the United States
FEATUREnp
g©
2014
Nat
ure
Am
eric
a, In
c. A
ll rig
hts
rese
rved
.
44 volume 32 NumBeR 1 JANuARY 2014 nature biotechnology
basis. Using the lead indication methodology to determine success rates, the scope of the challenge in oncology drug development would be dramatically underestimated.
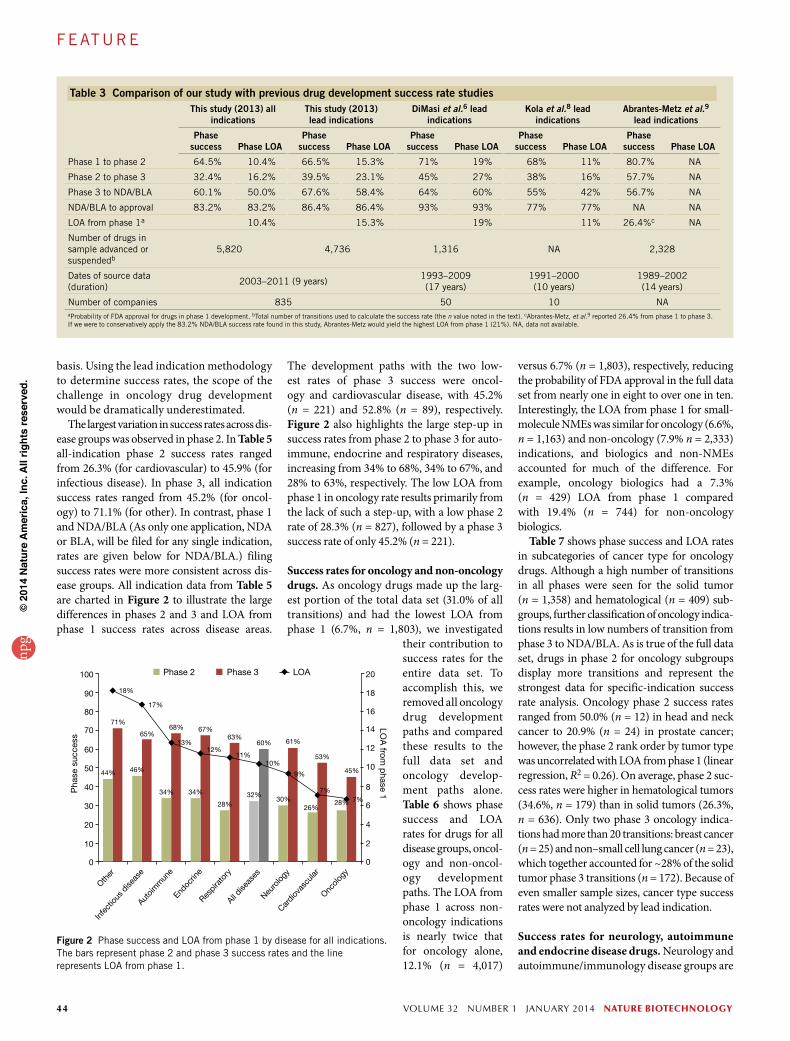
The largest variation in success rates across dis-ease groups was observed in phase 2. In Table 5 all-indication phase 2 success rates ranged from 26.3% (for cardiovascular) to 45.9% (for infectious disease). In phase 3, all indication success rates ranged from 45.2% (for oncol-ogy) to 71.1% (for other). In contrast, phase 1 and NDA/BLA (As only one application, NDA or BLA, will be filed for any single indication, rates are given below for NDA/BLA.) filing success rates were more consistent across dis-ease groups. All indication data from Table 5 are charted in Figure 2 to illustrate the large differences in phases 2 and 3 and LOA from phase 1 success rates across disease areas.
The development paths with the two low-est rates of phase 3 success were oncol-ogy and cardiovascular disease, with 45.2% (n = 221) and 52.8% (n = 89), respectively. Figure 2 also highlights the large step-up in success rates from phase 2 to phase 3 for auto-immune, endocrine and respiratory diseases, increasing from 34% to 68%, 34% to 67%, and 28% to 63%, respectively. The low LOA from phase 1 in oncology rate results primarily from the lack of such a step-up, with a low phase 2 rate of 28.3% (n = 827), followed by a phase 3 success rate of only 45.2% (n = 221).
Success rates for oncology and non-oncology drugs. As oncology drugs made up the larg-est portion of the total data set (31.0% of all transitions) and had the lowest LOA from phase 1 (6.7%, n = 1,803), we investigated
their contribution to success rates for the entire data set. To accomplish this, we removed all oncology drug development paths and compared these results to the full data set and oncology develop-ment paths alone. Table 6 shows phase success and LOA rates for drugs for all disease groups, oncol-ogy and non-oncol-ogy development paths. The LOA from phase 1 across non-oncology indications is nearly twice that for oncology alone, 12.1% (n = 4,017)
versus 6.7% (n = 1,803), respectively, reducing the probability of FDA approval in the full data set from nearly one in eight to over one in ten. Interestingly, the LOA from phase 1 for small-molecule NMEs was similar for oncology (6.6%, n = 1,163) and non-oncology (7.9% n = 2,333) indications, and biologics and non-NMEs accounted for much of the difference. For example, oncology biologics had a 7.3% (n = 429) LOA from phase 1 compared with 19.4% (n = 744) for non-oncology biologics.
Table 7 shows phase success and LOA rates in subcategories of cancer type for oncology drugs. Although a high number of transitions in all phases were seen for the solid tumor (n = 1,358) and hematological (n = 409) sub-groups, further classification of oncology indica-tions results in low numbers of transition from phase 3 to NDA/BLA. As is true of the full data set, drugs in phase 2 for oncology subgroups display more transitions and represent the strongest data for specific-indication success rate analysis. Oncology phase 2 success rates ranged from 50.0% (n = 12) in head and neck cancer to 20.9% (n = 24) in prostate cancer; however, the phase 2 rank order by tumor type was uncorrelated with LOA from phase 1 (linear regression, R2 = 0.26). On average, phase 2 suc-cess rates were higher in hematological tumors (34.6%, n = 179) than in solid tumors (26.3%, n = 636). Only two phase 3 oncology indica-tions had more than 20 transitions: breast cancer (n = 25) and non–small cell lung cancer (n = 23), which together accounted for ~28% of the solid tumor phase 3 transitions (n = 172). Because of even smaller sample sizes, cancer type success rates were not analyzed by lead indication.
Success rates for neurology, autoimmune and endocrine disease drugs. Neurology and autoimmune/immunology disease groups are
Figure 2 Phase success and LOA from phase 1 by disease for all indications. The bars represent phase 2 and phase 3 success rates and the line represents LOA from phase 1.
Other
Infe
ctiou
s dise
ase
Autoim
mun
eEnd
ocrin
eRes
pira
tory
All dise
ases
Neuro
logy
Cardi
ovas
cular
Oncolo
gy
Pha
se s
ucce
ss
LOA
from p
hase 1
Phase 2
44%
71%
18%
46%
65%
17%
34% 34%
68% 67%
13%12%
28%
63%
11%
32%
60%
10%
30%
61%
9%
26%
53%
7%7%28%
45%
Phase 3 LOA
◆
◆
◆
◆◆ ◆
◆◆
◆ ◆
100
90
80
70
60
50
40
30
20
20
18
16
14
12
10
8
6
4
2
0
10
0
Table 3 Comparison of our study with previous drug development success rate studiesThis study (2013) all
indicationsThis study (2013)lead indications
DiMasi et al.6 leadindications
Kola et al.8 leadindications
Abrantes-Metz et al.9 lead indications
Phase success Phase LOA
Phase success Phase LOA
Phase success Phase LOA
Phase success Phase LOA
Phase success Phase LOA
Phase 1 to phase 2 64.5% 10.4% 66.5% 15.3% 71% 19% 68% 11% 80.7% NA
Phase 2 to phase 3 32.4% 16.2% 39.5% 23.1% 45% 27% 38% 16% 57.7% NA
Phase 3 to NDA/BLA 60.1% 50.0% 67.6% 58.4% 64% 60% 55% 42% 56.7% NA
NDA/BLA to approval 83.2% 83.2% 86.4% 86.4% 93% 93% 77% 77% NA NA
LOA from phase 1a 10.4% 15.3% 19% 11% 26.4%c NA
Number of drugs in sample advanced or suspendedb
5,820 4,736 1,316 NA 2,328
Dates of source data (duration)
2003–2011 (9 years)1993–2009 (17 years)
1991–2000 (10 years)
1989–2002 (14 years)
Number of companies 835 50 10 NAaProbability of FDA approval for drugs in phase 1 development. bTotal number of transitions used to calculate the success rate (the n value noted in the text). cAbrantes-Metz, et al.9 reported 26.4% from phase 1 to phase 3. If we were to conservatively apply the 83.2% NDA/BLA success rate found in this study, Abrantes-Metz would yield the highest LOA from phase 1 (21%). NA, data not available.
F EATUREnp
g©
2014
Nat
ure
Am
eric
a, In
c. A
ll rig
hts
rese
rved
.

nature biotechnology volume 32 NumBeR 1 JANuARY 2014 45
success rates in all phases, except for NDA/BLA submissions, at 86.4% (n = 22).
Regulatory pathway success ratesTo investigate the influence of regulation on clinical success we looked at two important pathways for drug oversight: the SPA and orphan drug designation.
SPA success rates. Similar to other analy-ses, we looked at phase success and LOA rates for drugs with an SPA (Table 9). Before
An autoimmune subset analysis reveals that biologics had more than five times the LOA from phase 1 (22.5%, n = 288) than NMEs (5.2%, n = 202). Table 8 also includes success rates for the type II diabetes and rheumatoid arthritis indication subcatego-ries. Although rheumatoid arthritis had a 100% (n = 5) NDA/BLA submission suc-cess, the LOA from phase 1 was only 10.3% (n = 130) due to one of the lowest phase 2 success rates in this study (15.9%, n = 63). Diabetes also displayed lower-than-average
well represented, comprising 17% and 9% of the data set, respectively. We subcategorized neurology into pain and psychiatric disor-ders, the two main therapeutic areas rep-resenting 51% of all neurology indications (Table 8). Analyzing all development paths, pain indications had a 10.7% (n = 231) LOA from phase 1 compared with 7.2% (n = 294) for psychiatric disorders. Other neurology indications, mainly representing neurode-generative diseases, had a 9.8% (n = 452) LOA from phase 1.
90%
61% 57%
88%
68% 64%
48%
71%
71%
36%
84%81%
78% 78%
88%
68%
•••
•
•
◆
▲▲▲
▲
▲•
•
•• •
◆ ◆◆
◆
Cum
ulat
ive
app
rova
l suc
cess
(%)
Ap
pro
vals
FDA review
First Second Third Fourth Fifth
AllLeadNMEs - allNMEs - lead
56.9%53.3%55.5%52.2%
79.0%78.7%72.4%72.0%
86.2%87.0%78.0%77.6%
87.3%88.5%79.1%79.5%
87.5%88.8%79.1%79.5%
Cumulative First review
Infec
tious
dise
ase
Respira
tory
All dise
ases
Autoim
mun
e
Oncolo
gy
Neuro
logy
Cardiov
ascu
lar
Endoc
rine
ba 100
90
80
70
60
50
40
0
10
20
30
40
50
60
70
80
90
100
Figure 3 NDA/BLA success rates. (a) Cumulative approval rates by FDA review from 2005 to 2011 (914 reviews). (b) Cumulative and first FDA approval rates by disease.
Table 4 Phase success and LOA by drug classPhase 1 to phase 2 Phase 2 to phase 3 Phase 3 to NDA/BLA NDA/BLA to approval
Total in phasea
Advanced or suspendedb
Phase successc
Phase LOAd
Total in phasea
Advanced or sus-
pendedbPhase
successcPhase LOAd
Total in phasea
Advanced or sus-
pendedbPhase
successcPhase LOAd
Total in phasea
Advanced or sus-
pendedbPhase
successcPhase LOAd
FDA classificatione
All indications 2,541 1,918 64.5% 10.4% 3,743 2,268 32.4% 16.2% 1,554 975 60.1% 50.0% 908 659 83.2% 83.2%
NMEs 1,585 1,218 64.2% 7.5% 2,375 1,470 28.6% 11.6% 831 515 53.2% 40.7% 425 293 76.5% 76.5%
Biologics 572 411 68.4% 14.6% 819 464 37.9% 21.3% 320 182 63.2% 56.1% 159 116 88.8% 88.8%
Non-NMEs 218 168 66.7% 20.0% 355 226 45.1% 29.9% 321 234 75.6% 66.3% 293 227 87.7% 87.7%
Lead indications 1,770 1,336 66.5% 15.3% 2,070 1,247 39.5% 23.1% 1,009 633 67.6% 58.4% 664 472 86.4% 86.4%
NMEs 1094 848 65.2% 12.0% 1,275 791 36.4% 18.3% 497 300 61.7% 50.3% 283 185 81.6% 81.6%
Biologics 362 257 75.1% 20.8% 403 216 44.0% 27.7% 182 106 71.7% 63.1% 106 75 88.0% 88.0%
Non-NMEs 167 124 66.9% 23.2% 232 153 49.0% 34.6% 254 186 79.0% 70.7% 246 189 89.4% 89.4%
Biomedtracker product categoryf
Small moleculeNMEs 1,335 1,033 65.4% 7.6% 2,053 1,283 29.0% 11.6% 725 449 52.3% 39.8% 369 264 76.1% 76.1%
Large molecules 912 658 65.8% 13.2% 1,279 714 37.7% 20.1% 511 296 60.1% 53.3% 244 166 88.6% 88.6%
mAbs 329 234 70.1% 14.1% 458 268 38.1% 20.1% 147 84 60.7% 52.7% 65 53 86.8% 86.8%
non-mAb proteins 192 151 58.9% 13.1% 280 170 35.3% 22.3% 150 87 69.0% 63.1% 93 59 91.5% 91.5%
Vaccines 121 57 67.1% 14.9% 160 79 44.3% 22.2% 67 34 50.0% 50.0% 23 20 100.0% 100.0%aNumber of indications identified. bTotal number of transitions used to calculate the success rate, the n value noted in the text. The difference between ‘Total in phase’ and ‘Advanced or suspended’ is the number of indica-tions that remain in development. cProbability of successfully advancing to the next phase. dProbability of FDA approval for drugs in this phase of development. eFDA NME, biologic and non-NME classifications as defined in the results section. Data are presented for all and lead indication development paths. fBioMedTracker classification of small-molecule NMEs and large-molecule drugs. Large molecules are further stratified by biochemical profile.
F EATUREnp
g©
2014
Nat
ure
Am
eric
a, In
c. A
ll rig
hts
rese
rved
.

46 volume 32 NumBeR 1 JANuARY 2014 nature biotechnology
third, fourth or fifth time the agency reviewed the specific application). Figure 3a shows the cumulative success rates for NDA/BLA filings in the all, lead and NME drug classifications. Only 56.9% of all applications were approved on the first NDA/BLA submission, whereas 86.2% were approved by the third submission. After the third submission, there was only a marginal increase in the cumulative approval percentage, as there were few drugs with more than three regulatory reviews. For all NMEs, we found similar first submission success rates, yet fewer than 80% of these drugs were approved by FDA in subsequent submissions.
Analysis of first review approval success rates by disease reveals a variation incon-sistent with cumulative approval rates. For example, Figure 3b shows that although oncology drugs had a median NDA/BLA suc-cess rate (81%), the chances of a first review approval were the highest, at 71%. Neurology drugs, on the other hand, had the lowest first review approval rate at 36%, but the cumula-tive approval rate reached 78%.
We also examined 304 first review FDA complete response letters and approvable letters issued for approved and suspended drugs. For approved drugs, 46% of the letters to the sponsor cited manufacturing or label-ing issues and 47% cited efficacy or safety. In contrast, for suspended drugs, only 2% cited manufacturing or labeling issues and
initiating a pivotal phase 3 program, compa-nies can submit the protocol to the FDA to obtain the agency’s agreement that the trial(s) are adequate to meet its scientific and regu-latory requirements. At the same time, these trials are often more complex and investigate treatments for less well understood diseases. This latter point is evident from our analysis: NDA/BLA success rates for SPA-designated drugs are slightly below average at 80.0% (n = 45) compared with 83.2% (n = 659) for all drugs. On the other hand, phase 3 success rates are nearly identical at 60.0% (n = 110) for SPA-designated drug indications compared with 60.1% (n = 975) for all drugs.
Orphan drug pathway success rates. A com-pany may request that FDA grant the orphan designation for a drug being studied in a rare disease or condition. This is intended for indi-cations affecting fewer than 200,000 people in the United States. Orphan drug designation was designed to reduce development costs and provide financial incentives (e.g., an extended exclusivity period) to encourage develop-ment in these indications. Table 9 shows that although drugs for orphan indications have high rates of phase 1 and 2 success, phase 3 and NDA/BLA success rates are similar to all indications. Even so, it is important to note that orphan designations can be granted at any point in the clinical development
process and are most often received when a drug is in phase 2. Orphan drugs in our data set received orphan status at all stages of development: preclinical (9%), phase 1 (22%), phase 2 (45%), phase 3 (16%) and NDA/BLA (2%). This distribution introduces a positive bias in early development success rates as some trials are not annotated as orphan until later phases. In contrast, by phase 3, 82% of indications that end up with the orphan des-ignation have been annotated. Indeed, orphan indication phase 1 and 2 success rates were well above average at 86.8% (n = 136) and 70.0% (n = 190), respectively. Orphan phase 3 success rates (66.9%, n = 148) also com-pared favorably with all indications (60.1%, n = 975) and orphan NDA/BLA approvals were lower, 81.0% (n = 84) compared with 83.2% (n = 659), respectively. A subgroup analysis of phase 3 and NDA/BLA stage orphan drugs by indication reveals that oncology success rates were lower than non-oncology drugs, a result that is consistent with these categories in the full data set.
NDA/BLA success ratesTo complement the NDA/BLA phase suc-cess rates gathered above, we examined 910 FDA decisions from 2005 to 2011 and classi-fied each as ‘Approved’ or ‘Not Approved.’ In addition, we determined at which FDA review each decision occurred (i.e., the first, second,
Table 5 Phase success and LOA by diseasea
Phase 1 to phase 2 Phase 2 to phase 3 Phase 3 to NDA/BLA NDA/BLA to approval
Total in phaseb
Advanced or sus-
pendedcPhase
successdPhase LOAe
Total in phaseb
Advanced or sus-
pendedcPhase
successdPhase LOAe
Total in phaseb
Advanced or sus-
pendedcPhase
successcPhase LOAe
Total in phaseb
Advanced or sus-
pendedcPhase
successdPhase LOAe
All indications
Otherf 254 198 72.2% 18.2% 419 251 44.2% 25.3% 252 159 71.1% 57.1% 169 112 80.4% 80.4%
Infectious disease 247 196 65.8% 16.7% 288 157 45.9% 25.4% 159 98 65.3% 55.4% 115 86 84.9% 84.9%
Autoimmune 241 178 68.0% 12.7% 350 215 34.0% 18.7% 149 95 68.4% 55.0% 88 61 80.3% 80.3%
Endocrine 223 180 58.3% 11.6% 293 198 33.8% 19.8% 147 95 67.4% 58.5% 91 61 86.9% 86.9%
Respiratory 110 90 66.7% 11.1% 193 120 27.5% 16.7% 58 30 63.3% 60.8% 33 25 96.0% 96.0%
Neurology 389 298 62.4% 9.4% 520 348 30.2% 15.0% 285 188 60.6% 49.9% 192 152 82.2% 82.2%
Cardiovascular 158 127 60.6% 7.1% 229 152 26.3% 11.7% 121 89 52.8% 44.6% 78 58 84.5% 84.5%
Oncology 919 651 63.9% 6.7% 1,451 827 28.3% 10.5% 383 221 45.2% 37.0% 142 104 81.7% 81.7%
Total 2,541 1,918 64.5% 10.4% 3,743 2,268 32.4% 16.2% 1,554 975 60.1% 50.0% 908 659 83.2% 83.2%
Lead indications
Otherf 193 146 75.3% 24.5% 273 157 50.3% 32.5% 174 115 74.8% 64.6% 122 81 86.4% 86.4%
Infectious disease 228 181 66.9% 19.3% 248 135 45.9% 28.8% 127 76 69.7% 62.8% 94 70 90.0% 90.0%
Respiratory 79 66 63.6% 16.3% 120 76 31.6% 25.6% 40 20 85.0% 81.0% 29 21 95.2% 95.2%
Autoimmune 165 127 67.7% 15.4% 178 102 37.3% 22.8% 77 52 80.8% 61.1% 56 37 75.7% 75.7%
Endocrine 188 152 61.2% 14.5% 226 155 38.1% 23.8% 122 78 69.2% 62.4% 78 51 90.2% 90.2%
Oncology 489 334 68.9% 13.2% 527 298 42.3% 19.1% 193 106 54.7% 45.3% 85 58 82.8% 82.8%
Neurology 301 228 62.7% 12.3% 339 218 34.4% 19.6% 191 124 66.9% 56.8% 137 106 84.9% 84.9%
Cardiovascular 127 102 62.7% 8.7% 159 106 27.4% 13.8% 85 62 56.5% 50.6% 63 48 89.6% 89.6%
Total 1,770 1,336 66.5% 15.3% 2,070 1,247 39.5% 23.1% 1,009 633 67.6% 58.4% 664 472 86.4% 86.4%aCategories are listed from highest to lowest LOA from phase 1 for all indications (lead and nonlead). bNumber of indications identified. cTotal number of transitions used to calculate the success rate, the n value noted in the text. The difference between ‘Total in phase’ and ‘Advanced or suspended’ is the number of indications that remain in development. dProbability of successfully advancing to the next phase. eProbability of FDA approval for drugs in this phase of development. fIncludes allergy, gastroenterology, ophthalmology, dermatology, obstetrics/gynecology and urology.
F EATUREnp
g©
2014
Nat
ure
Am
eric
a, In
c. A
ll rig
hts
rese
rved
.

nature biotechnology volume 32 NumBeR 1 JANuARY 2014 47
83% cited efficacy or safety. Furthermore, we analyzed the time to drug approval after receiving a first complete response letter and found a 15-month average delay across all diseases with a setback of over one year for all diseases except (Supplementary Fig. 1) infectious disease (Supplementary Fig. 2).
Lead and nonlead indication success ratesClassifying drugs by lead and nonlead indica-tions results in a selection bias favoring lead indication success rates. For lead indications that are suspended, and have a nonlead devel-opment path in-progress, the nonlead indica-tion is redefined as the lead indication. The most advanced nonlead indications therefore becomes the lead indications once the initial lead is suspended. The BioMedTracker data-base is maintained as such for real-time view-ing of pipelines, where it is critical to identify a company’s lead program for each compound.
This lead indication annotation method-ology tracks the most successful develop-ment path, and closely resembles the best case scenario for a specific drug. On the other hand, nonlead indication success rates understate the importance of lead indica-tions that were previously designated as nonlead. Nonlead indication success rates are included in Supplementary Table 2, and, as expected, have a much lower success rate across all phases. For nonlead indi-cations, the LOA from phase 1 was 4.9% (n = 2,132) compared with 15.3% (n = 3,688) for lead indications. The most pronounced deviation was found in phase 3, where lead indications had a 67.6% (n = 633) success rate, whereas nonlead indications had a 46.2% (n = 342) probability of advancing to NDA/BLA. The disparity between lead and nonlead success rates is noteworthy, and the accuracy of nonlead rates must
be viewed in the context of the selection methodology.
DISCUSSIONDuring the time frame of this study, approxi-mately one development path in ten (10.4%) that enters clinical development in phase 1 is expected to advance to FDA approval. We also analyzed lead indication data and found nearly a one-in-six (15.3%) probability a drug will advance from phase 1 to FDA approval. We believe that the lower success rate for all-indication development paths more accurately reflects drug development success rates in industry and is particularly important when considering the cost and time of unsuccessful clinical trials.
One limitation of this study is the direct comparison of these data and methodology on a year-by-year or decade-by-decade basis. For example, a program was designated as
Table 6 Phase success and LOA for oncology and non-oncology disease groupsPhase 1 to phase 2 Phase 2 to phase 3 Phase 3 to NDA/BLA NDA/BLA to approval
Total in phasea
Advanced or sus-
pendedbPhase
successcPhase LOAd
Total in phasea
Advanced or sus-
pendedbPhase
successcPhase LOAd
Total in phasea
Advanced or sus-
pendedbPhase
successcPhase LOAd
Total in phasea
Advanced or sus-
pendedbPhase
successcPhase LOAd
FDA classificatione
All indications 2,541 1,918 64.5% 10.4% 3,743 2,268 32.4% 16.2% 1,554 975 60.1% 50.0% 908 659 83.2% 83.2%
Total oncology 919 651 63.9% 6.7% 1,451 827 28.3% 10.5% 383 221 45.2% 37.0% 142 104 81.7% 81.7%
Oncology NMEs 574 402 65.9% 6.6% 948 534 27.5% 10.0% 245 150 46.0% 36.4% 101 77 79.2% 79.2%
Oncology biologics
244 177 61.6% 7.3% 346 193 30.6% 11.9% 83 41 43.9% 39.0% 24 18 88.9% 88.9%
Oncology non-NMEs
53 39 69.2% 9.4% 76 50 22.0% 13.6% 26 17 70.6% 61.8% 16 8 87.5% 87.5%
Total non-oncology
1622 1267 64.8% 12.1% 2,292 1,441 34.8% 18.7% 1,171 754 64.5% 53.8% 766 555 83.4% 83.4%
Non-oncologyNMEs
1011 816 63.4% 7.9% 1,427 936 29.3% 12.4% 586 365 56.2% 42.4% 324 216 75.5% 75.5%
Non-oncologybiologics
328 234 73.5% 19.4% 473 271 43.2% 26.4% 237 141 68.8% 61.1% 135 98 88.8% 88.8%
Non-oncologynon-NMEs
165 129 65.9% 22.7% 279 176 51.7% 34.5% 295 217 76.0% 66.7% 277 219 87.7% 87.7%
BioMedTracker product categoryf
All indications 2,541 1,918 64.5% 10.4% 3,743 2,268 32.4% 16.2% 1,554 975 60.1% 50.0% 908 659 83.2% 83.2%
Total oncology 919 651 63.9% 6.7% 1,451 827 28.3% 10.5% 383 221 45.2% 37.0% 142 104 81.7% 81.7%
Oncology smallmolecule NMEs
492 346 66.5% 7.2% 830 466 28.8% 10.9% 219 136 45.6% 37.8% 93 70 82.9% 82.9%
Oncology mAbs 175 125 68.0% 9.3% 245 140 29.3% 13.7% 55 30 50.0% 46.9% 21 16 93.8% 93.8%
Oncologyproteins/peptides
68 50 48.0% 3.4% 108 57 31.6% 7.1% 34 16 37.5% 22.5% 8 5 60.0% 60.0%
Oncology vaccines 41 28 50.0% 1.6% 73 43 39.5% 3.3% 28 12 8.3% 8.3% 1 1 100.0% 100.0%
Total non-oncology 1622 1267 64.8% 12.1% 2,292 1,441 34.8% 18.7% 1,171 754 64.5% 53.8% 766 555 83.4% 83.4%
Non-oncology small molecule NMEs
843 687 64.9% 7.7% 1,223 817 29.1% 11.9% 506 313 55.3% 40.7% 276 194 73.7% 73.7%
Non-oncology mAbs
154 109 72.5% 19.3% 213 128 47.7% 26.6% 92 54 66.7% 55.9% 44 37 83.8% 83.8%
Non-oncologyproteins/ peptides
228 178 65.7% 18.0% 321 198 42.4% 27.4% 191 118 69.5% 64.7% 125 72 93.1% 93.1%
Non-oncology vaccines
82 57 71.9% 21.8% 87 38 47.4% 30.3% 44 25 64.0% 64.0% 22 19 100.0% 100.0%
aNumber of indications identified. bTotal number of transitions used to calculate the success rate, the n value noted in the text. The difference between ‘Total in phase’ and ‘Advanced or suspended’ is the number of indica-tions that remain in development. cProbability of successfully advancing to the next phase dProbability of FDA approval for drugs in this phase of development. eOncology and non-oncology disease groups and FDA NME, bio-logic, and non-NME classifications. Data are presented for all indication development paths. fOncology and non-oncology disease groups and BioMedTracker biochemical categories.
F EATUREnp
g©
2014
Nat
ure
Am
eric
a, In
c. A
ll rig
hts
rese
rved
.

48 volume 32 NumBeR 1 JANuARY 2014 nature biotechnology
‘suspended’ when conclusive evidence had been gathered regarding a company’s plans to discontinue development, or communications with regulators were not reinitiated for several years. Unfortunately, the timing of annotat-ing suspended indications and drugs is not precise enough to analyze yearly changes in success rates. Furthermore, real-time data col-lection was initiated in 2003; thus, we cannot directly compare prior decades using these data and must rely on results published in the literature.
Many previous studies considered only a drug’s most advanced indication to determine drug development success rates. Most pub-lished data from the 1960s to present reported success rates ranging from one in five to one in eight14–19. For comparison with more recent findings, we summarize in Table 3 the results from DiMasi et al.6, Kola et al.8 and Abrantes-Metz et al.9. The most recent pub-lication on the subject, from DiMasi et al.6, reports a nearly one-in-five LOA from phase 1 (19%, n = 1,316) from 1993 to 2009. In Kola et al.8, the authors found an LOA from phase 1 of 11%, close to the 10.4% reported here for all indications. However, given the small number of company pipelines (10 versus 835 reported here) and lack of information about the num-ber of drugs advanced or suspended in this study, these results were inconclusive. In addi-tion, the Abrantes-Metz et al.9 data covered a similar period as Kola et al.8, 1989 to 2002 versus 1991 to 2000, respectively, but did not report NDA/BLA success rates. If we were to conservatively apply the 83.2% NDA/BLA success rate found in this study, Abrantes-Metz et al.9 would yield the highest LOA from phase 1 (21%), again near one in five.
Comparing the phase transitions, phase 2 success rates were consistently lower than phase 1, with phase 1 ranging from 65% to 81%, and phase 2 from 32% to 58%. In this study, and in DiMasi et al.6 and Kola et al.8,
a step-up in phase 3 success rates from phase 2 rates was observed. Only Abrantes-Metz et al.9 reported a phase 2 success rate (57.7%) in-line with phase 3 (56.7%), a result that was 20 percentage points higher than the phase 2 success rate in Kola et al.8 (38%) for a similar time period (Table 3). There are fewer data available to compare NDA/BLA success rates, but our result of 83.2% is similar to that of Kola et al.8 (77%) and 10% lower than that of DiMasi et al.6.
For lead indication success rates, our results are similar to that found by DiMasi et al.6. Although our LOA from phase 1 for lead indications (15.3%) is below DiMasi et al.’s6 19% result, it is close to their 16% result for self-originated drugs. We also note that the 16% success rate for self-originated drugs held over multiple time frames (1993–1998 and 1999–2004) in their studies. One pos-sible explanation is that success rates for self- originated drugs at large pharmaceutical companies are less prone to selection bias compared with late-stage, in-licensed drugs.
Factors contributing to lower success rates found in this study include the large number of small biotech companies represented in the data, more recent time frame (2003–2011) and higher regulatory hurdles for new drugs. Small biotech companies tend to develop riskier, less validated drug classes and targets, and are more likely to have less experienced
54%
Phase 3
48%
9% 8%
31%
18% 19%
13%
Ef�cacy Safety
Sus
pen
ded
(%)
Commercial Unknown
NDA/BLA
0
10
20
30
40
50
60
Figure 4 Root-cause analysis for 359 phase 3 and 95 NDA/BLA suspended programs. A program was designated as ‘suspended’ when conclusive evidence had been gathered regarding a company’s plans to discontinue development or communications with regulators were not reinitiated for several years.
Table 7 Phase success and LOA for oncology subgroups and cancer typesPhase 1 to phase 2 Phase 2 to phase 3 Phase 3 to NDA/BLA NDA/BLA to approval
Total in phasea
Advanced or sus-
pendedbPhase
successcPhase LOAd
Total in phasea
Advanced or sus-
pendedbPhase
successcPhase LOAd
Total in phasea
Advanced or sus-
pendedbPhase
successcPhase LOAd
Total in phasea
Advanced or sus-
pendedbPhase
successcPhase LOAd
All indications 2,541 1,918 64.5% 10.4% 3743 2268 32.4% 16.2% 1554 975 60.1% 50.0% 908 659 83.2% 83.2%
Total oncology 919 651 63.9% 5.4% 1451 827 28.3% 8.5% 383 147 36.7% 30.0% 142 104 81.7% 81.7%
Total solid tumors 668 483 66.7% 5.7% 1114 636 26.3% 8.6% 299 172 41.3% 32.7% 88 67 79.1% 79.1%
Renal cell cancer (RCC) 20 15 86.7% 18.4% 54 33 30.3% 21.2% 15 10 70.0% 70.0% 7 6 100.0% 100.0%
Head and neck cancer 6 5 100.0% 14.3% 23 12 50.0% 14.3% 14 7 42.9% 28.6% 3 3 66.7% 66.7%
Hepatocellular (liver) cancer (HCC)
18 15 73.3% 6.6% 39 25 36.0% 9.0% 12 4 25.0% 25.0% 1 1 100.0% 100.0%
Breast cancer 54 47 68.1% 5.7% 119 61 21.3% 8.4% 34 25 56.0% 39.2% 14 10 70.0% 70.0%
Non-small cell lung cancer (NSCLC)
63 55 87.3% 5.7% 161 94 29.8% 6.5% 46 23 26.1% 21.7% 11 6 83.3% 83.3%
Prostate cancer 42 8 71.0% 5.6% 103 24 20.9% 7.8% 25 8 56.3% 37.5% 11 3 66.7% 66.7%
Colorectal cancer (CRC) 45 37 62.2% 5.1% 87 56 21.4% 8.2% 18 13 38.5% 38.5% 4 4 100.0% 100.0%
Ovarian cancer 31 25 68.0% 4.6% 72 37 27.0% 6.8% 15 8 25.0% 25.0% 3 1 100.0% 100.0%
Pancreatic cancer 29 24 75.0% 2.3% 66 36 30.6% 3.1% 19 10 20.0% 10.0% 2 2 50.0% 50.0%
Total hematological tumors 216 152 58.6% 9.9% 317 179 34.6% 16.9% 78 45 55.6% 48.8% 48 33 87.9% 87.9%
Multiple myeloma (MM) 43 29 69.0% 9.7% 48 30 23.3% 14.0% 13 5 60.0% 60.0% 5 4 100.0% 100.0%
Non-Hodgkin’s lymphoma (NHL)
38 28 57.1% 8.5% 62 35 40.0% 14.8% 19 9 44.4% 37.0% 8 6 83.3% 83.3%
Chronic lymphocytic leuke-mia (CLL)
17 12 50.0% 7.3% 41 24 29.2% 14.6% 10 8 62.5% 50.0% 7 5 80.0% 80.0%
Myelodysplastic syndrome (MDS)
12 7 71.4% 4.8% 22 9 33.3% 6.7% 6 5 20.0% 20.0% 4 3 100.0% 100.0%
aNumber of indications identified. bTotal number of transitions used to calculate the success rate, the n value noted in the text. The difference between ‘Total in phase’ and ‘Advanced or suspended’ is the number of indications that remain in development. cProbability of successfully advancing to the next phase. dProbability of FDA approval for drugs in this phase of development.
F EATUREnp
g©
2014
Nat
ure
Am
eric
a, In
c. A
ll rig
hts
rese
rved
.

nature biotechnology volume 32 NumBeR 1 JANuARY 2014 49
improved overall survival, but lack well- validated surrogate markers for this outcome. On the other hand, disease areas with vali-dated surrogate markers tend to have higher phase 3 success rates. For example, studies of infectious diseases such as hepatitis C and HIV that use viral load as a primary endpoint as well as glycosylated hemoglobin (HbA1c) in diabetes show higher success rates.
Oncology is a particularly challenging disease area in which to achieve phase 3 suc-cess. The FDA requires overall survival as the primary endpoint in most pivotal oncology studies. Crossover designs that allow patients who progress on the comparator arm to cross over and receive the investigational drug, or patients receiving additional approved and experimental salvage therapies, also make it more difficult to design well-controlled phase 3 studies with overall survival as a primary endpoint. Furthermore, current animal mod-els (e.g., xenograft tumor models in mice) can be poor predictors of clinical outcomes in humans. Additionally, recent scientific reports show that certain types of cancer, which were previously thought of as one disease, may actu-ally comprise several subtypes of disease with different etiologies. For example, NSCLC is now considered by many oncologists to be at least ten different mutation-specific diseases, and thus it is not surprising that drugs for NSCLC have one of the lowest LOAs from phase 1 of all oncology indications in Table 7 (ref. 20).
development teams and fewer resources than large pharmaceutical corporations. The past nine-year period has been a time of increased clinical trial cost and complexity for all drug development sponsors, and this likely contrib-utes to the lower success rates than previous periods. In addition, an increasing number of diseases have higher scientific and regulatory hurdles as the standard of care has improved over the past decade. More clinical studies are comparative in nature and published data show clinical trials are more complex today than in previous decades7. The time frame in this study also coincides with the shift toward greater regulatory uncertainty and stronger emphasis on safety at the FDA since the 2004 Vioxx (rofecoxib) recall. For smaller compa-nies, financing challenges in the past several years have also affected development progres-sion decisions. Phase success rates reported in this study are based on transition rates, not necessarily resulting from safety or efficacy data. Transition rates are negatively affected by early development termination due to commercial and regulatory uncertainty as well as economic and portfolio management decisions.
Lower success rates found when analyz-ing all indications likely results from includ-ing nonlead and/or secondary indications. Nonlead development paths have far lower success rates compared with lead programs. One possible explanation is that many com-
panies first develop drugs in lead indications where the strongest scientific rationale and early efficacy signals are found. Lead indica-tions are also often smaller, better-defined patient populations. After initial success in these populations, companies may decide to investigate nonlead indications, which may not have the same scientific support, homog-enous patient population or development and regulatory path as the lead indication. Nonlead success rates are also important to monitor as many of these indications can be moved directly into late-stage trials, where most clinical development costs occur. Furthermore, our research suggests that these late-stage trials for nonlead indications often enroll a greater number of patients than lead indications.
Phase 3 success rates. In Figures 1 and 2, we show that phase 3 success rates are 60% for drugs for all indications, but only around 50% in oncology or cardiology. Such low phase 3 success rates for these diseases are concern-ing as 35% of all R&D spending is now spent on phase 3 development, and phase 3 trials account for 60% of all clinical trial costs3. Some of the low phase 3 rates may be attrib-uted to trial design factors and insufficient communication between sponsors and regu-lators during their end-of-phase-2 meetings. Both oncology and cardiology, for example, now require outcome studies looking for
Table 8 Phase success and LOA for neurology and autoimmune diseases (broken further into rheumatoid arthritis and type II diabetes)Phase 1 to phase 2 Phase 2 to phase 3 Phase 3 to NDA/BLA NDA/BLA to approval
Total in phasea
Advanced or sus-
pendedbPhase
successcPhase LOAd
Total in phasea
Advanced or sus-
pendedbPhase
successcPhase LOAd
Total in phasea
Advanced or sus-
pendedbPhase
successcPhase LOAd
Total in phasea
Advanced or sus-
pendedbPhase
successcPhase LOAd
All indications 2,541 1,918 64.5% 10.4% 3,743 2,268 32.4% 16.2% 1,554 975 60.1% 50.0% 908 659 83.2% 83.2%
Total neurology 389 298 62.4% 9.4% 520 348 30.2% 15.0% 285 188 60.6% 49.9% 192 152 82.2% 82.2%
Psychiatric disease 97 80 60.0% 7.2% 148 116 23.3% 12.0% 83 49 63.3% 51.6% 57 49 81.6% 81.6%
Pain 96 73 67.1% 10.7% 113 79 27.8% 15.9% 67 46 67.4% 57.2% 42 33 84.8% 84.8%
Other 196 136 58.8% 9.8% 259 153 36.6% 16.7% 135 93 55.9% 45.5% 93 70 81.4% 81.4%
Total autoimmune disease
241 178 68.0% 12.7% 350 215 34.0% 18.7% 149 95 68.4% 55.0% 88 61 80.3% 80.3%
Total autoimmune disease NMEs
111 88 62.5% 5.2% 151 86 22.1% 8.3% 38 20 50.0% 37.5% 16 8 75.0% 75.0%
Total autoimmune disease biologics
116 80 73.8% 22.5% 171 111 45.0% 30.5% 89 56 75.0% 67.7% 53 41 90.2% 90.2%
Total autoimmune disease non-NMEs
10 8 87.5% 7.9% 22 16 25.0% 9.0% 21 18 72.2% 36.1% 18 12 50.0% 50.0%
Total rheumatoid arthritis
65 54 74.1% 10.3% 102 63 15.9% 13.9% 18 8 87.5% 87.5% 10 5 100.0% 100.0%
Rheumatoid arthritis NMEs
30 29 69.0% NA 46 29 10.3% NA 4 1 100.0% NA 2 0 NA NA
Rheumatoid arthritis biologics
32 24 79.2% 15.9% 49 29 24.1% 20.1% 13 6 83.3% 83.3% 7 5 100.0% 100.0%
Total type II diabetes 110 89 60.7% 9.3% 128 84 29.8% 15.3% 53 37 59.5% 51.4% 31 22 86.4% 86.4%
Diabetes NMEs 83 68 63.2% 7.5% 100 69 29.0% 11.8% 35 25 56.0% 40.7% 15 11 72.7% 72.7%
aNumber of indications identified. bNumber of transitions used to calculate the success rate, the n value noted in the text. The difference between ‘Total in phase’ and ‘Advanced or suspended’ is the number of indications that remain in development. cProbability of successfully advancing to the next phase. dProbability of FDA approval for drugs in this phase of development. NA, data not available.
F EATUREnp
g©
2014
Nat
ure
Am
eric
a, In
c. A
ll rig
hts
rese
rved
.

50 volume 32 NumBeR 1 JANuARY 2014 nature biotechnology
Clinical trials targeting heterogeneous patient populations may have lower suc-cess rates than trials identifying respond-ers within a population through the use of biomarkers. As predictability of clini-cal outcomes increases through the use of molecular diagnostics in earlier testing, it is possible that phase 3 trial success rates will rise. Furthermore, the adoption of adaptive trial design may facilitate the identification of targeted subsets of patient populations before study completion. According to the FDA’s draft guidance for industry, issued in February 2010, adaptive trial design may make clinical studies more efficient (e.g., shorter duration and fewer patients), more likely to demonstrate an effect of the drug or more informative (e.g., providing broader dose-response information)21.
Root causes of phase 3 and NDA/BLA development failures. To gain a better understanding of the causes that lead com-panies to discontinue drug development, we further analyzed publically available infor-mation for the 359 phase 3 and 95 NDA/BLA suspensions included in this study. We classified each discontinued development program into four categories based on the primary reason for suspension including: efficacy, safety, commercial and unknown (Fig. 4).
Although it was difficult to objectively determine if a phase 3 study did not reach an endpoint due to poor study design or the drug’s biological activity, we found that over half of the 359 suspensions were attribut-able to some measure of efficacy. Indeed, a detailed analysis of the specific inputs, ratio-nale and history for each program would be needed to identify issues related to poor trial design. Furthermore, public informa-tion is not available to assess the degree of communication with regulators, adherence to recommendations, changes to prior stan-dards and input from phase 2 data that would inform the design of a phase 3 study.
We found that 18% of the phase 3 suspen-sions resulted from a company’s commercial decision to not file for approval. We do not know the degree to which regulatory uncer-tainty factored into these decisions, but recognize its important impact on portfo-lio management, funding and commercial opportunities due to the increased time and costs of drug development.
Safety was the least likely cause for suspen-sion in phase 3 (9%), perhaps due to signifi-cant adverse events identified earlier in drug development. Approximately 20% of the sus-pensions occurred without publicly available information citing the reason for failure.
We also analyzed the 95 suspended NDA/BLA filings in the data set and found that approximately one-third of failures were attributable to safety concerns raised by regulators compared to only 9% in phase 3. Our analysis also revealed that around half involved cases where the FDA requested additional trials. One interpretation of these data is that sponsors file for regulatory approval believing their drug meets safety guidelines, whereas regulators remain con-cerned about safety, illustrating insufficient communication between regulators and sponsors. During the period of this study, mainly after the 2004 Vioxx recall, many industry observers have discussed how the benefit-to-risk pendulum has swung toward risk, with a greater focus on safety in the reg-ulatory assessment. Some examples of issues brought forward by regulators were the need for longer-term data, inclusion of additional study arms, inclusion of different patient age and at-risk populations, and increases in the number of patients studied.
Further analysis of failures by lead or non-lead indication, disease, modality and com-pany type were not performed because the small sample size has limitations and subjects the results to molecular and therapeutic class–specific issues. Future studies will allow us to identify trends in failed clinical programs as the sample size becomes more reliable.
ConclusionsThe data presented in this study suggest industry-wide productivity may have declined from previous estimates. Achieving FDA approval for only one-in-ten drug indications that enter the clinic is a concerning statistic for drug developers, regulators, investors and patients. We believe progress in clinical sci-ence and regulatory risk-benefit assessment can improve success rates. Greater flexibil-ity with alternative surrogate endpoints, the utilization of adaptive clinical trial design and improved methodologies for assessing patient benefit-to-risk are some areas where improvements can be made. In addition, improvements in communication between sponsors and regulators could help reduce regulatory applications that lack safety or efficacy data that are later requested by regu-lators. Simultaneously, improvements in basic science can enable improvements in success rates. For example, more predictive animal models, earlier toxicology evaluation, bio-marker identification and new targeted deliv-ery technologies may increase future success in the clinic.
ACKNOWLEDGMENTSThis research was supported by Sagient Research Systems and the Biotechnology Industry Organization (BIO). The authors are indebted to the analysts at BioMedTracker who have collected these data. We would also like to thank our colleagues at BIO and BioMedTracker for their input and advice in the development of this study. The authors are solely responsible for the design, conduct and analysis of the study, and the conclusions that are drawn. The opinions expressed in this article are those of the authors and do not necessarily reflect the views of their employers.
AuTHOR CONTRibuTiONSM.H., D.W.T. and J.L.C. all contributed equally to this work.
COMPETiNG FiNANCiAL iNTERESTS The authors declare competing financial interests: details are available in the online version of the paper (doi:10.1038/nbt.2786).
1. Lloyd, I., ed. Citeline Drug Intelligence. Pharma R&D Annual Review 2011. http://www.citeline.com/
Table 9 Phase success and LOA for drugs receiving a FDA SPA or orphan drug designationPhase 1 to phase 2 Phase 2 to phase 3 Phase 3 to NDA/BLA NDA/BLA to approval
Total in phasea
Advanced or sus-
pendedbPhase
successcPhase LOAd
Total in phasea
Advanced or sus-
pendedbPhase
successcPhase LOAd
Total in phasea
Advanced or sus-
pendedbPhase
successcPhase LOAd
Total in phasea
Advanced or sus-
pendedbPhase
successcPhase LOAd
All indications 2,541 1,918 64.5% 10.4% 3,743 2268 32.4% 16.2% 1,554 975 60.1% 50.0% 908 659 83.2% 83.2%
Total SPAs 42 35 97.1% 45.4% 128 115 97.4% 46.7% 171 110 60.0% 48.0% 73 45 80.0% 80.0%
Total orphans 170 136 86.8% 32.9% 328 190 70.0% 37.9% 237 148 66.9% 54.2% 136 84 81.0% 81.0%
Orphan oncology 85 67 85.1% 23.0% 176 105 61.0% 27.1% 102 63 58.7% 44.4% 54 37 75.7% 75.7%
Orphan non-oncology 85 69 88.4% 44.5% 152 85 81.2% 50.4% 135 85 72.9% 62.1% 82 47 85.1% 85.1%
aNumber of indications identified. bTotal number of transitions used to calculate the success rate, the n value noted in the text. The difference between ‘Total in phase’ and ‘Advanced or suspended’ is the number of indications that remain in development. cProbability of successfully advancing to the next phase. dProbability of FDA approval for drugs in this phase of development.
F EATUREnp
g©
2014
Nat
ure
Am
eric
a, In
c. A
ll rig
hts
rese
rved
.
nature biotechnology volume 32 NumBeR 1 JANuARY 2014 51
of Research on New Molecular Entities Commencing Clinical Research in the Years 1976–79 (OPE Study 77). (Office of Planning and Evaluation, US Food and Drug Administration, Rockville, MD, 1988).
16. DiMasi, J.A. Success rates for new drugs entering clini-cal testing in the United States. Clin. Pharmacol. Ther. 58, 1–14 (1995).
17. DiMasi, J.A. Risks in new drug development: approval success rates for investigational drugs. Clin. Pharmacol. Ther. 69, 297–307 (2001).
18. DiMasi, J.A., Hansen, R.W. & Grabowski, H.G. The price of innovation: new estimates of drug development costs. J. Health Econ. 22, 151–185 (2003).
19. DiMasi, J.A. & Grabowski, H.G. The cost of biophar-maceutical R&D: is biotech different? Manag. Decis. Econ. 28, 469–479 (2007).
20. Edelman, M.J. in 2010 American Society of Clinical Oncology (ASCO) Annual Meeting (Chicago, IL; 2010).
21. FDA. Guidance for Industry: Adaptive Design Clinical Trials for Drugs and Biologics. http://www.fda.gov/downloads/drugs/guidancecomplianceregulatoryinfor-mation/guidances/ucm201790.pdf (FDA, Center for Drug Evaluation and Research, Center for Biologics Evaluation and Research, 2010).
9. Abrantes-Metz, R., Adams, C. & Metz, A. Pharmaceutical Development Phases: A Duration Analysis. Working paper no. 274. http://www.ftc.gov/be/workpapers/wp274.pdf (US Federal Trade Commission: Bureau of Economics, 2004).
10. Henderson, R. & Cockburn, I. Scale, scope, and spill-overs: the determinants of research productivity in drug discovery. Rand J. Econ. 27, 32–59 (1996).
11. Cockburn, I.M. & Henderson, R.M. Scale and scope in drug development: unpacking the advantages of size in pharmaceutical research. J. Health Econ. 20, 1033–1057 (2001).
12. Danzon, P.M., Nicholson, S. & Pereira, N.S. Productivity in pharmaceutical–biotechnology R&D: the role of experience and alliances. J. Health Econ. 24, 317–339 (2005).
13. Arora, A., Gambardella, A., Magazzini, L. & Pammolli, F. A breath of fresh air? Firm type, scale, scope, and selection effects in drug development. Manage. Sci. 55, 1638–1653 (2009).
14. Sheck, L. et al. Success rates in the United States drug development system. Clin. Pharmacol. Ther. 36, 574–583 (1984).
15. Tucker, S.A., Blozan, C. & Coppinger, P. The Outcome
wp-content/uploads/Citleine-Pharma-RD-annual-review-20111.pdf (Citeline Drug Intelligence, 2012).
2. EvaluatePharma. World Preview 2018: Embracing the Patent Cliff. http://info.evaluatepharma.com/WP2018_ELS_LP.html (2012).
3. Pharmaceutical Research and Manufacturers of America. Annual Report 2011. http://www.phrma.org/sites/default/files/159/phrma_2011_annual_report.pdf (2011).
4. Mullard, A. 2012 FDA drug approvals. Nat. Rev. Drug Discov. 12, 87–90 (2013).
5. Cohen, F.J. Macro trends in pharmaceutical innova-tion. Nat. Rev. Drug Discov. 4, 78–84 (2005).
6. DiMasi, J.A., Feldman, L., Seckler, A. & Wilson, A. Trends in risks associated with new drug develop-ment: success rates for investigational drugs. Clin. Pharmacol. Ther. 87, 272–277 (2010).
7. Kaitin, K.I. & DiMasi, J.A. Pharmaceutical innova-tion in the 21st century: new drug approvals in the first decade, 2000–2009. Clin. Pharmacol. Ther. 89, 183–188 (2011).
8. Kola, I. & Landis, J. Can the pharmaceutical indus-try reduce attrition rates? Nat. Rev. Drug Discov. 3, 711–715 (2004).
F EATUREnp
g©
2014
Nat
ure
Am
eric
a, In
c. A
ll rig
hts
rese
rved
.