Embed Size (px)
Citation preview

Clinical Applications of Risk Prediction Models
Laura Esserman, M.D., M.B.A.Laura Esserman, M.D., M.B.A.Professor of Surgery and RadiologyProfessor of Surgery and Radiology
Director, UCSF Carol Franc Buck Breast Care CenterDirector, UCSF Carol Franc Buck Breast Care Center

Agenda
•Current Clinical Climate for Prevention
•Potential for Risk Tools to Refine Risk, motivate interventions
•Framework for Decision Aids: the need for tools that provide information in a decision ready context
•How risk models can be integrated into clinical consultations
•Insights from using decision aids, models

Current Clinical Decision Making
Calculate 5-year
Gail Risk
Gail Risk Below 1.67%
Screening
80-95% choose screening
Offered Tamoxifen
(50% risk reduction)
Gail Risk Above 1.67%
5-20% take Tamoxifen
Rush-Port, Vogel et al.

The Gail Model Does Not Identify a Truly High Risk Group of Women
4%14%
33%
65%
90%
44%
0%
25%
50%
75%
100%
45-49 50-54 55-59 60-65 65-70 All Ages
Rockhill et al.
Percent of Nurses Health Study Above the High-Risk Cutoff Point(5 yr Gail Score of 1.67%)
The Gail Model Does Not I dentif y a Truly High Risk Group of Women
4%14%
33%
65%
90%
44%
0%
25%
50%
75%
100%
45-49 50-54 55-59 60-65 65-70 All Ages
Rockhill et al.
Percent of Nurses Health Study Above the High-Risk Cutoff Point(5 yr Gail Score of 1.67%)

What should compel Providers to be concerned with preventionAge and Competing Causes of Death
0
10
20
30
40
50
60
Age
Per
cen
t of
All
Dea
ths
Cardiovascular
Breast Cancer
Lung Cancer
Phillips, et al, NEJM, Vol. 340, No. 2, 1999

High Risk Patients Don’t Choose Tamoxifen
2/43 high risk patients chose to take Tamoxifen for breast cancer prevention
Educational sessions had no influence
Fear of side effects
*Rush Port E, et al Ann Surg Oncol, Vol.8, No. 7, 2001

Decision Making in the Clinical SettingBreast Cancer Prevention Decisions are complex
Uncertainty about Outcomes
Dis
agre
emen
t on
Pre
fere
nces
High
High
Low
Chaos Chaos
Low
Zone of ComplexityZone of Complexity
Order Order
Uncertainty about Outcomes
Dis
agre
emen
t on
Pre
fere
nces
High
High
Low
Chaos Chaos
Low
Zone of ComplexityZone of Complexity
Order Order

What compels women at high risk to consider an
intervention?
1. Evidence that their risk is significant compared to others
2. Evidence that there is an intervention that will help THEM specifically
3. Evidence that the intervention will not have significant side effects
4. Evidence that the intervention is working

Improving the signal-to-noise ratio
Decision AnalysisDecision aid strives to provide the basic elements of a decision: frame,
alternatives, information, preferences and logic
Adult LearningDecision aids should let women choose what they want to learn
– What are people ready to receive? – Layers of complexity (start simple, detail is optional)
Cognitive Science (Tufte)Decision aid should use graphical formats that require the least amount of
cognitive processing – Train people on small number of formats, stick to them
Risk CommunicationRelative risk presentations are confusing, misleading, and bias patients toward
intervention

Clinically Accessible Biomarkers
Biomarkers Risk Discrimination
Detection Tool
Cost Targeted intervention
Atypia ++ rFNADuctal LavageOpen Bx
+++++++
+Tamoxifen, ?AIs
Breast Density
++/+++ MammoMRI
+++++
?Soy, Tam?
Serum Estradiol
+ Blood Test ++ Tamoxifen, Raloxifen
Serum Testosterone
+ Blood Test ++ Tamoxifen, Raloxifen
LCIS ++ BxMRI
+++++
+Tam
DCIS +++ MammoMRI, Bx
+++++
? Tam ?AI ?Statins ?IGFR1 ?
BRCA 1,2 mutations
++++ Blood Test +++ Propylactic surgery,Tam (BRCA2), oophorectomy

Anna Bella Smith Main5yr Gail Score: 2.1%Lifetime Gail Score: 17.3%
Prevention Decision ModelCarol Franc Buck Breast Care Center | UCSF Medical Center
©20
02
Elissa Ozanne, Laura Esserman

Anna Bella Smith Main5yr Gail Score: 2.1%Lifetime Gail Score: 17.3%
How does my risk compare to other women?
Tests to learn more about breast cancer risks
and benefits of therapiesWhat can I do to lower my risk?
What is my risk of breast cancer?
Learning About Your Risk Getting Perspective
Prevention Options Risks and Benefits
Anna Bella Smith Main5yr Gail Score: 2.1%Lifetime Gail Score: 17.3%
Prevention Decision Model :
Learning About Your Risk: What is my risk of breast cancer?
Next

Anna Bella Smith 4Main5yr Gail Score: 2.1%Lifetime Gail Score: 17.3%
Prevention Decision Model : Learning About Your Risk
Sou
rce:
Fis
her
B,
et
al,
JNC
I, v
ol 9
0,
No.
18
, 1
99
8
My Breast Cancer Risk Over Time
Next
9.7%By age 79
6.5%By age 69
2.7%By age 59
NABy age 49
NABy age 39
Claus Risk
17.3%Lifetime
2.1%5 year
Gail Risk
PostMenopausal Status
noneNumber of years of HRT usage
51Age
Anna Bella SmithGAI L MODEL:
The Gail Risk Assessment Model is a
statistical model for estimating the risk
of developing breast cancer in women
undergoing annual screening.This tool
was developed to assist in providing
women with a realistic and
individualized risk estimate of short
and long term breast cancer risk.
CLAUS MODEL:
The Claus model estimates the
probability that a woman will develop
breast cancer based on her family
history of cancer. This includes the
number of first and second-degree
relatives with breast cancer and the
age of cancer onset.

Anna Bella Smith Main5yr Gail Score: 2.1%Lifetime Gail Score: 17.3%
Prevention Decision Model :
Getting Perspective:How does my risk compare to other women?
Next
A n n a B e l la S m it h M a i n5 y r G a i l S c o r e : 2 .1 %L if e t im e G a i l S c o r e : 1 7 .3 %
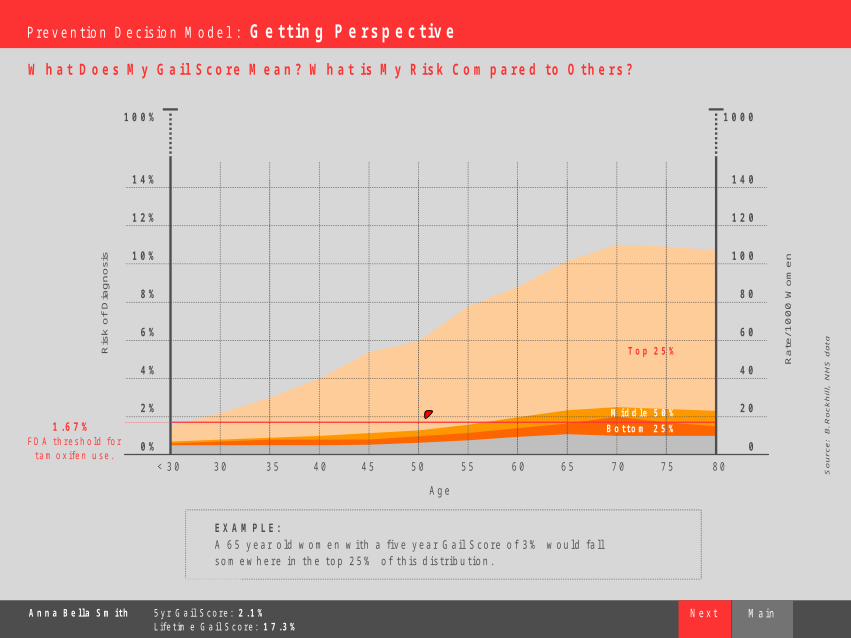
P r e v e n t io n D e c i s i o n M o d e l : G e t t in g P e r s p e c t iv e
So
urc
e:
B.R
ock
hill
, N
HS
da
ta
E X A M P L E :A 6 5 y e a r o l d w o m e n w i t h a fi v e y e a r G a i l S c o r e o f 3 % w o u l d f a l ls o m e w h e r e i n t h e t o p 2 5 % o f t h i s d i s t r i b u t i o n .
0 %
Ris
k o
f D
iag
no
sis
2 %
4 %
6 %
8 %
1 0 %
1 2 %
1 4 %
< 3 0 3 0 3 5 4 0 4 5 5 0 5 5 6 0 6 5 7 0 7 5 8 0
T o p 2 5 %
M id d le 5 0 %
B o t t o m 2 5 %
1 0 0 %
A g e
W h a t D o e s M y G a i l S c o r e M e a n ? W h a t i s M y R i s k C o m p a r e d to O t h e r s ?
N e x t
0
2 0
4 0
6 0
8 0
1 0 0
1 2 0
1 4 0
1 0 0 0
Ra
te/1
00
0 W
om
en
1 .6 7 %F D A t h r e s h o ld f o r
t a m o x if e n u s e .

Anna Bella Smith 19Main5yr Gail Score: 2.1%Lifetime Gail Score: 17.3%
Average Risk of Breast Cancer Diagnosis for Women (Age 50~60)
40%
30%
20%
10%
0
Avg.
Ris
k o
f B
C D
iagn
osi
s
50%
60%
70%
100%
80%
90%
Prevention Decision Model : Getting Perspective
Within 10 yrs
2.8%
Within 20 yrs
6.2%
Within 30 yrs
9.6%
Lifetime Risk
12.0%
30~40 40~50 50~60 60~70|20~30 | NextPrev
Sou
rce:
Su
rvei
llance
, E
pid
em
iolo
gy,
an
d E
nd R
esu
lts
(SEE
R)
Can
cer
Sta
tist
ics
Rev
iew
19
73
-1
99
8.
400
300
200
100
0
500
600
900
1000
Rate
/10
00
wom
en
700
800
Anna Bella Smith 20Main5yr Gail Score: 2.1%Lifetime Gail Score: 17.3%
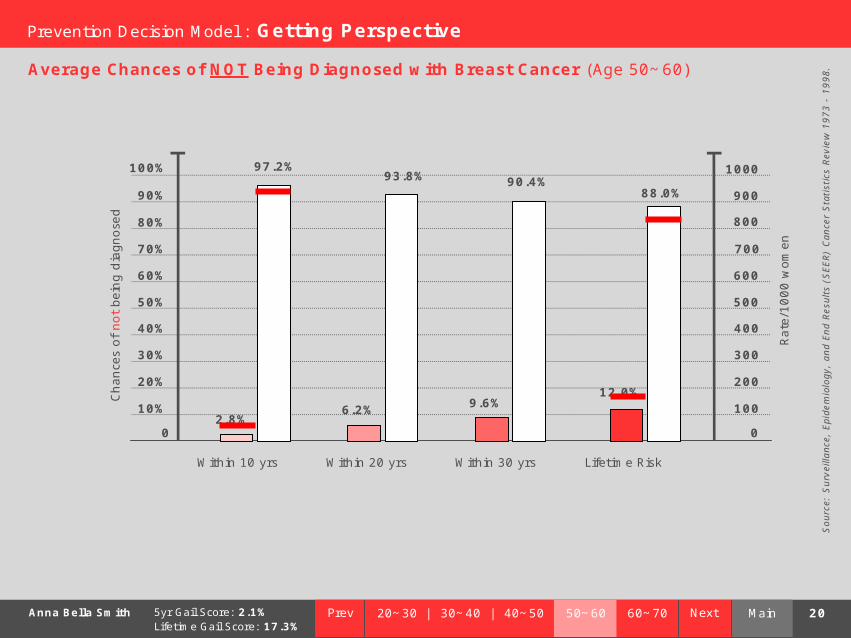
Average Chances of NOT Being Diagnosed with Breast Cancer (Age 50~60)
40%
30%
20%
10%
0
Ch
an
ces
of
not
bein
g d
iagn
ose
d
50%
60%
70%
100%
80%
90%
Prevention Decision Model : Getting Perspective
Within 10 yrs
97.2%
Within 20 yrs
93.8%
Within 30 yrs
90.4%
Lifetime Risk
88.0%
30~40 40~50 50~60 60~70|20~30 | NextPrev
Sou
rce:
Su
rvei
llance
, E
pid
em
iolo
gy,
an
d E
nd R
esu
lts
(SEE
R)
Can
cer
Sta
tist
ics
Rev
iew
19
73
-1
99
8.
400
300
200
100
0
500
600
900
1000
Rate
/10
00
wom
en
700
800
2.8%6.2%
9.6%12.0%

Anna Bella Smith 21Main5yr Gail Score: 2.1%Lifetime Gail Score: 17.3%
Prevention Decision Model : Getting Perspective
I n the next ten years, an average 50 year old woman has…
Next
Sou
rce:
Jou
rnal
of
the N
ati
onal C
ance
r In
stit
ute
, V
ol.
94
, N
o.
11
, Ju
ne 5
, 2
00
2.
30~40 40~50 50~60 60~70|20~30 |Prev
0.4 ~ 1.4%Heart Attack
38%Visit the doctor about the flu
8%Injured in an automobile accident
1 ~ 2%Increase in breast cancer for each year of HRT use
Other Risks this year alone:
0.2%Accidents
0.1 ~ 0.2%Pneumonia (smoker)
0.2 ~ 0.5%Lung Cancer (non-smoker)
2.1 ~ 6.5%Lung Cancer (smoker)
0.5 ~ 0.7%Breast Cancer
Risk of Death from:
2.8%Breast Cancer
Risk of Diagnosis from:
4.2
0.75-1.0%
Lifestyle Changes Chemoprevention Surgery
Prevention Decision Model :
Prevention Options: What can I do to lower my risk?
Next
Lifestyle Changes
Sourc
e:
Ross
D, 2
3rd
an
nual San A
nto
nio
Bre
ast
Cance
r S
ym
posi
um
, 2
000
: S
um
mary
by P
ritc
hard
, K
I V
ogel V
G, C
ance
r Jo
urn
al fo
r C
linic
ians,
V
ol.
50
, N
o. 3
, 2
00
0
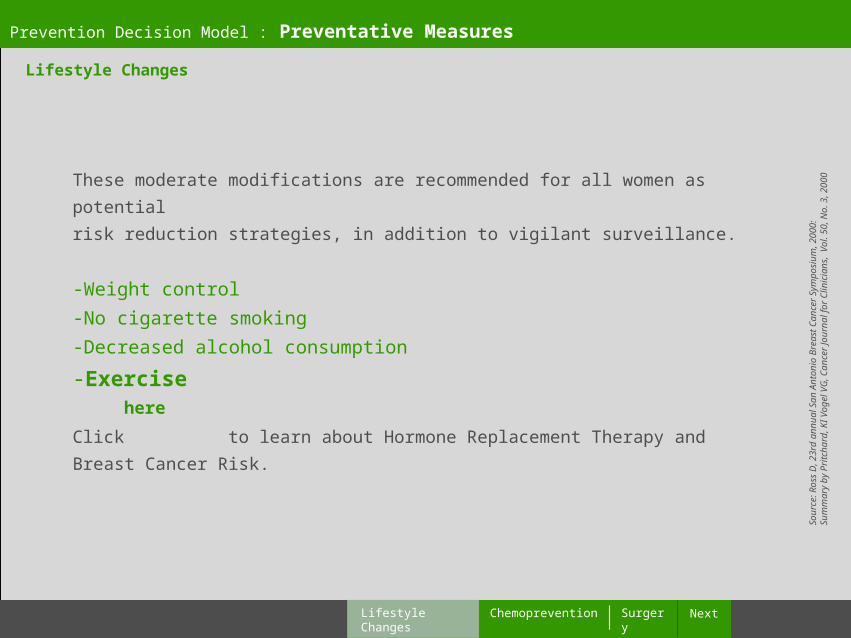
These moderate modifications are recommended for all women as potential
risk reduction strategies, in addition to vigilant surveillance.
-Weight control
-No cigarette smoking
-Decreased alcohol consumption
-Exercise
Click to learn about Hormone Replacement Therapy and
Breast Cancer Risk.
Prevention Decision Model : Preventative Measures
Lifestyle Changes Chemoprevention Surgery Next
here

InvasiveBreast Cancer
0
Rate
/10
00
Placebo
Tamoxifen
Chemoprevention
Sourc
e:
Gail,
et
al, JN
CI, v
ol 91
, N
o. 3
, 1
99
9
50
100
150
200
Non-InvasiveBreast Cancer
Vascular EventsFractures EndometrialCancer
0%
5%
10%
15%
20%
1000 100%
Benefits Risks
Lifestyle Changes Surgery Next
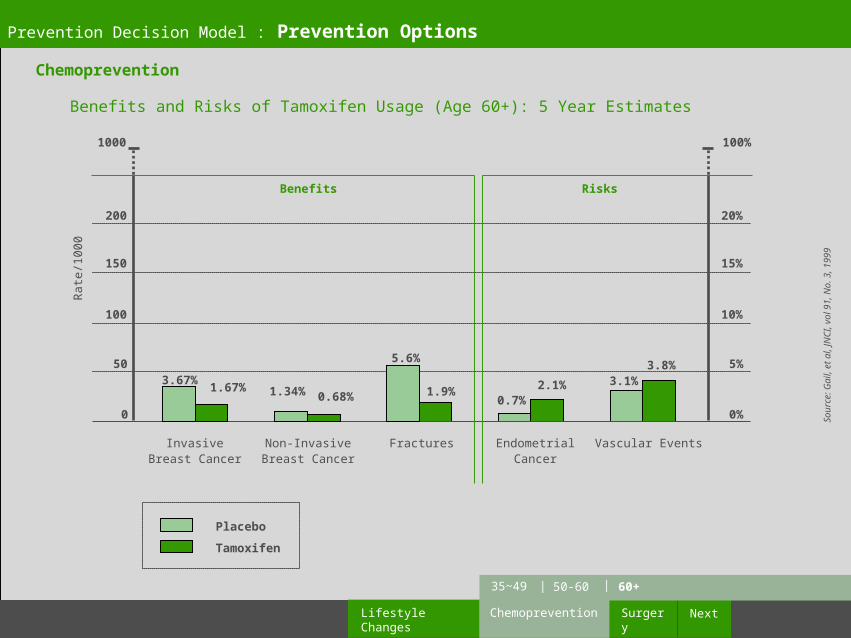
Prevention Decision Model : Prevention Options
Chemoprevention
50-6035~49 |
3.35% 1.89% 1.34% 0.68%0.36% 0.14% 0.07% 0.11% 0.36% 0.45%
Benefits and Risks of Tamoxifen Usage (Ages 35~49): 5 Year Estimates
60+|

InvasiveBreast Cancer
0
Chemoprevention
100%
Vascular EventsFractures EndometrialCancer
0%
5%
10%
15%
20%
Benefits Risks
Lifestyle Changes Surgery Next
Prevention Decision Model : Prevention Options
Chemoprevention
Placebo
Tamoxifen
3.1%1.6% 1.9% 0.6%
0.4% 1.2% 1.0% 1. 1%
Benefits and Risks of Tamoxifen Usage (Age 50-60): 5 Year Estimates
Sourc
e:
Gail,
et
al, JN
CI, v
ol 91
, N
o. 3
, 1
99
9
|35~49 50-60 60+|
Rate
/10
00
50
100
150
200
1000
Non-InvasiveBreast Cancer
1.34% 0.68%
InvasiveBreast Cancer
0
Chemoprevention
100%
Vascular EventsFractures EndometrialCancer
0%
5%
10%
15%
20%
Benefits Risks
Lifestyle Changes Surgery Next
Prevention Decision Model : Prevention Options
Chemoprevention
Placebo
Tamoxifen
3.67%1.67%
5.6%
1.9%0.7%
2.1% 3.1%3.8%
Benefits and Risks of Tamoxifen Usage (Age 60+): 5 Year Estimates
Sourc
e:
Gail,
et
al, JN
CI, v
ol 91
, N
o. 3
, 1
99
9
|35~49 50-60 60+|
Rate
/10
00
50
100
150
200
1000
Non-InvasiveBreast Cancer
1.34% 0.68%

GeneticTesting
Ductal Lavage andFine Needle Aspiration
SerumEstradiol
Prevention Decision Model :
Risks and Benefits:
Next
Tests to learn more about breast cancer risks and benefits of therapies

Ductal Lavage and Fine Needle Aspiration
Sourc
e:
Fish
er
B, et
al, JN
CI, V
ol 90
, N
o. 1
8, 19
98
Expected Breast Cancer Risk Over Five Years
Placebo
Tamoxifen
Prevention Decision Model : Risks and Benefits
Next
All Women
3.4%1.7%
Atypical Hyperplasia
5.1%
0.7%0%
5%
10%
15%
20%
100%
0
50
100
150
200
1000
Rate
/10
00
Wom
en
50% relative risk reduction with tamoxifen
86% relative risk reduction with tamoxifen
SerumEstradiol
Ductal Lavage andFine Needle Aspiration
Sh
ort
term
(~
5 y
r) R
isk
of
Bre
ast
Can
cer
Women on tamoxifen had about 50% of the number
of breast cancers seen in the placebo group –
50% relative risk reduction.
The absolute benefit is smaller - only 3.4% high-risk
women are expected to develop breast cancer as
compared to 1.7% in women using tamoxifen – 1.7%
absolute risk reduction over 5 years.
Women with atypical hyperplasia on
tamoxifen had about 14% of the number
of breast cancers seen in the placebo
group – 86% relative risk reduction.
The absolute risk decreased from an
expected 5.1% to 0.7% - a 4.4% absolute
risk reduction over 5 years.
Atypical Hyperplasia Predicts Benefit from Tamoxifen
GeneticTesting

Ductal Lavage and Fine Needle Aspiration
Sourc
e:
Saute
r, 1
99
7;
Fabia
n C
J, e
t al, JN
CI V
ol.
92
, N
o. 1
5, 20
00
Prevention Decision Model : Risks and Benefits
SerumEstradiol
NextDuctal Lavage andFine Needle Aspiration
Lowest risk groupFor women with 5 yr Gail risk less than 2%, risk decreases to below 1% over 3 years for both women with AH and no AH.
Middle risk groupFor women with 5 yr Gail risk greater than 2% but with no AH, risk is about 4% in 3 years.
Highest risk groupFor women with 5yr Gail risk is greater than 2% with the presence of AH, risk is about 15% in 3 years.
Sh
ort
term
(~
3yr)
Ris
kof
Bre
ast
Can
cer
5 yr Gail Score > 2%5 yr Gail Score < 2%
0%
5%
10%
15%
20%
100%
No Atypia
Atypia
LowestRisk
Group0%
MiddleRisk
Group4%
HighestRisk
Group15%
0
50
100
150
200
1000
Rate
/10
00
Wom
en
Learning from Atypical Hyperplasia (AH)
GeneticTesting
Fabian JNCI 2001

Ductal Lavage and Fine Needle Aspiration
Sourc
e:
Saute
r, 1
99
7;
Fabia
n C
J, e
t al, JN
CI V
ol.
92
, N
o. 1
5, 20
00
Prevention Decision Model : Risks and Benefits
SerumEstradiol
NextDuctal Lavage andFine Needle Aspiration
Sh
ort
term
(~
3yr)
Ris
kof
Bre
ast
Can
cer
Middle Risk Group5 yr Gail Score > 2%
No finding of AH
Lowest Risk Group5 yr Gail Score < 2%
Independent of AH findings
0%
5%
10%
15%
20%
100%
Each Less than 1% 4%
15%
0
50
100
150
200
1000
Rate
/10
00
Wom
en
Atypical Hyperplasia and the Benefit from Tamoxifen
Highest Risk Group5 yr Gail Score > 2%
Finding of AH
No Treatment
50% Risk Relative Reduction with Tamoxifen Use
86% Risk Relative Reduction with Tamoxifen Use
2.1%2%
GeneticTesting

Serum Estradiol
Sourc
e:
Cu
mm
ing
s S
. et
al, JA
MA
, 2
87:
22, 20
02
0
Short Term Breast Cancer Risk
>0 to <5 5 to 10 >10
LowestRiskGroup0.6%
HighestRiskGroup3%
Serum Estradiol Level (pmol/L)
Prevention Decision Model : Risks and Benefits
Ductal Lavage andFine Needle Aspiration
Next
1.2% 1.8%
Sh
ort
term
(~
4yr)
Ris
kof
Bre
ast
Can
cer
0%
5%
10%
15%
20%
100%
0
50
100
150
200
1000
Rate
/10
00
Wom
en
SerumEstradiol
Women with the highest estradiol level had about a three fold risk of breast cancer
as compared to the women with the lowest estradiol level.
Higher hormone levels in the blood are associated with a higher risk of breast cancer.
Learning From Serum Estradiol Level: Postmenopausal Women
GeneticTesting

Serum Estradiol
Sourc
e:
Cu
mm
ing
s S
. et
al, JA
MA
, 2
87:
22, 20
02
76% relativerisk reductionFrom Raloxifen
Placebo
Raloxifene
Prevention Decision Model : Risks and Benefits
Ductal Lavage andFine Needle Aspiration
Next
0
Short Term Breast Cancer Risk
>0 to <5 5 to 10 >10
Serum Estradiol Level (pmol/L)
Sh
ort
term
(~
4yr)
Ris
kof
Bre
ast
Can
cer
0%
5%
10%
15%
20%
100%
0
50
100
150
200
1000
Rate
/10
00
Wom
en
0.6% 0.6%1.2%
0.4%1.8%
0.8%3%
0.7%
SerumEstradiol
Women with the highest estradiol levels on raloxifene had about 24% the number of
breast cancers seen in the placebo group. The absolute risk decreased from 3% to 0.7%.
As hormone levels in the blood is higher, the benefits of raloxifene increase. Side effects
of raloxifene are similar to those of tamoxifen but do not include endometrial events.
Learning From Serum Estradiol Level: Postmenopausal Women
GeneticTesting

Prevention Decision Model : Risks and Benefits
SerumEstradiol
NextDuctal Lavage andFine Needle Aspiration
Genetic Testing
Genetic Testing and the Benefit of Prevention Options
Sourc
e:
AS
CO
Pro
ceed
ing
s 2
00
2
GeneticTesting
Life
tim
e R
isk
of
Bre
ast
Can
cer
Higher Risk EstimateFor Genetic Carriers
Lower Risk EstimateFor Genetic Carriers
0%
20%
40%
60%
80%
100%
50%
0
200
400
600
800
1000
Rate
/10
00
Wom
en
No Treatment
50-70% Relative Risk Reduction from Oophorectomy
90-95% Risk Relative Reduction from Mastectomy
20%
3.75%
85%
34%
6.4%

Insights
There is a critical need for dynamic models that enable us to assess the impact of interventions-
– that is what patients want
Biomarkers that predict effectiveness of interventions will increase willingness/motivation to accept interventions
There is a hierarchy of risk models – e.g. BRCA trumps Gail– Determines impact of and discussion about options,interventions
Risk that motivates patients to choose an intervention:– 10-15% risk at 5 years– Risk of recurrence after surgery for non-comedo DCIS
10-12% at 5 years, 20% risk at 10 years– Maybe DCIS is the best opportunity for prevention?

Cost Benefit ModelElissa Ozanne PhD; Laura Esserman MD MBA
GoalsUnderstand value of biomarkers for breast cancer riskEvaluate cost effectiveness using atypia as an example
MethodsMarkov model, evidence from clinical studies
Strategies Examined:1. 1. Screening: Routine screening (mammography) all women 2. 2. Tamoxifen: Tamoxifen therapy for all women3. 3. Lavage: Attempt lavage, tam use if DL possible and atypia found4. 4. FNA: 4 quadrant FNA all women, tam use only for atypia

Ozanne, Esserman 2004, Cancer Epidemiology and Biomarkers, accepted

•biomarker relative risk prediction increases cost effectiveness• FNA and DL are more CE if atypia is a good predictor
•more effective intervention increases CE • If biomarker predicts more effect of drug, CE increases
• inexpensive tests offer highly cost effective strategies • If it is expensive/painful to get biomarker, treating everyone
is more CE
•inexpensive interventions offer highly cost effective strategies • Expensive effective interventions not very cost effective
Mammography 50-70
Sensitivity

What is the yearly hazard rate for progression to cancer for . . .
Annual Hazard
DCIS 1-3%
Atypia Gail Risk > 2 Gail Risk < 2
4%1%
LCIS family history none
1-2%0.5-1%
BRCA1/2 1-5%
5 yr Gail Risk >5
1-2%
60 yr old Gail <2
0.3-0.5%
CBC for pt with Ca
0.5%
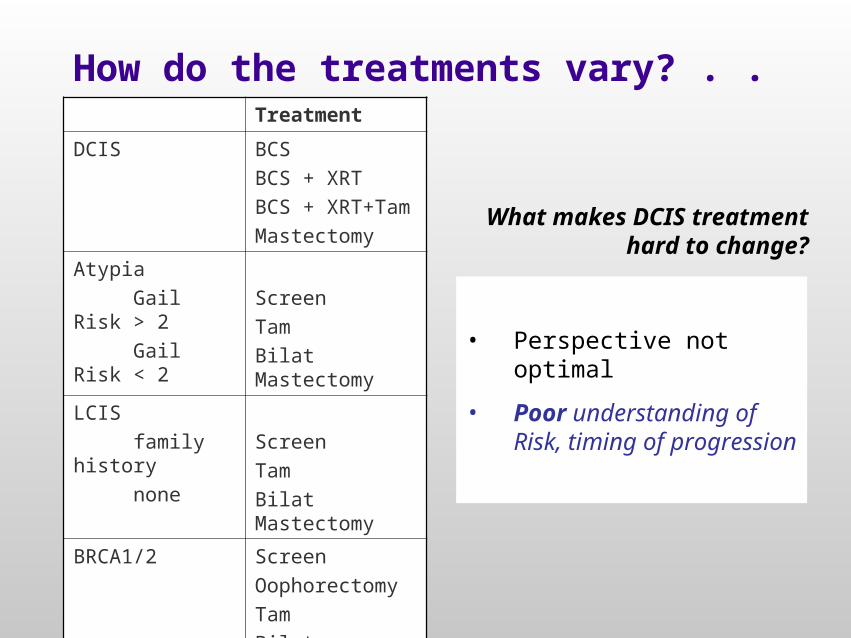
How do the treatments vary? . . .Treatment
DCIS BCSBCS + XRTBCS + XRT+TamMastectomy
Atypia Gail Risk > 2 Gail Risk < 2
ScreenTamBilat Mastectomy
LCIS family history none
ScreenTamBilat Mastectomy
BRCA1/2 ScreenOophorectomyTamBilat Mastectomy
High RiskGail>1.7; Inv Ca
Screen Consider Tam
What makes DCIS treatment hard to
change?
• Perspective not optimal
• Poor understanding of Risk, timing of progression

Prevention ParadigmHigh Risk Conditions
Normal cells
DCIS
Atypia
LCIS
Neoadjuvant Therapy?
Breast Cancer

Improvements
The Prevention Tool we developed is a physician decision aid
evidence is organized using common outcome: Risk at 5,10 years
Patient Physician Aids should include more layering of information
Decisions can be layered by side effects: serious vs. QOL
Trial of tool vs. notdesire for risk stratificationchoice of interventions

Side Effects
Serious
Yes Weigh risk vs benefit
No Review side effects
Trial of medication
Sx No Sx
ContinueWeigh Sx vs. benefits

A Good Decision Aid
Enables insight
Facilitates dialogue among providers, patients, families
Reduces confusion
Motivates change in approach based on personal preferences
Requires models that provide risk in perspective, and enable tailoring of risk based on interventions