Embed Size (px)
Citation preview

Climbing the Prosperity Ladder
A study into social mobility, financial proficiency and digital savviness among 11,000 emerging affluent consumers in China, Hong Kong, India, Indonesia, Kenya, Malaysia, Nigeria, Pakistan, Singapore, South Korea and the UAE.
The rise of the socially mobile in Asia, Africa and the Middle East
Standard Chartered Climbing the Prosperity Ladder Page / 2
Contents Executive summary / 3
The social mobility boom / 4
Better investment for a brighter future / 19
Digital dividends: technology holds the key to financial success / 27
Conclusion / 34
Methodology / 36
Appendix / 37
All figures in this report are represented as percentages, unless otherwise stated.
In charts, due to the rounding of decimal places, displayed figures may not always add up to 100%.
In charts, the average represents the average across the markets in this study.
The methodology can be found at the end of this report.

Standard Chartered Climbing the Prosperity Ladder Page / 3
Executive summaryIn societies with high rates of upward social mobility, people have the chance to carve out a life for themselves and their children that surpasses that of their parents. The number of people climbing the social ladder is slowing in the West1. But we are seeing a new group of people in fast-growing economies in Asia, Africa and the Middle East who are accumulating wealth and rapidly improving their personal wellbeing.
We call this group the ‘emerging affluent’. They have money to spend, save and invest. This is our fourth study of this important consumer group: we believe their economic power represents a significant driver of market growth.
The emerging affluent are creating their own prosperity by achieving more in their education, careers and businesses than their parents did. Digital technology is broadening their access to money management and helping to support their financial wellbeing. But there is still room for the emerging affluent to aspire to, and reach, even more ambitious goals.
As a leading international bank helping clients prosper across Asia, Africa and the Middle East, we want to understand how people maximise opportunities to advance themselves and their children. That includes gaining a better appreciation of their aspirations and the financial tools they need to achieve them.
Our study does just that: it provides fresh insights into the social mobility of the emerging affluent across these regions. It reveals that there is space for improved investment strategies among this group. They want to keep reaching higher through smarter choices but they feel held back by a lack of financial knowledge.
The emerging affluent are on an upward social trajectory and they’re hungry for financial tools and information. They’re helping to fuel growth in some of the world’s most dynamic markets. As they aspire to improve their own lives, they’re contributing to the wellbeing of the communities they live in. It’s an exciting journey and we hope this study sheds more light on their dreams and ambitions.
Ben HungCEO, Retail Banking & Wealth Management
Vishu RamachandranGroup Head, Retail Banking
1 A Broken Social Elevator? How to Promote Social Mobility, OECD, 2018
Standard Chartered Climbing the Prosperity Ladder Page / 4
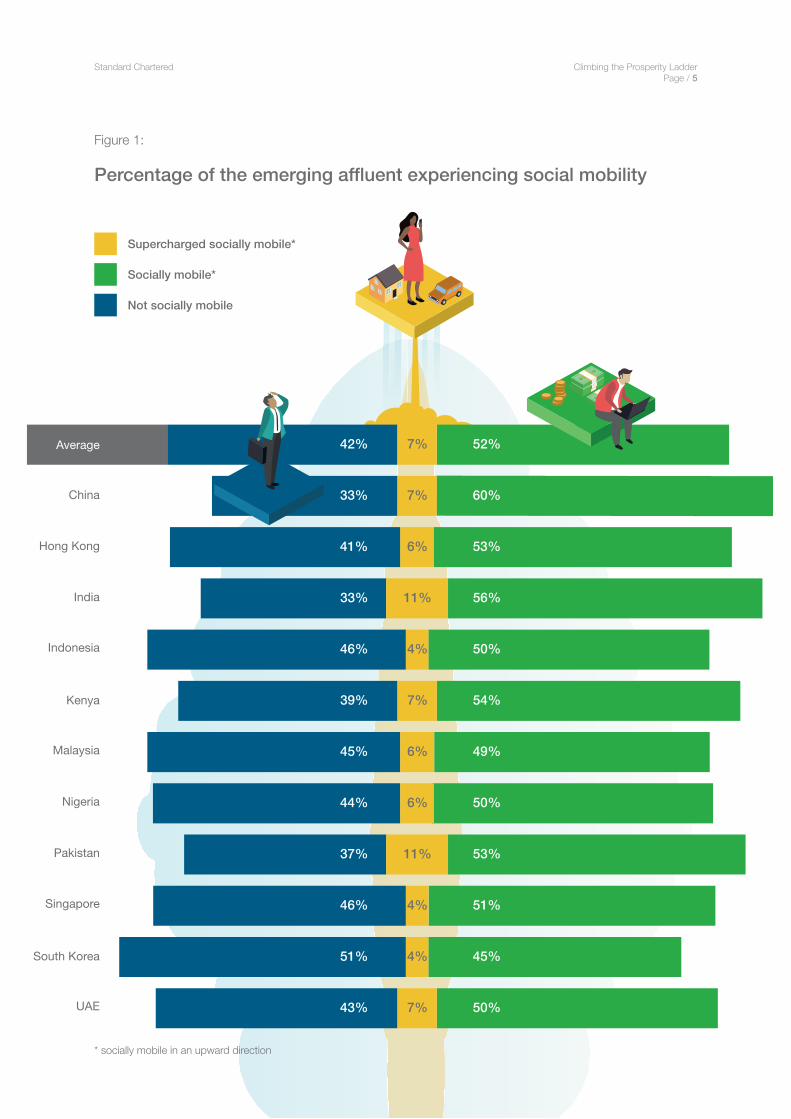
2 This figure includes the total number of the emerging affluent that are experiencing upward social mobility, which comprises the emerging affluent that are positively socially mobile (52%) and the emerging affluent that are experiencing supercharged social mobility (7%)
3 In this report references to the ‘socially mobile’ will refer to those whose social status has moved upwards from that of their parents and whose personal wealth has increased over time. ‘Not socially mobile’ refers to those who have stayed the same or moved downwards
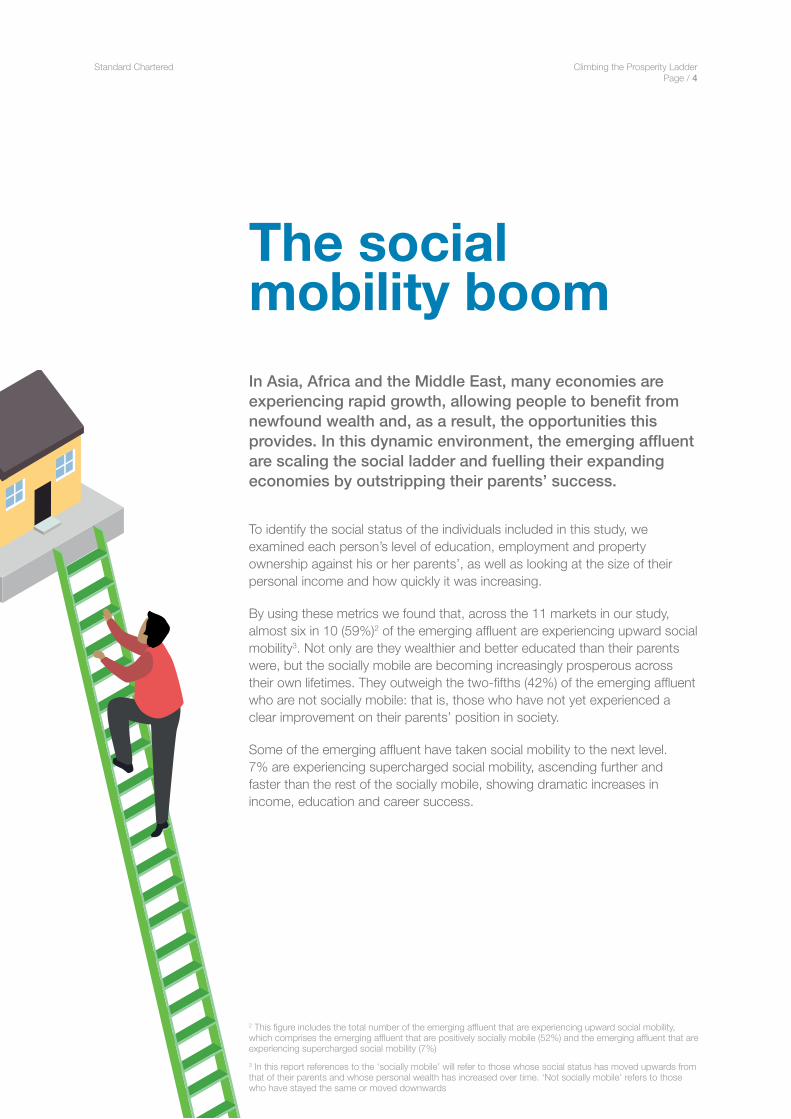
The social mobility boomIn Asia, Africa and the Middle East, many economies are experiencing rapid growth, allowing people to benefit from newfound wealth and, as a result, the opportunities this provides. In this dynamic environment, the emerging affluent are scaling the social ladder and fuelling their expanding economies by outstripping their parents’ success.
To identify the social status of the individuals included in this study, we examined each person’s level of education, employment and property ownership against his or her parents’, as well as looking at the size of their personal income and how quickly it was increasing.
By using these metrics we found that, across the 11 markets in our study, almost six in 10 (59%)2 of the emerging affluent are experiencing upward social mobility3. Not only are they wealthier and better educated than their parents were, but the socially mobile are becoming increasingly prosperous across their own lifetimes. They outweigh the two-fifths (42%) of the emerging affluent who are not socially mobile: that is, those who have not yet experienced a clear improvement on their parents’ position in society.
Some of the emerging affluent have taken social mobility to the next level. 7% are experiencing supercharged social mobility, ascending further and faster than the rest of the socially mobile, showing dramatic increases in income, education and career success.
Standard Chartered Climbing the Prosperity Ladder Page / 5
Average
China
India
Indonesia
Kenya
Malaysia
Nigeria
Pakistan
Singapore
Hong Kong
South Korea
UAE
11% 56%33%
4% 50%46%
7% 54%39%
6% 49%45%
6% 50%44%
11% 53%37%
4% 51%46%
4% 45%51%
7% 50%43%
7% 52%42%
7% 60%33%
6% 53%41%
Figure 1:
Percentage of the emerging affluent experiencing social mobility
* socially mobile in an upward direction
Supercharged socially mobile*
Socially mobile*
Not socially mobile
Standard Chartered Climbing the Prosperity Ladder Page / 6
0
10
20
30
40
50
Average
China
India
Indonesia
Kenya
Malaysia
Nigeria
Pakistan
Singapore
Hong Kong
South Korea
UAE
35% 28%
23% 26%
20% 18%
46% 30%
36% 36%
37% 33%
35% 29%
46% 30%
44% 34%
30% 25%
23% 22%
42% 27%
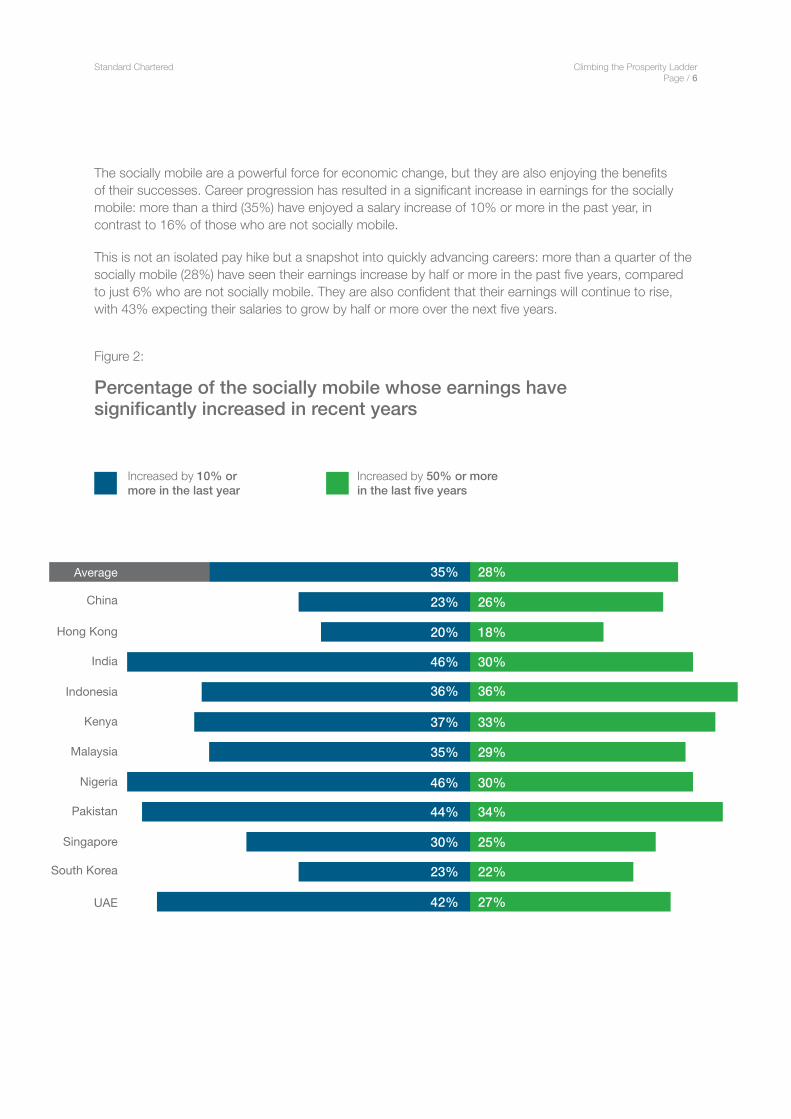
Figure 2:
Percentage of the socially mobile whose earnings have significantly increased in recent years
The socially mobile are a powerful force for economic change, but they are also enjoying the benefits of their successes. Career progression has resulted in a significant increase in earnings for the socially mobile: more than a third (35%) have enjoyed a salary increase of 10% or more in the past year, in contrast to 16% of those who are not socially mobile.
This is not an isolated pay hike but a snapshot into quickly advancing careers: more than a quarter of the socially mobile (28%) have seen their earnings increase by half or more in the past five years, compared to just 6% who are not socially mobile. They are also confident that their earnings will continue to rise, with 43% expecting their salaries to grow by half or more over the next five years.
Increased by 10% or more in the last year
Increased by 50% or more in the last five years
Standard Chartered Climbing the Prosperity Ladder Page / 7
Average
China
India
Indonesia
Kenya
Malaysia
Nigeria
Pakistan
Singapore
Hong Kong
South Korea
UAE
75%
81%
68%
85%61%
71%
75%
79%
74%
83%
28%65%
35%48%
75%
50%51%
34%
31%61%
77%
56%50%
49%43%
39%57%
60%38%
31%
31%26%
41%30%
52%34%
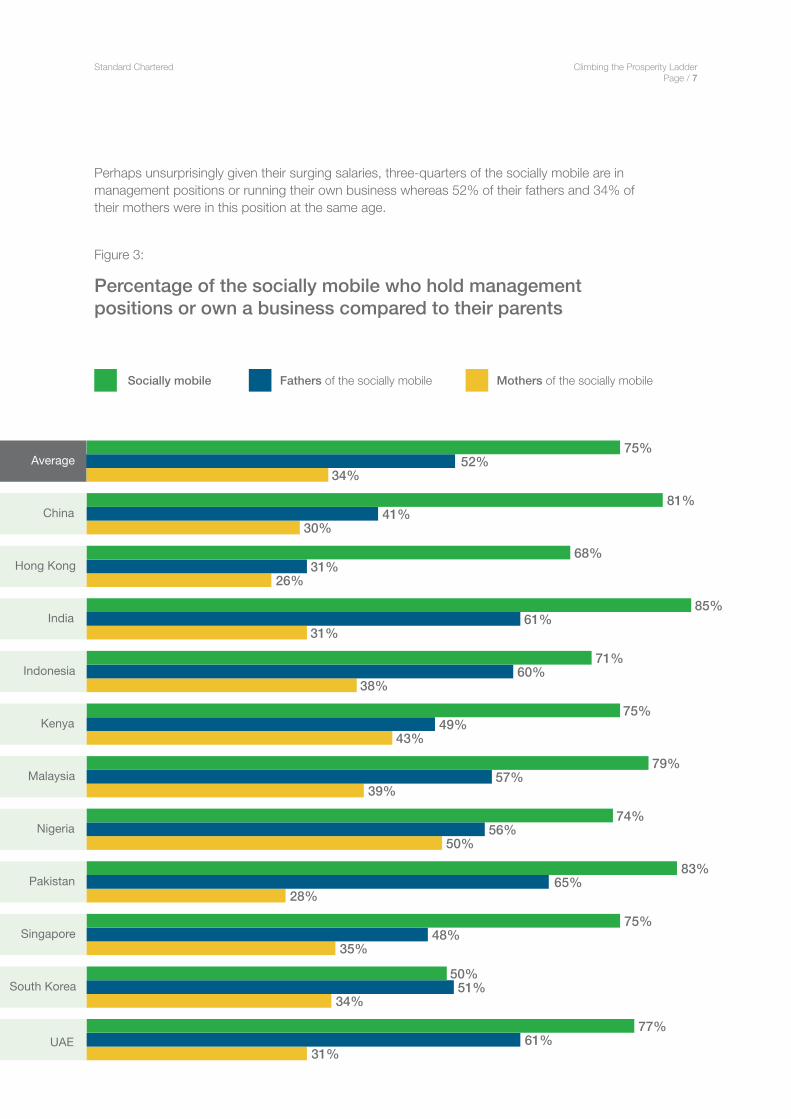
Perhaps unsurprisingly given their surging salaries, three-quarters of the socially mobile are in management positions or running their own business whereas 52% of their fathers and 34% of their mothers were in this position at the same age.
Figure 3:
Percentage of the socially mobile who hold management positions or own a business compared to their parents
Socially mobile Fathers of the socially mobile Mothers of the socially mobile
Standard Chartered Climbing the Prosperity Ladder Page / 8
Average
China
India
Indonesia
Kenya
Malaysia
Nigeria
Pakistan
Singapore
Hong Kong
South Korea
UAE
85%
91%
81%
93%71%
83%
86%
84%
82%
89%
49%66%
35%39%
77%
84%61%
51%
54%63%
85%
48%41%
46%40%
32%40%
55%46%
50%
31%27%
34%29%
50%41%
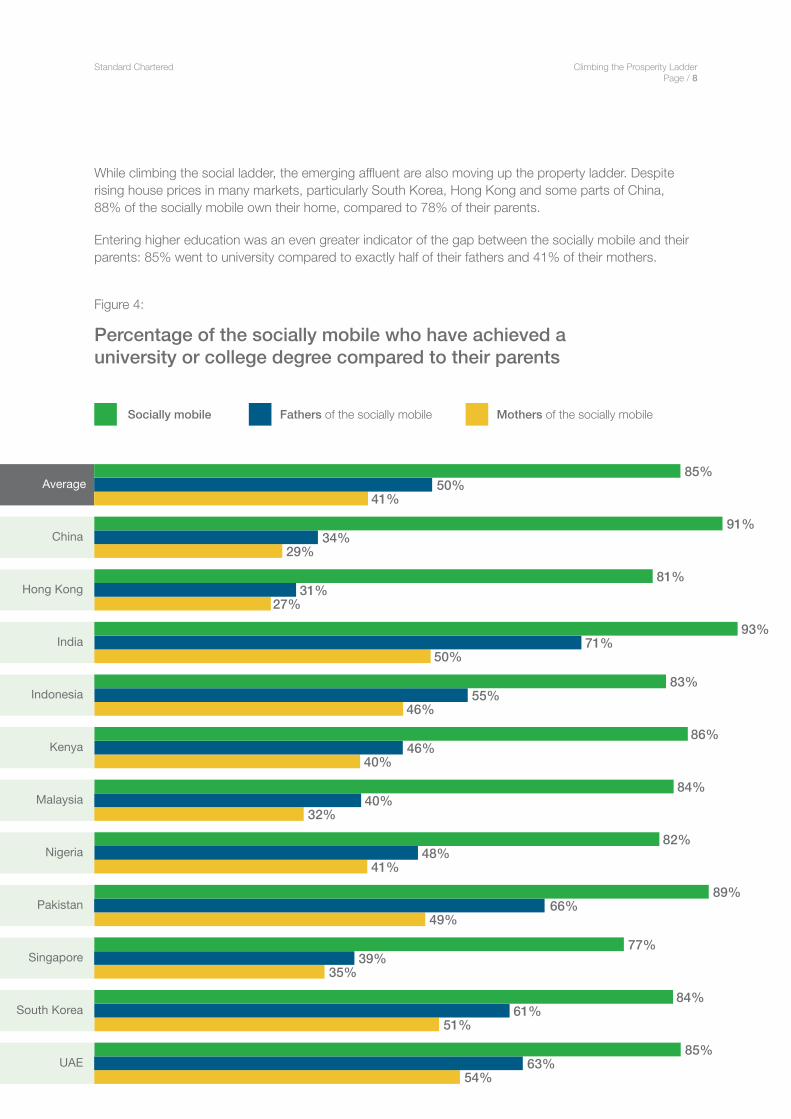
While climbing the social ladder, the emerging affluent are also moving up the property ladder. Despite rising house prices in many markets, particularly South Korea, Hong Kong and some parts of China, 88% of the socially mobile own their home, compared to 78% of their parents.
Entering higher education was an even greater indicator of the gap between the socially mobile and their parents: 85% went to university compared to exactly half of their fathers and 41% of their mothers.
Figure 4:
Percentage of the socially mobile who have achieved a university or college degree compared to their parents
Socially mobile Fathers of the socially mobile Mothers of the socially mobile

Standard Chartered Climbing the Prosperity Ladder Page / 9
Madhur Jha
4 See page 22
Head of Thematic Research
The markets in this study are all unique and it is encouraging to see that there are such promising levels of social mobility across all of them, despite their different stages of development. Strong performances throughout the markets shows that there really is dynamic movement happening in these economies and that people are seizing the chance to thrive.
Asia’s ‘tiger’ economies in Hong Kong, Singapore and South Korea are mature markets, and their growth is where we would expect it to be. It is good to see that social mobility is still at promisingly high levels despite the challenges that come with being in an advanced stage of development.
These different circumstances mean direct comparisons cannot be made with China, India and Pakistan, whose economies have recently been developing rapidly.
Social mobility is booming across these three markets, but plenty more markets are also on the up. Despite their differences, across all of the markets the emerging affluent are focusing on providing for their children’s education4, which shows that they are determined to make sure the future is even brighter for the next generation.

Standard Chartered Climbing the Prosperity Ladder Page / 10
Wonder womenIncreased levels of education among the emerging affluent have had an impact on women. Among all emerging affluent women, 84% have completed higher education – almost double the number of their mothers who went to university (44%). Research from the World Bank Group shows that girls’ education is important for continuing to drive economic growth5. This is especially true in the case of aging populations, where there is a need to bolster the size of the workforce.
Emerging affluent women’s economic power has increased even more than their academic qualifications. While one-third of their mothers did not have a job, 2% of emerging affluent women are now homemakers or unemployed. Women in the markets in our study are working their way upwards, and they are providing extra workforce productivity at the same time.
More than half of those achieving supercharged social mobility are women (55%), meaning they are enjoying more accelerated mobility and climbing the hierarchy faster than men.
Figure 5:
Percentage of men and women among the socially supercharged
5 Missed Opportunities: The High Cost of Not Educating Girls, World Bank Group, 2018
40
60
80
20
63%55%
68%
53%51%
65%
47% 49% 48%
54%55%51%
45%
32% 35%
47% 49%46%
53% 51% 52%
45%49%
Aver
age
Chi
na
Indi
a
Indo
nesi
a
Keny
a
Mal
aysi
a
Nig
eria
Paki
stan
Sing
apor
e
Hon
g Ko
ng
Sout
h Ko
rea
UAE
Supercharged women
Supercharged men

Standard Chartered Climbing the Prosperity Ladder Page / 11
Lay Choo Ong
Global Head, Wealth Proposition
It is exciting to see that women are more empowered than ever to achieve financial success, armed with better education and higher earning power: 84% have a university degree, while 96% are earning a salary.
More emerging affluent women are experiencing supercharged social mobility than men – they are accelerating their careers, growing businesses and buying homes at a rapid pace.
84%have a university degree
96%of the emerging affluent women earn a salary

Standard Chartered Climbing the Prosperity Ladder Page / 12
The fast-trackers: China, India and PakistanThe fast-growing economies of China, India and Pakistan are providing abundant opportunities for scaling the social pyramid. Leading the way, in both China and India 67% of the emerging affluent are experiencing positive social mobility, while Pakistan is not far behind with 64%.
Of the emerging affluent in these countries, India and Pakistan both have more than one in 10 (11%) that are experiencing supercharged social mobility, versus 7% in China.
Strong earnings progression is fuelling impressive rates of social mobility in all three countries. Many of the socially mobile have benefitted from a salary increase of 50% or more in the last five years – 34% in Pakistan, followed by 30% in India and 26% in China.
This gap could widen, with India and Pakistan more optimistic about their future salaries than their Chinese counterparts. Almost half of the socially mobile in Pakistan (48%) and India (46%) predict another earnings increase of 50% or more in the next five years, whereas less than three in 10 (29%) expect the same in China.
While the emerging affluent in China are more cautious about salary growth than their counterparts in fast-growing Pakistan and India, workplace remuneration is just one side of the social mobility equation. Education has been considered crucial to improving social standing in China for a long time, but the generational shift towards university access among the socially mobile is larger than any other market: more than nine in 10 have attended university (91%), compared to 34% of their fathers and 29% of their mothers.
Standard Chartered Climbing the Prosperity Ladder Page / 13
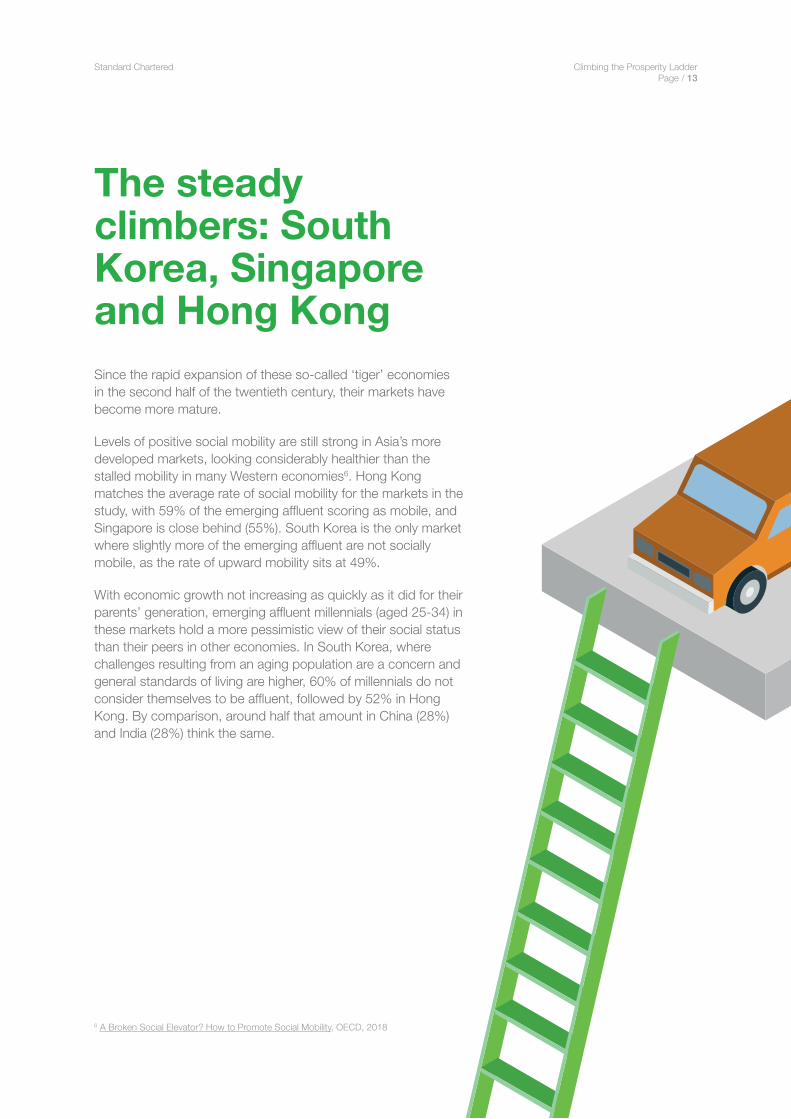
The steady climbers: South Korea, Singapore and Hong KongSince the rapid expansion of these so-called ‘tiger’ economies in the second half of the twentieth century, their markets have become more mature.
Levels of positive social mobility are still strong in Asia’s more developed markets, looking considerably healthier than the stalled mobility in many Western economies6. Hong Kong matches the average rate of social mobility for the markets in the study, with 59% of the emerging affluent scoring as mobile, and Singapore is close behind (55%). South Korea is the only market where slightly more of the emerging affluent are not socially mobile, as the rate of upward mobility sits at 49%.
With economic growth not increasing as quickly as it did for their parents’ generation, emerging affluent millennials (aged 25-34) in these markets hold a more pessimistic view of their social status than their peers in other economies. In South Korea, where challenges resulting from an aging population are a concern and general standards of living are higher, 60% of millennials do not consider themselves to be affluent, followed by 52% in Hong Kong. By comparison, around half that amount in China (28%) and India (28%) think the same.
6 A Broken Social Elevator? How to Promote Social Mobility, OECD, 2018
Standard Chartered Climbing the Prosperity Ladder Page / 14
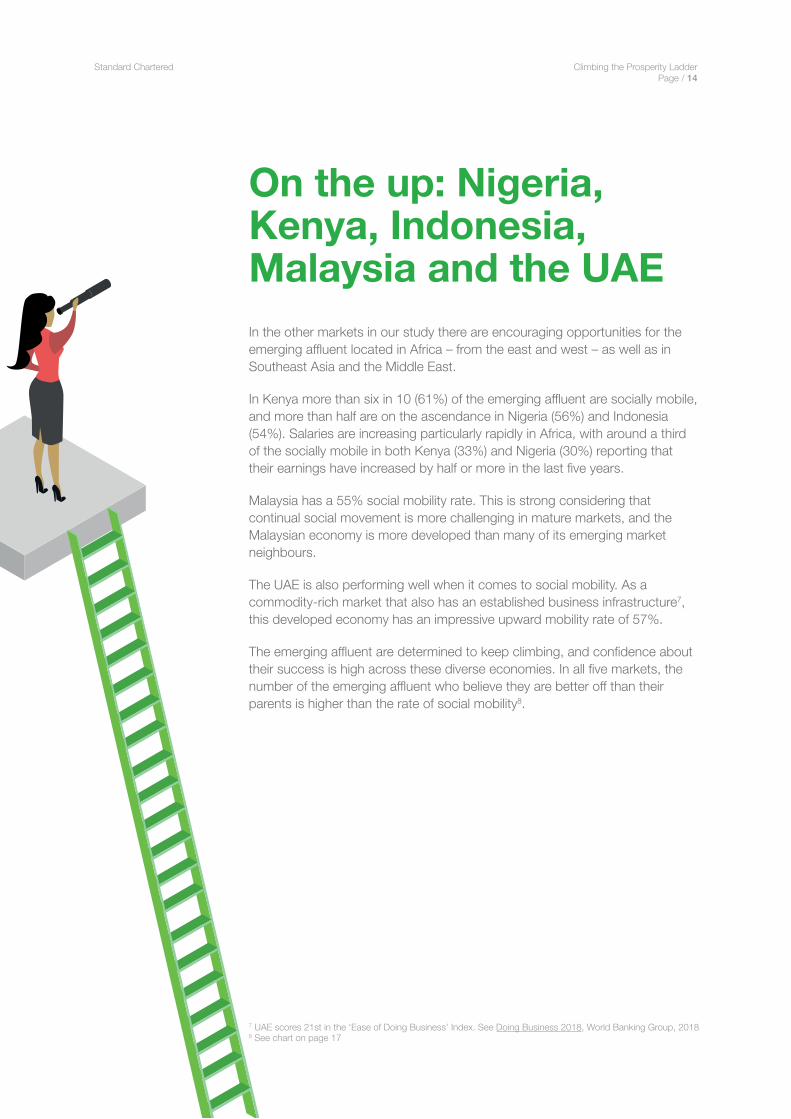
On the up: Nigeria, Kenya, Indonesia, Malaysia and the UAEIn the other markets in our study there are encouraging opportunities for the emerging affluent located in Africa – from the east and west – as well as in Southeast Asia and the Middle East.
In Kenya more than six in 10 (61%) of the emerging affluent are socially mobile, and more than half are on the ascendance in Nigeria (56%) and Indonesia (54%). Salaries are increasing particularly rapidly in Africa, with around a third of the socially mobile in both Kenya (33%) and Nigeria (30%) reporting that their earnings have increased by half or more in the last five years.
Malaysia has a 55% social mobility rate. This is strong considering that continual social movement is more challenging in mature markets, and the Malaysian economy is more developed than many of its emerging market neighbours.
The UAE is also performing well when it comes to social mobility. As a commodity-rich market that also has an established business infrastructure7, this developed economy has an impressive upward mobility rate of 57%.
The emerging affluent are determined to keep climbing, and confidence about their success is high across these diverse economies. In all five markets, the number of the emerging affluent who believe they are better off than their parents is higher than the rate of social mobility8.
7 UAE scores 21st in the ‘Ease of Doing Business’ Index. See Doing Business 2018, World Banking Group, 2018 8 See chart on page 17
Standard Chartered Climbing the Prosperity Ladder Page / 15
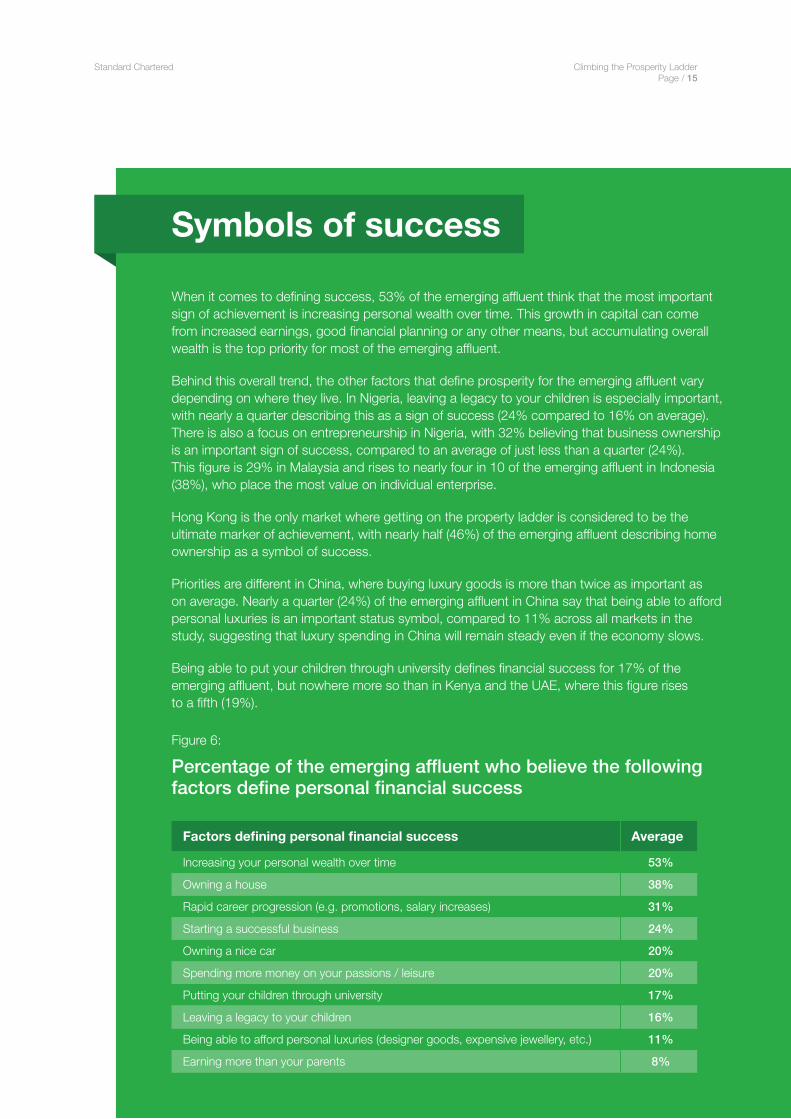
Symbols of success
When it comes to defining success, 53% of the emerging affluent think that the most important sign of achievement is increasing personal wealth over time. This growth in capital can come from increased earnings, good financial planning or any other means, but accumulating overall wealth is the top priority for most of the emerging affluent.
Behind this overall trend, the other factors that define prosperity for the emerging affluent vary depending on where they live. In Nigeria, leaving a legacy to your children is especially important, with nearly a quarter describing this as a sign of success (24% compared to 16% on average). There is also a focus on entrepreneurship in Nigeria, with 32% believing that business ownership is an important sign of success, compared to an average of just less than a quarter (24%). This figure is 29% in Malaysia and rises to nearly four in 10 of the emerging affluent in Indonesia (38%), who place the most value on individual enterprise.
Hong Kong is the only market where getting on the property ladder is considered to be the ultimate marker of achievement, with nearly half (46%) of the emerging affluent describing home ownership as a symbol of success.
Priorities are different in China, where buying luxury goods is more than twice as important as on average. Nearly a quarter (24%) of the emerging affluent in China say that being able to afford personal luxuries is an important status symbol, compared to 11% across all markets in the study, suggesting that luxury spending in China will remain steady even if the economy slows.
Being able to put your children through university defines financial success for 17% of the emerging affluent, but nowhere more so than in Kenya and the UAE, where this figure rises to a fifth (19%).
Figure 6:
Percentage of the emerging affluent who believe the following factors define personal financial success
Factors defining personal financial success Average
Increasing your personal wealth over time 53%
Owning a house 38%
Rapid career progression (e.g. promotions, salary increases) 31%
Starting a successful business 24%
Owning a nice car 20%
Spending more money on your passions / leisure 20%
Putting your children through university 17%
Leaving a legacy to your children 16%
Being able to afford personal luxuries (designer goods, expensive jewellery, etc.) 11%
Earning more than your parents 8%
Standard Chartered Climbing the Prosperity Ladder Page / 16
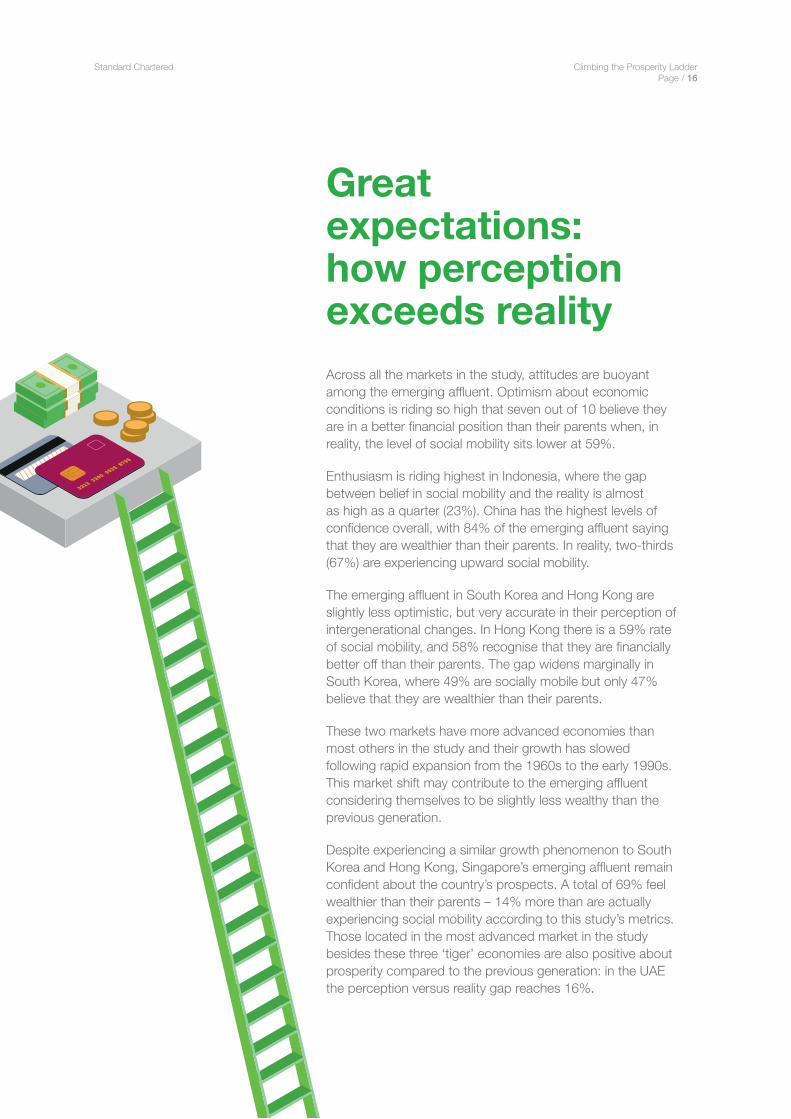
Great expectations: how perception exceeds realityAcross all the markets in the study, attitudes are buoyant among the emerging affluent. Optimism about economic conditions is riding so high that seven out of 10 believe they are in a better financial position than their parents when, in reality, the level of social mobility sits lower at 59%.
Enthusiasm is riding highest in Indonesia, where the gap between belief in social mobility and the reality is almost as high as a quarter (23%). China has the highest levels of confidence overall, with 84% of the emerging affluent saying that they are wealthier than their parents. In reality, two-thirds (67%) are experiencing upward social mobility.
The emerging affluent in South Korea and Hong Kong are slightly less optimistic, but very accurate in their perception of intergenerational changes. In Hong Kong there is a 59% rate of social mobility, and 58% recognise that they are financially better off than their parents. The gap widens marginally in South Korea, where 49% are socially mobile but only 47% believe that they are wealthier than their parents.
These two markets have more advanced economies than most others in the study and their growth has slowed following rapid expansion from the 1960s to the early 1990s. This market shift may contribute to the emerging affluent considering themselves to be slightly less wealthy than the previous generation.
Despite experiencing a similar growth phenomenon to South Korea and Hong Kong, Singapore’s emerging affluent remain confident about the country’s prospects. A total of 69% feel wealthier than their parents – 14% more than are actually experiencing social mobility according to this study’s metrics. Those located in the most advanced market in the study besides these three ‘tiger’ economies are also positive about prosperity compared to the previous generation: in the UAE the perception versus reality gap reaches 16%.

Standard Chartered Climbing the Prosperity Ladder Page / 17
-1%
-2%47%49%
58%59%
66%
71%
69%
77%
84%
73%
71%
79%
70%
80%
Average
China
India
Indonesia
Kenya
Malaysia
Nigeria
Pakistan
Singapore
Hong Kong
South Korea
UAE
+23%54%
+17%67%
+16%55%
+16%57%
+15%64%
+14%55%
+13%67%
+11%59%
+10%61%
+10%56%
Figure 7:
Difference between the socially mobile and the emerging affluent that feel they are better off than their parents
Percentage of the emerging affluent who are socially mobile
Percentage of the emerging affluent who feel better off than their parents
Difference
Standard Chartered Climbing the Prosperity Ladder Page / 18
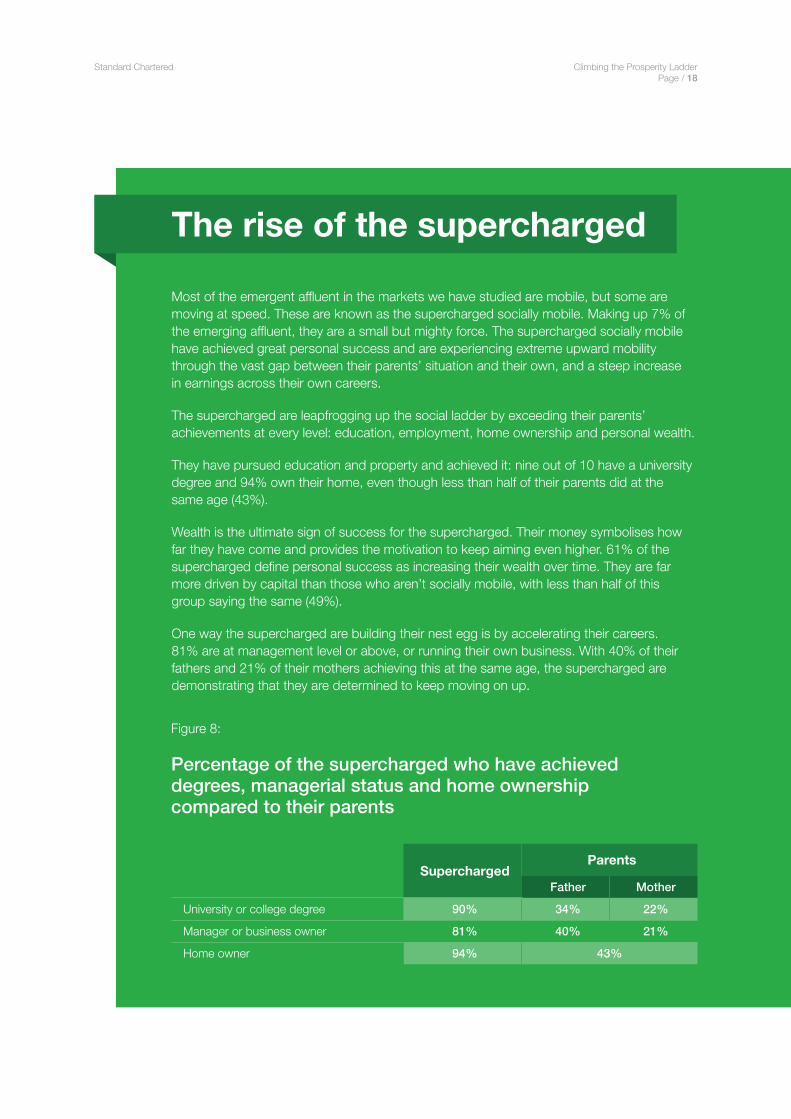
The rise of the supercharged
Most of the emergent affluent in the markets we have studied are mobile, but some are moving at speed. These are known as the supercharged socially mobile. Making up 7% of the emerging affluent, they are a small but mighty force. The supercharged socially mobile have achieved great personal success and are experiencing extreme upward mobility through the vast gap between their parents’ situation and their own, and a steep increase in earnings across their own careers.
The supercharged are leapfrogging up the social ladder by exceeding their parents’ achievements at every level: education, employment, home ownership and personal wealth.
They have pursued education and property and achieved it: nine out of 10 have a university degree and 94% own their home, even though less than half of their parents did at the same age (43%).
Wealth is the ultimate sign of success for the supercharged. Their money symbolises how far they have come and provides the motivation to keep aiming even higher. 61% of the supercharged define personal success as increasing their wealth over time. They are far more driven by capital than those who aren’t socially mobile, with less than half of this group saying the same (49%).
One way the supercharged are building their nest egg is by accelerating their careers. 81% are at management level or above, or running their own business. With 40% of their fathers and 21% of their mothers achieving this at the same age, the supercharged are demonstrating that they are determined to keep moving on up.
Figure 8:
Percentage of the supercharged who have achieved degrees, managerial status and home ownership compared to their parents
SuperchargedParents
Father Mother
University or college degree 90% 34% 22%
Manager or business owner 81% 40% 21%
Home owner 94% 43%

Standard Chartered Climbing the Prosperity Ladder Page / 19
Better investment for a brighter futureThe emerging affluent are taking social mobility into their own hands. They believe that it’s not how much money you earn, it’s what you do with it that counts. Investing in financial products is helping them to keep moving up the ladder, with 56% saying this was a strategy for meeting their financial goals and increasing their wealth. By comparison, less than half (43%) said that their salary and career progression was a strategy for helping them to achieve this.
Figure 9:
Percentage of the emerging affluent who would use the following strategies to meet their financial goals and increase their wealth
Strategy Average
Investing in financial products (e.g. stocks, bonds, mutual funds) 56%
Career progression and salary increase 43%
Starting a business 27%
Having a side hustle 24%
Part-time second job 18%
Making use of the ’gig economy’ 12%
Expected inheritance 3%
Standard Chartered Climbing the Prosperity Ladder Page / 20
53%South Korea
67%Singapore
70%Nigeria
71%Pakistan
71%Kenya
79%India
71%Malaysia
75%China
80%Indonesia
53%Hong Kong
66%UAE
69%Average
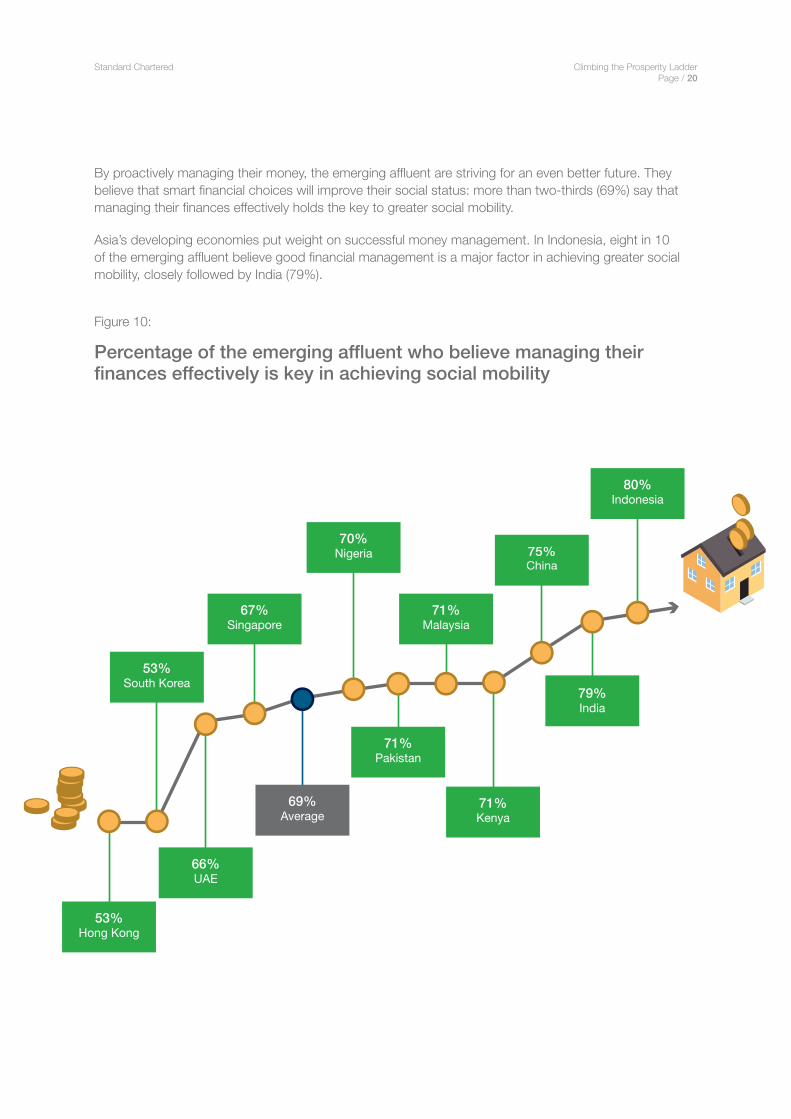
By proactively managing their money, the emerging affluent are striving for an even better future. They believe that smart financial choices will improve their social status: more than two-thirds (69%) say that managing their finances effectively holds the key to greater social mobility.
Asia’s developing economies put weight on successful money management. In Indonesia, eight in 10 of the emerging affluent believe good financial management is a major factor in achieving greater social mobility, closely followed by India (79%).
Figure 10:
Percentage of the emerging affluent who believe managing their finances effectively is key in achieving social mobility
Standard Chartered Climbing the Prosperity Ladder Page / 21
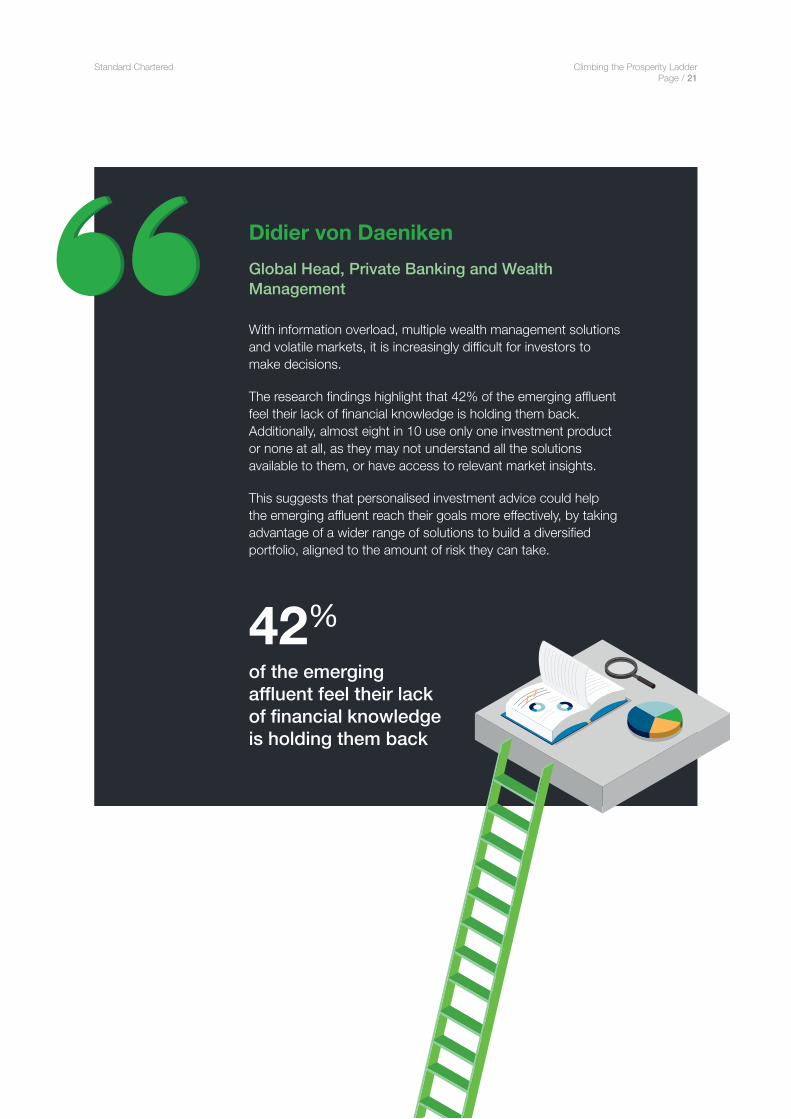
Didier von Daeniken
Global Head, Private Banking and Wealth Management
With information overload, multiple wealth management solutions and volatile markets, it is increasingly difficult for investors to make decisions.
The research findings highlight that 42% of the emerging affluent feel their lack of financial knowledge is holding them back. Additionally, almost eight in 10 use only one investment product or none at all, as they may not understand all the solutions available to them, or have access to relevant market insights.
This suggests that personalised investment advice could help the emerging affluent reach their goals more effectively, by taking advantage of a wider range of solutions to build a diversified portfolio, aligned to the amount of risk they can take.
42%
of the emerging affluent feel their lack of financial knowledge is holding them back

Standard Chartered Climbing the Prosperity Ladder Page / 22
The wealth wish-listThe emerging affluent know what they want to achieve with their money, and have identified clear goals to work towards.
Paying for their children’s education was ranked as the most important savings priority for the emerging affluent in every market in the study. On average, education is twice as important as the next largest target, with 16% saying this is their top financial goal. Saving to buy an investment property comes next, with 8% describing this as their top priority.
Education is a key lever of upward social mobility, so the emerging affluent want to use their money to increase their family’s prosperity in the future.
Other highly-ranked savings priorities also aim to build security for the long term rather than being short-term luxuries. Buying a first home and setting up a business are both the top saving priority for 7% of the emerging affluent.
Whatever the goal for the emerging affluent, they believe that they are organised and proactive about achieving it. Just over half of the emerging affluent say they have a plan to accomplish their ambitions: 51% believe that they invest with a target and a strategy to achieve it. Of the rest, 35% have a target but no organised investment strategy to help them achieve it, mainly putting their money into savings with some investments on the side, and less than a sixth (14%) do not invest or have a target at all.
The emerging affluent generally describe impressive investment habits, but the products they actually use suggest there is a gap between their perception and the reality.

Standard Chartered Climbing the Prosperity Ladder Page / 23
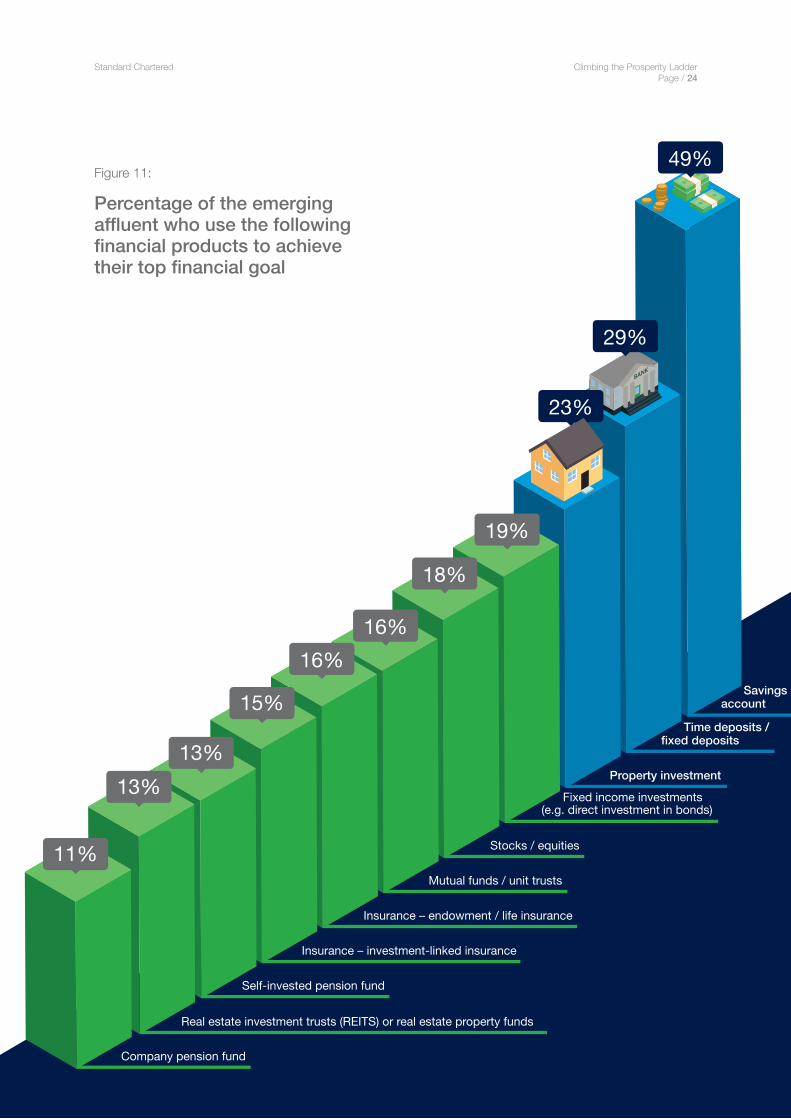
More room for returnsThe emerging affluent have positive intentions about using investments to achieve their goals. But despite the drive to achieve their targets, there is space for more sophistication in their methods. When describing the financial products they use to meet their goals the most basic savings approaches came out on top.
Savings accounts are the most popular method of achieving wealth targets, with nearly half (49%) using them to reach their top financial goal across all markets. This is followed by time deposits (29%) and then property investment, with less than a quarter (23%) using real estate to increase their wealth.
Considering that just over half also believe they have an investment target and strategy, this reliance on basic savings accounts could suggest the emerging affluent believe they are using more advanced strategies than in reality.
In only four of the markets in the study do the emerging affluent choose an investment product9 as one of their top three financial products for achieving their main savings goal. In Hong Kong, 26% use equity investments, while mutual funds are used by 31% in India and 26% in Pakistan. In China, 23% use fixed income investments.
Relying too heavily on basic savings accounts may not be the best way for the emerging affluent to increase their savings pot, as it can mean a missed opportunity for higher returns. Developing an investment strategy through a diverse investment portfolio could help many of the emerging affluent to achieve their financial goals faster.
Although there is space for more developed investment strategies among the emerging affluent, some do still use investment products to achieve their savings goals. Fixed income investments are most popular overall, with 19% of the emerging affluent using these to contribute towards achieving their top financial goal. Equity investments come a close second (18%) and mutual funds are in third (16%).
9 In this report, ‘investment products’ refers to fixed income investments, stocks, equities, mutual funds, unit trusts, investment-linked insurance, self-invested pension funds, real estate investment trusts (REITS) and real estate property funds
Standard Chartered Climbing the Prosperity Ladder Page / 24
13%13%
15%
16%16%
19%
18%
11%
23%
29%
49%
Company pension fund
Real estate investment trusts (REITS) or real estate property funds
Self-invested pension fund
Insurance – investment-linked insurance
Insurance – endowment / life insurance
Mutual funds / unit trusts
Stocks / equities
Fixed income investments (e.g. direct investment in bonds)
Property investment
Time deposits / fixed deposits
Savings account
Figure 11:
Percentage of the emerging affluent who use the following financial products to achieve their top financial goal
Standard Chartered Climbing the Prosperity Ladder Page / 25
South Korea 32%
Singapore 41%
Malaysia 43%
Pakistan 52%
India 55%
Average 42%
China 52%
Hong Kong 36%
Nigeria 35%
Indonesia 28%
Kenya 38%
UAE 49%
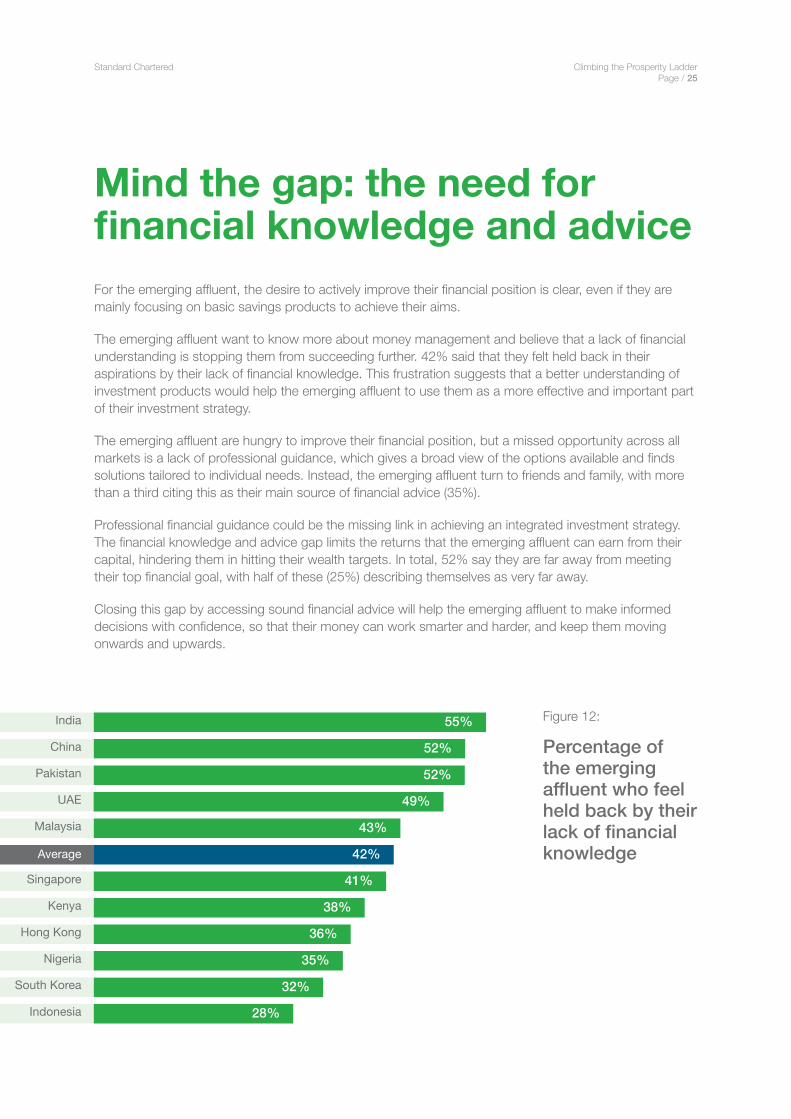
Mind the gap: the need for financial knowledge and adviceFor the emerging affluent, the desire to actively improve their financial position is clear, even if they are mainly focusing on basic savings products to achieve their aims.
The emerging affluent want to know more about money management and believe that a lack of financial understanding is stopping them from succeeding further. 42% said that they felt held back in their aspirations by their lack of financial knowledge. This frustration suggests that a better understanding of investment products would help the emerging affluent to use them as a more effective and important part of their investment strategy.
The emerging affluent are hungry to improve their financial position, but a missed opportunity across all markets is a lack of professional guidance, which gives a broad view of the options available and finds solutions tailored to individual needs. Instead, the emerging affluent turn to friends and family, with more than a third citing this as their main source of financial advice (35%).
Professional financial guidance could be the missing link in achieving an integrated investment strategy. The financial knowledge and advice gap limits the returns that the emerging affluent can earn from their capital, hindering them in hitting their wealth targets. In total, 52% say they are far away from meeting their top financial goal, with half of these (25%) describing themselves as very far away.
Closing this gap by accessing sound financial advice will help the emerging affluent to make informed decisions with confidence, so that their money can work smarter and harder, and keep them moving onwards and upwards.
Figure 12:
Percentage of the emerging affluent who feel held back by their lack of financial knowledge

Standard Chartered Climbing the Prosperity Ladder Page / 26
Emerging entrepreneurs
Budding entrepreneurs are common among the emerging affluent. More than a quarter (27%) see starting their own business as a key strategy for increasing their wealth. This figure rises significantly in Nigeria (41%), Indonesia (39%) and Malaysia (35%), where entrepreneurial spirit is strongest.
Older generations are as likely as millennials (aged 25-34) to use business ownership to increase their wealth. In Indonesia, the 45-55 age bracket is most likely to start a business, with 46% describing it as part of their financial strategy.
Women in business have a supportive economic environment in Singapore, which ranks among the top locations for female entrepreneurship10. This is reflected in our study, with 32% of Singapore an women saying that starting their own business is one of their strategies to achieve their financial goals, compared to 28% of men. This translates to financial rewards: business income is more likely to be a top source of revenue for women (56%) than it is for men (49%).
The emerging affluent are keen to use other enterprising strategies to make money, with 24% saying they would have a side hustle11 alongside their day job, while 18% say the same of a part-time job, and 12% would use the gig economy as a strategy for increasing their wealth12. In the UAE, people are especially keen to make extra income from the freelance opportunities offered by the gig economy, with 17% of the emerging affluent saying they would use this as a strategy to increase their wealth.
10 Women Entrepreneur Cities Index, Dell, 2018 11 We define a ‘side hustle’ as a passion project or interest pursued alongside a full-time job, with the intention of turning it into the primary source of income 12 We define ‘the gig economy’ as work in the form of short-term, flexible contracts or freelance contract work
Standard Chartered Climbing the Prosperity Ladder Page / 27
Digital dividends: technology holds the key to financial success Online banking tools are key to effective financial management today. With payments and transfers, stock investments and financial advice all available at the touch of a button, new technology allows for quick and easy money management anywhere in the world.
‘Fintech’ – or financial technology – is a secret weapon for the emerging affluent, with almost two-thirds (65%) saying that their familiarity with digital tools has been vital to their personal success. On top of this, digital money management has helped 61% of the emerging affluent get closer to achieving their financial goals13.
Digital technology makes financial products more visible and accessible, allowing users to make more informed decisions quickly and easily. The emerging affluent confirm this is the case, with the majority (65%) saying that online banking makes them feel they have more control over their money and investments.
New digital tools have the most impact in developing markets with dramatic rises in upward social mobility. India’s emerging affluent are the biggest advocates of online banking, as eight out of 10 believe it gives them more control; nearly three-quarters (73%) also say this in Pakistan.
13 Digital money management involves using websites and apps for a range of financial transactions such as monitoring bank balance, making payments and transfers and managing investments
Standard Chartered Climbing the Prosperity Ladder Page / 28
Smartphones for smart savingsGlobally, more time is spent on smartphones than ever before and this extra screen time could be helping the emerging affluent to stay on top of their finances. More than three-quarters (78%) use their bank’s smartphone app to monitor their bank balance and make payments once a week or more.
This new source of financial control could be helping the emerging affluent drive their social mobility, with smartphone apps revolutionising money management in emerging economies and driving financial inclusion.
When it comes to making daily digital transactions, Nigeria leads the way with 39% monitoring their bank balance and making payments every day via mobile apps. Indonesia is not far behind, with 37% of its emerging affluent doing the same, in contrast to an overall figure of 29%.
Banking apps aren’t the only way the emerging affluent are using their smartphones to manage their money. Making payments through third-party platforms such as Alipay, Apple Pay, M-Pesa, PayPal or WeChat Pay is even more popular in certain markets. In Kenya, 42% use their smartphones to make payments with these kind of services every day; this figure rises to nearly half of the emerging affluent in China (47% compared to 30% overall).

Standard Chartered Climbing the Prosperity Ladder Page / 29
Aalishaan Zaidi
Global Head, Digital Banking
Across all age groups, more of the emerging affluent are using digital tools to help them keep track of their money than ever before, and the convenience of online financial management helps people to live their busy lives.
The emerging affluent in our study are very savvy when it comes to using technology for their everyday banking, but they have not fully adopted it for more strategic financial activities like investing. This could be stopping them from maximising their wealth, so bringing the accessibility of digital to wealth management could really help them to achieve their goals.
We know that investment can involve bigger and more complicated decisions than everyday banking, which is why providing clients with more choice and flexibility on how they bank with us is crucial. This isn’t about removing face-to-face banking, because we know that some people prefer making financial decisions through traditional channels, while others want the convenience of tracking their wealth on-the-go from their phones.
Digital has really democratised who can access wealth management strategies, and with online and mobile digital tools available on demand it is set to help even more of the emerging affluent to keep growing their nest egg.
Standard Chartered Climbing the Prosperity Ladder Page / 30
Mature but mobile
Older generations have embraced mobile banking, with little difference between age groups when it comes to using smartphones once a week or more to monitor bank balances and make payments via banking apps.
However, millennials (aged 25-34) are a little more likely to make smartphone payments through third-party platforms. Nearly a third (32%) of millennials use these to make smartphone payments every day, compared to just over a quarter (26%) of the 45-55s.
Enthusiasm for on-demand advisersBasic financial tasks are increasingly taking place quickly and securely via smartphone devices and the emerging affluent have an appetite for managing their wealth more broadly online, even if there’s risk involved.
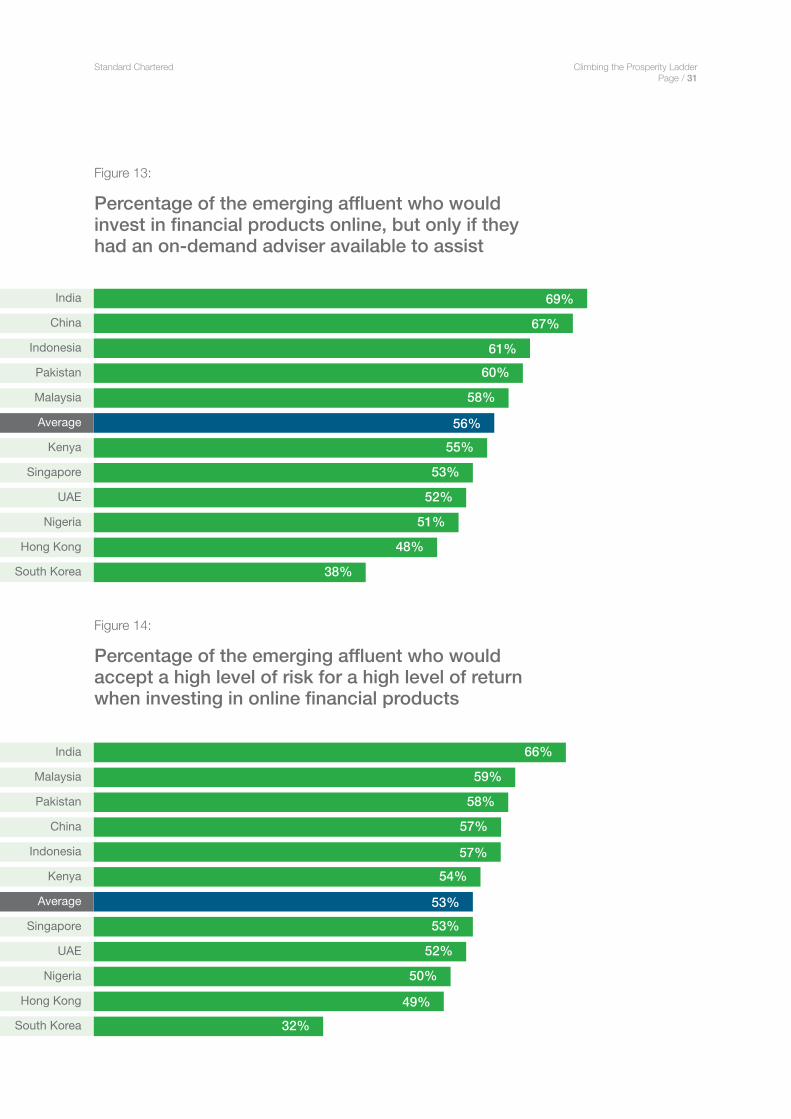
They are comfortable going online for financial advice, with more than half (56%) saying they would invest in financial products online if an on-demand adviser was available.
Confidence in online advisers is especially high in India (69%) and China (67%), with more than two-thirds saying they would trust them when investing in financial products. The strongest preference for face-to-face financial advice is in South Korea, although 38% would still be happy to go digital for investment advice.
What’s more, risk is not a problem for the emerging affluent if strong rewards are possible. When investing their money in online financial products, 53% would accept a high level of risk in exchange for a high level of return. Malaysia’s emerging affluent are particularly confident when it comes to high stakes, with 59% accepting the risk/return trade-off, although India still leads the way with two-thirds willing to do so.
Standard Chartered Climbing the Prosperity Ladder Page / 31
Malaysia 59%
Nigeria 50%
UAE 52%
India 66%
South Korea 32%
India 69%
South Korea 38%
Average 56%
China 67%
Hong Kong 48%
Nigeria 51%
Pakistan 60%
Indonesia 61%
Kenya 55%
Malaysia 58%
Singapore 53%
UAE 52%
Average 53%
China 57%
Hong Kong 49%
Pakistan 58%
Indonesia 57%Kenya 54%
Singapore 53%
Figure 13:
Figure 14:
Percentage of the emerging affluent who would invest in financial products online, but only if they had an on-demand adviser available to assist
Percentage of the emerging affluent who would accept a high level of risk for a high level of return when investing in online financial products
Standard Chartered Climbing the Prosperity Ladder Page / 32
Prasenjit Chakravarti
Global Head, Personal and Premium Banking
Taking advantage of online financial tools and services could provide the opportunity the emerging affluent need to maximise their assets and meet their targets, but a lack of financial education and advice is stopping them from meeting their financial goals.
Different service providers will offer varying levels of advice and support, and an important consideration for the emerging affluent should be whether the platform provides a professional on-demand financial adviser to help them make the best decisions tailored to their financial situation and goals.
Fernando Morillo
Global Head, Retail Products and Segments
Despite their different cultures and backgrounds, the emerging affluent share many of the same financial priorities and concerns across the markets in our study.
Last year, our study discovered that the emerging affluent are avid savers who prioritise building financial stability. This has not changed, and this year 69% of the emerging affluent have told us that they believe managing their wealth effectively is key to achieving greater social mobility.
With digital connectivity at its highest level in history, the emerging affluent have the opportunity to manage their money online via investment platforms, full suites of payment services and goal-based savings platforms.
Standard Chartered Climbing the Prosperity Ladder Page / 33
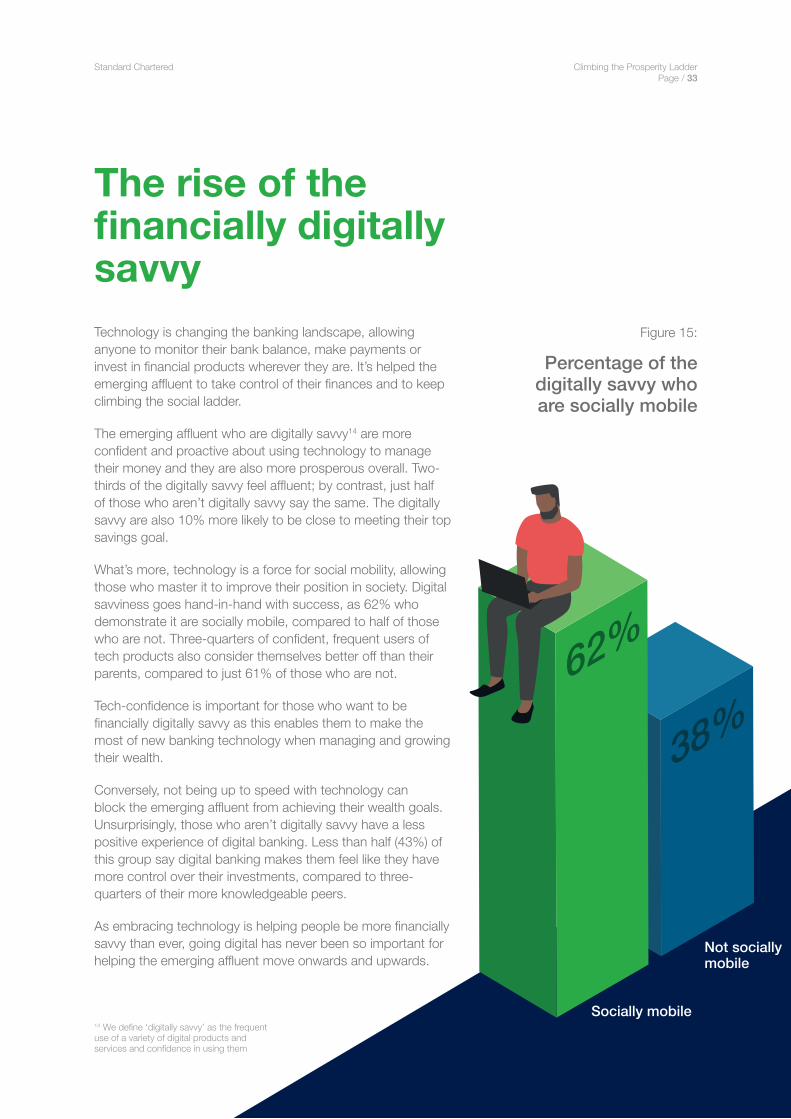
The rise of the financially digitally savvyTechnology is changing the banking landscape, allowing anyone to monitor their bank balance, make payments or invest in financial products wherever they are. It’s helped the emerging affluent to take control of their finances and to keep climbing the social ladder.
The emerging affluent who are digitally savvy14 are more confident and proactive about using technology to manage their money and they are also more prosperous overall. Two-thirds of the digitally savvy feel affluent; by contrast, just half of those who aren’t digitally savvy say the same. The digitally savvy are also 10% more likely to be close to meeting their top savings goal.
What’s more, technology is a force for social mobility, allowing those who master it to improve their position in society. Digital savviness goes hand-in-hand with success, as 62% who demonstrate it are socially mobile, compared to half of those who are not. Three-quarters of confident, frequent users of tech products also consider themselves better off than their parents, compared to just 61% of those who are not.
Tech-confidence is important for those who want to be financially digitally savvy as this enables them to make the most of new banking technology when managing and growing their wealth.
Conversely, not being up to speed with technology can block the emerging affluent from achieving their wealth goals. Unsurprisingly, those who aren’t digitally savvy have a less positive experience of digital banking. Less than half (43%) of this group say digital banking makes them feel like they have more control over their investments, compared to three-quarters of their more knowledgeable peers.
As embracing technology is helping people be more financially savvy than ever, going digital has never been so important for helping the emerging affluent move onwards and upwards.
Figure 15:
Percentage of the digitally savvy who are socially mobile
14 We define ‘digitally savvy’ as the frequent use of a variety of digital products and services and confidence in using them
Socially mobile
Not socially mobile

Standard Chartered Climbing the Prosperity Ladder Page / 34
ConclusionSocial mobility is powering the economies the emerging affluent live and work in. As markets expand, individuals are seizing the opportunity to climb the social ladder and, as a result, are continuing to fuel economic growth with their spending power.
Dynamic economic conditions have helped the socially mobile to flourish, but they have also worked to elevate themselves by achieving high levels of education, increasing their wealth through employment, entrepreneurship and investment, and becoming homeowners.
They have exceeded their parents’ achievements on all of these factors but are also driven to keep succeeding, seeking to continue to grow their wealth through investments, savings and salary increases.
As the world becomes faster and more complex, the best money management opportunities are constantly changing and, therefore, being plugged into our digital world has never been more important.
Digital banking and wealth management tools can help the emerging affluent to set and track their goals, and provide portfolio performance reports and market commentary which help them to achieve them sooner. Online financial tools with on-demand advice could provide the financial know-how that the emerging affluent want to be able to invest with confidence.
Standard Chartered Climbing the Prosperity Ladder Page / 35
Discover more
At Standard Chartered, we strive to provide expertise and products that will help the emerging affluent continue to thrive. Our purpose is to help people keep achieving their goals all over the world, whether they are buying a house, sending their children to university or starting a business.
Our local Standard Chartered websites provide tailored information about some of the financial development opportunities available to emerging affluent clients.
Discover Premium Banking, available in most of the markets surveyed for this study, which has a suite of products and services designed to help the emerging affluent achieve their financial goals. Whether it is through on-demand advice, digital tools and online wealth management or low-cost global transfers, find out more about the range of services and rewards that help our customers in their journey upwards.
Standard Chartered Climbing the Prosperity Ladder Page / 36
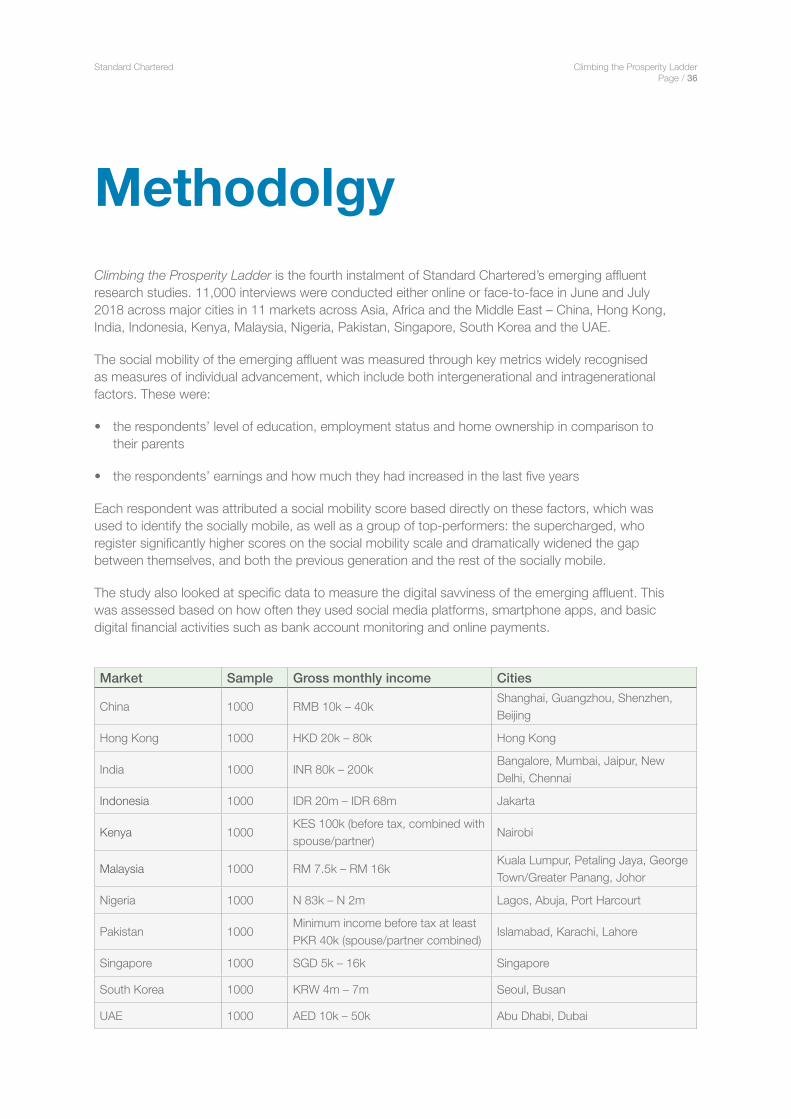
MethodolgyClimbing the Prosperity Ladder is the fourth instalment of Standard Chartered’s emerging affluent research studies. 11,000 interviews were conducted either online or face-to-face in June and July 2018 across major cities in 11 markets across Asia, Africa and the Middle East – China, Hong Kong, India, Indonesia, Kenya, Malaysia, Nigeria, Pakistan, Singapore, South Korea and the UAE.
The social mobility of the emerging affluent was measured through key metrics widely recognised as measures of individual advancement, which include both intergenerational and intragenerational factors. These were:
• the respondents’ level of education, employment status and home ownership in comparison to their parents
• the respondents’ earnings and how much they had increased in the last five years
Each respondent was attributed a social mobility score based directly on these factors, which was used to identify the socially mobile, as well as a group of top-performers: the supercharged, who register significantly higher scores on the social mobility scale and dramatically widened the gap between themselves, and both the previous generation and the rest of the socially mobile.
The study also looked at specific data to measure the digital savviness of the emerging affluent. This was assessed based on how often they used social media platforms, smartphone apps, and basic digital financial activities such as bank account monitoring and online payments.
Market Sample Gross monthly income Cities
China 1000 RMB 10k – 40kShanghai, Guangzhou, Shenzhen, Beijing
Hong Kong 1000 HKD 20k – 80k Hong Kong
India 1000 INR 80k – 200kBangalore, Mumbai, Jaipur, New Delhi, Chennai
Indonesia 1000 IDR 20m – IDR 68m Jakarta
Kenya 1000KES 100k (before tax, combined with spouse/partner)
Nairobi
Malaysia 1000 RM 7.5k – RM 16kKuala Lumpur, Petaling Jaya, George Town/Greater Panang, Johor
Nigeria 1000 N 83k – N 2m Lagos, Abuja, Port Harcourt
Pakistan 1000Minimum income before tax at least PKR 40k (spouse/partner combined)
Islamabad, Karachi, Lahore
Singapore 1000 SGD 5k – 16k Singapore
South Korea 1000 KRW 4m – 7m Seoul, Busan
UAE 1000 AED 10k – 50k Abu Dhabi, Dubai

Standard Chartered Climbing the Prosperity Ladder Page / 37
Appendix
Percentage of the socially mobile who own their home compared to their parents at the same age
Ave
rag
e
Chi
na
Ho
ng K
ong
Ind
ia
Ind
one
sia
Ken
ya
Mal
aysi
a
Nig
eria
Pak
ista
n
Sin
gap
ore
So
uth
Ko
rea
UA
E
Socially mobile 88% 95% 82% 90% 94% 86% 93% 77% 88% 91% 88% 91%
Parents of the socially mobile
78% 93% 68% 83% 82% 77% 83% 67% 81% 83% 63% 75%
Percentage of the emerging affluent whose top savings priority is their children’s education
Ave
rag
e
Chi
na
Ho
ng K
ong
Ind
ia
Ind
one
sia
Ken
ya
Mal
aysi
a
Nig
eria
Pak
ista
n
Sin
gap
ore
So
uth
Ko
rea
UA
E
My children’s education
16% 18% 12% 17% 19% 19% 16% 14% 18% 15% 9% 16%
Ave
rag
e
Chi
na
Ho
ng K
ong
Ind
ia
Ind
one
sia
Ken
ya
Mal
aysi
a
Nig
eria
Pak
ista
n
Sin
gap
ore
So
uth
Ko
rea
UA
E
- 61% 72% 48% 76% 71% 60% 64% 55% 67% 60% 42% 63%
Percentage of the emerging affluent who believe that managing their money digitally has helped them get closer to achieving their financial goals
Standard Chartered Climbing the Prosperity Ladder Page / 38
Ave
rag
e
Chi
na
Ho
ng K
ong
Ind
ia
Ind
one
sia
Ken
ya
Mal
aysi
a
Nig
eria
Pak
ista
n
Sin
gap
ore
So
uth
Ko
rea
UA
E
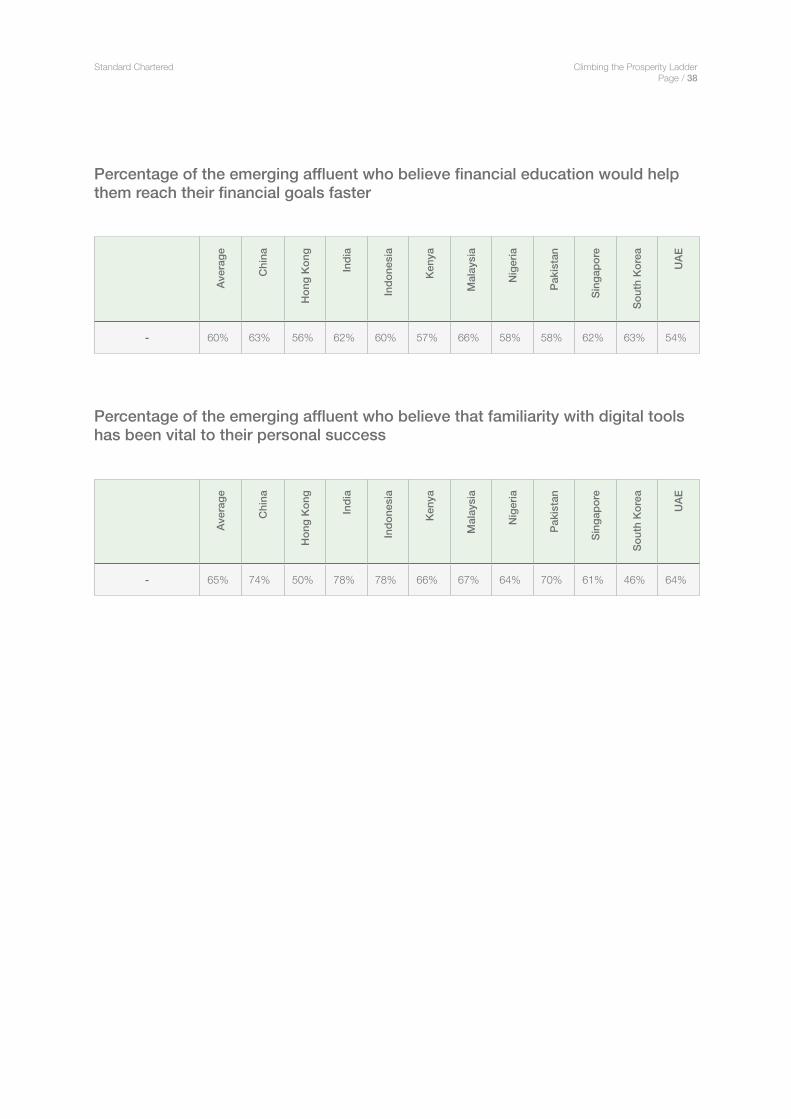
- 60% 63% 56% 62% 60% 57% 66% 58% 58% 62% 63% 54%
Ave
rag
e
Chi
na
Ho
ng K
ong
Ind
ia
Ind
one
sia
Ken
ya
Mal
aysi
a
Nig
eria
Pak
ista
n
Sin
gap
ore
So
uth
Ko
rea
UA
E
- 65% 74% 50% 78% 78% 66% 67% 64% 70% 61% 46% 64%
Percentage of the emerging affluent who believe financial education would help them reach their financial goals faster
Percentage of the emerging affluent who believe that familiarity with digital tools has been vital to their personal success

Standard Chartered Climbing the Prosperity Ladder Page / 39
Important information and disclosures
Standard Chartered Bank is incorporated in England with limited liability by Royal Charter 1853 Reference Number ZC18. The Principal Office of the Company is situated in England at 1 Basinghall Avenue, London, EC2V 5DD. Standard Chartered Bank is authorised by the Prudential Regulation Authority and regulated by the Financial Conduct Authority and Prudential Regulation Authority.
Banking activities may be carried out internationally by different Standard Chartered Bank branches, subsidiaries and affiliates (collectively “SCB”) according to local regulatory requirements. With respect to any jurisdiction in which there is a SCB entity, this document is distributed in such jurisdiction by, and is attributable to, such local SCB entity. Recipients in any jurisdiction should contact the local SCB entity in relation to any matters arising from, or in connection with, this document. Not all products and services are provided by all SCB entities.
This document is being distributed for general information only and it does not constitute an offer, recommendation or solicitation to enter into any transaction or adopt any hedging, trading or investment strategy, in relation to any securities or other financial instruments. This document is for general evaluation only, it does not take into account the specific investment objectives, financial situation or particular needs of any particular person or class of persons and it has not been prepared for any particular person or class of persons.
Investment products are not bank deposits or obligations of or guaranteed by Standard Chartered Bank or any of its subsidiaries unless specifically stated. Investment products are subject to investment risks, including the possible loss of the principal amount invested.
Predictions, projections or forecasts contained herein are not necessarily indicative of actual future events and are subject to change without notice. You are cautioned not to place undue reliance on such statements. Opinions, projections and estimates are solely those of SCB at the date of this document and subject to change without notice. Past performance is not indicative of future results and no representation or warranty is made regarding future performance. Any forecast contained herein as to likely future movements in rates or prices or likely future events or occurrences constitutes an opinion only and is not indicative of actual future movements in rates or prices or actual future events or occurrences (as the case may be). SCB makes no representation or warranty of any kind, express, implied or statutory regarding, but not limited to, the accuracy of this document or the completeness of any information contained or referred to in this document. This document is distributed on the express understanding that, whilst the information in it is believed to be reliable, it has not been independently verified by us. SCB accepts no liability and will not be liable for any loss or damage arising directly or indirectly (including special, incidental or consequential loss or damage) from your use of this document, howsoever arising, and including any loss, damage or expense arising from, but not limited to, any defect, error, imperfection, fault, mistake or inaccuracy with this document, its contents or associated services, or due to any unavailability of the document or any part thereof or any contents.
Copyright: Standard Chartered Bank 2018. Copyright in all materials, text, articles and information contained herein is the property of, and may only be reproduced with permission of an authorised signatory of, Standard Chartered Bank. Copyright in materials created by third parties and the rights under copyright of such parties are hereby acknowledged. Copyright in all other materials not belonging to third parties and copyright in these materials as a compilation vests and shall remain at all times copyright of Standard Chartered Bank and should not be reproduced or used except for business purposes on behalf of Standard Chartered Bank or save with the express prior written consent of an authorised signatory of Standard Chartered Bank. All rights reserved. © Standard Chartered Bank 2018.
Standard Chartered Climbing the Prosperity Ladder Page / 40
Market specific disclosures
China:
This document is being distributed in China by, and is attributable to, Standard Chartered Bank (China) Limited which is mainly regulated by China Banking Regulatory Commission (CBRC), State Administration of Foreign Exchange (SAFE), and People’s Bank of China (PBOC).
Hong Kong:
This document, except for any portion advising on or facilitating any decision on futures contracts trading, is being distributed in Hong Kong by, and is attributable to, Standard Chartered Bank (Hong Kong) Limited 渣打銀行(香港)有限公司 (CE#AJI614) which is regulated by the Hong Kong Monetary Authority and the Securities and Futures Commission in Hong Kong.
India:
SCB in its capacity of a distributor or referrer of Investment Products may offer advice which is incidental to its activity of distribution/referral. SCB will not be charging any fee/consideration for such advice and such advice should not be construed as ‘Investment Advice’ as defined in the Securities and Exchange Board of India (Investment Advisers) Regulations, 2013. The client can avail of the investment advisory services of SCB only upon (i) executing separate documents with the Investment Advisory Group of SCB for availing ‘Investment Advice’ (as defined in the Securities and Exchange Board of India (Investment Advisers) Regulations, 2013) from it; and (ii) paying specific fees (if applied by SCB) for such ‘Investment Advice’.
Indonesia:
This document is being distributed in Indonesia by Standard Chartered Bank Indonesia, which is a financial institution licensed, registered and supervised by Otoritas Jasa Keuangan. You shall seek specific advice from accountant, legal, financial or other professional adviser when dealing pursuant to this material.
Kenya:
Our Investment Products and Services are distributed by Standard Chartered Investment Services Limited, a wholly owned subsidiary of Standard Chartered Bank Kenya Limited (Standard Chartered Bank/the Bank) that is licensed by the Capital Markets Authority as a Fund Manager. Standard Chartered Bank Kenya Limited is regulated by the Central Bank of Kenya.
Malaysia:
This document is being distributed in Malaysia by Standard Chartered Bank Malaysia Berhad. Recipients in Malaysia should contact Standard Chartered Bank Malaysia Berhad in relation to any matters arising from, or in connection with, this document.
Nigeria:
This document is attributed in Nigeria to Standard Chartered Bank Nigeria Limited (Standard Chartered Bank). Our Investment Products and Services are distributed by Standard Chartered Bank under the licence and regulation of the Central Bank of Nigeria.
Pakistan:
This document is being distributed in Pakistan and is attributable and applicable to Standard Chartered Bank (Pakistan) Limited which is regulated by State Bank of Pakistan (SBP), Securities & Exchange Commission of Pakistan and governed under laws applicable in Pakistan.
Standard Chartered Climbing the Prosperity Ladder Page / 41
Singapore:
This document is being distributed in Singapore by, and is attributable to, Standard Chartered Bank (Singapore) Limited (“SCBSL”). Recipients in Singapore should contact SCBSL in relation to any matters arising from, or in connection with, this document. SCBSL is an indirect wholly-owned subsidiary of Standard Chartered Bank and is licensed to conduct banking business in Singapore under the Singapore Banking Act, Chapter 19.
In relation to any fixed income and structured securities referred to in this document (if any), this document together with the issuer documentation shall be deemed an information memorandum (as defined in section 275 of the SFA). It is intended for distribution to accredited investors, as defined in section 4A of the SFA, or on terms that the securities may only be acquired at a consideration of not less than S$200,000 (or its equivalent in a foreign currency) for each transaction.
Further, in relation to fixed income and structured securities mentioned (if any), neither this document nor the Issuer Documentation have been, and will not be, registered as a prospectus with the Monetary Authority of Singapore under the SFA. Accordingly, this document and any other document or material in connection with the offer or sale, or invitation for subscription or purchase, of the product may not be circulated or distributed, nor may the product be offered or sold, or be made the subject of an invitation for subscription or purchase, whether directly or indirectly, to persons other than a relevant person pursuant to section 275(1) of the SFA, or any person pursuant to section 275(1A) of the SFA, and in accordance with the conditions, specified in section 275 of the SFA, or (iii) pursuant to, and in accordance with the conditions of, any other applicable provision of the SFA.
Singapore dollar deposits of non-bank depositors are insured by the Singapore Deposit Insurance Corporation, for up to S$50,000 in aggregate per depositor per Scheme member by law. Foreign currency deposits, dual currency investments, structured deposits and other investment products are not insured.
UAE:
DIFC - Standard Chartered Bank, Dubai International Financial Centre (SCB DIFC) having its offices at Dubai International Financial Centre, Building 1, Gate Precinct, P.O. Box 999, Dubai, UAE is a branch of Standard Chartered Bank and is regulated by the Dubai Financial Services Authority (“DFSA”). This document is intended for use only by Professional Clients and is not directed at Retail Clients as defined by the DFSA Rulebook. In the DIFC we are authorized to provide financial services only to clients who qualify as Professional Clients and Market Counterparties and not to Retail Clients. As a Professional Client you will not be given the higher retail client protection and compensation rights and if you use your right to be classified as a Retail Client we will be unable to provide financial services and products to you as we do not hold the required license to undertake such activities. For Islamic transactions, we are acting under the supervision of our Shariah Supervisory Committee. Relevant information on our Shariah Supervisory Committee is currently available on the Standard Chartered Bank website in the Islamic banking section here.
For residents of the UAE – Standard Chartered Bank UAE does not provide financial analysis or consultation services in or into the UAE within the meaning of UAE Securities and Commodities Authority Decision No. 48/r of 2008 concerning financial consultation and financial analysis.

Standard Chartered Climbing the Prosperity Ladder Page / 42