Embed Size (px)
DESCRIPTION
Climatological Estimates of Greenland Ice Sheet Sea Level Contributions: Recent Past and Future. J. E. Box Byrd Polar Research Center. Understanding Sea-level Rise and Variability WCRP Workshop Global Earth Observation System of Systems (GEOSS) - PowerPoint PPT Presentation
Citation preview

Climatological Climatological Estimates of Estimates of
Greenland Ice Sheet Greenland Ice Sheet Sea Level Sea Level
Contributions: Contributions: Recent Past and Recent Past and
FutureFutureJ. E. BoxJ. E. Box
Byrd Polar Research CenterByrd Polar Research Center
Understanding Sea-level Rise and VariabilityUnderstanding Sea-level Rise and Variability
WCRP Workshop WCRP Workshop
Global Earth Observation System of Systems (GEOSS)Global Earth Observation System of Systems (GEOSS)
UNESCO, Place Fontenoy - Paris, France (Room XII)UNESCO, Place Fontenoy - Paris, France (Room XII)
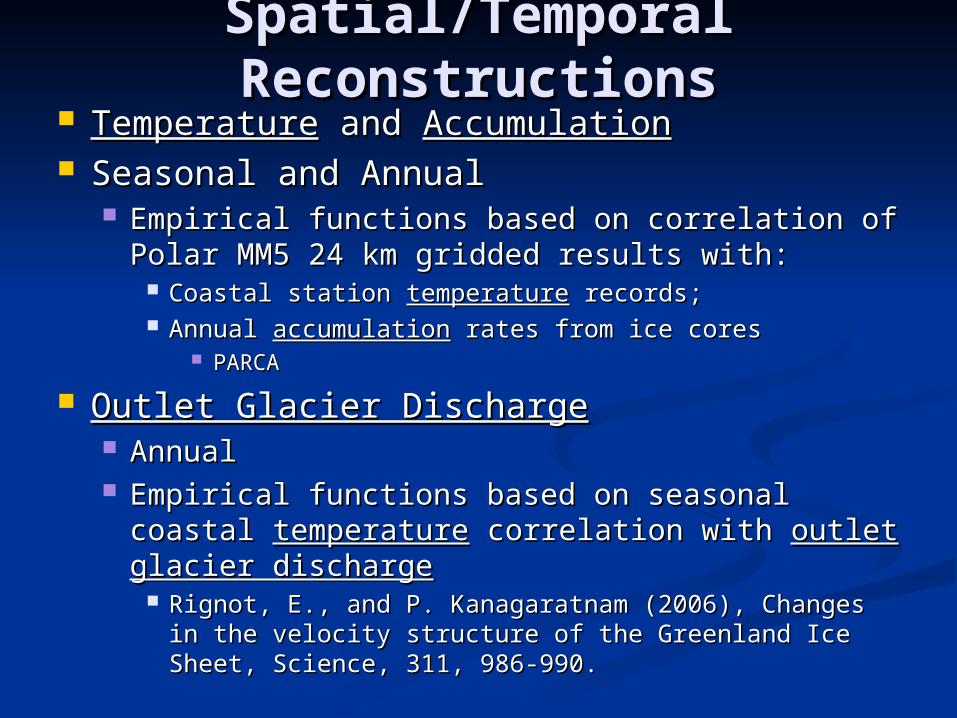
Spatial/Temporal Spatial/Temporal ReconstructionsReconstructions
TemperatureTemperature and and AccumulationAccumulation Seasonal and Annual Seasonal and Annual
Empirical functions based on correlation of Empirical functions based on correlation of Polar MM5 24 km gridded results with:Polar MM5 24 km gridded results with:
Coastal station Coastal station temperaturetemperature records; records; Annual Annual accumulationaccumulation rates from ice cores rates from ice cores
PARCA PARCA
Outlet Glacier DischargeOutlet Glacier Discharge Annual Annual Empirical functions based on seasonal coastal Empirical functions based on seasonal coastal
temperaturetemperature correlation with correlation with outlet glacier outlet glacier dischargedischarge
Rignot, E., and P. Kanagaratnam (2006), Changes in Rignot, E., and P. Kanagaratnam (2006), Changes in the velocity structure of the Greenland Ice Sheet, the velocity structure of the Greenland Ice Sheet, Science, 311, 986-990.Science, 311, 986-990.

Temperature Temperature RecordsRecords
* Vinther, B. M., K. K. Andersen, P. D. Jones, K. R. Briffa and J. Cappelen, Extending Greenland Temperature Records into the late 18th Century, doi:10.1029/2005JD006810, JGR, in press 2006.
** GISTEMP (NASA), Hansen et al.
WMO ID Station Name Time Span Source4202 Pituffik/Tule 1847-2005 **4220 Aasiaat/Egedesminde 1951-2005 **4250 Nuuk/Godthab 1748-2005 *
04216 / 04221 Ilulissat/Jakobshavn 1804-2005 *4320 Danmarkshavn 1951-2005 **4390 Pr. Christian Sund 1950-2005 **4360 Tasiilaq/Ammassalik 1895-2005 **
• Coastal
• Monthly, Seasonal, Annual


Polar Polar MM5MM5Polar Polar MM5MM5
- Bromwich D.H., J. Cassano, T. Klein, G. Heinemann, K. Hines, K. Steffen, and J. E. Box, 2001: Mesoscale modeling of katabatic winds over Greenland with the Polar MM5, Monthly Weather Review, 129(9), 2290-2309.
- Cassano, J., J.E. Box, D.H. Bromwich, L. Li, and K. Steffen, 2001: Verification of Polar MM5 simulations of Greenland's atmospheric circulation, Journal of Geophysical Research, 106(D24), 33867-33890.
- Box, J.E., D. H. Bromwich, L-S Bai, 2004: Greenland ice sheet surface mass balance for 1991-2000: application of Polar MM5 mesoscale model and in-situ data, J. Geophys. Res., Vol. 109, No. D16, D16105, 10.1029/2003JD004451
- Box, J.E., D.H. Bromwich, B.A. Veenhuis, L-S Bai, J.C. Stroeve, J.C. Rogers, K. Steffen, T. Haran, S-H Wang, Greenland ice sheet surface mass balance variability (1988-2004) from calibrated Polar MM5 output, J. Climate, accepted Sept 27 2005.

Polar MM5 DomainsPolar MM5 DomainsPolar MM5 DomainsPolar MM5 Domains

Y Psolid Pliquid E QS C M R B AAR
1988 629 19 70 37 522 405 302 221 0.83
1989 607 24 67 32 508 488 356 152 0.8
1990 639 19 69 31 538 544 426 112 0.77
1991 653 19 63 33 556 494 364 192 0.8
1992 633 11 64 36 533 282 201 331 0.87
1993 616 25 56 32 528 488 377 150 0.78
1994 578 22 60 36 482 423 320 162 0.8
1995 584 23 63 36 484 531 416 68 0.77
1996 679 22 58 40 580 404 299 281 0.85
1997 663 25 67 36 560 520 394 166 0.8
1998 616 26 71 36 509 635 510 -1 0.74
1999 631 23 62 33 536 470 347 189 0.81
2000 645 35 62 34 549 524 395 154 0.8
2001 681 24 60 28 593 485 367 226 0.81
2002 673 27 64 31 579 610 443 136 0.76
2003 710 37 65 32 613 628 483 130 0.77
2004 658 29 72 33 554 536 403 151 0.79
2005 699 30 82 35 583 699 545 37 0.74
Mean 641 24 64 34 543 498 377 166 0.80
Min 578 11 56 28 482 282 201 -1 0.74
Max 710 37 82 40 613 699 545 331 0.87
Range 132 26 26 12 131 417 344 332 0.13
Polar MM5 Mass Budget Results (1988-Polar MM5 Mass Budget Results (1988-2005)2005)
NEWNEW
Box, J.E., D.H. Bromwich, B.A. Box, J.E., D.H. Bromwich, B.A. Veenhuis, L-S Bai, J.C. Stroeve, J.C. Veenhuis, L-S Bai, J.C. Stroeve, J.C. Rogers, K. Steffen, T. Haran, S-H Rogers, K. Steffen, T. Haran, S-H Wang, 2006, Greenland Ice Sheet Wang, 2006, Greenland Ice Sheet Surface Mass Balance Variability Surface Mass Balance Variability (1988-2004) from Calibrated Polar (1988-2004) from Calibrated Polar MM5 Output, J. Climate, 19 (12), MM5 Output, J. Climate, 19 (12), 2783-2800 2783-2800

Methods: Statistical Methods: Statistical RegressionRegression Explanatory (‘independent’) variablesExplanatory (‘independent’) variables
long term record, such as coastal station temperatures or long term record, such as coastal station temperatures or ice core accumulation ratesice core accumulation rates
‘‘dependent’ variablesdependent’ variables Polar MM5 temperaturePolar MM5 temperature Polar MM5 accumulation ratePolar MM5 accumulation rate Polar MM5 training periodPolar MM5 training period
1988-2005, (N = 18), Currently1988-2005, (N = 18), Currently 1958-2005, (N = 48), before July 20061958-2005, (N = 48), before July 2006
Determine highest correlation rank for each grid Determine highest correlation rank for each grid cell vs explanatory datacell vs explanatory data
Store regression coefficients (slope and intercept) Store regression coefficients (slope and intercept) for the top two ranked sites for each grid cellfor the top two ranked sites for each grid cell
Use full instrumental record to reconstruct Use full instrumental record to reconstruct dependent variablesdependent variables Temperature, Accumulation, outlet glacier dischargeTemperature, Accumulation, outlet glacier discharge ice sheet temperaturesice sheet temperatures 1873-2004 available for annual means, (N = 132)1873-2004 available for annual means, (N = 132) seasonal means ultimatelyseasonal means ultimately

HypothesesHypotheses Surface Mass BalanceSurface Mass Balance
Ice cores can represent the spatial/temporal patterns of Ice cores can represent the spatial/temporal patterns of accumulation rate on annual to century timescalesaccumulation rate on annual to century timescales
Seasonal and annual temperatures explain seasonal to Seasonal and annual temperatures explain seasonal to interannual the spatial/temporal patterns of glacial melt interannual the spatial/temporal patterns of glacial melt water production and runoff water production and runoff
Glacier DischargeGlacier Discharge ““There is an ice dynamics response to short term There is an ice dynamics response to short term
(monthly to inter-annual) surface climate”(monthly to inter-annual) surface climate” Glacier discharge sensitivity to temperature is a useful Glacier discharge sensitivity to temperature is a useful
predictor of past and future solid ice flux to oceanspredictor of past and future solid ice flux to oceans Total Ice Sheet Mass Budgets and Global Eustatic Total Ice Sheet Mass Budgets and Global Eustatic
Sea Level ForcingSea Level Forcing Exploitation of significant correlations of surface mass Exploitation of significant correlations of surface mass
balance and outlet glacier discharge provide useful balance and outlet glacier discharge provide useful estimates of ice sheet sea level forcing on annual to estimates of ice sheet sea level forcing on annual to century time scalescentury time scales

Primary Secondary
Summer CorrelationSummer Correlation

Two Site Seasonal Two Site Seasonal Temperature CorrelationsTemperature Correlations

Seasonal Temperature Seasonal Temperature Reconstruction ResultsReconstruction Results

Seasonal Temperature Seasonal Temperature ReconstructionValidationReconstructionValidation

Linear Trend: +0.045 C/ decadeLinear Trend: +0.045 C/ decade, 0.6 K increase over 132 years0.6 K increase over 132 years, r =0.380r =0.380
Annual Temperature Annual Temperature ReconstructionReconstruction

1873-2004 mean: 1873-2004 mean: -13.16 C -13.16 C Linear Trend:Linear Trend: ++0.0530.053 C/ decade, 0.7 K increase over 132 years, C/ decade, 0.7 K increase over 132 years, r = r =
0.4720.472
Annual Temperature Annual Temperature ReconstructionReconstruction

Runoff Reconstruction Runoff Reconstruction (1866-2005)(1866-2005)
Based on Greenland Summer (JJA) Temperature Vs. Based on Greenland Summer (JJA) Temperature Vs. Polar MM5 RunoffPolar MM5 Runoff

Surface Mass Balance Surface Mass Balance Reconstruction (1866-2005)Reconstruction (1866-2005)
Using summer (JJA) temperature, R2 = 0.75

Greenland Ice Sheet Mass Greenland Ice Sheet Mass Budget Implications of Budget Implications of
Climate WarmingClimate Warming RunoffRunoff +384 km+384 km33 y y-1-1 K K-1-1
sensitivitysensitivity 1988-2005 baseline = 243 Gt y1988-2005 baseline = 243 Gt y-1-1
RR22 = 0.673 = 0.673 A 1K global temperature anomaly suggests a runoff of 627 kmA 1K global temperature anomaly suggests a runoff of 627 km33 y y-1-1
AccumulationAccumulation +102 km+102 km33 y y-1-1 K K-1-1
sensitivitysensitivity 1988-2005 baseline = 507 km1988-2005 baseline = 507 km33 y y-1-1
RR22 = 0.237 = 0.237 Surface Mass BudgetSurface Mass Budget
-282 km-282 km33 y y-1-1 K K-1-1 sensitivitysensitivity
1988-2005 baseline = 264 km1988-2005 baseline = 264 km33 y y-1-1
RR22 = 0.380 = 0.380 A 1K global temperature anomaly suggests a -18 kmA 1K global temperature anomaly suggests a -18 km33 y y-1-1 surface mass surface mass
balancebalance Negative surface mass budget if global climate warms additional 0.33 Negative surface mass budget if global climate warms additional 0.33
KK 1994-2005 global T anomaly 0.442 K (with respect to 1961-1990) base 1994-2005 global T anomaly 0.442 K (with respect to 1961-1990) base
periodperiod 2005 global T anomaly 0.667 K (with respect to 1961-1990) base period2005 global T anomaly 0.667 K (with respect to 1961-1990) base period

Surface Mass Balance Surface Mass Balance Reconstruction (1866-2005)Reconstruction (1866-2005)
Using summer (JJA) temperature, R2 = 0.75

Sea Level Contribution Sea Level Contribution Reconstructions: 1873-2004Reconstructions: 1873-2004
D Constant 1996-2005JJA Discharge,SMBANN Discharge,SMBANN Discharge,SMB nonlinear
(Const. D, Ann. SMB), (nonlin. D, Ann. SMB)1920-1930: 0.66 mm y-1 , 0.82 mm y-1
1960-1970: 0.58 mm y-1 , 0.59 mm y-1
1994-2004: 0.64 mm y-1 , 0.74 mm y-1
1873-2004: 0.64 mm y-1 , 0.74 mm y-1
Sea Level Contribution Sea Level Contribution Reconstructions: 1873-2004Reconstructions: 1873-2004

ConclusionsConclusions Warming over the recent decade produced large positive melt Warming over the recent decade produced large positive melt
anomalies, yet, climatological reconstruction suggests recent anomalies, yet, climatological reconstruction suggests recent summer melt is not unprecedented, warm summers in 1950s and summer melt is not unprecedented, warm summers in 1950s and 1930s1930s
Surface mass budget sensitivity to global temperature anomalies Surface mass budget sensitivity to global temperature anomalies suggest that the Greenland Ice Sheet surface mass budget would suggest that the Greenland Ice Sheet surface mass budget would become negative for a 1K global temperature anomaly.become negative for a 1K global temperature anomaly. 1994-2005 global temperature anomaly = 0.66 K 1994-2005 global temperature anomaly = 0.66 K Past warming trends suggest this threshold reached within Past warming trends suggest this threshold reached within
next 30-60 years.next 30-60 years. Overall ice sheet mass budget would be ~-300 kmOverall ice sheet mass budget would be ~-300 km33
yy-1-1
A model that accounts for temperature thresholds in outlet A model that accounts for temperature thresholds in outlet glacier discharge produces a ~30% larger sea level contribution glacier discharge produces a ~30% larger sea level contribution that one with discharge that is invariant with melt water fluxthat one with discharge that is invariant with melt water flux
Correlation analysis suggests a link between outlet glacier Correlation analysis suggests a link between outlet glacier discharge and air temperature discharge and air temperature Future sea level contribution should therefore be more than Future sea level contribution should therefore be more than
30% greater than recent estimates from Rignot and 30% greater than recent estimates from Rignot and Kanagaratnam (2006).Kanagaratnam (2006).
This model is very sensitive to the temperature threshold This model is very sensitive to the temperature threshold used.used.
The temperature thresholds are unknown, but can be The temperature thresholds are unknown, but can be evaluated with historic temperature and discharge data.evaluated with historic temperature and discharge data.

QuestionsQuestions
What mechanisms are most likely to What mechanisms are most likely to lead to outlet glacier surge in lead to outlet glacier surge in response to warming?response to warming?
What temperature threshold causes What temperature threshold causes outlet glacier to surge?outlet glacier to surge?