Embed Size (px)
Citation preview

Climate Change/Non-‐Sta1onarity/Extreme Events What This Means to Prac11oners Jeanine Jones, California Department of Water Resources

California a Leader in Climate Change Adapta1on
• Enactment or adop-on of statues, regula-ons, execu-ve orders
• Publica-on of state-‐level assessments, guidance , support of research
• For water sector: – Supply impacts characterized (e.g., snowmelt)
– NRC sea level rise study underway – Extreme events/flood hydrology, the next challenge

DWR’s Role – Climate Change & Extreme Events
• Guidance to CAT (e.g. flood frequency analysis)
• Flood project opera-ons & emergency response
• State-‐level flood planning, including flood plain management
• Data collec-on, dissemina-on, analysis • Assistance to local agencies

Workshop Goals
• Science that (eventually) facilitates adapta-on • Iden-fica-on of low-‐hanging fruit, longer-‐term objec-ves
• Outcomes that can (eventually) be incorporated in guidance or standards of prac-ce
• Roadmap for making incremental progress

Flood Hydrology Applica1ons
• Infrastructure design & analysis • Flood frequency analyses • PMP/PMF
• Flood control project opera-ons • Flood forecas-ng and rou-ng
• Hazard mapping (eg, FIRMs) • Floodplain management • Coastal inunda-on mapping

Flood Hydrology Informa1on Needs
• Vary with applica-on • Vary with -me period of analysis
• Vary with importance of facility or infrastructure
• Vary with design life of facility or infrastructure
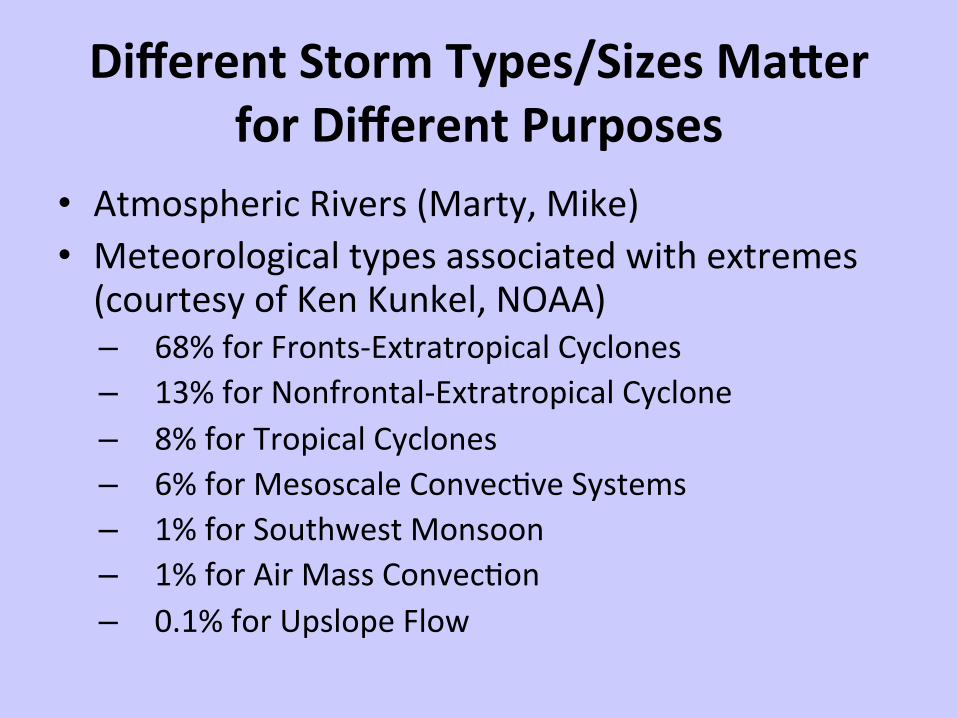
Different Storm Types/Sizes MaRer for Different Purposes
• Atmospheric Rivers (Marty, Mike) • Meteorological types associated with extremes (courtesy of Ken Kunkel, NOAA) – 68% for Fronts-‐Extratropical Cyclones – 13% for Nonfrontal-‐Extratropical Cyclone – 8% for Tropical Cyclones – 6% for Mesoscale Convec-ve Systems – 1% for Southwest Monsoon – 1% for Air Mass Convec-on – 0.1% for Upslope Flow

Flood Hydrology Limita1ons • Observed records o_en rela-vely short, don’t capture extreme events
• WRT runoff, non-‐sta-onarity not limited to climate change – land use changes, for example, (urbaniza-on) can confound observed record
• Accurate floodplain mapping constrained by addi-onal factors (e.g. topo mapping) (see NRC, 2009)
• Key hydrologic data sets & analy-cal methodologies are not being updated
• Hydrology research not keeping pace with climate science

From Mike Anderson, CDWR

Adding Climate Change to the Mix
• What does extremes get more extreme really mean?
• And how quickly do they get more extreme?
• And what do we do about it?
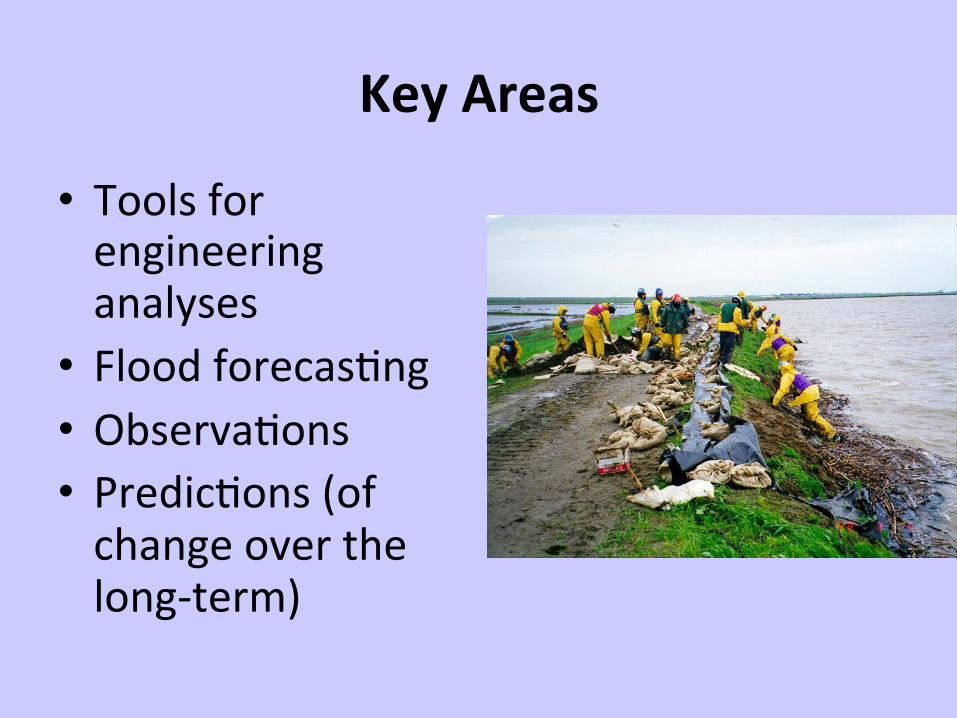
Key Areas
• Tools for engineering analyses • Flood forecas-ng • Observa-ons • Predic-ons (of change over the long-‐term)

Tools for Engineering Analyses
• Flood frequency analysis, long-‐standing tradi-onal sta-s-cal approach
• PMP, theore-cally the greatest depth of precipita-on for a given dura-on that is physically possible over a given drainage basin at a given -me of year
• Both of these approaches are codified in federal agency publica-ons

Flood Frequency Analysis • 1961, Water Res. Council
Proposed • 1966, Bulle-n 13 • 1966, House Doc. 465 • 1967, Bulle-n 15 • 1976, Bulle-n 17 • 1977, Bulle-n 17A • 1982, Bulle-n 17B • 1983, WRC abolished • 2001, ACWI H-‐FAWG
source: Robert Mason, USGS

FFA & Climate Change
• Bulle-n 17B not updated since 1982 to include subsequent observa-ons. An update now in process; neither the original nor the update address climate change.
• Bulle-n 17B is a de facto standard of prac-ce na-onally, its approach is widely used for public works, highways, stormwater, flood control design, floodplain mapping
• Revising this approach to address climate change is a priority, has significant policy implica-ons


PMP Es1ma1on
• From series of NOAA Hydromet reports (next slide)
• Dates of reports varies (CA is 1998-‐99), not being updated (unfunded)
• Climate change not covered in exis-ng reports, no current plans for addressing
• PMP analysis is de facto standard of prac-ce for major infrastructure such as dams


PMP & Climate Change, Does it MaRer? Example analysis from Ken Kunkel, NOAA
• Urbana, Illinois – By 2100, range of maximum precipita-on: Ø For 6 hours rises from 27 inches to 30-‐40 inches
Ø Over 72 hours, the maximum rises from 39 inches to 43-‐59 inches

Flood Forecas1ng
• Used for opera-on of flood control projects (not limited to Central Valley, applies to flood control projects statewide), informa-on for emergency responders
• Improved understanding of ARs very promising
• Necessary for forecast-‐based reservoir opera-ons
• High poten-al as early adapta-on tool

Observa1ons
Uses • Support flood opera-ons
• Improve understanding of processes
• Feed into improving predic-ons & forecasts
• Iden-fy -pping points/changes of state
Unmet needs? • What are important gaps – geographic, types of observa-ons, etc?
• What will we need 50 years from now?

Climate Predic1ons
• All ques-ons, no answers! • How might observed flood frequency distribu-ons shi_ in the future?
• Is there a change in occurrence of storm types (ARs, rain on snow events)?
• When do significant changes start occurring? • Can factors affec-ng coastal inunda-on be modeled (e.g., increased wave height/run-‐up during storms)?

PuYng Climate Change & Extreme Events into Perspec1ve
• Long lead -mes required to ins-tute new standards of engineering prac-ce, or defensible guidance
• Prac--oners make decisions under uncertainty every day
• Many exis-ng tradi-onal tools to manage risk associated with extreme events, e.g. – Engineering safety factors – Adop-on of regula-ons – Zoning/floodplain management – etc

Exis1ng Regulatory Environment
• FEMA flood maps • EPA stormwater permiong • USACE reservoir rule curves, water control manuals
• State dam safety requirements
Approaches in the Longer-‐Term
• Build on exis-ng regula-ons or policy guidance (CEQ, NEPA, CEQA, P&G)
• Develop coali-ons of user groups (e.g. WSWC, ASCE, APWA, ASFPM, AMS)
• Support development of new/updated federal technical manuals & guidance

Next Steps Now
• Brainstorm, test ideas • Scope of work for low-‐hanging fruit • Road map for longer-‐term ac-vi-es