Embed Size (px)
Citation preview

Climate Vulnerability Map of Rome 1.0 Simone Ombuen
Department of Architecture, University of Roma Tre
The extreme rain event of 2014.01.31 in Rome
Cumulated mm. of rain in hours
Rilevamento di 12:00 18:00 21:00 24:00
Monte Mario 153,8 167,0 173,4 181,8
Flaminio 106,8 115,8 122,4 129,6
Massimina 135,8 150,0 157,4 166,0
Riano 139,0 160,0 167,2 177,6
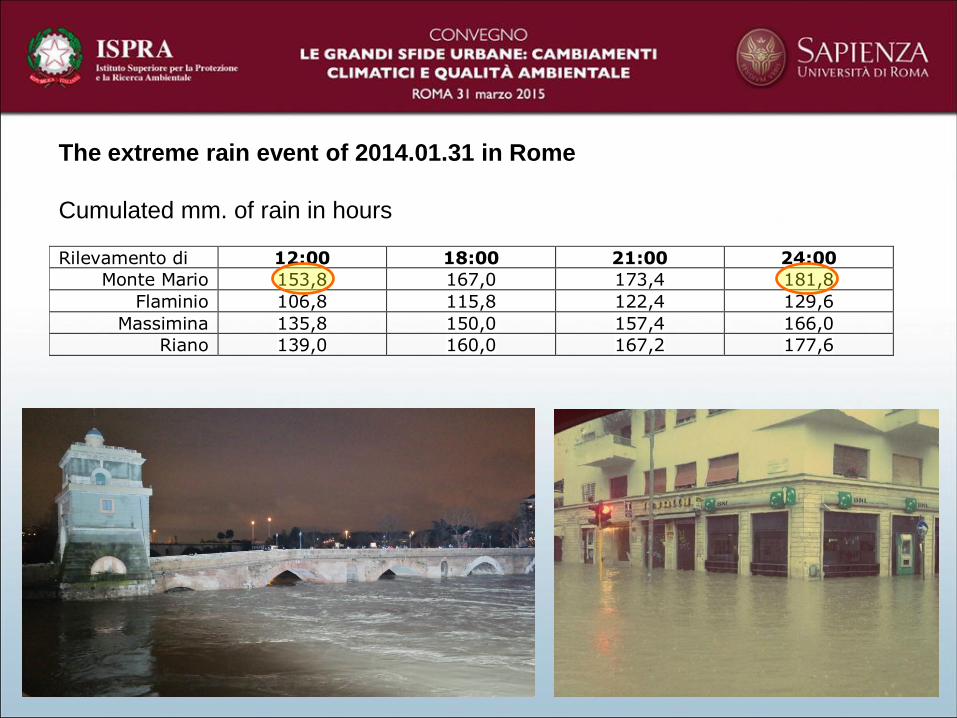
The extreme rain event of 2014.01.31 in Rome - Labaro
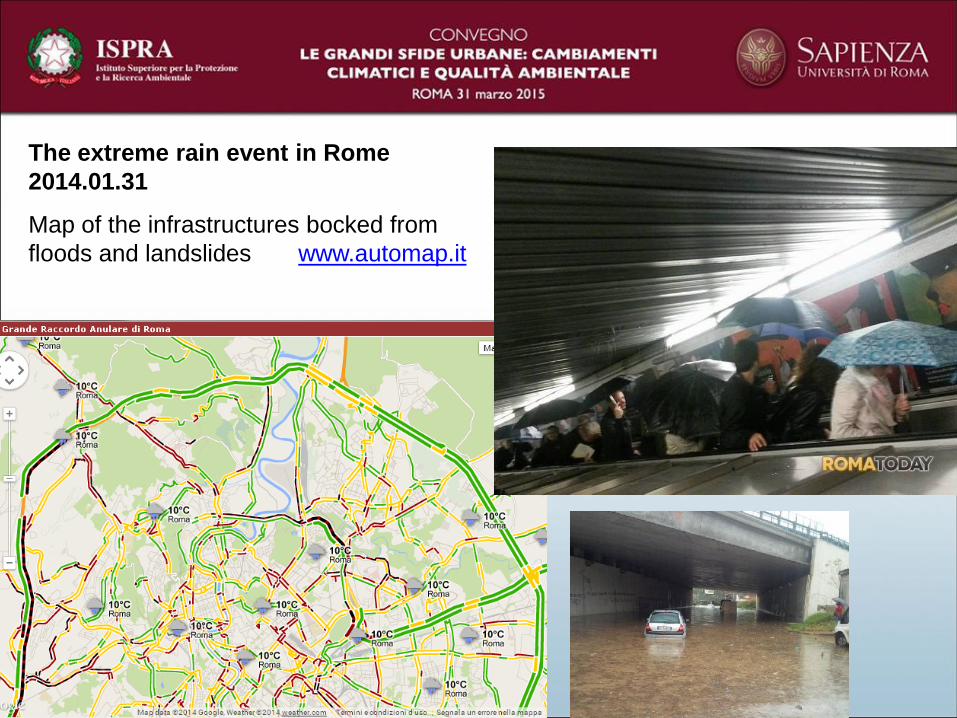
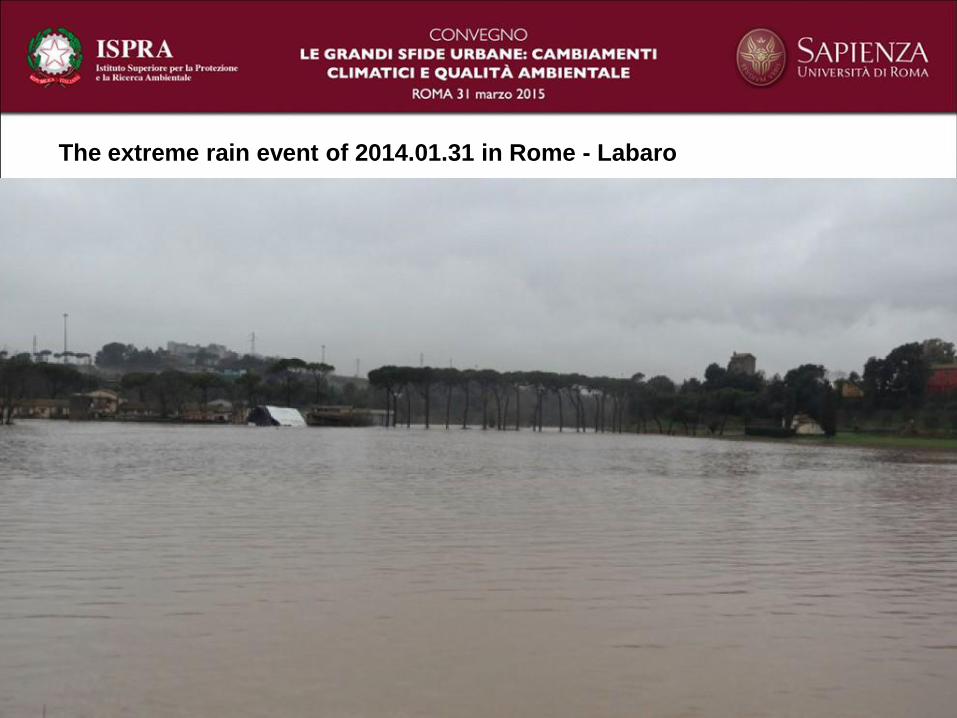
The extreme rain event in Rome
2014.01.31
Map of the infrastructures bocked from
floods and landslides www.automap.it
Research group DARC Università degli studi Roma Tre: A. Filpa, S. Ombuen, L. Barbieri, F. Benelli, F. Camerata, V. Pellegrini
Research group ENEA UTMEA : F. Borfecchia, E. Caiaffa, M. Pollino, L. De Cecco, S. Martini, L. La Porta
CVMR 1.0 Climate Vulnerability Map of Rome 1.0
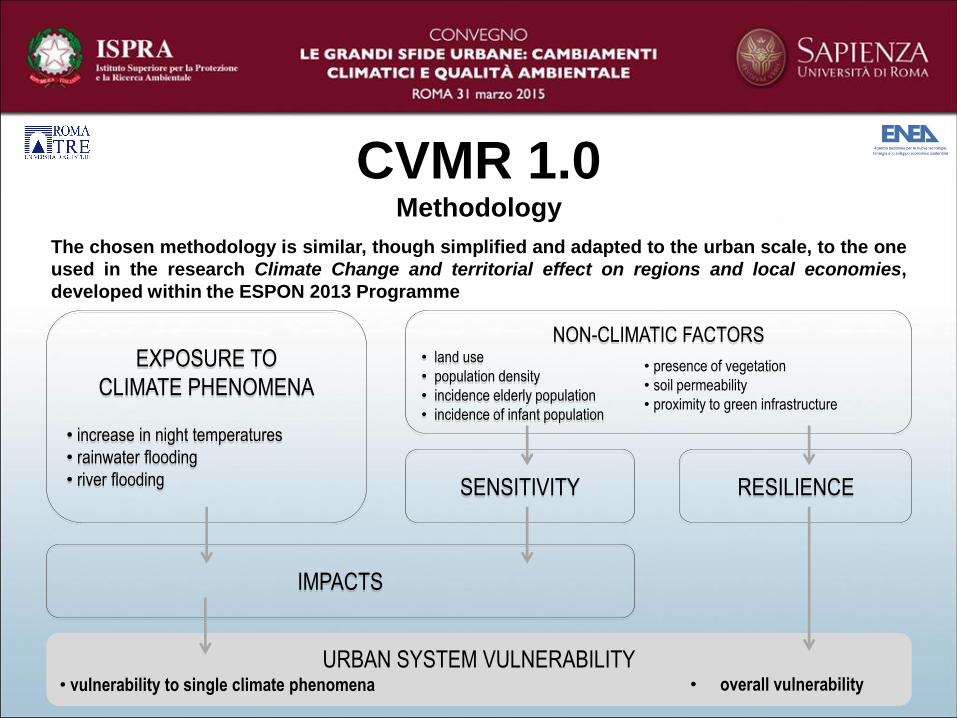
CVMR 1.0 Methodology
EXPOSURE TO
CLIMATE PHENOMENA
• increase in night temperatures
• rainwater flooding
• river flooding
NON-CLIMATIC FACTORS • land use
• population density
• incidence elderly population
• incidence of infant population
• presence of vegetation
• soil permeability
• proximity to green infrastructure
SENSITIVITY RESILIENCE
IMPACTS
URBAN SYSTEM VULNERABILITY • vulnerability to single climate phenomena • overall vulnerability
The chosen methodology is similar, though simplified and adapted to the urban scale, to the one
used in the research Climate Change and territorial effect on regions and local economies,
developed within the ESPON 2013 Programme

CVMR 1.0 Spatial Units (SU)
The identified Spatial Units to
build up the CVMR 1.0 are the
minimum spatial subdivisions
of the built-up environment of
Rome.
They are obtained
intersecting:
-the Land Cover Map of
Regione Lazio, able to render
the building density and
continuity characteristics;
- the MultiNet road network
database, useful for further
subdividing the above land
cover units in order to obtain
a finer result.
MultiNet road network
database Land Cover Map of
Regione Lazio
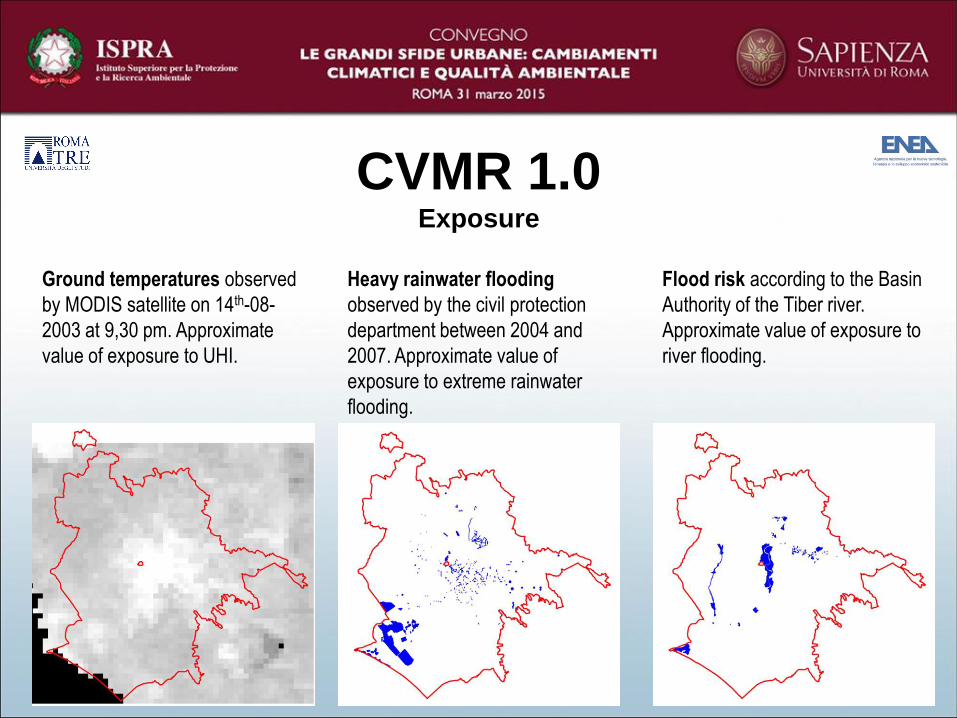
CVMR 1.0 Exposure
Ground temperatures observed
by MODIS satellite on 14th-08-
2003 at 9,30 pm. Approximate
value of exposure to UHI.
Heavy rainwater flooding
observed by the civil protection
department between 2004 and
2007. Approximate value of
exposure to extreme rainwater
flooding.
Flood risk according to the Basin
Authority of the Tiber river.
Approximate value of exposure to
river flooding.
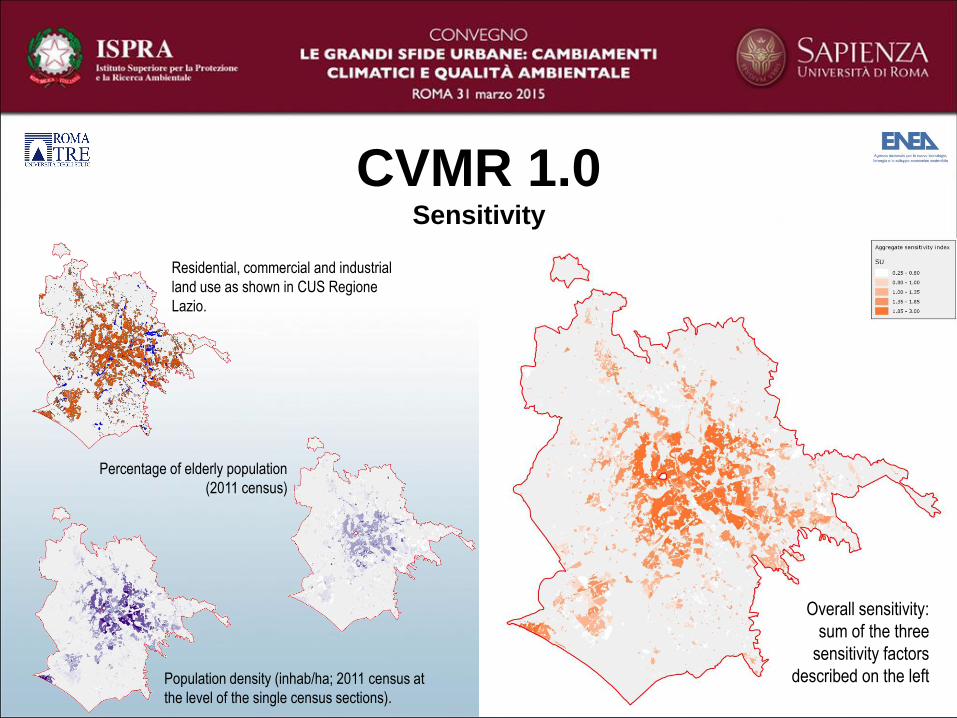
CVMR 1.0 Sensitivity
Percentage of elderly population
(2011 census)
Population density (inhab/ha; 2011 census at
the level of the single census sections).
Residential, commercial and industrial
land use as shown in CUS Regione
Lazio.
Overall sensitivity:
sum of the three
sensitivity factors
described on the left
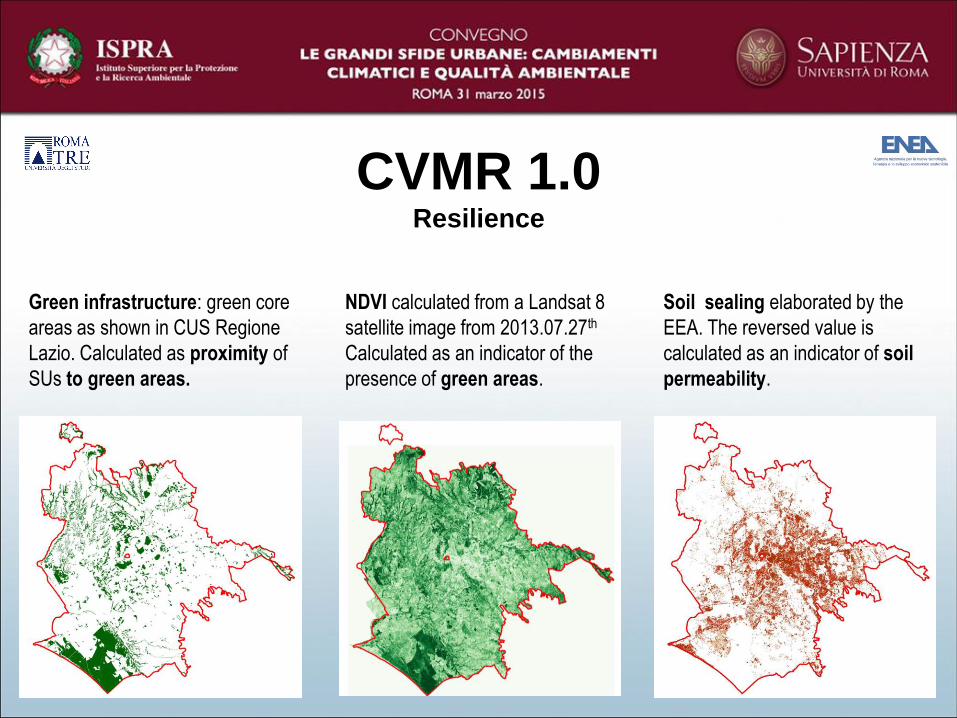
CVMR 1.0 Resilience
Green infrastructure: green core
areas as shown in CUS Regione
Lazio. Calculated as proximity of
SUs to green areas.
NDVI calculated from a Landsat 8
satellite image from 2013.07.27th
Calculated as an indicator of the
presence of green areas.
Soil sealing elaborated by the
EEA. The reversed value is
calculated as an indicator of soil
permeability.

CVMR 1.0 Vulnerability
Vulnerability to high temperatures:
calculated by multiplying exposure
to high temperatures by overall
sensitivity and resilience.
Vulnerability to heavy rainwater
floodings: calculated multiplying
exposure to rainwater flooding by
overall sensitivity and resilience.
Vulnerability to river flooding:
calculated multiplying exposure to
river flooding by overall sensitivity
and resilience.
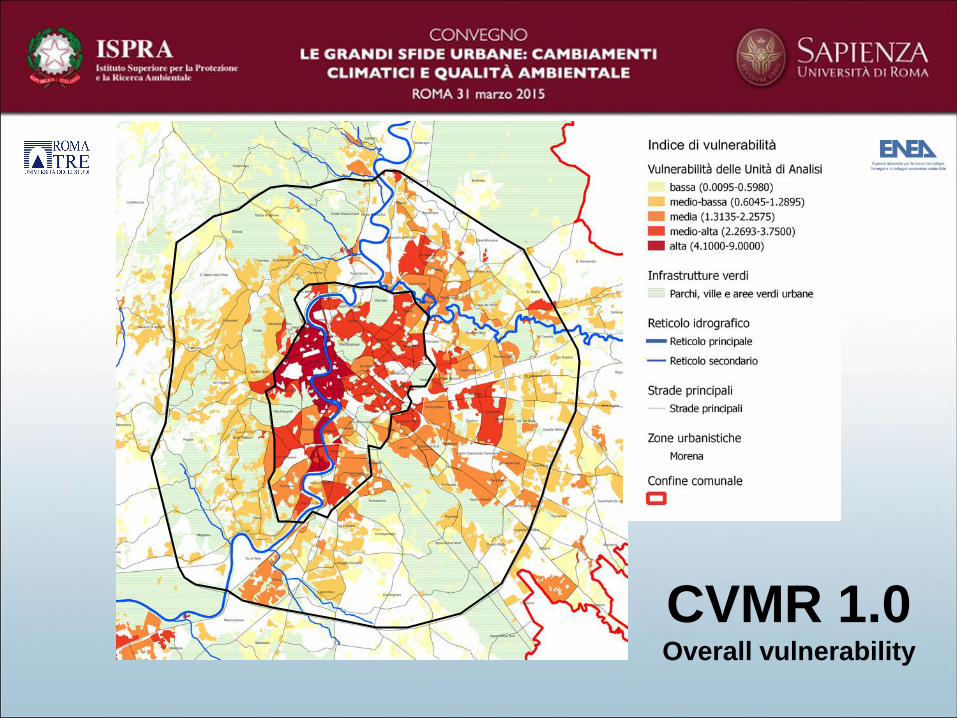
CVMR 1.0 Overall vulnerability

CVMR 1.0 Focus on transport infrastructure
A strand of this research focuses on transport infrastructure vulnerability:
Based on the 31st Jan 2014 extreme rain event, which points of the public transport network were disrupted?
• Info retrieved through local transport agencies tweets (disruption warnings) we localised where the network was
disrupted
• Between 6am and 10am (rush hour) more than 30 tweets
In the picture: Disrupted areas versus flooded areas (see slide on exposure)
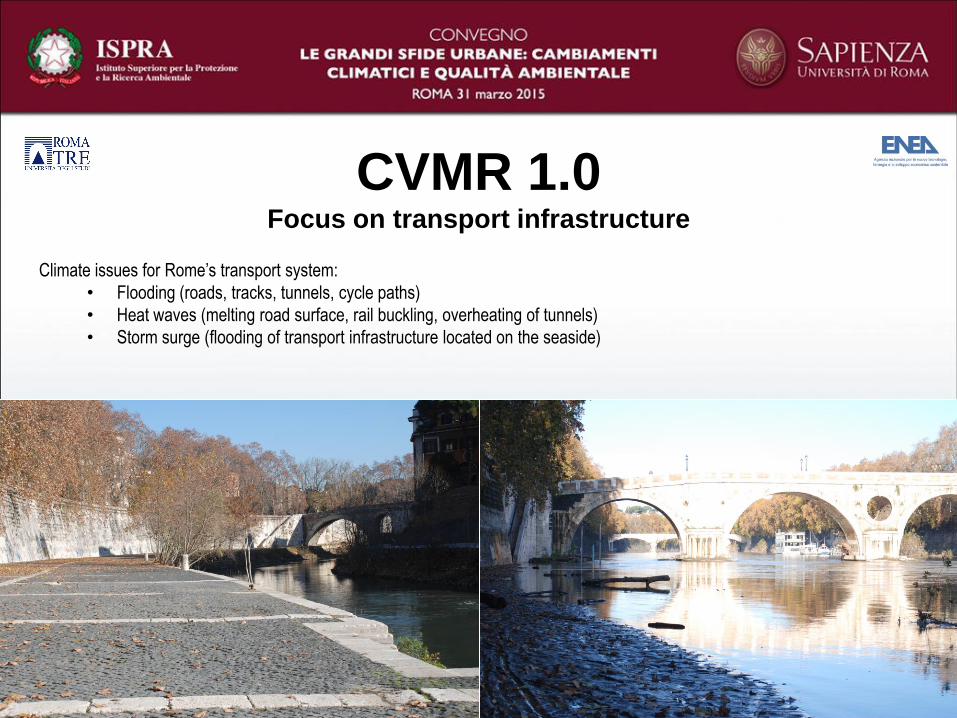
CVMR 1.0 Focus on transport infrastructure
Climate issues for Rome’s transport system:
• Flooding (roads, tracks, tunnels, cycle paths)
• Heat waves (melting road surface, rail buckling, overheating of tunnels)
• Storm surge (flooding of transport infrastructure located on the seaside)

CVMR 1.0 Focus on transport infrastructure
Possible adaptation options:
• Good maintenance (looks obvious but it’s not)
• Retrofitting existing infrastructure where possible
• New climate-proof design standards (Crossrail in UK)
• Green infrastructure approaches (Edgware road tube station)
• Increase awareness
Next steps
• Joint work with ATAC (data retrieval)
• Finding good practices
• Suggest implementation of examples where applicable
Thank you for your attention