Embed Size (px)
Citation preview
Climate Variability, Change and Extreme Events
NCAR Earth System LaboratoryNational Center for Atmospheric Research
NCAR is Sponsored by NSF and Partial support was provided by the Willis Research Network, the Department of Energy, and the Offshore
Energy Industry
Greg Holland
1
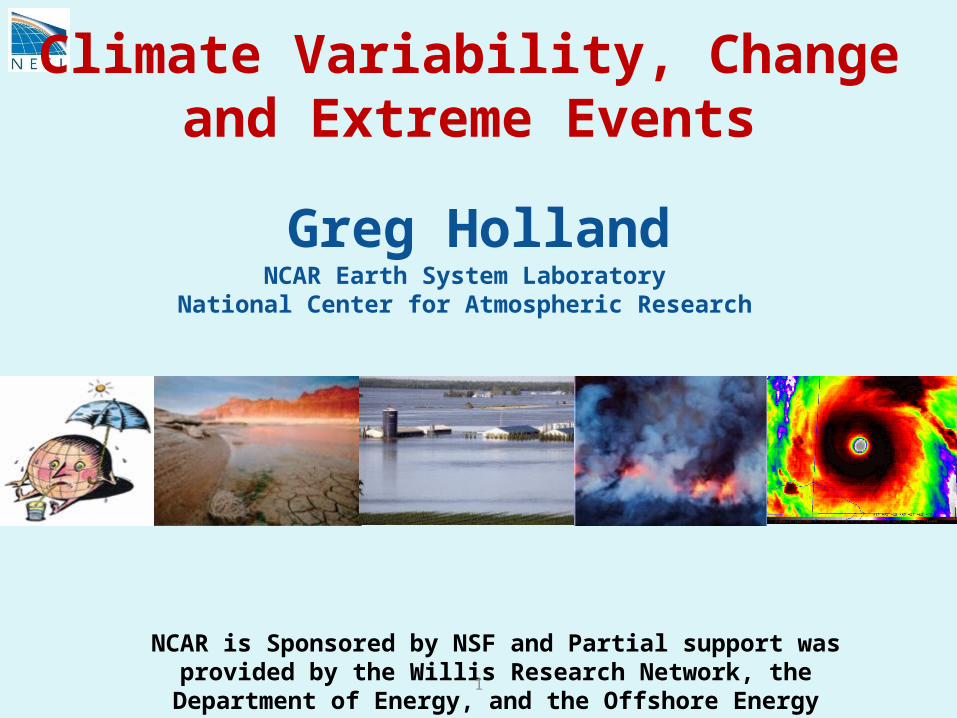
Summary
• Short Background on Climate Variability and Change;
• Impact on Extremes– Tipping Points– Extreme Weather
• General Impact• Droughts and Flooding Rains• Hurricanes
2Holland, Cherry Creek Science
Teachers Nov 2010
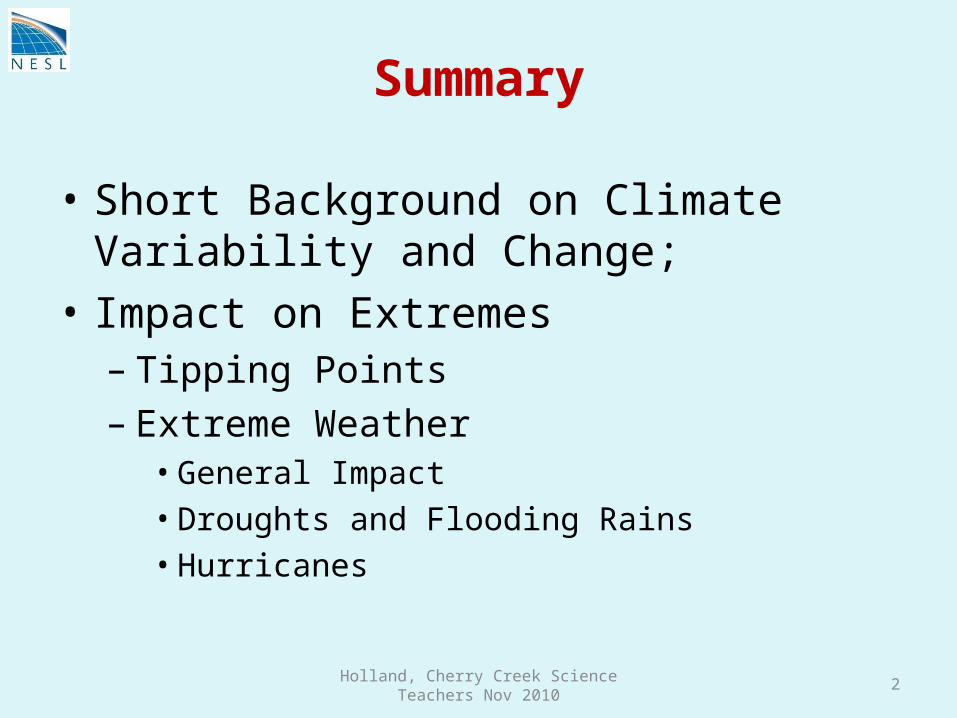
Fueling the Weather and Climate
3Holland, Cherry Creek Science Teachers Nov
2010
Incoming Shortwave
(UV and Visible)
ReflectedShortwave
Outgoing LongwaveHeat Radiation
• With no atmosphere the equilibrium temperature would be ~ -17oC;• For recent climate the equilibrium temperature is ~ +15oC • This is maintained by greenhouse gases in the earth atmosphere,
such as water vapor and CO2
Greenhouse Gases

4Holland, Cherry Creek Science Teachers Nov
2010(Trenberth etal 2009)
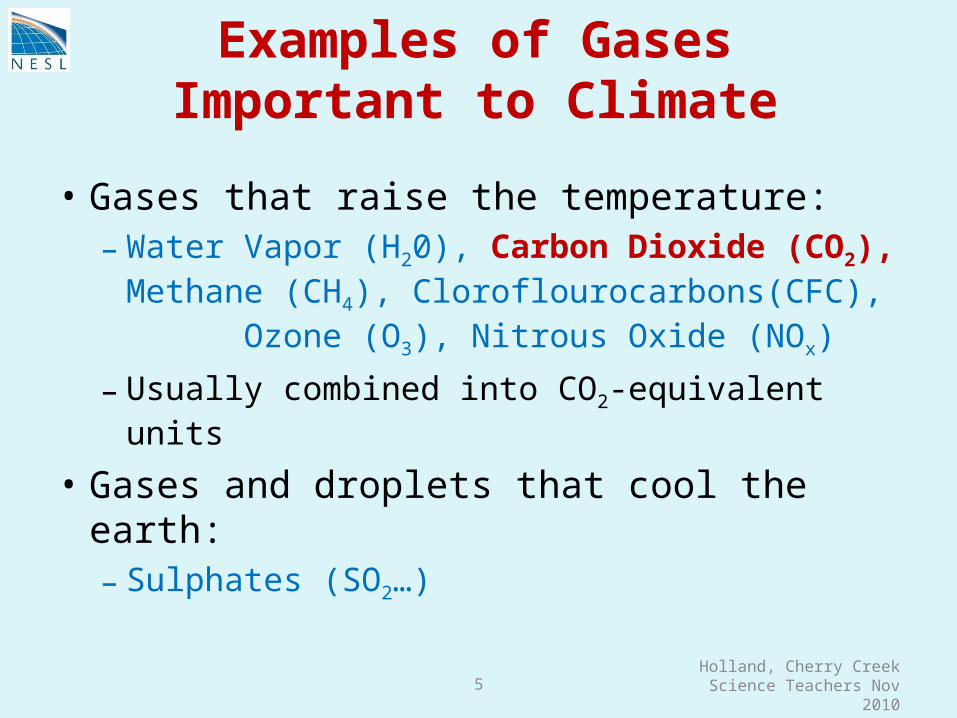
• Gases that raise the temperature:– Water Vapor (H20), Carbon Dioxide
(CO2), Methane (CH4), Cloroflourocarbons(CFC), Ozone (O3), Nitrous Oxide (NOx)
– Usually combined into CO2-equivalent units
• Gases and droplets that cool the earth:– Sulphates (SO2…)
Examples of Gases Important to Climate
5Holland, Cherry Creek Science Teachers Nov
2010

Internal Feedbacks of the Climate System
6Holland, Cherry Creek Science Teachers Nov
2010
Current Climate
Ice Age Runaway Warming
Increasing Temperature
Tipping Points
Generally maintain a “stable” climate, but major excursions can lead to transition to another climatic state (tipping points)

Historical Temperature and CO2 Changes
7Holland, Cherry Creek Science Teachers Nov
2010
lwf.ncdc.noaa.gov/paleo/globalwarming/images/

• Variability:– Variations in solar output and wobbles in the tilt of
the earth (range of time scales);– Direct Impacts on the climate system (volcanoes,
asteroid impact);– Internal variability);
• Change – Continental drift (forever)– Ice age variations (millenia)– Solar decline (eons)– Human influence (occurs in decades…lasts for
centuries).
Why Does the Climate Vary and Change?
8Holland, Cherry Creek Science Teachers Nov
2010
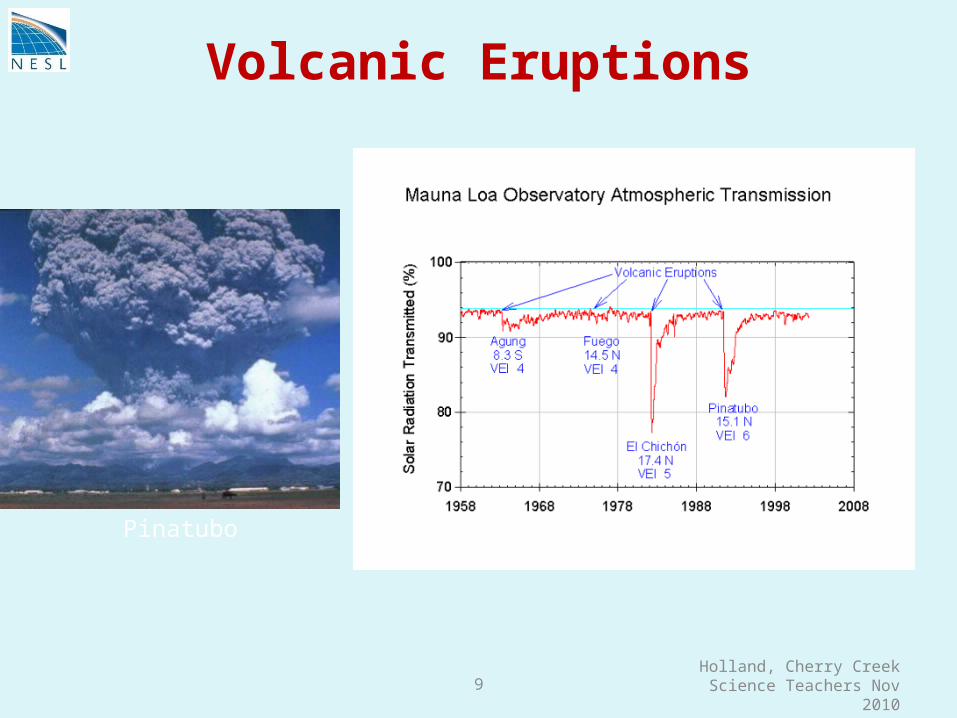
Volcanic Eruptions
9Holland, Cherry Creek Science Teachers Nov
2010
Pinatubo

The Year without Summer (1816)
10Holland, Cherry Creek Science Teachers Nov
2010
• After a series of major volcanoes, Mt Tambora (Indonesia) erupted in 1815 to become the largest in recorded history;
• The resulting solar energy decrease due to the global distribution of dust led to the year without summer (“Eighteen Hundred and Froze to Death!”);
• More than 71,000 people died of which only ~12,000 were direct;
• Initiated mass migrations and permanent cultural changes.
Wikipedia
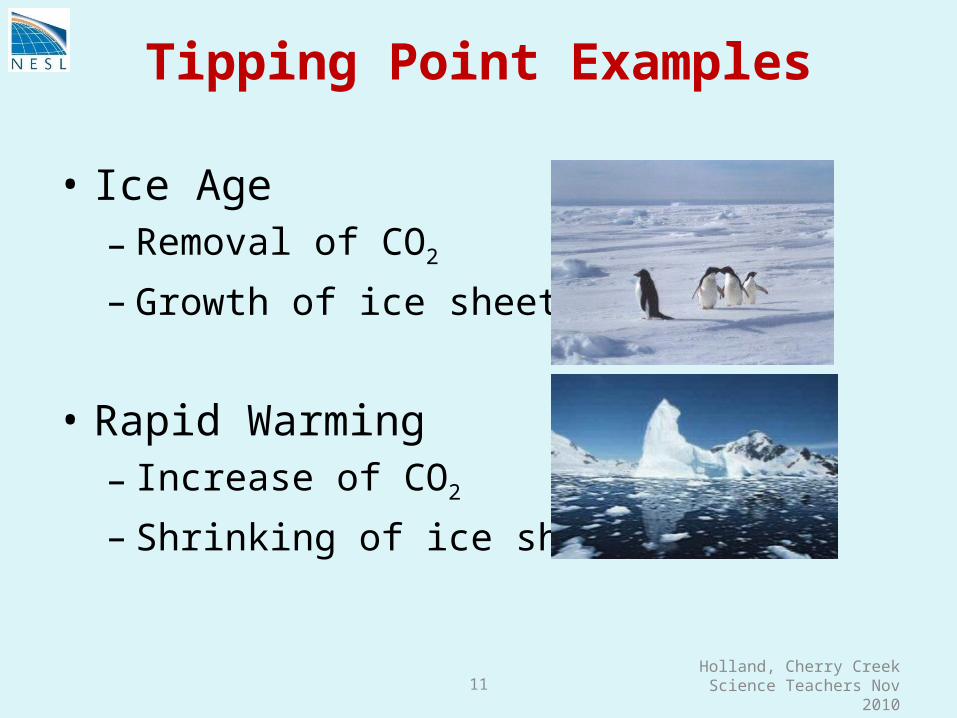
• Ice Age– Removal of CO2
– Growth of ice sheet
• Rapid Warming– Increase of CO2
– Shrinking of ice sheet
Tipping Point Examples
11Holland, Cherry Creek Science Teachers Nov
2010

Ice-Sheet Tipping Points
12Holland, Cherry Creek Science Teachers Nov
2010
Most sunlight reflectedMost sunlight
absorbed

Land-Ice Tipping Points
13Holland, Cherry Creek Science Teachers Nov
2010
NASA

Methane Tipping Points
14Holland, Cherry Creek Science Teachers Nov
2010
Permafrost melt releases stored methane, a potent greenhouse gas that decays to CO2 which initiates more warming and more permafrost melt, and so on.
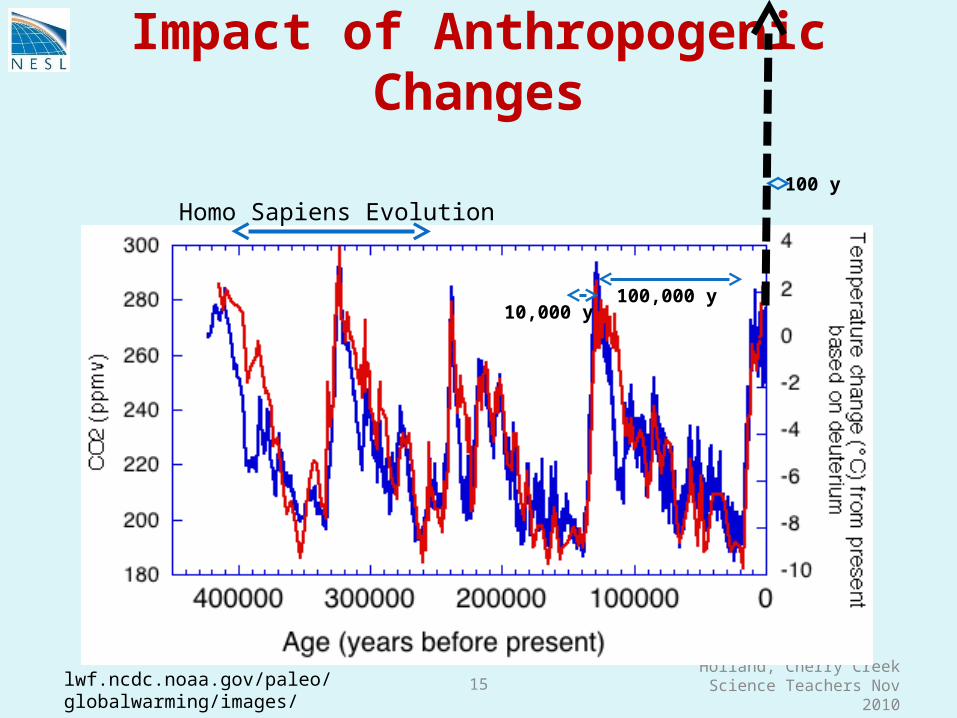
Impact of Anthropogenic Changes
15Holland, Cherry Creek Science Teachers Nov
2010
lwf.ncdc.noaa.gov/paleo/globalwarming/images/
Homo Sapiens Evolution
100,000 y10,000 y
100 y

Internal Feedbacks of the Climate System: Anthropogenic Change Impacts
16Holland, Cherry Creek Science Teachers Nov
2010
Current Climate
Ice Age Runaway Warming
Greenhouse Warming
Increasing Temperature
Tipping Points

Predicting Climate Variability and Change
Holland, Cherry Creek Science Teachers Nov
2010
(Meehl et al 2006)
(Holland 2008)
“Variability” and “change” are hard, indeed often impossible, to logically separate.
How do we understand and predict the consequences of change?
While history can give us some clues, climate models are the only useful tool.
17

Evolution of Climate Prediction
• 1960s: Simple Radiative Balance Models• 1970s: Pioneering Climate Modeling• 1980s: IPCC Fully Established• 1990s: Climate Modeling Projections with Skill
at Global and Century Scale, Statistical Seasonal Predictions
• 2005: Wide Acceptance of Global Warming as a Major Issue for Humankind (IPCC Nobel Prize)
• 2006-Present: Serious Discussion on Impact of Global Warming, and Focus on Decadal Regional Predictions
Holland, Cherry Creek Science Teachers Nov
201018
19Holland, Cherry Creek Science Teachers Nov
2010
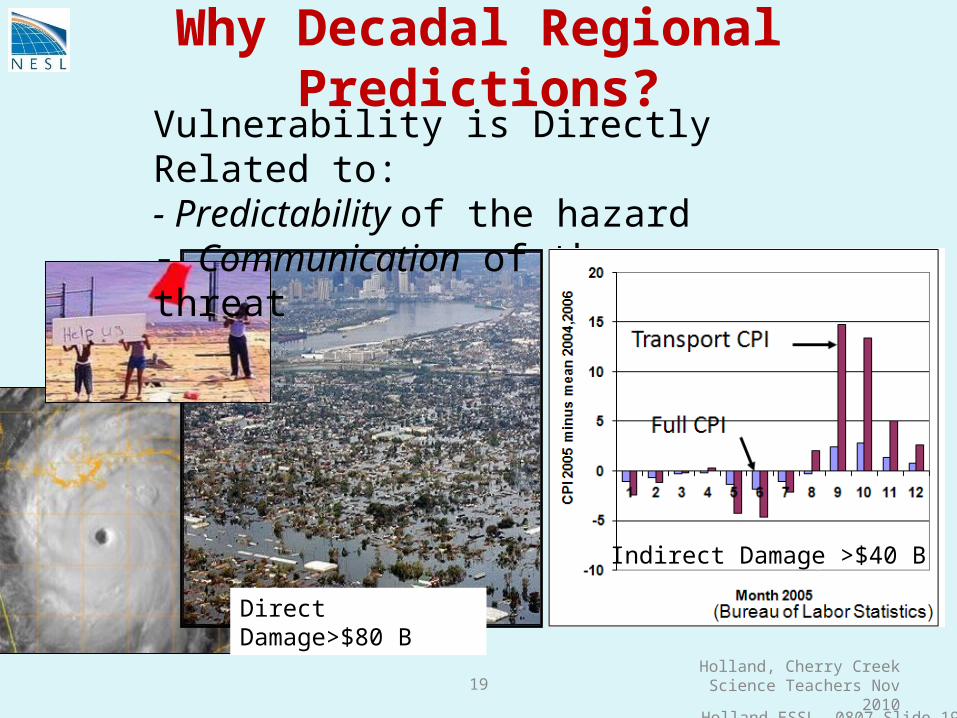
Why Decadal Regional Predictions?Vulnerability is Directly Related to:- Predictability of the hazard- Communication of the threat
Holland ESSL 0807…Slide 19
Direct Damage>$80 B
Indirect Damage >$30BIndirect Damage >$40 B

Why is Model Resolution Important?
Holland, Cherry Creek Science Teachers Nov
2010
IPCC Global Grid (180 km)IPCC Decadal Grid (55 km)
Current Weather Model Grid (1-2 km, would completely cover the area)
20

We are Now Able to Realistically Simulate High Impact Weather
21Holland, Cherry Creek Science Teachers Nov
2010
North Atlantic 4 km 2-way nested NRCM Simulation.
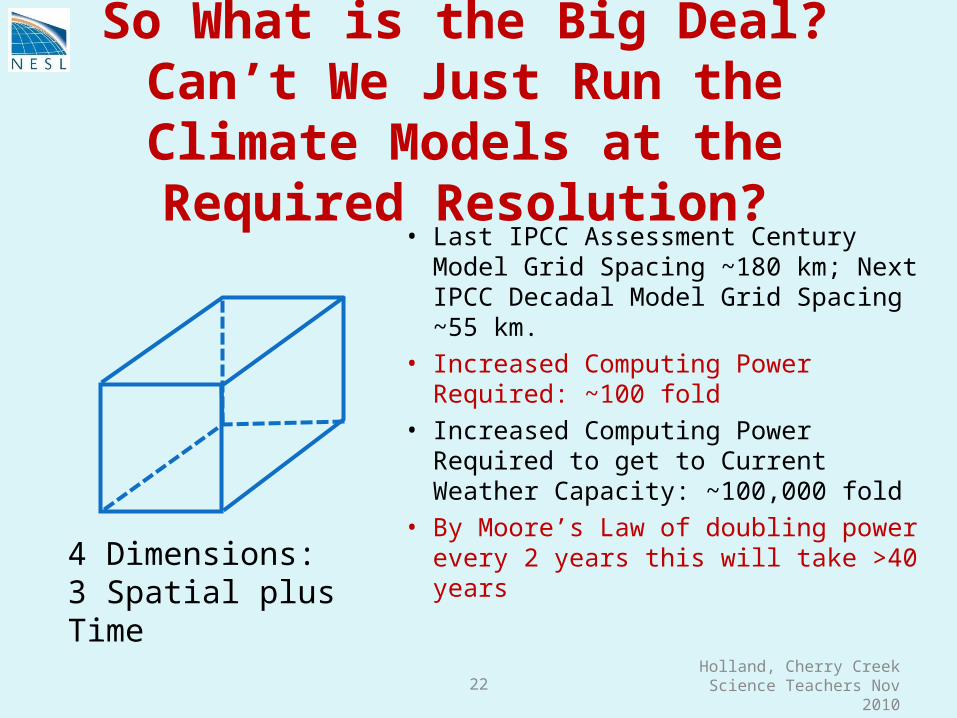
• Last IPCC Assessment Century Model Grid Spacing ~180 km; Next IPCC Decadal Model Grid Spacing ~55 km.
• Increased Computing Power Required: ~100 fold
• Increased Computing Power Required to get to Current Weather Capacity: ~100,000 fold
• By Moore’s Law of doubling power every 2 years this will take >40 years
22Holland, Cherry Creek Science Teachers Nov
2010
So What is the Big Deal?Can’t We Just Run the Climate Models at
the Required Resolution?
4 Dimensions:3 Spatial plus Time

Nested Regional Climate Modeling forMulti-decadal Regional Climate
23Holland, Cherry Creek Science Teachers Nov
2010
36 km
12 km
4 km
4 km
• Global Model: 3 Ensembles from 1950-2060• NRCM: 995-2005, 2020-2030, 2045-2055, 3 ensembles at 36km, 1 at 12 km,
specific cases at 4 km.• Use of statistical downscaling to fill in intermediate periods
Supported by: NSF, DOE, Offshore Oil Industry, Willis Re.

Our Goals in Undertaking Decadal NRCM Predictions
24Holland, Cherry Creek Science Teachers Nov
2010
To develop experience with high resolution climate forecasting;
To provide objective information on:-Variability and changes in high impact weather;-Probabilistic assessment of predictability; and,
To work directly with industry, government planners and societal groups to: -Realistically assess their level of vulnerability;-Develop suitable planning, mitigation and adaptation strategies.
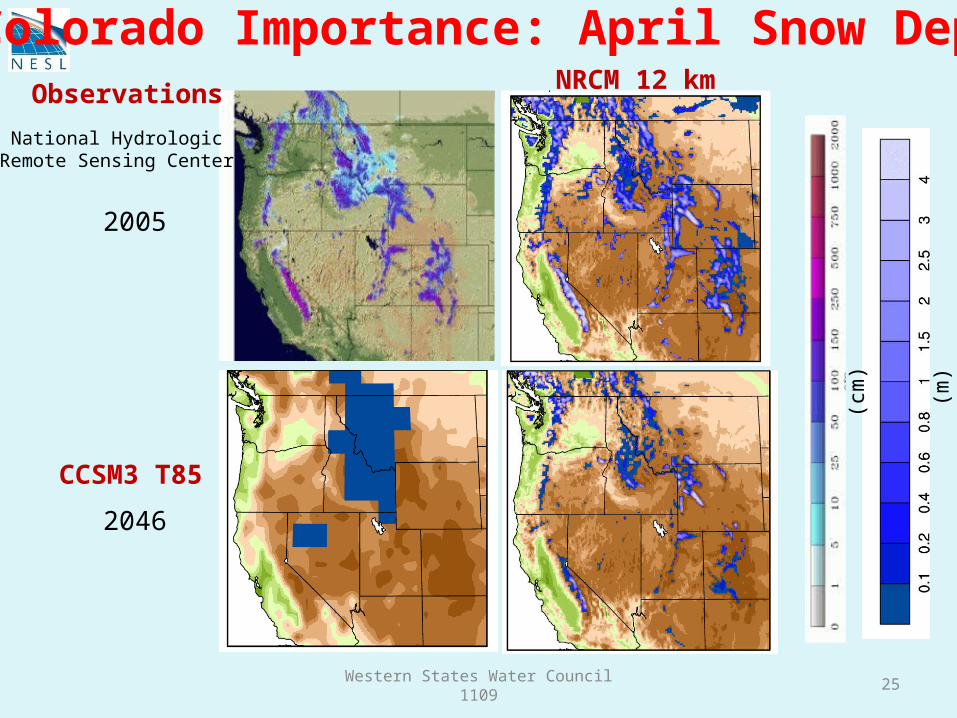
Colorado Importance: April Snow Depth
2005
NRCM 12 km
(m)
2046
CCSM3 T85
Observations
(cm
)
National HydrologicRemote Sensing Center
25Western States Water Council
1109

Holland, Cherry Creek Science Teachers Nov
2010
“Climate is what you expect, weather is what you get.”
And According to Mark Twain!
26
Tracy
Katrina
Andrew
Summary
Holland, Cherry Creek Science Teachers Nov
2010
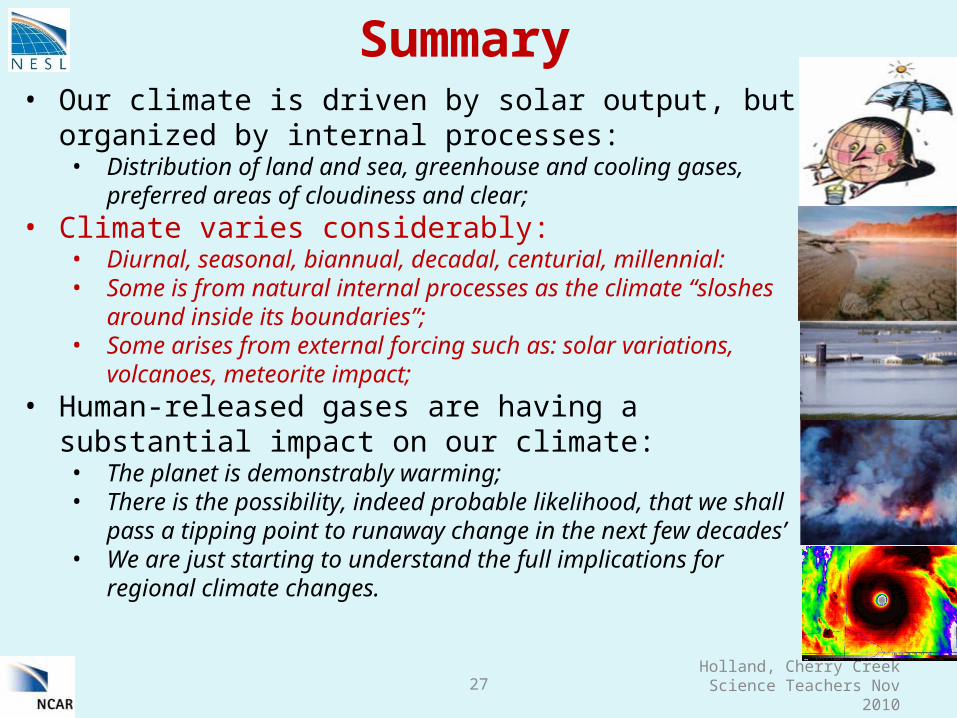
• Our climate is driven by solar output, but organized by internal processes:• Distribution of land and sea, greenhouse and cooling gases,
preferred areas of cloudiness and clear;• Climate varies considerably:
• Diurnal, seasonal, biannual, decadal, centurial, millennial:• Some is from natural internal processes as the climate “sloshes
around inside its boundaries”;• Some arises from external forcing such as: solar variations,
volcanoes, meteorite impact;• Human-released gases are having a substantial impact
on our climate:• The planet is demonstrably warming;• There is the possibility, indeed probable likelihood, that we shall
pass a tipping point to runaway change in the next few decades’• We are just starting to understand the full implications for regional
climate changes.
27