Embed Size (px)
Citation preview

Adv. Geosci., 33, 69–77, 2013www.adv-geosci.net/33/69/2013/doi:10.5194/adgeo-33-69-2013© Author(s) 2013. CC Attribution 3.0 License.
EGU Journal Logos (RGB)
Advances in Geosciences
Open A
ccess
Natural Hazards and Earth System
Sciences
Open A
ccess
Annales Geophysicae
Open A
ccess
Nonlinear Processes in Geophysics
Open A
ccess
Atmospheric Chemistry
and Physics
Open A
ccess
Atmospheric Chemistry
and Physics
Open A
ccess
Discussions
Atmospheric Measurement
Techniques
Open A
ccess
Atmospheric Measurement
Techniques
Open A
ccess
Discussions
Biogeosciences
Open A
ccess
Open A
ccess
BiogeosciencesDiscussions
Climate of the Past
Open A
ccess
Open A
ccess
Climate of the Past
Discussions
Earth System Dynamics
Open A
ccess
Open A
ccess
Earth System Dynamics
Discussions
GeoscientificInstrumentation
Methods andData Systems
Open A
ccess
GeoscientificInstrumentation
Methods andData Systems
Open A
ccess
Discussions
GeoscientificModel Development
Open A
ccess
Open A
ccess
GeoscientificModel Development
Discussions
Hydrology and Earth System
Sciences
Open A
ccess
Hydrology and Earth System
Sciences
Open A
ccess
Discussions
Ocean Science
Open A
ccess
Open A
ccess
Ocean ScienceDiscussions
Solid Earth
Open A
ccess
Open A
ccess
Solid EarthDiscussions
The Cryosphere
Open A
ccess
Open A
ccess
The CryosphereDiscussions
Natural Hazards and Earth System
Sciences
Open A
ccess
DiscussionsClimate trends and projections for the Andean Altiplanoand strategies for adaptation
C. Valdivia1, J. Thibeault2, J. L. Gilles1, M. Garcıa3, and A. Seth2
1University of Missouri, Columbia, Missouri, USA2University of Connecticut, Storrs, Connecticut, USA3Universidad Mayor San Andres, La Paz, Bolivia
Correspondence to:C. Valdivia ([email protected])
Received: 18 May 2011 – Revised: 16 September 2011 – Accepted: 1 October 2012 – Published: 2 April 2013
Abstract. Climate variability and change impact productionin rainfed agricultural systems of the Bolivian highlands.Maximum temperature trends are increasing for the Alti-plano. Minimum temperature increases are significant in thenorthern region, and decreases are significant in the southernregion. Producers’ perceptions of climate hazards are high inthe central region, while concerns with changing climate andunemployment are high in the north. Similar high-risk per-ceptions involve pests and diseases in both regions. Altiplanoclimate projections for end-of-century highlights include in-creases in temperature, extreme event frequency, change inthe timing of rainfall, and reduction of soil humidity. Suc-cessful adaptation to these changes will require the develop-ment of links between the knowledge systems of producersand scientists. Two-way participatory approaches to developcapacity and information that involve decision makers andscientists are appropriate approaches in this context of in-creased risk, uncertainty and vulnerability.
1 Introduction
Globalization, climate variability and climate change are in-creasing food insecurity in tropical regions (Valdivia et al.,2010; Lobell et al., 2008). Agriculture in these regions oftendoes not have functioning institutions to protect against risk –especially in rainfed production systems. Farmers in regionslike the Andes rely on local knowledge and institutions toaddress uncertainty and risks, which have proven to work forcenturies (Gilles and Valdivia, 2009; Mayer, 2002; Valdiviaand Gilles, 2001; Orlove et al., 2000; Valdivia et al., 1996).Altiplano landscapes are characterized by a high degree of
variation, which makes negotiating uncertainty at the locallevel a key issue for adaptation. In this article the climate ofthe Altiplano and the risks farmers face are presented, fol-lowed by how – under increased uncertainty – adaptive ca-pacities can be developed to address change. The premiseof the research presented here is that participatory processesthat link local and scientific knowledge systems are criticalto building the capacity to deal with change in the Andes.
2 Climate – trends and change – and risks in fivelandscapes
The impacts of climate variability on farming systems in theAltiplano are well documented (Sperling et al., 2008; Val-divia, 2004). Farmers in the Altiplano have always faced re-current droughts, floods and frosts but climate change is pre-senting new challenges that reduce crop production such asincreased pressure from pests and plant disease and shifts inthe onset and intensity of rains. Observed climate trends areanalyzed for three Altiplano regions, followed by an analy-sis of risk perceptions and shocks to rural livelihoods of fivelandscapes in the northern and central regions. Finally, cli-mate projections for extreme events and soil humidity for theAltiplano and implications are discussed.
2.1 Trends
Statistical analysis of historical records of 14 meteorologicalstations in the Altiplano show some decline in the monthlyrainfall for the early rainy season months (October throughDecember), but no significant trends (p-value= 0.6) in an-nual precipitation (Valdivia et al., 2010). Figure 1 presents
Published by Copernicus Publications on behalf of the European Geosciences Union.

70 C. Valdivia et al.: Climate trends and projections for Andean Altiplano and strategies for adaptation
Table 1.Socioeconomic characteristics by groups in the Bolivian Altiplano (2006).
Region Northern Altiplano Groups Central Altiplano Groups
Group I II III I II III
VariableAge (years)∗ 52.5 35 59 53 32.9 62.4Education (years)∗ 7.6 6.8 3.8 6.5 8.5 3.6Farming cash income (US$)∗ 1500 500 412 2300 1250 636Total cash income (US$)∗ 2200 1000 823 4600 2500 1770
Source: Valdivia et al. (2007),∗ Significant differencesp < 0.05 between groups by region: I productive households inthe middle of their life cycle, II young households starting their productive life cycle, III elderly households in laterstage of the life cycle.
the GIS-based geostatistical analysis of temperatures andrainfall. Maximum temperatures are increasing throughout(p-value= 0.005). Minimum temperatures are also increas-ing throughout the year in the northern and central Alti-plano, especially in winter (May through September) (p-value= 0.0015). On the other hand, minimum temperatureshave dropped in the southern Altiplano (p-value= 0.006),which may be a result of changing production systems, clear-ing of agricultural land and increasing desertification thatmay reduce atmospheric water vapor.
Implications
Observed trends have already had substantial impact on agri-culture. Frost is becoming less of a limiting factor in thenorthern and central parts whereTmin is rising. Farmers areshifting their production systems from more extensive and re-silient rainfed crops to short-season, high-value and irrigatedcrops such as onions or peas in the north where the risingtemperatures are clearly felt by producers. Farmers are divid-ing their plots and are planting throughout the growing sea-son, increasing their dependence on limited irrigation water.Although these practices could be seen as local adaptations,strongly driven firstly by climate but also by market opportu-nities, they have resulted in further fragmentation of alreadysmall fields, conflicts between water users, pressure on frag-ile soils and in some cases increased incidence of pests anddiseases. In the drier central Altiplano, later onset of the rainyseason has more severe impact on farming than in the north-ern region due to the lack of irrigation. This means that thefew crops that can grow in this region must be planted later.In a cold environment such as that of the central Altiplano(even with rising temperatures), later planting increases therisk of crop failure because crops may not reach maturity be-fore the onset of fall frosts. Thus, late onset of the rainy sea-son could lead to an increased frequency of crop failures orlosses if adaptation actions are not rapidly planned. Finally,less incidence of frosts in both regions threatens productionof chuno(freeze-dried potatoes), which through centuries hasbeen the source of food security because it can be stored forfive years or more.
2.2 Perceptions of risks and shocks in the livelihoods offamilies in rural landscapes
To understand the relationship of the production systems,geography and climate impacts on the livelihoods of farm-ers, 330 households were interviewed. Data about the im-pact of climate on farming and about hazard threat percep-tions in 2006 covered a 200 km transect, and included fivelandscapes, three in a watershed in the northern Altiplanoregion and two in the central Altiplano region. The water-shed lowlands in the north are on the shores of Lake Titi-caca at 3815 m a.s.l.; the mid elevation landscape is 12 km upthe watershed; and the high elevation landscape, more pas-toral than cropping, is 20 km from the lake. The central Al-tiplano landscapes are in two different agroecological zones,the flat lowlands where dairy production has developed, andthe highlands where cropping takes place mostly with animalplow. Analysis of the data using cluster analysis identifiedgroups at different stages in the life cycle (p-value< 0.05),with differences in income levels and importance of farmingand non-farming activities between and within regions (Ta-ble 1). Education levels are higher among those in the earlystages of the life cycle, and income is highest in the produc-tive groups. The central Altiplano region has higher incomelevels, and the share from farming is higher.
The perceived risks – the threat each hazard represents totheir livelihood – and the impact of hazards on crops and an-imals differed in intensity by landscape and region (see Ta-ble 2). In most landscapes hazards were a very strong threat.Perceived frost, floods and hail hazards were high in bothlandscapes of the central Altiplano. Hail hazards were mostlyfelt in the higher elevation landscape of this region. Con-cerns in the north were especially high regarding the chang-ing climate, loss of soil fertility, and becoming unemployed,consistent with the overall low income and greater impor-tance of off-farm income (migration). Production shocks re-lated to pests were particularly prevalent and perceived as ahigh threat in both regions, consistent with increased warm-ing trends. Perceptions of flood hazards were high in thelowlands of the northern Altiplano, near Lake Titicaca. Inthe mid- and high elevations, perceptions of environmental
Adv. Geosci., 33, 69–77, 2013 www.adv-geosci.net/33/69/2013/

C. Valdivia et al.: Climate trends and projections for Andean Altiplano and strategies for adaptation 71
Figures
Figure 1. Differences in the mean of Minimum and Maximum Temperature and Precipitation
records, before and after 1983 for the Bolivian Altiplano.
Source: Valdivia, C., Seth, A., Gilles, J., García, M., Jiménez, E., Cusicanqui, J., Navia, F., and
Yucra, E.: Adapting to Climate Change in Andean Ecosystems: Landscapes, Capitals, and
Perceptions Shaping Rural Livelihood Strategies and Linking Knowledge Systems, Annals of the
Association of American Geographers, 100 (4): 818-834, 2010. Page 827.
Fig. 1. Differences in the mean of Minimum and Maximum Temperature and Precipitation records, before and after 1983 for the BolivianAltiplano. Source: Valdivia et al. (2010).
www.adv-geosci.net/33/69/2013/ Adv. Geosci., 33, 69–77, 2013

72 C. Valdivia et al.: Climate trends and projections for Andean Altiplano and strategies for adaptation
Table 2. Location and risk perceptions average index1 and losses (%) by climate, social and market hazards and shocks in the BolivianAltiplano (2006).
Type of Hazard/Landscapes Northern Altiplano Central AltiplanoAncoraimes Municipality Umala Municipality
Location Low Mid High Low High
Elevation (m a.s.l.) 3815 3850–3890 4200 3770–3805 4070–4012Number of respondents (N ) 57 65 27 127 54
Perceptions (index)
Hail for crops and animals 3.51 3.97 3.56 3.85 4.28Floods 3.96 3.82 3.85 4.42 4.00Drought 2.41 2.97 2.67 2.96 3.00Frost 3.89 4.06 3.59 4.35 4.50Changing climate 3.79 4.17 4.11 3.87 3.53Crop pests 3.68 4.11 3.78 3.13 3.67Soil fertility loss 3.91 4.23 4.00 3.44 3.68Low livestock price 3.84 4.12 3.78 3.72 3.83Unemployment of an adult 3.70 4.23 4.04 2.33 2.98
Shocks Experienced in 2006 (percent)
Drought, percent losses∗ n = 34 40 23 0 27 18Floods, percent lossesn = 50 21 0 28 28 12Frosts, percent crop lossesn = 107 19 19 25 22 0Hail, percent crop lossesn = 48 17 22 20 21 21Pests, percent crop lossesn = 278 28 32 22 12 11Frost, percent livestock lossesn = 40 29 25 30 9 5Disease, percent livestock lossesn = 164 14 17 18 18 15
Source: Household Survey Data Practices and Strategies in the Bolivian Altiplano, SANREM CRSP LTRA4.1 The index is the average of responses to the question with1 = not a threat,2 = minimal threat;3 = moderate threat; 4= very strongthreat,5 = extreme threat.∗ n indicates the number of households who experienced losses.
(soils) and social threats were high – localities with less in-come, education, and land. High perceptions of risk cou-pled with low levels of income mean that farmers weigh thepresent more than the future in their livelihood decisions.
2.3 Climate change extremes and soil moisture
Simulations from eleven Coupled Model IntercomparisonProject version 3 (CMIP3) (Meehl et al., 2007) global cou-pled climate models have been analyzed for present and fu-ture climate scenarios (Table 3). Current climate model res-olution cannot provide accurate climate projections in theAltiplano because of the complex topography, but the useof high to intermediate resolution climate models may pro-vide reliable qualitative information about the direction offuture trends (Seth et al., 2010). Trends have been analyzedfor four extreme temperature indices (extreme temperaturerange, frost days, warm nights, and heat waves) and four pre-cipitation extreme indices (consecutive dry days, 5 day pre-cipitation, precipitation> 95th percentile, and precipitationintensity). Modeled extreme indices use the definitions ofFrich et al. (2002). Changes in the annual cycle of soil mois-
ture and future trends in spring (OND) and summer (JFM)soil moisture have also been analyzed. Analysis is focusedon the northern Altiplano, which is defined here as 16–19◦ Sand 67–70◦ W. Model calculations represent area-averages ofthis region. All significance tests were performed at the 90 %confidence level.
2.3.1 Extremes
Extreme temperature indices have been calculated for LaPaz/El Alto (16.50◦ S/68.18◦ W, 4061 m), using the USNational Climatic Data Center’s (NCDC) Global SurfaceSummary of the Day (GSOD), covering 1973–2007 (seeThibeault et al., 2010). Mann–Kendall tests were used toidentify significant trends. Direct comparison of modeledand observed extreme indices is not possible because of dif-ferences in definitions and issues with comparing point andarea-averaged data (Alexander and Arblaster, 2009; Chenand Knutson, 2008), but identifying consistencies in thedirections of trends between simulated and observed tem-perature extremes provides insight into model projections.
Adv. Geosci., 33, 69–77, 2013 www.adv-geosci.net/33/69/2013/

C. Valdivia et al.: Climate trends and projections for Andean Altiplano and strategies for adaptation 73
Precipitation indices were not calculated because of missingdata.
Only two stations in the Altiplano have adequately longrecords of high quality daily temperature and precipitationobservations suitable for extremes analysis. Significant in-creasing trends have been identified in several precipitationindices at Patacamaya, Bolivia, suggesting a shift towardless frequent but more intense precipitation (Haylock et al.,2006; Thibeault et al., 2010). No significant trends in tem-perature extremes were identified at Patacamaya (Vincentet al., 2005). Significant increasing trends inwarm nightsand warm spellswere identified at La Paz/El Alto, cover-ing 1973–2007 (Thibeault et al., 2010). Increasing trendswere also identified infrost daysand theextreme tempera-ture range. The simultaneous increases in warm nights andfrost days, both based on daily minimum temperatures, areunexpected but may be explained by an increase in the fre-quency of clear nights when precipitation at La Paz/El Altodecreases in frequency, similar to what is found at Pataca-maya (Thibeault et al., 2010).
Multi-model projections of frost days, heat waves, andwarm nights show trends consistent with warmer tempera-tures projected for the Altiplano (Fig. 2) (Thibeault et al.,2010). The increasing trend in theextreme temperature rangesuggests that the Altiplano will continue to experience somevery low minimum temperatures while maximum tempera-tures increase. Projected trends are significant at the 90 %confidence level, and with the exception of frost days, consis-tent with the direction of observed trends at La Paz/El Alto.
Multi-model projections show significant increasingtrends in all precipitation indices, and share the same signsas trends identified at Patacamaya by Haylock et al. (2006)(Thibeault et al., 2010) (Fig. 3). Results are consistent withannual cycle projections for an extended dry season, weakerearly rainy season, and more intense summer peak rainy sea-son (Seth et al., 2010; Thibeault et al., 2010).
2.3.2 Soil moisture projections
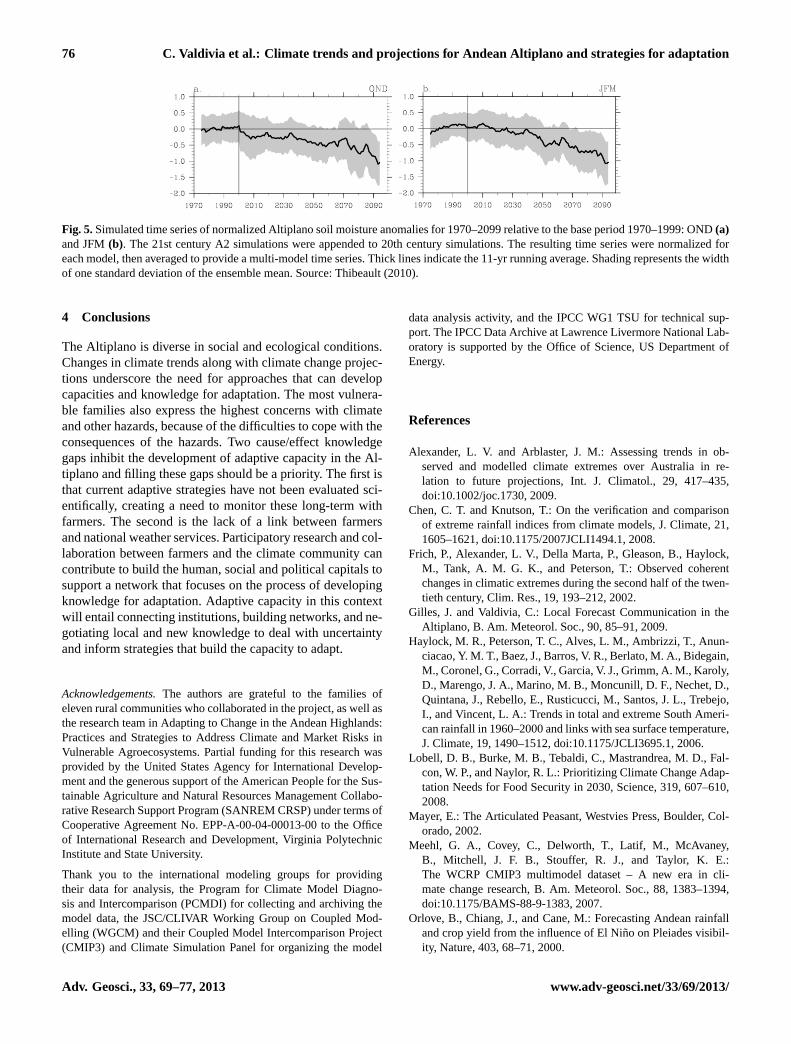
Changes in soil moisture were evaluated for the A2 scenario(Thibeault, 2010). Multi-model means show that soil mois-ture starts to decrease throughout the annual cycle by 2020–2049, though some models project an increase during therainy season (Fig. 4a). By 2070–2099, there is good agree-ment among the models that soil moisture reductions will in-crease throughout the annual cycle, even in the peak rainyseason (Fig. 4b). Multi-model time series of seasonal soilmoisture show reductions in spring (OND) throughout the21st century (Fig. 5a), consistent with projections for lowerrainfall and higher temperatures (Seth et al., 2010; Thibeaultet al., 2010). Lower summertime (JFM) soil moisture is ex-pected from mid-century onward (Fig. 5b). Higher precipi-tation intensity is likely to lead to an increased runoff ratioas rainfall rates exceed the infiltration capacity of the soil.
Increased evapotranspiration from higher temperatures willfurther reduce Altiplano soil moisture.
With the exception of frost days, projected trends in cli-mate extremes share the same sign as observed trends at Pat-acamaya and La Paz/El Alto. The combination of higher tem-peratures, changes in precipitation timing and intensity, andsoil moisture reductions are likely to increase the climate-related risks to rural agriculture in the Altiplano as green-house warming progresses.
3 Uncertainty and adaptive capacities –linking knowledge systems
3.1 Uncertainty and decisions
Uncertainty about climate is likely to increase and the exist-ing knowledge farmers have to make decisions related to cli-mate may not be able to inform future decisions because theyare based on experience with past conditions; new knowl-edge will be required. People assess risks using rules-basedand association-based (experiential) systems (Slovic and We-ber, 2002). When the results of association- and rules-basedsystems conflict, decision makers revert to their experience(traditional/local knowledge). Altiplano farmers will likelyrely on traditional knowledge when it conflicts with prob-abilistic forecasts (Valdivia et al., 2010). In this context ofuncertainty, Slovic and Weber (2002) suggest that two-wayparticipatory communication may enhance local knowledgeby providing salient knowledge to the decision-makers. Thisprocess creates common expectations and language that canbe used to discuss alternative strategies. Farmers can listento the forecasters, make their own observations and derivelessons beyond the conclusions made by researchers. Theparticipatory research is a mechanism for linking knowledgesystems, identifying barriers as well as courses of action. Inorder to enhance adaptation to climate change in the Alti-plano, the knowledge systems of meteorologists and those ofindigenous farmers need to be linked.
3.2 Adaptive capacity in a context of uncertainty andfood insecurity
The forecast community must meet many challenges in or-der to bring this knowledge link to pass. The first challengeis the farmer’s lack of access to useful meteorological datathat has both technical and socioeconomic dimensions. TheAltiplano is characterized by a myriad of microclimates. Insuch cases, the production of locally useful meteorologicalforecasts requires a high density of weather stations. How-ever, the Altiplano region is characterized by a low densityof stations, exacerbated by the fact that few stations have thequality of data needed to identify trends. There were only14 stations in the Altiplano with 35 yr or more of qualitydata and only two stations with data to model extreme eventsin a region with an area of approximately 240 000 square
www.adv-geosci.net/33/69/2013/ Adv. Geosci., 33, 69–77, 2013

74 C. Valdivia et al.: Climate trends and projections for Andean Altiplano and strategies for adaptation
Table 3.CMIP3 coupled ocean–atmosphere models used in extremes and soil moisture (SM) analyses. Atmospheric resolution is shown inlongitude by latitude degrees, respectively. Ocean resolution is defined as the number of grids in longitude and latitude, respectively. Modelsand scenarios used in the extremes and soil moisture analyses are given. 20c3m denotes 20th century simulation. B1, A1B, and A2 denotelow, medium, and high emissions scenarios for 21st century simulations, respectively.
Modeling Center Model Atmosphere Ocean Extremes SMResol. Resol. Scenarios Scenarios
National Center for Atmospheric Research CCSM3 1.4× 1.4 320× 395 20c3m, B1, A1B 20c3m, A2Meteo-France, Centre National de Recherches Meteorologiques CNRM-CM3 2.8× 2.8 180× 170 20c3m, B1, A1B, A2US Dept. of Commerce/NOAA/Geophysical Fluid Dynamics Laboratory GFDL-CM2.0 2.5× 2 360× 200 20c3m, B1, A1B, A2 20c3m, A2US Dept. of Commerce/NOAA/Geophysical Fluid Dynamics Laboratory GFDL-CM2.1 2.5× 2 360× 200 20c3m, B1, A1B, A2 20c3m, A2Center for Climate System Research (The University of Tokyo), MIROC3.2-MedRes 2.8× 2.8 256× 192 20c3m, B1, A1B, A2 20c3m, A2National Institute for Environmental Studies,and Frontier Research Center for Global Change (JAMSTEC)Center for Climate System Research (The University of Tokyo), MIROC3.2-HiRes 1.1× 1.1 320× 320 20c3m, B1, A1BNational Institute for Environmental Studies,and Frontier Research Center for Global Change (JAMSTEC)National Center for Atmospheric Research PCM 2.8× 2.8 360× 180 20c3m, B1, A1B, A2Institut Pierre Simon Laplace IPSL-CM4 3.75× 2.5 180× 170 20c3m, B1, A1B, A2Meteorological Research Institute MRI-CGCM2.3.2 2.8× 2.8 144× 111 20c3m, A1B, A2 20c3m, A2Max Planck Institute for Meteorology ECHAM5 1.9× 1.9 192× 189 20c3m, A2UKMO/Hadley Centre for Climate Prediction and Research HadCM3 3.75× 2.5 288× 144 20c3m, A2
Figure2
Figure 2. Simulated Altiplano temperature extreme indices for 1901-2099. Time series have been
standardized for each model, then averaged to provide a multi-model time series for each
scenario. Thick lines show 10-year running averages. Shading represents the width of one
standard deviation of the ensemble mean. 21st century scenarios are shown for the B1 (blue, 8
models), A1B (green, 9 models), and A2 (red, 7 models) scenarios. Source: Thibeault, Seth, and
Garcia (2010).
Fig. 2.Simulated Altiplano temperature extreme indices for 1901–2099. Time series have been standardized for each model, then averaged toprovide a multi-model time series for each scenario. Thick lines show 10-yr running averages. Shading represents the width of one standarddeviation of the ensemble mean. The 21st century scenarios are shown for the B1 (blue, 8 models), A1B (green, 9 models), and A2 (red, 7models) scenarios. Source: Thibeault et al. (2010).
kilometers (Valdivia et al., 2010). Downscaling of the globalmodels is also a challenge in this context. The scale of exist-ing models is too large to be translatable to the local level. Inaddition, projections from climate models focus on averagechanges in temperature and precipitation, and changes in ex-treme event frequencies. Farmer decisions must be based onestimates of rainfall distribution and extreme events withinthe cropping year. The socioeconomic dimension has severalelements. First, there is a lack of knowledge about climatetrends that inhibits the creation of adaptation strategies. Inaddition, farmers do not trust forecasts generated outside oftheir immediate area (Gilles and Valdivia, 2009). Second, de-
mographic changes are reducing the adaptive capacity of tra-ditional production systems. Increased population has led tothe division of land into ever smaller farms and shorter fal-low periods (Valdivia et al., 2007). Traditionally, Altiplanofarmers minimized weather related risks by planting cropsin a variety of micro-environments, no longer possible withpresent farm sizes. Population pressures have led farmers tomigrate seasonally, creating labor shortages that restrict thenumber of adaptive alternatives as well.
Adv. Geosci., 33, 69–77, 2013 www.adv-geosci.net/33/69/2013/

C. Valdivia et al.: Climate trends and projections for Andean Altiplano and strategies for adaptation 75
Figure 3. As in Figure 2, but for Altiplano precipitation extreme indices. Source: Thibeault, Seth,
and Garcia (2010).
Figure 4. Normalized soil moisture differences (A2 minus 1970-1999) for the middle (a, 2020-
2049) and late 21st century (b, 2070-2099). Multi-model averages are indicated by black
diamonds. . Source: Thibeault (2010).
Fig. 3.As in Fig. 2, but for Altiplano precipitation extreme indices. Source: Thibeault et al. (2010).
Figure 3. As in Figure 2, but for Altiplano precipitation extreme indices. Source: Thibeault, Seth,
and Garcia (2010).
Figure 4. Normalized soil moisture differences (A2 minus 1970-1999) for the middle (a, 2020-
2049) and late 21st century (b, 2070-2099). Multi-model averages are indicated by black
diamonds. . Source: Thibeault (2010).
Fig. 4. Normalized soil moisture differences (A2 minus 1970–1999) for the middle (a. 2020–2049) and late 21st century (b. 2070–2099).Multi-model averages are indicated by black diamonds. Source: Thibeault (2010).
3.3 A participatory strategy for linking formal and localknowledge systems
Because of the challenges described above, neither scien-tific forecasts nor local knowledge can by themselves guidesmallholder adaptation to climate change. However, a partic-ipatory process involving forecasters and producers could doso. Identifying adaptive strategies is a lengthy process, so thefirst step would be to secure the commitment of participat-ing communities. Once that is obtained, a series of meetingsbetween the team and producers could be carried out whereproducers express their concerns about climate change andrisk, and discuss how they could deal with these concerns.At the same time, forecasters would present their estimatesof change and their observation of trends to the communi-ties in order to help producers begin to think about adap-tation strategies. During this process, care should be takento involve men and women of all ages and resource levels,because viability of adaptive strategies depends on the char-acteristics and resource endowments of producers as well as
physical and biological constraints. Following this step, ef-forts would be made to correlate forecast data from nationalweather services by installing weather stations in commu-nities to help farmers in specific microclimates. In addition,discussions about adaptation strategies should continue andlocal experiments with possible adaptive strategies carriedout. The process would facilitate a common language, aswell as knowledge of each other addressing issues of trust.The two-way process would build the knowledge networks(which may be social and political) that enable agency orability to act. These knowledge networks would include gov-ernment agencies and non-governmental organizations thatcan provide technical assistance and resources to assist inadaptation. This process would be farmer driven but expertassisted, in order to provide the flexibility needed to find ap-propriate strategies for different microclimates and resourceendowments.
www.adv-geosci.net/33/69/2013/ Adv. Geosci., 33, 69–77, 2013
76 C. Valdivia et al.: Climate trends and projections for Andean Altiplano and strategies for adaptation
Figure 5. Simulated time series of normalized Altiplano soil moisture anomalies for 1970- 2099
relative to the base period 1970-1999: OND (a) and JFM (b). 21st century A2 simulations were
appended to 20th century simulations. The resulting time series were normalized for each model,
then averaged to provide a multi-model time series. Thick lines indicate the 11-year running
average. Shading represents the width of one standard deviation of the ensemble mean.
Source: Thibeault (2010).
Fig. 5.Simulated time series of normalized Altiplano soil moisture anomalies for 1970–2099 relative to the base period 1970–1999: OND(a)and JFM(b). The 21st century A2 simulations were appended to 20th century simulations. The resulting time series were normalized foreach model, then averaged to provide a multi-model time series. Thick lines indicate the 11-yr running average. Shading represents the widthof one standard deviation of the ensemble mean. Source: Thibeault (2010).
4 Conclusions
The Altiplano is diverse in social and ecological conditions.Changes in climate trends along with climate change projec-tions underscore the need for approaches that can developcapacities and knowledge for adaptation. The most vulnera-ble families also express the highest concerns with climateand other hazards, because of the difficulties to cope with theconsequences of the hazards. Two cause/effect knowledgegaps inhibit the development of adaptive capacity in the Al-tiplano and filling these gaps should be a priority. The first isthat current adaptive strategies have not been evaluated sci-entifically, creating a need to monitor these long-term withfarmers. The second is the lack of a link between farmersand national weather services. Participatory research and col-laboration between farmers and the climate community cancontribute to build the human, social and political capitals tosupport a network that focuses on the process of developingknowledge for adaptation. Adaptive capacity in this contextwill entail connecting institutions, building networks, and ne-gotiating local and new knowledge to deal with uncertaintyand inform strategies that build the capacity to adapt.
Acknowledgements.The authors are grateful to the families ofeleven rural communities who collaborated in the project, as well asthe research team in Adapting to Change in the Andean Highlands:Practices and Strategies to Address Climate and Market Risks inVulnerable Agroecosystems. Partial funding for this research wasprovided by the United States Agency for International Develop-ment and the generous support of the American People for the Sus-tainable Agriculture and Natural Resources Management Collabo-rative Research Support Program (SANREM CRSP) under terms ofCooperative Agreement No. EPP-A-00-04-00013-00 to the Officeof International Research and Development, Virginia PolytechnicInstitute and State University.
Thank you to the international modeling groups for providingtheir data for analysis, the Program for Climate Model Diagno-sis and Intercomparison (PCMDI) for collecting and archiving themodel data, the JSC/CLIVAR Working Group on Coupled Mod-elling (WGCM) and their Coupled Model Intercomparison Project(CMIP3) and Climate Simulation Panel for organizing the model
data analysis activity, and the IPCC WG1 TSU for technical sup-port. The IPCC Data Archive at Lawrence Livermore National Lab-oratory is supported by the Office of Science, US Department ofEnergy.
References
Alexander, L. V. and Arblaster, J. M.: Assessing trends in ob-served and modelled climate extremes over Australia in re-lation to future projections, Int. J. Climatol., 29, 417–435,doi:10.1002/joc.1730, 2009.
Chen, C. T. and Knutson, T.: On the verification and comparisonof extreme rainfall indices from climate models, J. Climate, 21,1605–1621, doi:10.1175/2007JCLI1494.1, 2008.
Frich, P., Alexander, L. V., Della Marta, P., Gleason, B., Haylock,M., Tank, A. M. G. K., and Peterson, T.: Observed coherentchanges in climatic extremes during the second half of the twen-tieth century, Clim. Res., 19, 193–212, 2002.
Gilles, J. and Valdivia, C.: Local Forecast Communication in theAltiplano, B. Am. Meteorol. Soc., 90, 85–91, 2009.
Haylock, M. R., Peterson, T. C., Alves, L. M., Ambrizzi, T., Anun-ciacao, Y. M. T., Baez, J., Barros, V. R., Berlato, M. A., Bidegain,M., Coronel, G., Corradi, V., Garcia, V. J., Grimm, A. M., Karoly,D., Marengo, J. A., Marino, M. B., Moncunill, D. F., Nechet, D.,Quintana, J., Rebello, E., Rusticucci, M., Santos, J. L., Trebejo,I., and Vincent, L. A.: Trends in total and extreme South Ameri-can rainfall in 1960–2000 and links with sea surface temperature,J. Climate, 19, 1490–1512, doi:10.1175/JCLI3695.1, 2006.
Lobell, D. B., Burke, M. B., Tebaldi, C., Mastrandrea, M. D., Fal-con, W. P., and Naylor, R. L.: Prioritizing Climate Change Adap-tation Needs for Food Security in 2030, Science, 319, 607–610,2008.
Mayer, E.: The Articulated Peasant, Westvies Press, Boulder, Col-orado, 2002.
Meehl, G. A., Covey, C., Delworth, T., Latif, M., McAvaney,B., Mitchell, J. F. B., Stouffer, R. J., and Taylor, K. E.:The WCRP CMIP3 multimodel dataset – A new era in cli-mate change research, B. Am. Meteorol. Soc., 88, 1383–1394,doi:10.1175/BAMS-88-9-1383, 2007.
Orlove, B., Chiang, J., and Cane, M.: Forecasting Andean rainfalland crop yield from the influence of El Nino on Pleiades visibil-ity, Nature, 403, 68–71, 2000.
Adv. Geosci., 33, 69–77, 2013 www.adv-geosci.net/33/69/2013/

C. Valdivia et al.: Climate trends and projections for Andean Altiplano and strategies for adaptation 77
Seth, A., Thibeault, J., Garcia, M., and Valdivia, C.: Mak-ing sense of 21st century climate change in the Alti-plano: Observed trends and CMIP3 projections, Ann. Assoc.Am. Geogr., Special Issue: Climate Change, 100, 835–865,doi:10.1080/00045608.2010.500193, 2010.
Slovic, P. and Weber, E. U.: Perception of Risk Posed by ExtremeEvents. Risk Management Strategies in an Uncertain World, Pal-isades, New York, 12–13 April, 2002.
Sperling, F., Valdivia, C., Quiroz, R., Valdivia, R., Angulo, L.,Simeon, A., and Noble, I.: Transitioning to Climate Resilient De-velopment – Perspectives from Communities of Peru, in: ClimateChange Series No. 115, The World Bank Environment Depart-ment Papers, Sustainable Development Vice Presidency, Wash-ington DC, 103 pp., 2008.
Thibeault, J.: Changing Climate in the Bolivian Altiplano, DoctoralDissertation, University of Connecticut, Published by ProquestDissertations and Theses, 2010.
Thibeault, J., Seth, A., and Garcıa, M.: Changing climate inthe Altiplano: CMIP3 projections for temperature and pre-cipitation extremes, J. Geophys. Res.-Atmos., 115, D08103,doi:10.1029/2009JD012718, 2010.
Valdivia, C.: Andean Livelihoods and the Livestock Portfolio, Cul-ture and Agriculture, 26, 19–29, 2004.
Valdivia, C. and Gilles, J.: Gender and Resource Management:Households and Groups, Strategies and Transitions, Agr. Hum.Values, 18, 5–9, 2001.
Valdivia, C., Dunn, E., and Jette, C.: Diversification as a Risk Man-agement Strategy in an Andean Agropastoral Community, Am.J. Agr. Econ., 78, 1329–1334, 1996.
Valdivia, C., Jimenez, E., and Romero, A.: El Impacto de los Cam-bios Climaticos y de Mercado en Comunidades Campesinas delAltiplano de La Paz (The impact of climate and market changesin peasant communities of the Altiplano of La Paz), Umbrales,Ediciones Plural, La Paz Bolivia, 16, 233–262, 2007.
Valdivia, C., Seth, A., Gilles, J., Garcıa, M., Jimenez, E., Cu-sicanqui, J., Navia, F., and Yucra, E.: Adapting to ClimateChange in Andean Ecosystems: Landscapes, Capitals, andPerceptions Shaping Rural Livelihood Strategies and LinkingKnowledge Systems, Ann. Assoc. Am. Geogr., 100, 818–834,doi:10.1080/00045608.2010.500198, 2010.
Vincent, L. A., Peterson, T. C., Barros, V. R., Marino, M. B., Rustic-ucci, M., Carrasco, G., Ramirez, E., Alves, L. M., Ambrizzi, T.,Berlato, M. A., Grimm, A. M., Marengo, J. A., Molion, L., Mon-cunill, D. F., Rebello, E., Anunciacao, Y. M. T., Quintana, J., San-tos, J. L., Baez, J., Coronel, G., Garcia, J., Trebejo, I., Bidegain,M. Haylock, M. R., and Karoly, D.: Observed trends in indicesof daily temperature extremes in South America 1960–2000, J.Climate, 18, 5011–5023, doi:10.1175/JCLI3589.1, 2005.
www.adv-geosci.net/33/69/2013/ Adv. Geosci., 33, 69–77, 2013