Embed Size (px)
Citation preview
San Jose State UniversitySJSU ScholarWorks
Master's Theses Master's Theses and Graduate Research
Summer 2012
Climate-Related Floral and Vegetative SizeVariation in Leptosiphon androsaceus(Polemoniaceae)Aggie MorrowSan Jose State University
Follow this and additional works at: http://scholarworks.sjsu.edu/etd_theses
This Thesis is brought to you for free and open access by the Master's Theses and Graduate Research at SJSU ScholarWorks. It has been accepted forinclusion in Master's Theses by an authorized administrator of SJSU ScholarWorks. For more information, please contact [email protected].
Recommended CitationMorrow, Aggie, "Climate-Related Floral and Vegetative Size Variation in Leptosiphon androsaceus (Polemoniaceae)" (2012). Master'sTheses. 4202.http://scholarworks.sjsu.edu/etd_theses/4202
i
CLIMATE-RELATED FLORAL AND VEGETATIVE SIZE VARIATION IN LEPTOSIPHON ANDROSACEUS (POLEMONIACEAE)
A Thesis
Presented to
The Faculty of the Department of Biological Sciences
San José State University
In Partial Fulfillment
of the Requirements for the Degree
Master of Science
by
Aggie Morrow
August 2012

ii
© 2012
Aggie Morrow
ALL RIGHTS RESERVED

iii
The Designated Thesis Committee Approves the Thesis Titled
CLIMATE-RELATED FLORAL AND VEGETATIVE SIZE VARIATION IN LEPTOSIPHON ANDROSACEUS (POLEMONIACEAE)
By
Aggie Morrow
APPROVED FOR THE DEPARTMENT OF BIOLOGICAL SCIENCES
SAN JOSÉ STATE UNIVERSITY
August 2012
Dr. Susan C. Lambrecht Department of Biological Sciences
Dr. Rodney G. Myatt Department of Biological Sciences
Dr. M. Beth Dawson Department of Biological Sciences
iv
ABSTRACT
CLIMATE-RELATED FLORAL AND VEGETATIVE SIZE VARIATION IN LEPTOSIPHON ANDROSACEUS (POLEMONIACEAE)
by Aggie Morrow
Phenotypic plasticity in plants is a vital adaptive response to changing
environmental conditions. Floral and vegetative morphology often varies as
biotic and abiotic factors vary. Variation is the basis of evolution, and natural
selection, acting on trait variation, can lead to speciation. For this study, floral
and vegetative character traits of false babystars (Leptosiphon androsaceus,
Polemoniaceae) were analyzed within four populations at Henry W. Coe State
Park in 2011. Traits were measured to assess changes in size along a moisture
availability gradient. Stable carbon isotope ratio (δ13C) samples were collected to
measure integrated water-use efficiency (WUE) as it related to precipitation and
floral size. Sizes of floral and vegetative characters varied significantly between
the drier and wetter regions. Floral and vegetative character sizes for L.
androsaceus decreased from the wetter to the drier region. The ratio of floral
area/leaf area increased as precipitation decreased, suggesting that leaves may
have incurred a physiological cost from floral growth within the drier region. A
difference in WUE, as it related to trait size and precipitation, was not found for
this study year. These results provide evidence that floral and vegetative
characters of L. androsaceus vary in size in response to water-limiting conditions.

v
ACKNOWLEDGEMENTS
I would like to thank my advising committee, Dr. M. Beth Dawson and Dr.
Rodney G. Myatt for their positive support, suggestions, and comments. I am
thankful to Dr. Susan C. Lambrecht for her commitment, encouragement, and
exhaustive editing. This project truly would not have been possible without her
guidance and expertise.

vi
TABLE OF CONTENTS
Introduction……………………………………………………………………………...1
Biotic selection on floral traits…………………………………………………….2
Variation in vegetative traits in relation to the abiotic environment…………..4
Variation in floral traits in relation to moisture availability……………………..6
Possible mechanisms for variation in floral traits in relation to moisture
availability…………………………………………………………………………..8
Materials and Methods………………………………………………………………..14
Study area…………………………………………………………………………14
Abiotic measurements……………………………………………………………15
Character measurements………………………………………………………..16
Stable carbon isotope measurements………………………………………….20
Data analyses……………………………………………………………………..21
Tests of Normality………………………………………………………………...23
Results………………………………………………………………………………….24
Abiotic measurements…………………………………………………………...24
Comparison of characters between regions in Coe……………………...…...27
Character correlations…………………………………………………………...38
Character size and relationship across the precipitation gradient…………..40
Relationship between δ13C and floral characters……………………………..42
Discussion……………………………………………………………………………...43
Floral and vegetative character variation related to moisture availability…..43
Plasticity in floral and leaf traits………………………..………………………..47

vii
Strategies for reducing exposure to water-limited conditions…………..…..48
Conclusions………………………………………………………………………51
Literature Cited………………………………………………………………………...54
viii
LIST OF FIGURES
Figure 1. Diagram of L. androsaceus floral characters measured…………...….18
Figure 2. Diagram of L. androsaceus vegetative characters measured…..…....19
Figure 3. Volumetric soil moisture content for the four populations at Coe…….25
Figure 4. Floral character means differing between the wetter and drier
regions……………………………………………………………………………….....30
Figure 5. Leaf and floral character means differing between the wetter and
drier regions…………………………………………………………………………….31
Figure 6. Floral and leaf area character mean differences between the wetter
and drier regions……………………………………………………………………….32
Figure 7. Floral size differences among the four populations………….………...34
Figure 8. Leaf number differences among the four populations………………...35
Figure 9. Scatterplot of principle components for the wetter region of Coe…….37
Figure 10. Scatterplot of principle components for the drier region of Coe…….38
Figure 11. The relationship between average FA/LA ratios and site moisture…41
Figure 12. The relationship between average leaf area and site moisture……..42
ix
LIST OF TABLES
Table 1. Abiotic conditions for the four populations at Coe……………………...25
Table 2. Percent by weight of primary soil separates for each population…….26
Table 3. Basic statistics for floral and vegetative traits within the wetter and
drier regions……………………………………………………………………………27
Table 4. ANOVA tests of morphological characters based on general linear model……………………………………………………………………………………28
Table 5. Character loadings on principle components analysis for floral and
vegetative characters for the wetter, western and drier, eastern regions……….36
Table 6. Wetter region character correlations……………………………………..39
Table 7. Drier region character correlations….……………………………………40
Table 8. Regression analyses of floral and leaf characters to site moisture…...41
Table 9. Regression analyses of δ13C to floral traits……………………………...43

1
INTRODUCTION
Many factors act on plants to affect their growth, morphology, and
physiology. Plants are complex organisms that are constantly being shaped by
environmental forces. These environmental pressures act on phenotype,
directing morphological and physiological variation in plants, establishing the
mechanisms for adaptation and natural selection. Changes in floral and
vegetative characters can be driven by plasticity, pollinators, herbivores,
temperature, and moisture availability (Stebbins, 1970; Schlichting and Pigliucci,
1998; Galen, 1999; Harder and Barrett, 2006). Assessing phenotypic change as
it relates to environmental factors enhances our understanding of variation in
plants.
Plants have enormous capacity for developmental plasticity, and variation
in physiological and morphological traits can result from the interaction between
an organism’s genotype and the environment (Schlichting, 1986). Variation in
plants is not always adaptive, and changes in morphology can occur by chance
through changes in the frequencies of alleles in a population due to genetic drift.
Trait variation in plants may also result from plants acclimating to biotic and
abiotic shifts in the environment. Phenotypic plasticity allows an organism to
modify its physiology and morphology in response to ever shifting environmental
conditions. Traditionally, ecologists have focused on pollinators and herbivores
as the primary forces driving variation in floral traits, with these studies
dominating the literature. Studies involving changes in floral and vegetative traits

2
due to abiotic influences, such as moisture availability, have increased in recent
years, yet the forces by which the abiotic environment affects trait variation are
not fully understood.
Biotic selection on floral traits
For outcrossing plants that rely on animal pollinators for reproduction,
increasing pollinator visitation through floral attractiveness is crucial to the
pollination process and reproductive success. Biotically driven variation in floral
phenotype is largely mediated by pollinator preference for floral scent, color, and
corolla display. The evolution of floral scent has allowed plants to attract animal
pollinators that are nocturnally active, such as bat and moth pollinators, to mimic
mating pheromones emitted by insects, and target scent preferences of specific
pollinators (Galen and Kevan, 1983; Chess et al, 2008; Raguso, 2008). The
release of floral scents, which are predominantly a mix of volatile secondary plant
metabolites, typically corresponds with a flower’s optimal pollination stage
(Larcher, 2003).
Plants also use floral color to attract potential pollinators. Floral color
increases a plant’s attractiveness to pollinators and serves, partially, as a cue for
nectar reward (both quantity and quality) (Meléndez-Ackerman et al, 1997).
Flower color can be an attractant for a general array of pollinators and plant-
specific pollinators. Color can serve as a guide for long distance detection by
possible pollinators as well (Sutherland and Vickery, 1993). Floral color has

3
evolved in many species due to pollinator preference, e.g., snapdragon
(Antirrhinum, Scrophulariaceae; Jones and Reithel, 2001; Odell et al, 1999),
monkeyflower (Mimulus spp., Phrymaceae; Schemske and Bradshaw, 1999),
and columbine (Aquilegia spp., Ranunculaceae; Hodges et al, 2003).
The role that pollinators play in driving floral size variation has been well
documented (Galen and Stanton, 1989; Campbell, 1996; Totland, 2001; Elle and
Carney, 2003). Studies have shown that selection for flower size occurring within
species is partially mediated by pollinator preference for larger flowers. For
example, Conner and Rush (1996) tallied pollinator visitation to flowers of wild
radish (Raphanus raphanistrum, Brassicaceae) based on corolla size in an
experimental garden and manipulative treatment. Flower size was found to have
a significant impact on flower visitation rates by insects in both the experimental
garden and manipulative treatments, with larger flowers attracting more pollinator
visits than smaller flowers.
Floral variation can also be driven by conflicting forces due to pollinator
and predator preferences. Trade-offs in corolla size can occur when floral
morphology directed at pollinator attraction increases reproductive fitness, while
larger flowers inadvertently attract floral and seed predators, thereby reducing
reproductive fitness. Many experimental studies have documented the impact of
pollinators and herbivores on phenotypic variability in flowers (Stebbins, 1970;
Cresswell and Galen, 1991; Campbell et al, 2002; Elle and Hare, 2002; Glaettli

4
and Barrett, 2008; Parachnowitsch and Kessler, 2010). Cariveau et al (2004)
studied the simultaneous impacts of pollinators and predators (plume moth and
Phytomyza species of fly larvae) of flowers and seeds on the morphology of
paintbrush (Castilleja linariaefolia, Scrophulariaceae) in the Rocky Mountains.
They found that predation on calyces and seeds affected flower number, calyx
length, seed set, and plant height. Although the flowers of C. linariaefolia are
small and inconspicuous, the calyces are large, bright red, and showy, which are
selected for by pollinators. Florivores and seed predators that visited C.
linariaefolia reduced the fitness of plants with showy displays, thereby affecting
selection on larger floral organs.
Variation in vegetative traits in relation to the abiotic environment
Plants adapt to drought stress in a number of ways, including limiting
growth, which results in smaller vegetative size. Decreasing the surface area of
stems and leaves reduces the amount of water lost from the plant’s surface.
Growth depends mostly on cell expansion, which is controlled by water and
carbon inputs, and acclimation to limited water availability can result in a
reduction in cell expansion and development (Taiz and Zeiger, 2002; Mitchell et
al, 2008; Pantin et al, 2011). Studies of plant responses to changes in the
environment have shown a size reduction in vegetative characters for plants
growing in moisture-limiting conditions (e.g., Clausen et al, 1941; Hiesey et al,
5
1942; Parkhurst and Loucks, 1972; Dudley, 1996; Chaves et al, 2003; Heschel
and Riginos, 2005).
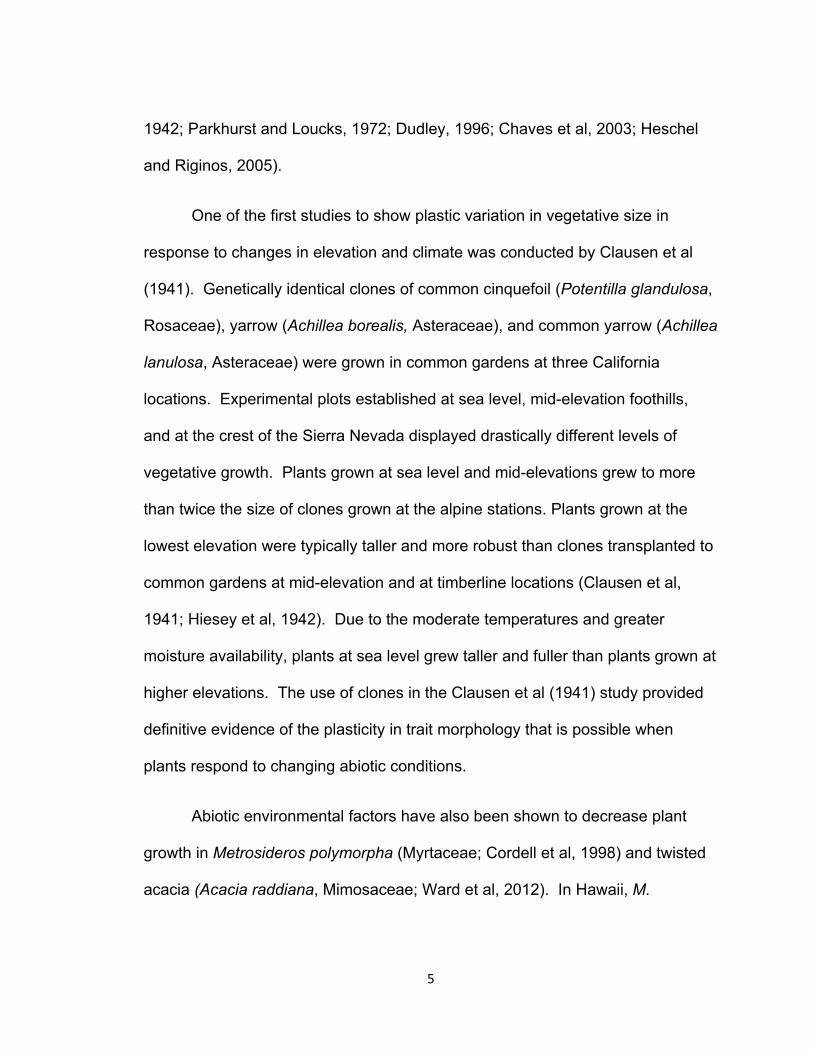
One of the first studies to show plastic variation in vegetative size in
response to changes in elevation and climate was conducted by Clausen et al
(1941). Genetically identical clones of common cinquefoil (Potentilla glandulosa,
Rosaceae), yarrow (Achillea borealis, Asteraceae), and common yarrow (Achillea
lanulosa, Asteraceae) were grown in common gardens at three California
locations. Experimental plots established at sea level, mid-elevation foothills,
and at the crest of the Sierra Nevada displayed drastically different levels of
vegetative growth. Plants grown at sea level and mid-elevations grew to more
than twice the size of clones grown at the alpine stations. Plants grown at the
lowest elevation were typically taller and more robust than clones transplanted to
common gardens at mid-elevation and at timberline locations (Clausen et al,
1941; Hiesey et al, 1942). Due to the moderate temperatures and greater
moisture availability, plants at sea level grew taller and fuller than plants grown at
higher elevations. The use of clones in the Clausen et al (1941) study provided
definitive evidence of the plasticity in trait morphology that is possible when
plants respond to changing abiotic conditions.
Abiotic environmental factors have also been shown to decrease plant
growth in Metrosideros polymorpha (Myrtaceae; Cordell et al, 1998) and twisted
acacia (Acacia raddiana, Mimosaceae; Ward et al, 2012). In Hawaii, M.

6
polymorpha occupies a wide range of habitats and shows high morphological
diversity throughout its range. In a study by Cordell et al (1998), character
variation in M. polymorpha was analyzed at different elevations with varying
precipitation. Vegetative measurements from field and greenhouse grown plants
showed a reduction in foliar size with increasing elevation and decreasing
moisture. Similarly, in a study of A. raddiana in the Negev desert of Israel,
vegetative traits were measured after being grown under different watering
regimes (Ward et al, 2012). Vegetative characters grew smaller in the low water
treatment and larger in the high water treatment.
Variation in floral traits in relation to moisture availability
Floral size variation due to abiotic forces, such as moisture limitation, can
elicit a change in phenotype that is comparable to pollinator driven variation in
flower size. During growth and maintenance flowers use large amounts of water.
Water lost through transpiration can be high in flowers because they lack control
of their stomata (McDowell and Turner, 2002; Feild et al, 2009). Therefore,
smaller flowers, which require less water investment from the plant, will be more
beneficial in arid environments. In numerous field and greenhouse studies, floral
size has been shown to decrease when water availability was reduced (Galen et
al, 1999; Jonas and Geber, 1999; Elle and Hare, 2002; Eckhart et al, 2004; Elle,
2004; Fabbro and Körner, 2004; Hughey and Lambrecht, 2007; Lambrecht and
Dawson, 2007). Variation in floral size has been demonstrated along naturally
7
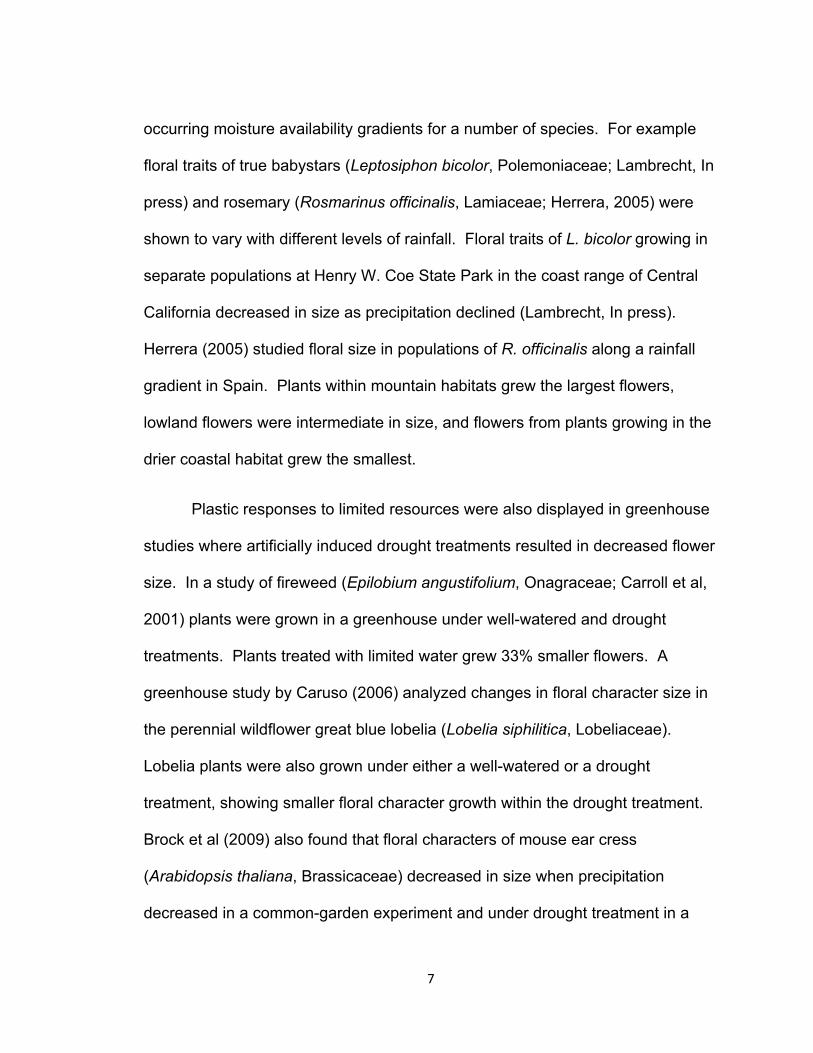
occurring moisture availability gradients for a number of species. For example
floral traits of true babystars (Leptosiphon bicolor, Polemoniaceae; Lambrecht, In
press) and rosemary (Rosmarinus officinalis, Lamiaceae; Herrera, 2005) were
shown to vary with different levels of rainfall. Floral traits of L. bicolor growing in
separate populations at Henry W. Coe State Park in the coast range of Central
California decreased in size as precipitation declined (Lambrecht, In press).
Herrera (2005) studied floral size in populations of R. officinalis along a rainfall
gradient in Spain. Plants within mountain habitats grew the largest flowers,
lowland flowers were intermediate in size, and flowers from plants growing in the
drier coastal habitat grew the smallest.
Plastic responses to limited resources were also displayed in greenhouse
studies where artificially induced drought treatments resulted in decreased flower
size. In a study of fireweed (Epilobium angustifolium, Onagraceae; Carroll et al,
2001) plants were grown in a greenhouse under well-watered and drought
treatments. Plants treated with limited water grew 33% smaller flowers. A
greenhouse study by Caruso (2006) analyzed changes in floral character size in
the perennial wildflower great blue lobelia (Lobelia siphilitica, Lobeliaceae).
Lobelia plants were also grown under either a well-watered or a drought
treatment, showing smaller floral character growth within the drought treatment.
Brock et al (2009) also found that floral characters of mouse ear cress
(Arabidopsis thaliana, Brassicaceae) decreased in size when precipitation
decreased in a common-garden experiment and under drought treatment in a

8
greenhouse. These studies demonstrated the advantage that reduced flower
size imparts to plants growing in drier conditions. Floral growth is water
intensive, and a reduction in floral size can be an adaptive strategy utilized by
plants growing in xeric habitats to increase survival. The floral size variation
demonstrated in these experiments may be due to a plastic response to
decreased moisture availability, a strategy for coping with limited resources, or a
combination of plasticity and adaptation.
Possible mechanisms for variation in floral traits in relation to moisture availability
The underlying mechanisms by which plants divert resources and
maintain floral growth are important in understanding floral size variation as it
relates to water supply. Conflicting selection on floral size, mediated by selective
forces operating in opposing directions, can result in floral size variation within
species. Corolla size differences in alpine skypilot (Polemonium viscosum,
Polemoniaceae; Galen, 1999, 2000) are driven by opposing environmental
forces. Pollinators of P. viscosum have been shown to favor larger flowers over
smaller flowers. Floral size tends to be directly correlated with nectar volume,
which is highly rewarding to pollinators, reinforcing pollinator selection for larger
flowers (Cresswell and Galen, 1991). Flowers of P. viscosum grew larger when
rainfall was abundant, yet in drier environments floral growth decreased even
though pollinators preferentially visited flowers with larger corolla displays,
thereby increasing floral variation.
9
Plants often employ overlapping strategies for dealing with environmental
conditions where resources are limited. Methods of drought escape and drought
avoidance utilized by plants may function in concert to increase survival in dry
environments. Plants may escape dehydration by growing small and fast before
the driest stage of the growing season (Heschel and Riginos, 2005; Sherrard and
Maherali, 2006). This strategy of rapid growth and reproduction, and associated
reduction in floral size, may occur before or early in the decline of water
availability. Drought avoidance can also be achieved through a physiological
response to decreased moisture availability. Plants resist desiccation when
water is limited by reducing stomatal conductance, thereby decreasing water loss
through transpiration (Kemp and Culvenor, 1994; Mitchell et al, 2008). Plants
maintain low photosynthetic activity and growth rate during episodes of drought,
decreasing the demand for carbon and water resources that are needed for
larger floral and vegetative growth (Thomas, 1997; Galen, 1999; Correia et al,
2001).
Vegetative growth in arid environments is mediated by limited water
uptake and mechanisms that prevent water loss. Regulation of CO2 gas
exchange and water lost through transpiration are controlled by foliar stomata
responding to internal and external cues. Stomatal closure is triggered by
decreased foliar water potential, reduced cell turgor, and low atmospheric
humidity (Galen, 1999; Chaves et al, 2002). When the availability of moisture
declines, plants close their stomata to limit water loss, but also reduce CO2
10
uptake in the process. The ratio of carbon uptake to water lost through
transpiration is a measure of a plant’s water-use efficiency (WUE). Water-use
efficiency in plants may be measured using instantaneous measurements of gas
exchange, or inferred from stable carbon isotope ratios, which provide a more
integrative measure. There are two stable isotopes of carbon that occur naturally
in our atmosphere, with 12C making up 98.9%, and 13C making up 1.1% of
atmospheric CO2 (Farquhar et al, 1989). During the carboxylation stage of the
Calvin Cycle of photosynthesis, the enzyme rubisco (ribulose-1,5 -bisphosphate
carboxylase oxygenase) discriminates against 13C in favor of the lighter 12C.
When intracellular CO2 concentrations drop due to stomatal closure, the
available 12C is assimilated first. When that supply is gone, 13C is assimilated.
Therefore, as stomata close, the amount of 13C assimilated into leaf tissue
increases. Measuring carbon isotope levels within photosynthetic plant tissue
can be used as an indication of long-term patterns of stomatal closure and
dehydration avoidance (Geber and Dawson, 1990; Chaves et al, 2003). Water-
use efficiency has been studied in relation to moisture availability and vegetative
morphology, and increased rates of WUE have been detected in drier
environments. Studies have shown that smaller plant size, resulting from low
moisture availability, was associated with higher levels of WUE (Dudley, 1996;
Martin and Thorstenson, 1988; Caruso et al, 2005).
Floral size reduction in dry environments is due to a whole plant response
to the higher levels of water needed for floral growth and maintenance. Water is

11
essential for floral growth and function, and large amounts of water can be lost
from flowers (Galen et al, 1999; McDowell and Turner, 2002; Feild et al, 2009).
Water cannot be taken up by flowers directly, and floral organs lack the ability to
control water loss through their stomata. The water needed for floral function is
supplied directly from vegetative structures (de la Barrera and Nobel, 2004;
Galen, 2005; Feild et al, 2009), and the amount of water supplied from vegetative
organs affects floral growth, maintenance, and turgidity. The inability to capture
water and the lack of control mechanisms to limit water loss by flowers makes
floral growth very costly to the whole plant. Growth and maintenance of larger
flowers in water-limited environments is physiologically more costly to plants than
those in more mesic environments (Galen et al, 1999; Galen, 2005). Therefore,
a reduction in floral surface area reduces the loss of water through floral
transpiration and increases the conservation of a plant’s water supply in dry
environments (Galen, 1999; Campbell and Reece, 2002).
During each stage of floral and vegetative growth plants respond to
changes in environmental conditions. Variation in floral size displayed in dry
environments results from the physiological interaction between flowers and
vegetative structures. For example, in Polemonium viscosum, Galen et al (1999)
found that flowers grew smaller in the drier krummholz environment as opposed
to those growing in the wetter tundra habitat. Results of a potometer experiment
showed larger flowers required more water during floral growth and maintenance
than did smaller flowers. Their findings suggest that floral maintenance reduces

12
the amount of water available to vegetative structures. Gas exchange
measurements displayed a correlation between stomatal closure due to floral
water loss, and rates of foliar photosynthesis. Larger flowered plants that grew
under drier conditions had lower rates of photosynthesis than did plants with
smaller flowers growing under the same conditions. Additionally, smaller flowers
showed greater cell densities, which may have resulted in cells using less water
to maintain cell turgor. McDowell and Turner (2002) found that reproduction in
trailing blackberry (Rubus ursinus, Rosaceae) affected photosynthetic capacity.
Plants of R. ursinus displayed lower leaf water potential and reduced stomatal
conductance during reproduction as compared to the closely related, invasive
species Himalayan blackberry (Rubus discolor, Rosaceae). The reduction in
water potential was associated with transpirational water loss from reproductive
structures.
The effects of floral maintenance and reproduction on vegetative
physiology can result in lowered water potential, reduced photosynthesis, and
reduced carbon uptake in foliar structures. Leaves that decrease water loss by
closing their stomata might compensate for the transpiration of water from
flowers. Assessing the relationship between WUE and floral and vegetative size
reveals the floral costs imposed on the whole plant when water availability is low.
Lambrecht and Dawson (2007) sampled plants growing in populations at three
field sites in Oregon that varied in rainfall and soil moisture content. Floral size
measurements were made on a range of native and non-native plant species.

13
Plants showed an increase in WUE with increasing flower size, suggesting that
leaves were closing their stomata to compensate for floral water loss and its
effects on overall plant water balance. Water-use efficiency, as it relates to
morphological trait size, was also assessed in Lambrecht’s (In press) study of
Leptosiphon bicolor. Water-use efficiency increased as flower size increased.
The increase in WUE detected in this study was particularly evident in drier
environments during dry years. Within the drier sites, floral area was found to be
greater than leaf area, implying a whole plant effort to control transpiration and
limit water loss.
The current study is part of a long-term study of false babystars
(Leptosiphon androsaceus, Polemoniaceae) in Henry W. Coe State Park,
Morgan Hill, CA, that was started in 2005 by Dr. Susan Lambrecht (San José
State University). Topography varies throughout Henry W. Coe State Park, with
high ridges (600 to 900 m in elevation) divided by steep canyons and intermittent
valley bottoms. A natural precipitation gradient occurs from the western region of
the park to the eastern region. The eastern region is situated in the rain-shadow
of the coastal range and receives less precipitation than in the west. The goal of
this study, as a part of the multi-year study, was to assess variation in floral and
vegetative morphology of the annual wildflower L. androsaceus within a single
year. This insect-pollinated species is in a genus that has shown high levels of
character variation in relation to climate (Hughey and Lambrecht, 2007;
Lambrecht, 2010), making it an ideal plant for studying precipitation related trait

14
variation. In addition, the distribution of L. androsaceus along a natural
precipitation gradient accommodates the study of climate-dependent trait
variation. Within study populations previously established by Dr. Lambrecht
along the precipitation gradient, I analyzed floral and vegetative traits to
determine whether character size varied in relation to moisture availability. In
addition, I evaluated integrated water-use efficiency in relation to floral size,
which can be an indicator of floral water costs and leaf-level water control during
flowering.
MATERIALS AND METHODS
Study area
Data were collected from four field populations at Henry W. Coe State
Park (Coe), from April through June, 2011. Coe is located in the Diablo Range
east of Gilroy, California. The park is the largest state park in northern California,
consisting of 35,000 ha. Plant communities within the park include grassland,
marsh, riparian, chaparral, oak woodland, and mixed coniferous forest.
Two populations of the native plant Leptosiphon androsaceus were
studied within the drier, eastern region of the park, and two populations were
studied within the wetter, western region of the park. The western region of Coe
receives an average of 30% more precipitation per year than the eastern region,
which is situated in the rain shadow. Western populations are located ~ 0.8 km
apart and are named Domino and Bobcat. The Domino population is located in
15
an oak woodland at 731 m a. s. l. (37˚07.260’ N, 121˚26.884’ W). The Bobcat
population lies along a ridge at 740 m a. s. l. (37˚07.641’ N, 121˚27.201’ W) in an
oak woodland. Populations within the eastern region are named Mustang and
Woodpecker and are situated ~ 3 km apart. The Mustang population is located at
570 m a. s. l. (37˚10.687’ N, 121˚22.309’ W) in a dry, exposed, chaparral
community. The L. androsaceus population known as Woodpecker grows in an
oak woodland and is located at 340 m a. s. l. (37˚09.717’ N, 121˚23.701’ W).
Abiotic measurements
Soil moisture content and soil texture were measured to determine
whether there were any soil differences among the four sites. Volumetric soil
moisture content was measured from five permanently marked locations within
each site during four data collection visits spanning four weeks. Soil moisture
readings were taken at a depth of 15 cm, which corresponds to maximum rooting
depth of L. androsaceus, using a time-domain reflectometry probe (Field Scout
TDR 200, Spectrum Technologies, Plainfield, IL).
Tests were completed at each site to determine soil texture using the
United States Department of Agriculture - Natural Resources Conservation
Service (USDA – NRCS) texture-by-feel method (USDA – NRCS, 2012). Soil
samples from each population were collected and taken to the lab for further
analysis. Samples were mixed with ammonium hydroxide and water, agitated for
twenty minutes, and then left to settle. After three days the percent by weight of

16
the primary soil separates of sand, silt, and clay were calculated. Percent ratios
of soil separates were charted on the USDA - NRCS established Soil Texture
Triangle (USDA – NRCS, 2012).
Slope and aspect measurements for the four study locations were
completed to assess the micro-environment in which the separate populations of
L. androsaceus grow. The slope and aspect of all four research sites were
recorded using a clinometer, and standard compass.
Average annual rainfall was determined to compare precipitation across
the two study regions of Coe. Rainfall averages for the study year (October 2010
through September 2011) were estimated from Santa Clara Valley Water District
rainfall gauges stationed throughout Coe (ALERT Precipitation Gauge
Information, 2012). Analyses of precipitation from 2005 – 2009 by S. Lambrecht
have established that these populations occur along a moisture gradient.
Character measurements
Leptosiphon androsaceus is a native California annual, with palmate
leaves having oblanceolate to linear lobes situated in multiple leaf pairs along the
main stem. The inflorescence is umbel-like with many long-tubed flowers in a
head. The salverform corolla is typically white to pink or lavender with lobes
measuring 5-10 mm long (Hickman, 1993). The Polemoniaceae family has
recently been subjected to reorganization to ensure monophyletic grouping within
genera. The genus Linanthus, the third largest in the family, has been split into

17
two major clades: Linanthus and Leptosiphon (Bell and Patterson, 2000). The
species androsaceus was previously classified within the Linanthus genus, but
has recently been reclassified as a species of Leptosiphon. Leptosiphon
androsaceus is dispersed widely throughout California and is commonly found
growing in grassland, oak woodland, coastal scrub, and chaparral communities.
Within each of the four populations, floral and vegetative sizes were
measured on 30 randomly selected plants (n = 120 for the four populations
combined). Plants were selected when at least three flowers in the umbel-head
were fully opened. Floral heads with fewer than three opened flowers or more
than two older, withering flowers were avoided, as these were not considered to
be at the peak of reproduction. Floral measurements, which were made with a
caliper to the nearest 0.5 mm, included corolla diameter (measured across the
open corolla face), individual petal lobe length and width (averaged from three
petal lobes on an individual flower in the center of the umbel head), corolla tube
length (measured from the juncture of the involucre and corolla tube to the base
of the corolla face), calyx length (measurement of the longest sepal), and stigma-
to-anther distance measured from the middle of the anther head to the center of
the stigma (Fig. 1). These floral traits included those that are most commonly
used to distinguish between species of Leptosiphon and, therefore, should have
some genetic basis.

18
FIG. 1. Diagram of L. androsaceus floral characters measured. (a) Petal lobe width, (b) petal lobe length, (c) corolla diameter, (d) corolla tube length, (e) calyx length, and (f) stigma‐to‐anther distance.
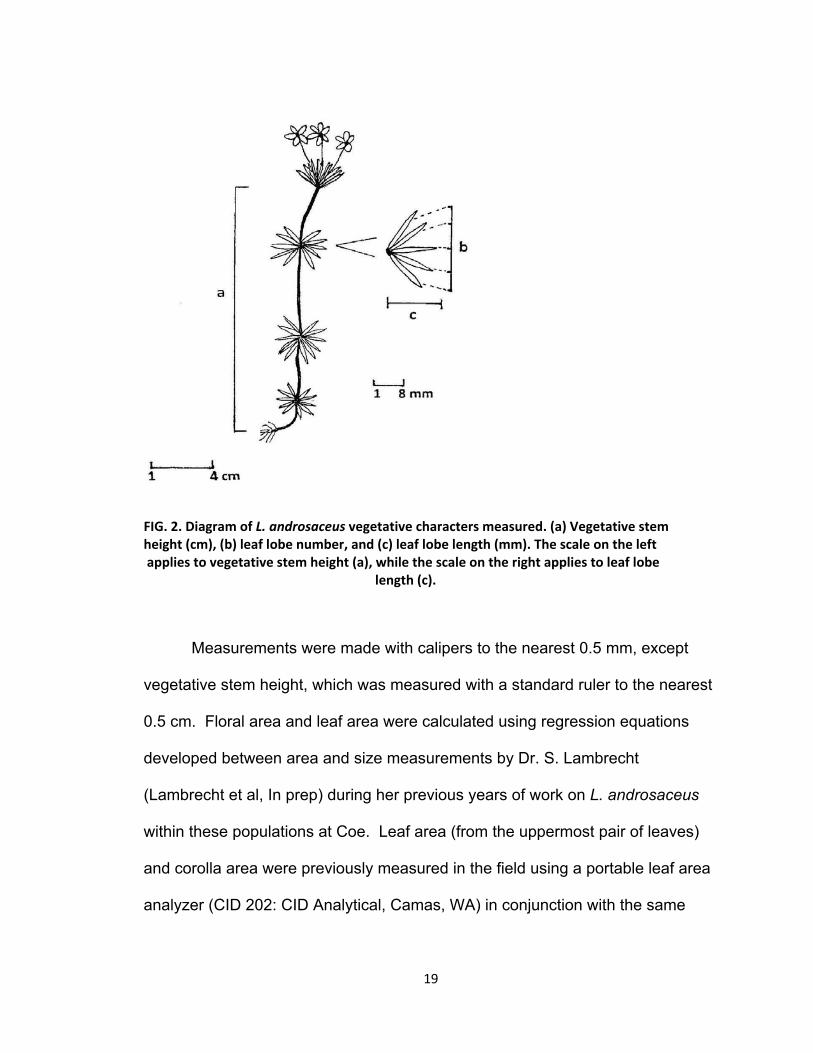
Vegetative measurements included leaf number (the number of leaf
whorls along the stem below the umbel, excluding cotyledons), lobe number (the
number of lobes in the uppermost cauline whorl), leaf length (length of the
longest lobe on the palmate leaf), and vegetative stem height measured from the
soil surface to the base of the umbel (Fig. 2).
19
FIG. 2. Diagram of L. androsaceus vegetative characters measured. (a) Vegetative stem height (cm), (b) leaf lobe number, and (c) leaf lobe length (mm). The scale on the left applies to vegetative stem height (a), while the scale on the right applies to leaf lobe length (c).
Measurements were made with calipers to the nearest 0.5 mm, except
vegetative stem height, which was measured with a standard ruler to the nearest
0.5 cm. Floral area and leaf area were calculated using regression equations
developed between area and size measurements by Dr. S. Lambrecht
(Lambrecht et al, In prep) during her previous years of work on L. androsaceus
within these populations at Coe. Leaf area (from the uppermost pair of leaves)
and corolla area were previously measured in the field using a portable leaf area
analyzer (CID 202: CID Analytical, Camas, WA) in conjunction with the same
20
caliper size measurements made in this study. In the current study, the caliper-
measured traits were used in the regressions to estimate floral and leaf area of
the study plants. Using the regression equations to estimate floral and leaf area
from measured traits eliminates the need to destroy plants in the field
populations. Floral area was calculated using the measured corolla diameter and
petal lobe width (floral area = 1.099 – (2.737 x (1/corolla diameter x petal width)))
for each plant. Leaf area was calculated using leaf lobe length, lobe number,
and leaf number for the western region (leaf area = (-.2382 + (.011 x leaf length x
leaf lobe number)) x leaf number) and the eastern region (leaf area = (-.0847 +
(.0056 x leaf length x leaf lobe number)) x leaf number). The calculated floral
area value was divided by the calculated leaf area value to establish the floral
area/ leaf area ratio (FA/LA).
Stable carbon isotope measurements
Foliar stable carbon isotope (δ13C) ratio, or the ratio of 13C/12C in
photosynthetic tissue, was measured from randomly selected plants to infer
integrated water-use efficiency (WUE). Stable carbon isotope levels are
calculated as the ratio of 13C/12C in photosynthetic tissues relative to that of a
standard, which is fossil belemnite from the Pee Dee limestone formation in
South Carolina. Isotope ratios are calculated on a per mil (‰) scale:
δ13C ‰ = (Rsample/Rstandard -1) x 1000
(Farquhar et al, 1989).
21
To obtain δ13C samples, five plants for which size measurements were
made were collected from each of the four populations (n = 20). Collected plants
were packed in dry ice in the field to prevent desiccation and to slow any
physiological processes, and then taken to the lab at SJSU for preparation.
Samples were dried for 24 h in a drying oven at 70°C. After drying, stem and leaf
tissue were separated from floral and root tissues and ground into a fine powder
using an 8000 M (mix/mill) mechanical ball grinder (Spex CertiPrep, Metuchen,
NJ). Analyses of δ13C ratios were done on 1- 2 mg subsamples using a Delta-V
Advantage Isotope Ratio Mass Spectrometer operating in continuous-flow mode
with a Costech elemental analyzer inlet system at the Facility for Isotope Ratio
Mass Spectrometer (FIRMS, University of California, Riverside).
Data analyses
In order to test for floral, leaf, and plant size differences between the
wetter and drier regions, character means were analyzed using an analysis of
variance (ANOVA). Populations (Domino, Bobcat, Mustang, and Woodpecker)
were nested within their respective regions to test for differences in average
character sizes between populations. Due to simultaneous testing of multiple
variables, probability values were adjusted using the Bonferonni adjustment to
reduce the likelihood of erroneously rejecting a true null hypothesis (Rice, 1989).
Tukey-Kramer post hoc tests for pairwise comparisons of populations were
completed to identify which populations were significantly different from one

22
another. An ANOVA test was used to describe differences in mean δ13C ratios
between the wetter and drier regions. Variances in soil moisture content means
between populations were also analyzed for significance. Pairwise comparisons
of population differences in soil moisture content were tested by the Tukey-
Kramer method.
A principle component analysis (PCA) was used to reduce character
variables and describe the differences in floral and vegetative character size
between the two regions. Separate analyses were done for each of the regions
to establish which variables described the greatest amount of variation within the
wet and dry regions. Components describing the greatest percentage of
variance among character traits, within the wetter and drier regions, were
calculated with trait measurements and plotted for visual analysis.
The relationships between floral and vegetative characters were described
using a simple correlation analysis. Pairwise correlation coefficient values were
calculated to evaluate the correlations between measured characters within the
separate eco-regions. Character correlations were tested for significance using
the Bonferonni method.
Other data analyses were conducted to examine the continuous variation
in characters along the moisture gradient. A regression analysis was used to test
whether there was a relationship between site moisture and each of the traits of
floral area, corolla diameter, leaf area, and FA/LA. Site moisture was a ranking

23
based on values of precipitation and soil moisture measured in each of the
populations since 2005. The populations were ranked from wettest to driest:
Domino, Bobcat, Woodpecker, and Mustang.
Least squares linear regression analyses were performed to examine the
relationships between δ13C levels and floral area, corolla diameter, and the
FA/LA ratio. Post hoc power analyses of δ13C samples were conducted to
evaluate whether the sample size was large enough to avoid making a Type II
error. The post hoc power analysis applied to these data indicated that the
sample size was not large enough to insure statistical power. Using a power
threshold of 0.80 showed the sample size was too small to find a statistically
significant relationship between δ13C levels and character size. To be sufficiently
powerful, a sample size > 1,000 needed to be used to detect effect.
Tests of normality
Statistical test assumptions of normality were assessed by testing
skewness and kurtosis, and from the Shapiro-Wilks normality test. Normality
was also evaluated visually using histogram and probability plots of variables.
Residuals from statistical tests were also subjected to visual examinations for
normality. Shapiro-Wilks normality tests revealed that all characters, except leaf
number, leaf lobe number, stigma-to-anther distance, leaf area, and FA/LA were
normally distributed for the western and eastern regions, and leaf length for the
eastern region alone. Non-normal characters had significant W-values of P <
24
0.001. Assessment of normality tests, including visual evaluations, found leaf
length, stigma-to-anther distance, leaf area, and FA/LA not sufficiently fitting the
normal distribution, therefore these variables were transformed (Fernandez,
1992). Leaf length and FA/LA were log transformed, and stigma-to-anther
distance and leaf area were square transformed.
RESULTS
Abiotic measurements
There was a significant difference in average soil moisture content among
the four populations (F3,75 = 7.86, P < 0.001). Mean soil moisture content
readings for the Domino and Bobcat populations within the wetter region were
8.5% and 9.0%, respectively. Within the drier region, soil moisture content for
the Mustang population was 8.5%, and was 12.6% for the Woodpecker
population. Soil moisture content for the Woodpecker site was significantly
higher than that of the other sites (Tukey P = 0.001 as compared to Domino;
Tukey P = 0.003 as compared to Bobcat; Tukey P = 0.001 as compared to
Mustang; Fig. 3). Rainfall for the study year was 79.88 cm for the wetter region
and 57.15 cm for the drier region (ALERT Precipitation Gauge Information, 2012;
Table 1).

25
FIG. 3. Volumetric soil moisture content for the four populations at Coe. The Woodpecker population had significantly higher moisture content than the other three populations (F3,75 = 7.86, P = 0.001 for Domino; P = 0.003 for Bobcat; P = 0.001 for Mustang). TABLE 1. Abiotic conditions for the four populations at Coe. The wetter region includes Domino and Bobcat, and the drier region includes Mustang and Woodpecker.
Population Region
Annual precipitation
(cm) Soil Moisture
(%; s.e.) Soil Texture Slope (%) Aspect
Domino 8.5 (0.698) sandy loam 85 40˚
Bobcat Wetter 79.88
9.0 (0.578) sandy loam 55 10˚
Mustang 8.5 (0.807) sandy loam 95 270˚
Woodpecker Drier 57.15
12.6 (0.745) sandy loam/ sandy clay
loam 60 22˚
26
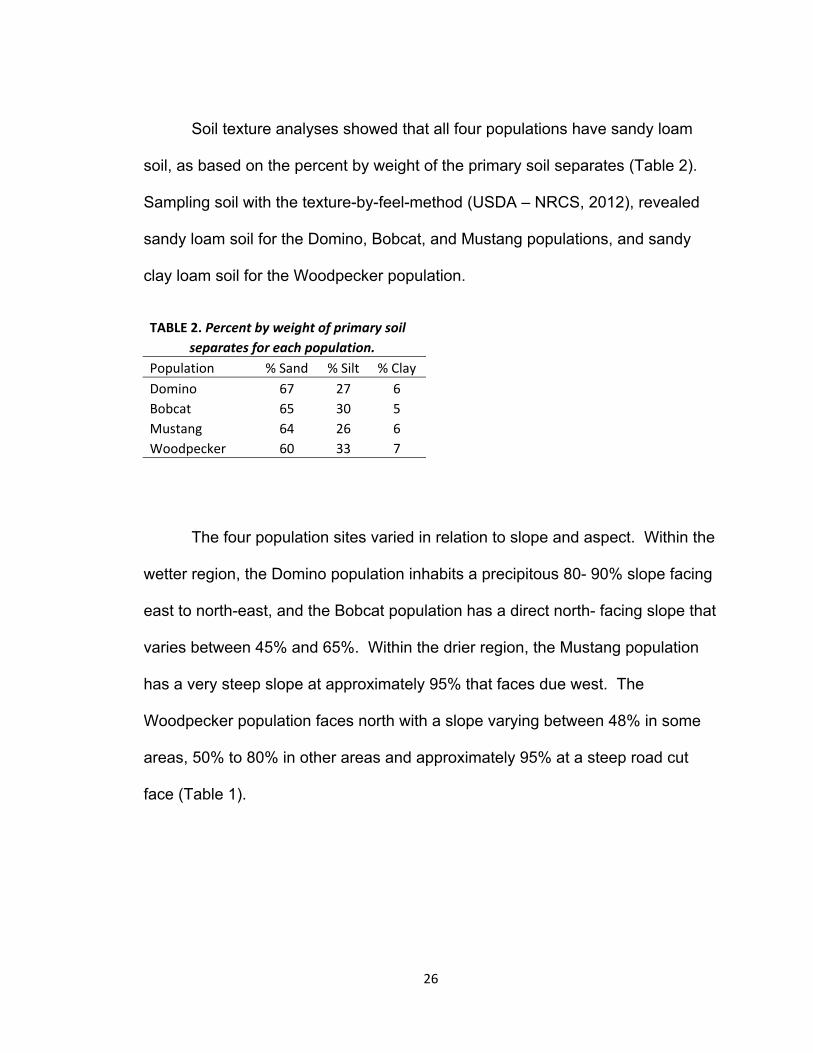
Soil texture analyses showed that all four populations have sandy loam
soil, as based on the percent by weight of the primary soil separates (Table 2).
Sampling soil with the texture-by-feel-method (USDA – NRCS, 2012), revealed
sandy loam soil for the Domino, Bobcat, and Mustang populations, and sandy
clay loam soil for the Woodpecker population.
TABLE 2. Percent by weight of primary soil
separates for each population.
Population % Sand % Silt % Clay
Domino 67 27 6
Bobcat 65 30 5
Mustang 64 26 6
Woodpecker 60 33 7
The four population sites varied in relation to slope and aspect. Within the
wetter region, the Domino population inhabits a precipitous 80- 90% slope facing
east to north-east, and the Bobcat population has a direct north- facing slope that
varies between 45% and 65%. Within the drier region, the Mustang population
has a very steep slope at approximately 95% that faces due west. The
Woodpecker population faces north with a slope varying between 48% in some
areas, 50% to 80% in other areas and approximately 95% at a steep road cut
face (Table 1).

27
Comparison of characters between regions in Coe
Statistical analyses revealed significant floral and vegetative character
differences between the different regions of Coe (Tables 3, 4 and Fig. 4, 5, 6).
From the ANOVA analysis, petal lobe length, petal lobe width (Fig. 4), calyx
length, and leaf lobe number (Fig. 5) grew larger on the wetter side than on the
drier side of Coe. Leaf area was greater for plants growing within the wetter,
western region than for those within the eastern region (Fig. 6 and Table 4). The
FA/LA ratio values were greater for plants growing in the drier region than for
those in the wetter region of Coe (Fig. 6 and Table 4).
TABLE 3. Basic statistics for floral and vegetative traits within the wetter and
drier regions. Means and standard errors (s.e.) (n = 60).
Characters Mean (s.e.) Wetter Mean (s.e.) Drier
Petal lobe width (mm) 5.5 (0.1) 5.0 (0.1)
Petal lobe length (mm) 8.5 (0.1) 7.9 (0.1)
Corolla diameter (mm) 18.1 (0.3) 17.1 (0.3)
Corolla tube length (mm) 19.4 (0.3) 20.6 (0.5)
Stigma‐to‐anther distance (mm) 2.0 (0.2) 1.5 (0.1)
Floral area (cm2) 0.3 (0.01) 0.3 (0.01)
Calyx length (mm) 8.7 (0.2) 7.4 (0.1)
Leaf length (mm) 10.2 (0.3) 10.9 (0.4)
Leaf number 4.0 (0.1) 3.6 (0.1)
Leaf lobe number 6.1 (0.3) 5.0 (0.2)
Leaf area (cm2) 2.2 (0.3) 0.9 (0.1)
Vegetative stem height (cm) 21.7 (0.6) 21.1 (0.8)
Floral area/leaf area (cm2/cm2) 0.2 (0.1) 0.7 (0.1)

28
TABLE 4. ANOVA tests of morphological characters based on general linear model. Character
means were compared between regions (wetter and drier) and between populations (nested
within region). n = 120. P –values were Bonferonni corrected. Significant P –values are shown
in bold. Abbreviations: sq = square root transformed, log = log transformed.
Characters Effect df MS F P
Petal lobe width Region 1 6.73 10.45 0.002
Population (region) 2 1.71 2.66 0.005
Error 116 0.64
Petal lobe length Region 1 10.17 9.33 0.003
Population (region) 2 9.25 8.49 <0.001
Error 116 1.09
Corolla diameter Region 1 29.30 6.22 0.003
Population (region) 2 30.79 6.54 0.002
Error 116 4.70
Corolla tube length Region 1 37.18 4.51 0.004
Population (region) 2 107.16 13.00 <0.001
Error 116 8.24
Calyx length Region 1 45.16 33.23 <0.001
Population (region) 2 0.84 0.62 0.017
Error 115 1.36
Stigma‐to‐anther Region 1 0.82 4.50 0.004
distance (sq) Population (region) 2 0.28 1.55 0.013
Error 116 0.18
Floral area Region 1 0.02 2.50 0.006
Population (region) 2 0.03 3.33 0.004
Error 116 0.01
Floral area/ Region 1 20.75 15.42 <0.001
leaf area (log) Population (region) 2 2.49 1.85 0.008
Error 112 1.34
Leaf number Region 1 3.67 4.54 0.003
Population (region) 2 7.70 9.52 <0.001
Error 116 0.81
Leaf length (log) Region 1 0.13 2.18 0.007
Population (region) 2 0.02 0.37 0.050
Error 116 0.06
29
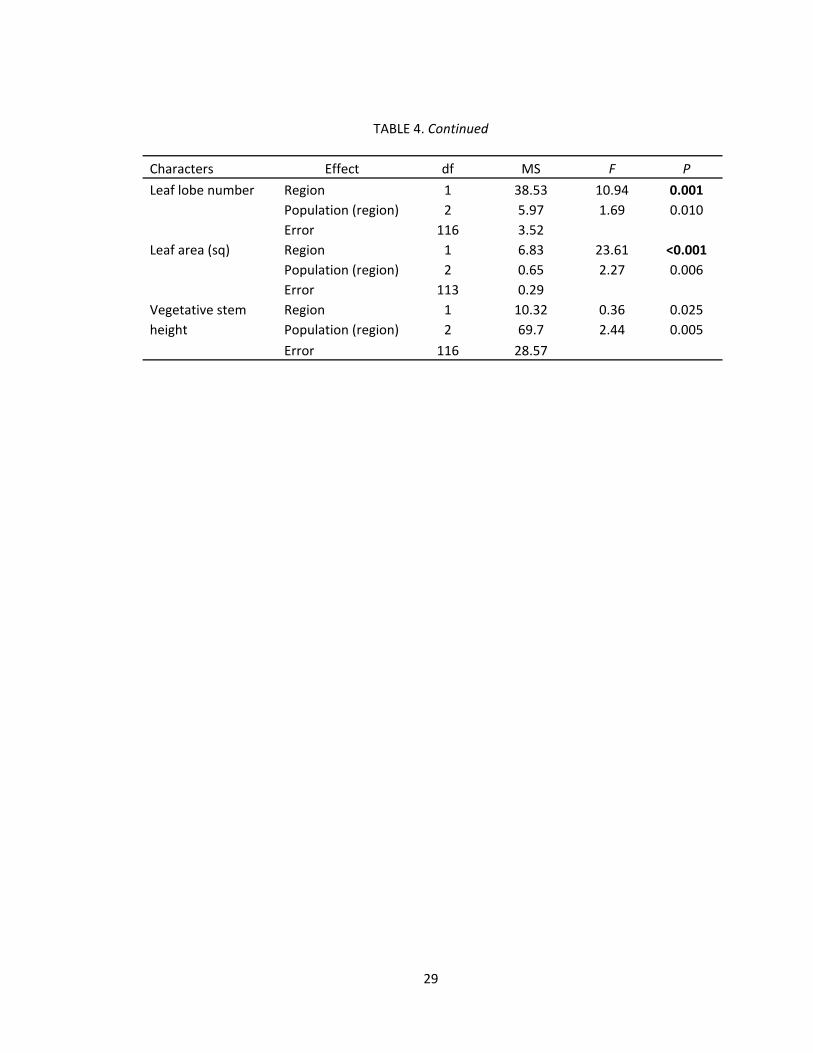
TABLE 4. Continued
Characters Effect df MS F P
Leaf lobe number Region 1 38.53 10.94 0.001
Population (region) 2 5.97 1.69 0.010
Error 116 3.52
Leaf area (sq) Region 1 6.83 23.61 <0.001
Population (region) 2 0.65 2.27 0.006
Error 113 0.29
Vegetative stem Region 1 10.32 0.36 0.025
height Population (region) 2 69.7 2.44 0.005
Error 116 28.57

30
FIG. 4. Floral character means (± s.e.) differing between the wetter and drier regions. The F and P‐ values are based on ANOVA (see Table 4).
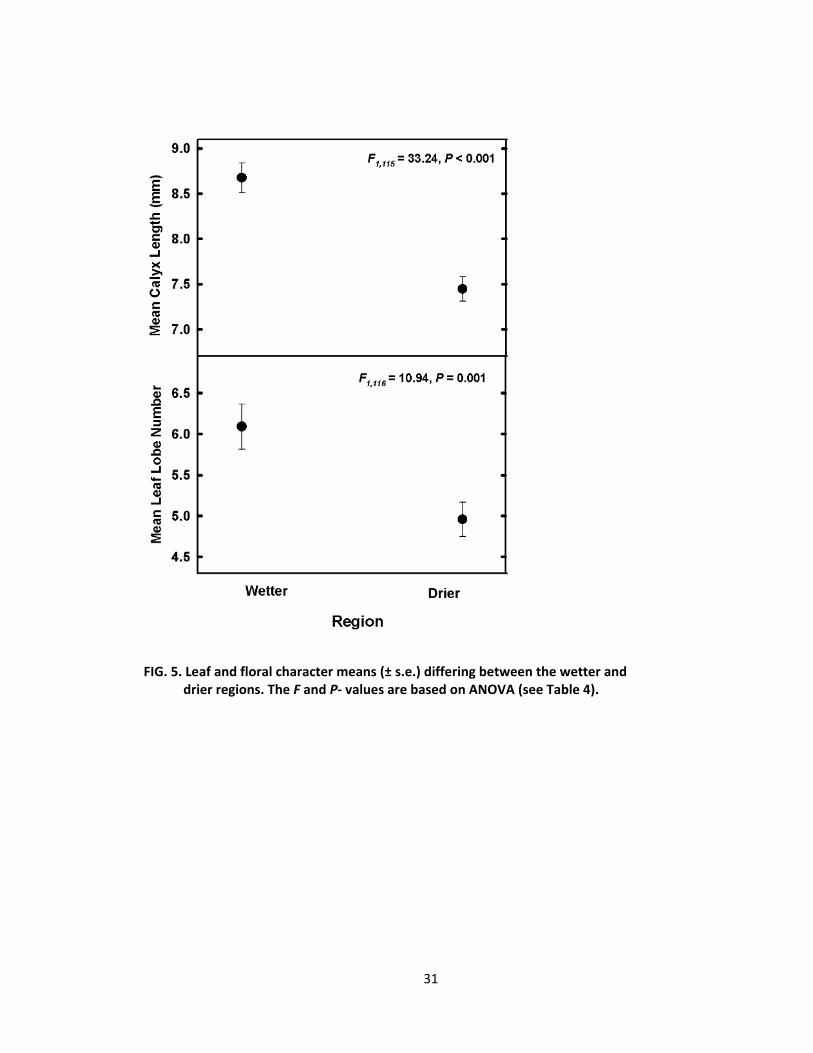
31
FIG. 5. Leaf and floral character means (± s.e.) differing between the wetter and drier regions. The F and P‐ values are based on ANOVA (see Table 4).

32
FIG. 6. Floral and leaf area character mean (± s.e.) differences between the wetter and drier regions. The F and P‐ values are based on ANOVA (see Table 4).
Differences in character means between populations were found for plants
at Mustang (the driest, eastern population), which produced shorter petal lobes
(F2,116 = 8.49, Tukey P < 0.001 as compared to Domino; Tukey P = 0.006 as
compared to Woodpecker) and smaller corolla diameters (F2,116 = 6.54, Tukey P
< 0.001 as compared to Domino; Tukey P = 0.02 as compared to Woodpecker)

33
than plants at either the Domino or Woodpecker populations (Fig. 7 and Table 4).
Corolla tube length was greater for plants at Woodpecker as compared with the
other three populations (F2,116 = 13.00, Tukey P = 0.001 as compared to Domino;
Tukey P = 0.001 as compared to Bobcat; Tukey P < 0.001 as compared to
Mustang; Fig. 7 and Table 4). Leaf number was the only vegetative character
that displayed a difference in mean size between populations (F2,116 = 9.52, P <
0.001). The average number of leaves per plant within the Mustang population
was lower than the average number of leaves within the other three populations
(Tukey P = 0.007 as compared to Domino; Tukey P = 0.001 as compared to
Bobcat; Tukey P < 0.001 as compared to Woodpecker; Fig. 8 and Table 4).

34
FIG. 7. Floral size (± s.e.) differences among the four populations. The F and P‐ values are based on ANOVA (see Table 4). Symbols labeled with different letters are significantly different at P ≤ 0.05 (Tukey‐Kramer pairwise comparison test).
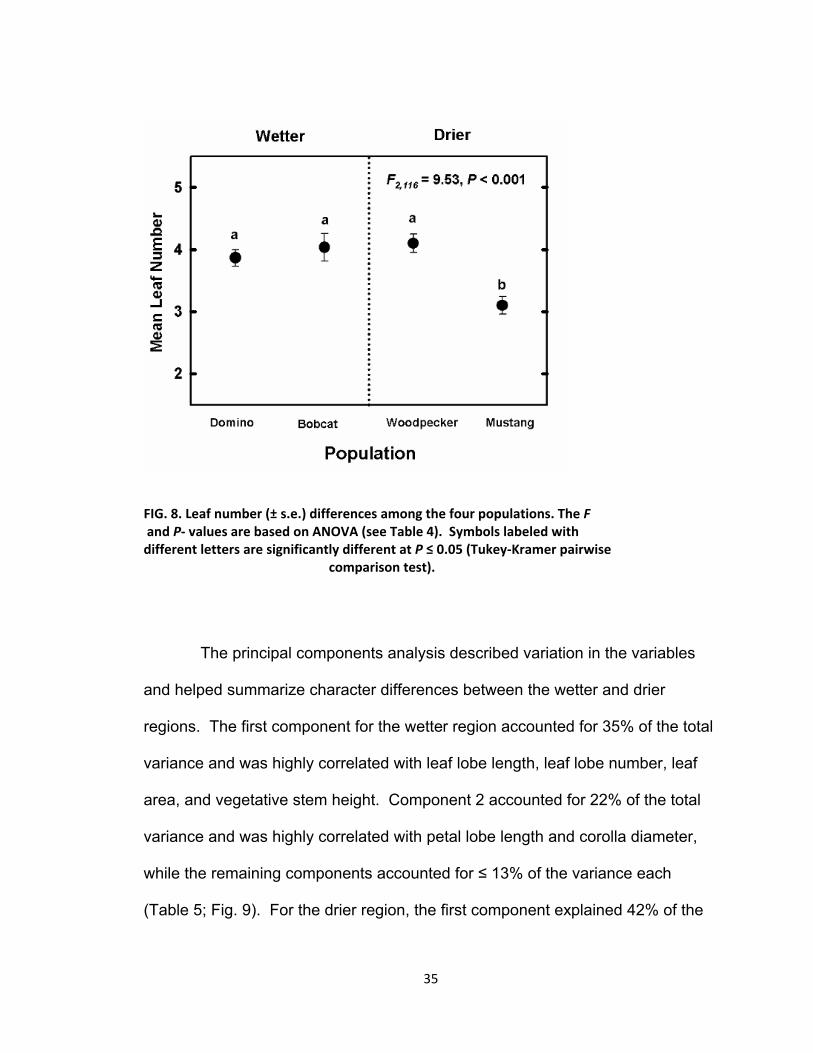
35
FIG. 8. Leaf number (± s.e.) differences among the four populations. The F and P‐ values are based on ANOVA (see Table 4). Symbols labeled with different letters are significantly different at P ≤ 0.05 (Tukey‐Kramer pairwise comparison test).
The principal components analysis described variation in the variables
and helped summarize character differences between the wetter and drier
regions. The first component for the wetter region accounted for 35% of the total
variance and was highly correlated with leaf lobe length, leaf lobe number, leaf
area, and vegetative stem height. Component 2 accounted for 22% of the total
variance and was highly correlated with petal lobe length and corolla diameter,
while the remaining components accounted for ≤ 13% of the variance each
(Table 5; Fig. 9). For the drier region, the first component explained 42% of the

36
total variance and was highly correlated with petal lobe length, corolla diameter,
leaf number, leaf lobe length, leaf area, and vegetative stem height. Component
2 explained 15% of the variance, and the remaining components accounted for ≤
12% of the variance each (Table 5; Fig. 10).
TABLE 5. Character loadings on principal components analysis for floral and vegetative
characters for the wetter, western and drier, eastern regions. Western region loadings on
components 1 and 2 explain 35% and 22% of variance, respectively. Eastern region loadings
on components 1 and 2 explain 42% and 15% of variance, respectively.
Character
Loadings on Component 1 (Wetter)
Loadings on Component 2 (Wetter)
Loadings on Component 1
(Drier)
Loadings on Component 2
(Drier)
Petal lobe width 0.51 0.37 0.68 ‐0.47
Petal lobe length 0.44 0.83 0.81 ‐0.42
Corolla diameter 0.46 0.80 0.79 ‐0.46
Corolla tube length 0.01 0.56 0.56 ‐0.56
Calyx length 0.45 0.47 0.56 0.01
Leaf number 0.62 ‐0.45 0.72 0.16
Leaf length 0.86 ‐0.06 0.71 0.45
Leaf lobe number 0.86 ‐0.33 0.69 0.44
Leaf area 0.88 ‐0.39 0.84 0.48
Vegetative stem height 0.79 ‐0.19 0.71 0.28
Stigma‐to‐anther distance 0.31 0.04 ‐0.05 0.34
Floral area 0.15 0.31 ‐0.03 0.12

37
FIG. 9. Scatterplot of principle components for the wetter region of Coe. Factor 1 and factor 2 are labeled with characters having loading scores ≥ 0.70.

38
FIG. 10. Scatterplot of principle components for the drier region of Coe. Factor 1 labeled with characters having loading scores ≥ 0.70.
Character correlations
Correlation analyses revealed several positive correlations between
measured variables. Correlation results measuring the relationship between
variables for the wetter region showed corolla diameter and petal lobe length to
be highly correlated (r = 0.92, P < 0.001; Table 6). There were also significant
positive correlations between petal lobe width and petal length (r = 0.57, P <
0.001; Table 6), and between petal lobe width and corolla diameter (r = 0.54, P <
0.001; Table 6). Vegetative stem height and leaf characters displayed positive
correlations as well. Vegetative stem height was positively correlated with leaf
number (r = 0.51, P = 0.002), leaf length (r = 0.68, P <0.001), and leaf lobe
number (r = 0.63, P < 0.001; Table 6). Leaf lobe number was also positively

39
correlated with leaf number (r = 0.61, P < 0.001) and leaf length (r = 0.72, P <
0.001; Table 6).
TABLE 6. Wetter region character correlations. Correlations among measured floral and
vegetative characters. n = 59. Abbreviations: PL=petal length; PW= petal lobe width;
CD= corolla diameter; CT= corolla tube length; CL=calyx length; LN=leaf number; LL= leaf
length; LO= leaf lobe number; VSH= vegetative stem height, SA= stigma‐to‐anther
distance. P‐values have been Bonferroni corrected for multiple comparisons.
PW PL CD CT CL LN LL LO VSH
PL 0.571*
CD 0.542* 0.923*
CT 0.206 0.331 0.272
CL 0.213 0.445 0.415 0.354
LN 0.078 ‐0.090 ‐0.024 ‐0.140 ‐0.029
LL 0.246 0.264 0.272 ‐0.043 0.380 0.438
LO 0.276 0.105 0.158 ‐0.267 0.124 0.613* 0.720*
VSH 0.179 0.172 0.166 ‐0.033 0.263 0.511** 0.685* 0.633*
SA 0.080 0.092 0.108 0.018 0.180 0.329 0.123 0.181 0.241
*P < 0.001, **P = 0.002
Plants growing in the drier environment displayed more correlations
between floral traits than did plants growing in the wetter environment. Similar to
plants in the wetter environment, plants in the drier environment displayed a
positive relationship between petal lobe length and corolla diameter (r = 0.93, P <
0.001; Table 7). Other positive correlations observed in the dry environment
include petal lobe width with petal lobe length (r = 0.65, P < 0.001), petal lobe
width with corolla diameter (r = 0.70, P < 0.001), petal lobe width with corolla
tube length (r = 0.51, P = 0.002), petal lobe length with corolla tube length (r =
0.62, P < 0.001), and corolla diameter with corolla tube length (r = 0.60, P <
0.001; Table 7). Vegetative stem height and leaf character correlations were

40
similar for both regions. Vegetative stem height was positively correlated with
leaf number (r = 0.61, P < 0.001), leaf length (r = 0.53, P < 0.001), and leaf lobe
number (r = 0.52, P < 0.001; Table 7). Leaf lobe number was positively
correlated with leaf number (r = 0.52, P < 0.001) and leaf length (r = 0.52, P <
0.001; Table 7).
TABLE 7. Drier region character correlations. Correlations among measured floral and
vegetative characters. n = 59. Abbreviations: PL=petal length; PW= petal lobe width;
CD= corolla diameter; CT= corolla tube length; CL=calyx length; LN=leaf number; LL= leaf
length; LO= leaf lobe number; VSH= vegetative stem height, SA= stigma‐to‐anther
distance. P‐values have been Bonferroni corrected for multiple comparisons.
PW PL CD CT CL LN LL LO VSH
PL 0.645*
CD 0.695* 0.926*
CT 0.507** 0.615* 0.597*
CL 0.332 0.435 0.403 0.192
LN 0.343 0.471 0.440 0.313 0.301
LL 0.364 0.383 0.384 0.113 0.413 0.373
LO 0.213 0.394 0.285 0.225 0.301 0.522* 0.545*
VSH 0.35 0.376 0.364 0.292 0.308 0.616* 0.531* 0.528*
SA ‐0.052 ‐0.109 ‐0.066 ‐0.152 0.009 ‐0.14 0.188 ‐0.049 ‐0.011
*P < 0.001, **P = 0.002
Character size and relationship across the precipitation gradient
Regressions between measured characters and sites along the
precipitation gradient were used to determine whether character size changed
with moisture. The ratio of FA/LA decreased significantly as site moisture
increased (R2 = 0.07, P < 0.004; Table 8 and Fig. 11). The relationship between
leaf area and site moisture was significant, with leaf area decreasing in size from
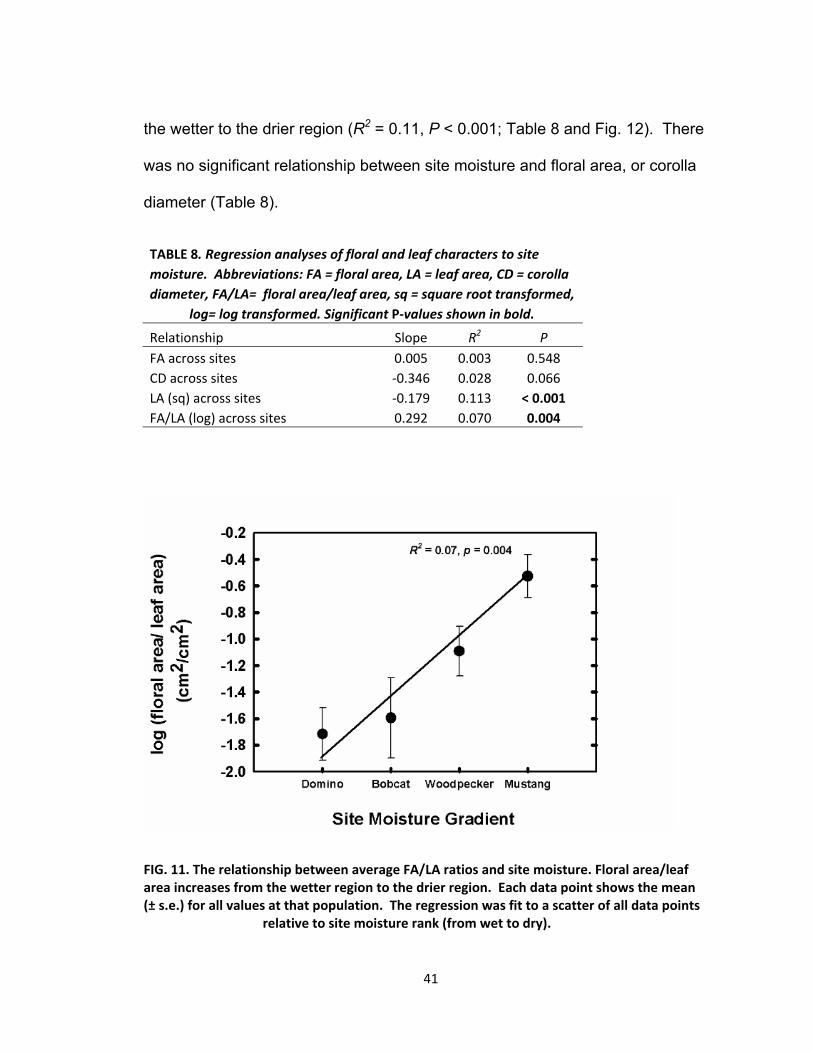
41
the wetter to the drier region (R2 = 0.11, P < 0.001; Table 8 and Fig. 12). There
was no significant relationship between site moisture and floral area, or corolla
diameter (Table 8).
TABLE 8. Regression analyses of floral and leaf characters to site
moisture. Abbreviations: FA = floral area, LA = leaf area, CD = corolla
diameter, FA/LA= floral area/leaf area, sq = square root transformed,
log= log transformed. Significant P‐values shown in bold.
Relationship Slope R2 P
FA across sites 0.005 0.003 0.548
CD across sites ‐0.346 0.028 0.066
LA (sq) across sites ‐0.179 0.113 < 0.001
FA/LA (log) across sites 0.292 0.070 0.004
FIG. 11. The relationship between average FA/LA ratios and site moisture. Floral area/leaf area increases from the wetter region to the drier region. Each data point shows the mean (± s.e.) for all values at that population. The regression was fit to a scatter of all data points relative to site moisture rank (from wet to dry).

42
FIG. 12. The relationship between average leaf area and site moisture. Leaf area decreases from the wetter region to the drier region. Each data point shows the mean (± s.e.) for all values at each population. The regression was fit to a scatter of all data points relative to site moisture rank (from wet to dry).
Relationship between δ13C and floral characters
There was no relationship between δ13C and floral size traits. There was
no evidence of a relationship between δ13C and FA/LA for the wetter or the drier
environment (Table 9). Additionally, there was no relationship between δ13C and
either floral area or corolla diameter for the wetter or drier regions (Table 9).

43
TABLE 9. Regression analyses of δ13C to floral traits. Relationship
where the δ13C ratio is dependent on floral area, corolla diameter,
and the floral area/leaf area ratio. Abbreviations: FA = floral area,
LA = leaf area, FA/LA = floral area/ leaf area, δ13C = stable carbon
ratio, log = log transformed.
Relationship Slope R2 P
Wetter region
δ13C to corolla diameter 0.017 0.001 0.933
δ13C to FA 4.111 0.090 0.401
δ13C to FA/LA (log) ‐0.114 0.014 0.765
Drier region
δ13C to corolla diameter ‐0.081 0.028 0.692
δ13C to FA ‐1.771 0.013 0.789
δ13C FA/LA (log) 0.093 0.002 0.910
From these results the relationship between the δ13C ratio and corolla
diameter, floral area, and the FA/LA ratio were not significant for plants within the
wetter region, or plants within the drier region of Coe. Additionally, an ANOVA
analysis showed that there was no significant difference in mean values for the
δ13C ratios between plants from the wetter and drier environments of Coe (F1,16 =
2.46, P = 0.14).
DISCUSSION
Floral and vegetative character variation related to moisture availability
Size differences were observed in floral and leaf morphology of
Leptosiphon androsaceus between the wetter and drier environments of Coe.

44
Floral size was significantly lower within the drier region compared to the wetter
region. The average size of petal lobe width, petal lobe length, and calyx length
decreased within the drier region. Size reductions in floral organs displayed
within the drier region may be the result of acclimation to water-limited conditions
where larger organ size can be too costly to maintain. Flowers use water for
organ growth, corolla opening, floral transpiration, and nectar production. The
water cost for floral growth and maintenance can be high, and a reduction in
floral size in dry environments may reduce floral demand for water uptake. In
smaller flowers, tightly packed cells allow turgor pressure to remain high with less
water, and this reduced water requirement allows plants with decreased floral
area to grow and reproduce under drought conditions (Galen et al, 1999).
Similar to these results, many researchers have documented a reduction in floral
size under water-limiting conditions (Robertson et al, 1994; Galen, 2000; Carroll
et al, 2001; Elle and Hare, 2002; Elle, 2004; Herrera, 2005; Caruso, 2006;
Hughey and Lambrecht, 2007; Lambrecht and Dawson, 2007; Halpern et al,
2010; Lambrecht, 2010; Wu et al, 2010).
Differences in mean character size were also found for floral characters
among the four populations in Coe. Smaller petal lobe length and corolla
diameter were displayed within the Mustang population compared to the other
three populations. Plants within the Woodpecker, Domino, and Bobcat
populations predominantly grow in oak woodlands, as opposed to the Mustang
population, where plants grow on a steep, exposed, west facing slope, in dry

45
chaparral habitat. The differences in habitat, aspect, and sun exposure between
Mustang and the other three populations may have affected the floral size
variation detected between populations.
Within the Woodpecker population, corolla tubes grew longer than in the
other three populations. Pollinator foraging, proboscis length, and predation can
affect floral tube length (Inouye, 1980; Nilsson, 1988; Galen and Cuba, 2001).
Leptosiphon androsaceus is an insect-pollinated annual (Battaglia and Patterson,
2001), but the abiotic environment may influence corolla tube growth as well.
During their previous years studying these populations of L. androsaceus,
Hughey and Lambrecht (2007) found that pollinators preferentially visited larger
flowers within all four populations, and pollinators tended to be of the same type.
In addition, corolla tube length did not vary with moisture availability across the
moisture gradient (Lambrecht, 2010); therefore, it is unlikely that pollinators
affected corolla tube length within the Woodpecker population. The Woodpecker
site is located within the drier region of Coe where plants grow in a partially
shaded oak understory. Although it is located in the drier region, this population
had higher soil moisture content than the other three populations. Higher levels
of soil moisture had not been detected in the Woodpecker site, as compared to
the other three sites, in our previous years of study. Within the Woodpecker
population, grass and herb cover was particularly dense compared to the other
three sites for the year of this study. Plants growing below the canopy or within
dense neighboring vegetation perceive a reduction in the red to far-red ratio of
46
incoming light, prompting a shade-avoidance response in the plant. Dense
neighboring vegetation allows more far-red light to pass through than red light,
triggering a plant response resulting in stem elongation, accelerated flowering,
and increased floral growth (Smith and Whitelam, 1997; Devlin et al, 1999). The
increased corolla tube growth displayed within the Woodpecker population may
have been a shade-avoidance response initiated by the abundance of tall
grasses that grew in proximity to L. androsaceus plants.
Leaf traits also displayed significant differences in size between the wetter
and drier regions. Fewer leaf lobes and decreased leaf area occurred within the
drier region, and fewer leaves were found on plants within the drier Mustang
population compared to the other three populations. These results suggest that
vegetative organs responded to the limited water resources within the drier
region of Coe by growing smaller and fewer leaves. Limited cell expansion, and
consequent reduction in leaf growth, is one of the primary responses in plants to
drought conditions (Chaves et al, 2003). This reduced growth decreases foliar
surface area, thereby limiting the number of stomatal openings and, as a result,
reduces water loss through transpiration. The reduction in available CO2
resulting from stomatal closure in dry environments can also contribute to a
reduction in photosynthesis and leaf growth (Chaves et al, 2003). A reduction in
leaf size has been exhibited in a number of studies where plants grew under dry
conditions (e.g., Dudley, 1996; Cordell et al, 1998; Lambrecht, 2010; Ward et al,
2012).
47
Plasticity in floral and leaf traits
Variation in environmental moisture not only affected floral and leaf sizes
but the phenotypic correlations between characters as well. The character
correlations analyzed in this study demonstrated how the relationships between
characters changed in response to different levels of water availability. Within
the wetter and drier regions floral characters were positively correlated with each
other, and leaf characters were positively correlated with each other. Within the
drier region, more floral character correlations were found than in the wetter
region, suggesting that there was more independent character growth within the
wetter environment. The increased number of trait correlations within the drier
environment may be due to constraints on floral character growth when plants
are under environmental stress. Character correlations can result from plastic
responses to environmental conditions (e.g. water availability), genetic structure,
or a combination of plasticity and genetic framework (Schlichting, 1989;
Schlichting and Pigliucci, 1998). For example, in a study of fireweed (Epolobium
angustifolium, Onagraceae; Carroll et al, 2001), variation in water supply was
found to affect character correlations. Flower size and nectar volume were tightly
correlated in the drought treatment, while leaf water potential and nectar
concentration were correlated only within the controls. Floral traits displayed a
less plastic response to drought than did physiological leaf traits.
48
Results from the E. angustifoium study and the current study suggest that
trait responsiveness to environmental forces is an important factor in the coupling
or uncoupling of characters. Foliar organs control transpiration, carbon fixation,
and photosynthesis, and the plasticity displayed in leaf morphology is central to a
plant’s ability to respond to decreased water supply by controlling these
physiological functions. Flowers lack control of these functions; therefore
plasticity of floral traits in water-limited environments is reduced. In the current
study vegetative traits were not significantly correlated with floral traits, showing a
tendency for floral and vegetative characters to be uncoupled along the
precipitation gradient. Herrera (2005), and Chalcoff et al (2008), while assessing
morphology along environmental gradients, both found that floral traits were
correlated within floral organs, and vegetative traits were correlated within
vegetative organs, yet floral and vegetative traits were not highly correlated with
one another. The uncoupling of floral and leaf traits suggests that leaf characters
need to be able to respond to changes in the environment separate from floral
trait growth.
Strategies for reducing exposure to water-limited conditions
The decreased character growth displayed in this study may also be a
drought escape strategy utilized by plants growing in the drier eastern region of
Coe. Plants can effectively escape the driest conditions of the season by quickly
growing and reproducing during the earlier part of the season (Galen, 1999;
49
Heschel and Riginos, 2005; Sherrard and Maherali, 2006; Franks et al, 2007).
Rapid development, and associated decreased plant and floral growth, allows a
plant to reduce the amount of time that it is exposed to dry conditions. Plants
employing this drought escape strategy of rapid development, early flowering,
and reduced floral size are often associated with a transition to self-fertilization
(Mazer et al, 2004; Strauss and Whittall, 2006; Sicard and Lenhard, 2011).
Although no significant difference was found in stigma-to-anther distance
between the wetter and drier regions of Coe, a decrease in herkogamy can be
related to a shift to self-fertilization (Elle and Hare, 2002).
Drought avoidance may also be employed by plants in drier environments
through an increase in WUE. Higher levels of carbon fixed by photosynthesis
compared to water lost through transpiration are associated with higher levels of
WUE in plants. Increased levels of WUE have been detected in plants growing
in drier conditions that displayed a reduction in growth (Sandquist and Ehleringer,
2003; Caruso, 2006; Picotte et al, 2007; Ivey and Carr, 2012; Martin and
Thorstenson, 1988; Dudley, 1996; Caruso et al, 2005). Although floral size and
leaf area both decreased as precipitation declined in the current study, the ratio
of floral area to leaf area (FA/LA) increased from the wetter to the drier region.
Leaves balance internal water reserves by closing their stomata to reduce water
loss, thereby supporting water intensive floral growth. The relationship between
floral size and WUE has been shown through measurements of δ13C and FA/LA
ratios. An increase in FA/LA has been found to be positively associated with

50
increased WUE in species of Achillea and Chrysanthemum (Lambrecht and
Dawson, 2007), and in Leptosiphon bicolor (Lambrecht, In press). Flowers need
water to grow and function, but they are not able to limit water loss through
transpiration, and must rely on vegetative structures for their water supply
(Galen, 2000; de la Barrera and Nobel, 2004; Galen, 2005; Feild et al, 2009).
Increased floral surface area results in greater evaporative water loss from
flowers and the higher ratio of floral area to foliar surface area results in leaf
structures having to work harder to maintain the plant’s water balance. Studies
have shown vegetative structures incurring a physiological cost for water lost
through floral organs (Galen, 1999; Galen et al, 1999; McDowell and Turner,
2002; Lambrecht and Dawson, 2007).
For the current study, based on δ13C ratios, no significant relationship
between floral size and WUE was detected within the drier or wetter
environments. Even though there was no evidence of increased WUE related to
the wetter or drier regions for this study, differences in WUE have been detected
for L. androsaceus during previous years at Coe (Lambrecht, 2010). Lambrecht
identified a significant positive relationship between flower size and δ13C within
the drier environment in years of low precipitation. That is, as floral area
increased, integrated WUE also increased. This physiological response
suggests that as floral area increased, thereby increasing floral transpiration,
leaves were forced to reduce water loss by closing their stomata, which
increased the plant’s WUE.
51
Given that an increase in WUE associated with flower size in the drier
region of Coe was displayed for L. androsaceus in past years, perhaps a
significant difference in δ13C, as it related to floral size, was not detected between
the two regions for this study year because 2011 was an above average rainfall
year. Comparing the average rainfall for previous years (2007 through 2010)
with rainfall for the year of this study (2011), from the Santa Clara Valley Water
District historic precipitation gauge report (ALERT Precipitation Gauge
Information, 2012), showed a 22% increase in precipitation within the wetter and
drier regions of Coe. Given the relatively high rainfall average for 2011 it is not
surprising that a difference in WUE was not detected between plants growing
within the wetter and drier environments. Plants growing within the drier region
were not sufficiently water-limited to induce a physiological stress response
leading to increased foliar stomatal closure. Although the FA/LA ratio was
greater within the drier region, floral water costs, and the resultant affect on foliar
physiology, were possibly tempered by increased water availability within the
drier environment at Coe.
Conclusions
The results from this study exhibited size differences in phenotypic traits of
L. androsaceus along the precipitation gradient at Henry W. Coe State Park.
Floral and vegetative character sizes and numbers had smaller mean values for
the drier, eastern region compared to the wetter, western region of Coe. Leaf
52
and floral characters displayed an acclimation response to the reduction in
moisture within the drier region by limiting growth. Studies have shown that
maintenance of larger corolla displays are important for pollinator attraction, yet
resource diversion to floral growth can be mediated by environmental stress,
such as water limitation, thereby reducing corolla size and display (Galen, 1999;
Galen, 2000). Leptosiphon androsaceus is an insect-pollinated annual, and
increased floral display would likely be reproductively advantageous when
precipitation levels are high, yet water limitation is conceivably regulating the size
of floral growth within the drier region of Coe.
The uncoupling of floral and leaf traits documented in this study suggests
that the whole plant benefited from leaf characters responding to environmental
forces independent of floral characters. Floral and vegetative characters showed
plasticity in size in response to decreased moisture availability within the drier
region, yet the lack of floral control of physiological function reduced the need for
highly plastic responsiveness in floral traits within the wetter environment.
Leaves control transpiration and maintain the water balance for the whole plant;
therefore, plasticity in foliar traits is crucial to plant function in drier habitats.
Comparing the two regions, floral area was greater relative to leaf area
within the drier environment. Whereas differences in δ13C ratios with relation to
floral size and precipitation were not apparent for this study year, perhaps due to
high rainfall for 2011, higher integrated WUE related to flower size within the drier
53
region was found for Lambrecht’s (2010) four year study on the same
populations at Coe. Given the higher ratio of FA/LA displayed within the drier
region for the current study, increased rainfall for 2011 may have mitigated the
water costs that would have been incurred by leaves compensating for larger
floral growth within the drier environment.
Natural selection may favor an adaptive strategy of rapid development and
decreased plant trait size to avoid drought conditions, and the reduced floral size
displayed within the drier region may be due to this strategy of drought escape.
Additional study of the temporal phenology of L. androsaceus within these
populations will further answer the question of whether this species is adapting to
drought conditions within the drier region through a drought escape strategy.
High genetic variation is thought to be related to drought avoidance strategies in
unstable environments and phenotypic and genetic variation within species are
essential for adaptation to changing environmental conditions, thereby allowing
plants to evolve by natural selection (Sandquist and Ehleringer, 2003). Genetic
variation for a range of phenotypic sizes is likely maintained by this species, and
it is possible that natural selection is acting on floral and vegetative morphology
within the drier region of Coe. A greenhouse study of trait size for this species
would be useful to ascertain whether the differences in character size displayed
in this study are genetic, or a combination of adaptation and plastic trait
responses to environmental fluctuations in precipitation.

54
LITERATURE CITED
ALERT. 2012. Precipitation gauge information: historic gauge report. http//alert.valleywater.org/cgi-bin/gageprec_nl. 5 May 2012.
Battaglia RE, Patterson R. 2001. A morphometric analysis of the Leptosiphon androsaceus complex (Polemoniaceae) in the central and south coast ranges. Madrono 48: 62 – 78.
Bell CD, Patterson RW. 2000. Molecular phylogeny and biogeography of Linanthus (Polemoniaceae). American Journal of Botany 87: 1857-1870.
Brock MT, Stinchcombe JR, Weinig C. 2009. Indirect effects of FRIGIDA: floral trait (co) variances are altered by seasonally variable abiotic factors associated with flowering time. Journal of Evolutionary Biology 22: 1826-1838.
Campbell DR. 1996. Evolution of floral traits in a hermaphroditic plant: field measurements of heritabilities and genetic correlations. Evolution 50: 1442-1453.
Campbell DR, Crawford M, Brody AK, Forbis TA. 2002. Resistance to pre-dispersal seed predators in a natural hybrid zone. Oecologia 131: 436-443.
Campbell NA, Reece JB. 2002. Biology. 6th edn. Pearson, Benjamin Cummings, San Francisco, California.
Cariveau D, Irwin RE, Brody AK, Garcia-Mayeya LS, Von Der Ohe A. 2004. Direct and indirect effects of pollinators and seed predators to selection on plant and floral traits. Oikos 104: 15-26.
Carroll AB, Pallardy SG, Galen C. 2001. Drought stress, plant water status, and floral trait expression in fireweed, Epilobium angustifolium (Onagraceae). American Journal of Botany 88: 438-446.
Caruso CM, Maherali H, Mikulyuk A, Carlson K, Jackson RB. 2005. Genetic variance and covariance for physiological traits in Lobelia: are there constraints on adaptive evolution? Evolution 59: 826-837.

55
Caruso CM. 2006. Plasticity of inflorescence traits in Lobelia siphilitica (Lobeliaceae) in response to soil water availability. American Journal of Botany 93: 531-538.
Chalcoff VR, Ezcurra C, Aizen MA. 2008. Uncoupled geographical variation between leaves and flowers in a South-Andean Proteaceae. Annals of Botany 102: 79-91.
Chaves MM, Pereira JS, Maroco J, et al. 2002. How plants cope with water stress in the field? Photosynthesis and growth. Annals of Botany 89: 907-916.
Chaves MM, Maroco JP, Pereira JS. 2003. Understanding plant responses to drought- from genes to the whole plant. Functional Plant Biology 30: 239-264.
Chess SKR, Raguso RA, LeBuhn G. 2008. Geographic divergence in floral morphology and scent in Linanthus dichotomus (Polemoniaceae). American Journal of Botany 95: 1652-1659.
Clausen J, Keck DD, Hiesey WM. 1941. Regional differentiation in plant species. The American Naturalist 75: 231-250.
Conner JK, Rush S. 1996. Effects of flower size and number on pollinator visitation to wild radish, Raphanus raphanistrum. Oecologia 105: 509-516.
Cordell S, Goldstein G, Mueller-Dombois D, Webb D, Vitousek PM. 1998. Physiological and morphological variation in Metrosideros polymorpha, a dominant Hawaiian tree species, along an altitudinal gradient: the role of phenotypic plasticity. Oecologia 113: 188-196.
Correia MJ, Coelho D, David MM. 2001. Response to seasonal drought in three cultivars of Ceratonia siliqua: leaf growth and water relations. Tree Physiology 21: 645-653.
Cresswell JE, Galen C. 1991. Frequency-dependent selection and adaptive surfaces for floral character combinations: the pollination of Polemonium viscosum. The American Naturalist 138: 1342-1353.
de la Barrera E, Nobel PS. 2004. Nectar: properties, floral aspects, and speculations on orgin. Trends in Plant Science 9: 65-69.
56
Devlin PF, Robson PRH, Patel SR, Goosey L, Sharrock RA, Whitelam GC. 1999. Phytochrome D acts in the shade-avoidance syndrome in Arabidopsis by controlling elongation growth and flowering time. Plant Physiology 119: 909-916.
Dudley SA. 1996. Differing selection on plant physiological traits in response to environmental water availability: a test of adaptive hypotheses. Evolution 50: 92-102.
Eckhart VM, Geber MA, McGuire CM. 2004. Experimental studies of adaptation in Clarkia xantiana. I. sources of trait variation across a subspecies border. Evolution 58: 59-70.
Elle E, Hare JD. 2002. Environmentally induced variation in floral traits affects the mating system in Datura wrightii. Functional Ecology 16: 79-88.
Elle E, Carney R. 2003. Reproductive assurance varies with flower size in Collinsia parviflora (Scrophulariaceae). American Journal of Botany 90: 888-896.
Elle E. 2004. Floral adaptations and biotic and abiotic selection pressures. In: Plant adaptation: molecular genetics and ecology. Proceedings of an International Workshop. 2002. Vancouver, British Columbia, Canada.
Fabbro T, Körner C. 2004. Altitudinal differences in flower traits and reproductive allocation. Flora 199: 70-81.
Farquhar GD, Ehleringer JR, Hubick KT. 1989. Carbon isotope discrimination and photosynthesis. Annual Review of Plant Physiology and Plant Molecular Biology 40: 503-537.
Fernandez GCJ. 1992. Residual analysis and data transformations: important tools in statistical analysis. HortScience 27: 297-300.
Feild TS, Chatelet DS, Brodribb TJ. 2009. Giant flowers of southern magnolia are hydrated by the xylem. Plant Physiology 150: 1587-1597.
Franks SJ, Sim S, Weis AE. 2007. Rapid evolution of flowering time by an annual plant in response to a climate fluctuation. Proceedings of the National Academy of Sciences 104: 1278-1282.
57
Galen C, Kevan PG. 1983. Bumblebee foraging and floral scent dimorphism: Bombus kirbyellus Curtis (Hymenoptera: Apidae) and Polemonium viscosum Nutt. (Polemoniaceae). Canadian Journal of Zoology 61: 1207-1213.
Galen C, Stanton ML. 1989. Bumble bee pollination and floral morphology: factors influencing pollen dispersal in the alpine sky pilot, Polemonium viscosum (Polemoniaceae). American Journal of Botany 76: 419-426.
Galen C. 1999. Why do flowers vary? BioScience 49: 631-640.
Galen C, Sherry RA, Carroll AB. 1999. Are flowers physiological sinks or faucets? Costs and correlates of water use by flowers of Polemonium viscosum. Oecologia 118: 461-470.
Galen C. 2000. High and dry: drought stress, sex-allocation trade-offs, and selection on flower size in the alpine wildflower Polemonium viscosum (Polemoniaceae). The American Naturalist 156: 72-83.
Galen C, Cuba J. 2001. Down the tube: pollinators, predators, and the evolution of flower shape in the alpine skypilot, Polemonium viscosum. Evolution 55: 1963-1971.
Galen C. 2005. It never rains but then it pours: the diverse effects of water on flower integrity and function. In: Reekie EG, Bazzaz FA. eds. Reproductive allocation in plants. Elsevier Academic Press: London, 75-90.
Geber MA, Dawson TE. 1990. Genetic variation in and covariation between leaf gas exchange, morphology, and development in Polygonum arenastrum, an annual plant. Oecologia 85: 153-158.
Glaettli M, Barrett SCH. 2008. Pollinator responses to variation in floral display and flower size in dioecious Sagittaria latifolia (Alismataceae). New Phytologist 179: 1193-1201.
Halpern SL, Adler LS, Wink M. 2010. Leaf herbivory and drought stress affect floral attractive and defensive traits in Nicotiana quadrivalvis. Oecologia 163: 961-971.
Harder LD, Barrett SCH. 2006. Ecology and evolution of flowers. New York: Oxford University Press.

58
Herrera J. 2005. Flower size variation in Rosmarinus officinalis: individuals, populations and habitats. Annals of Botany 95: 431-437.
Heschel MS, Riginos C. 2005. Mechanisms of selection for drought stress tolerance and avoidance in Impatiens capensis (Balsaminaceae). American Journal of Botany 92: 37-44.
Hickman JC. ed. 1993. The Jepson Manual: higher plants of California. 3rd edn. University of California Press, Berkeley, California.
Hiesey WH, Clausen J, Keck DD. 1942. Ecological aspects of evolution: relationships between climate and intra-specific variation in plants. The American Naturalist 76: 5-22.
Hodges SA, Fulton M, Yang JY, Whittall JB. 2003. Verne Grant and evolutionary studies of Aquilegia. New Phytologist 161: 113-120.
Hughey DJ, Lambrecht SC. 2007. Do mating system and pollinator preferences vary with habitat for Leptosiphon bicolor and Leptosiphon androsaceus (Polemoniaceae)? Abstract, Ecological Society of America/ Society for Ecological Restoration Annual Meeting, San Jose, CA.
Inouye DW. 1980. The effect of proboscis and corolla tube lengths on patterns and rates of flower visitation by bumblebees. Oecologia 45: 197-201.
Ivey CT, Carr DE. 2012. Tests for the joint evolution of mating system and drought escape in Mimulus. Annals of Botany 109: 583-598.
Jonas CS, Geber MA. 1999. Variation among populations of Clarkia unguiculata (Onagraceae) along altitudinal and latitudinal gradients. American Journal of Botany 86: 333-343.
Jones KN, Reithel JS. 2001. Pollinator-mediated selection on a flower color polymorphism in experimental populations of Antirrhinum (Scrophulariaceae). American Journal of Botany 88: 447-454.
Kemp DR, Culvenor RA. 1994. Improving the grazing and drought tolerance of temperate perennial grasses. New Zealand Journal of Agricultural Research 37: 365-378.
Lambrecht SC, Dawson TE. 2007. Correlated variation of floral and leaf traits along a moisture availability gradient. Oecologia 151: 574-583.

59
Lambrecht SC. 2010. Direct and indirect effects of precipitation on flower size in Leptosiphon (Polemoniaceae). Abstract, Ecological Society of America Annual Meeting, Pittsburgh, PA.
Lambrecht SC, Morrow A, Hussey R. In prep. Trait variation associated with moisture availability in Leptosiphon androsaceus (Polemoniaceae).
Lambrecht SC. In press. Floral water costs and size variation in the highly selfing Leptosiphon bicolor (Polemoniaceae). International Journal of Plant Sciences.
Larcher W. 2003. Physiological Plant Ecology: Ecophysiology and Stress Physiology of Functional Groups, 4th edn. New York: Springer.
Martin B, Thorstenson YR. 1988. Stable carbon isotope composition (δ13C), water use efficiency, and biomass productivity of Lycopersicon esculentum, Lycopersicon pennellii, and the F1 hybrid. Plant Physiology 88: 213-217.
Mazer SJ, Paz H, Bell MD. 2004. Life history, floral development, and mating system in Clarkia xantiana (Onagraceae): do floral and whole-plant rates of development evolve independently? American Journal of Botany 91: 2041-2050.
McDowell SCL, Turner DP. 2002. Reproductive effort in invasive and non-invasive Rubus. Oecologia 133: 102-111.
Meléndez-Ackerman E, Campbell DR, Waser NM. 1997. Hummingbird behavior and mechanisms of selection on flower color in Ipomopsis. Ecology 78: 2532-2541.
Mitchell PJ, Veneklaas EJ, Lambers H, Burgess SSO. 2008. Leaf water relations during summer water deficit: differential responses in turgor maintenance and variation in leaf structure among different plant communities in south-western Australia. Plant, Cell and Environment 31: 1791-1802.
Nilsson AL. 1988. The evolution of flowers with deep corolla tubes. Nature 334: 147-149.

60
Odell E, Raguso RA, Jones KN. 1999. Bumblebee foraging responses to variation in floral scent and color in snapdragons (Antirrhinum: Scrophulariaceae). The American Midland Naturalist 142: 257-265.
Pantin F, Simonneau T, Rolland G, Dauzat M, Muller B. 2011. Control of leaf expansion: a developmental switch from metabolics to hydraulics. Plant Physiology 156: 803-815.
Parachnowitsch AL, Kessler A. 2010. Pollinators exert natural selection on flower size and floral display in Penstemon digitalis. New Phytologist 188: 393-402.
Parkhurst DF, Loucks OL. 1972. Optimal leaf size in relation to environment. The Journal of Ecology 60: 505-537.
Picotte JJ, Rosenthal DM, Rhode JM, Cruzan MB. 2007. Plastic responses to temporal variation in moisture availability: consequences for water use efficiency and plant performance. Oecologia 153: 821-832.
Raguso RA. 2008. Wake up and smell the roses: the ecology and evolution of floral scent. The Annual Review of Ecology, Evolution, and Systematics. 39: 549-569. doi: 10.1146/annurev.ecolsys.38.091206.095601.
Robertson AW, Diaz A, Macnair MR. 1994. The quantitative genetics of floral characters in Mimulus guttatus. Heredity 72: 300-311.
Rice WR. 1989. Analyzing tables of statistical tests. Evolution 43: 223 – 225.
Sandquist DR, Ehleringer JR. 2003. Carbon isotope discrimination differences within and between contrasting populations of Encelia farinose raised under common-environment conditions. Oecologia 134: 463 – 470.
Schemske DW, Bradshaw HD Jr. 1999. Pollinator preference and the evolution of floral traits in monkeyflowers (Mimulus). Proceedings of the National Academy of Sciences 96: 11910-11915. doi:10.1073/pnas.96.21.11910.
Schlichting CD. 1986. The evolution of phenotypic plasticity in plants. Annual Review of Ecology and Systematics 17: 667-693.
Schlichting CD. 1989. Phenotypic plasticity in Phlox. Oecologia 78: 496-501.
Schlichting CD, Pigliucci M. 1998. Phenotypic Evolution: A Reaction Norm Perspective. Sunderland: Sinauer Associates, Inc.

61
Sherrard ME, Maherali H. 2006. The adaptive significance of drought escape in Avena barbata an annual grass. Evolution 60: 2478-2489.
Sicard A, Lenhard M. 2011. The selfing syndrome: a model for studying the genetic and evolutionary basis of morphological adaptation in plants. Annals of Botany 107: 1433-1443.
Smith H, Whitelam GC. 1997. The shade avoidance syndrome: multiple responses mediated by multiple phytochromes. Plant, Cell and Environment 20: 840-844.
Stebbins GL. 1970. Adaptive radiation of reproductive characteristics in angiosperms, I: pollination mechanisms. Annual Review of Ecology and Systematics 1: 307-326.
Strauss SY, Whittall JB. 2006. Non-pollinator agents of selection on floral traits. In: Lloyd DG, Barrett SCH. eds. Ecology and evolution of flowers. Oxford University Press: Oxford, UK, 120-138.
Sutherland SD, Vickery RK Jr. 1993. On the relative importance of floral color, shape, and nectar rewards in attracting pollinators to Mimulus. Great Basin Naturalist 53: 107-117.
Taiz L, Zeiger E. 2002. Plant Physiology, 3rd edn. Sunderland: Sinauer Associates, Inc.
Thomas H. 1997. Drought resistance in plants. In: Basra AS, Basra RK. eds. Mechanisms of environmental stress resistance in plants. Hardwood Academic Publishers: Amsterdam, 1- 42.
Totland Ø. 2001. Environment-dependent pollen limitation and selection on floral traits in an alpine species. Ecology 82: 2233-2244.
United States Department of Agriculture - Natural Resources Conservation Service. 2012. Guide to texture by feel. soils.usda.gov/education/resources/lessons/texture/. 5 May 2012.
Ward D, Shrestha MK, Golan-Goldhirsh A. 2012. Evolution and ecology meet molecular genetics: adaptive phenotypic plasticity in two isolated Negev desert populations of Acacia raddiana at either end of a rainfall gradient. Annals of Botany 109: 247-255.

62
Wu CA, Lowry DB, Nutter LI, Willis JH. 2010. Natural variation for drought-response traits in the Mimulus guttatus species complex. Oecologia 162: 23-33.