Embed Size (px)
Citation preview

CLIMATE POLICY & CARBON MARKETS
AWRI – Opportunities in a new climate November 2014
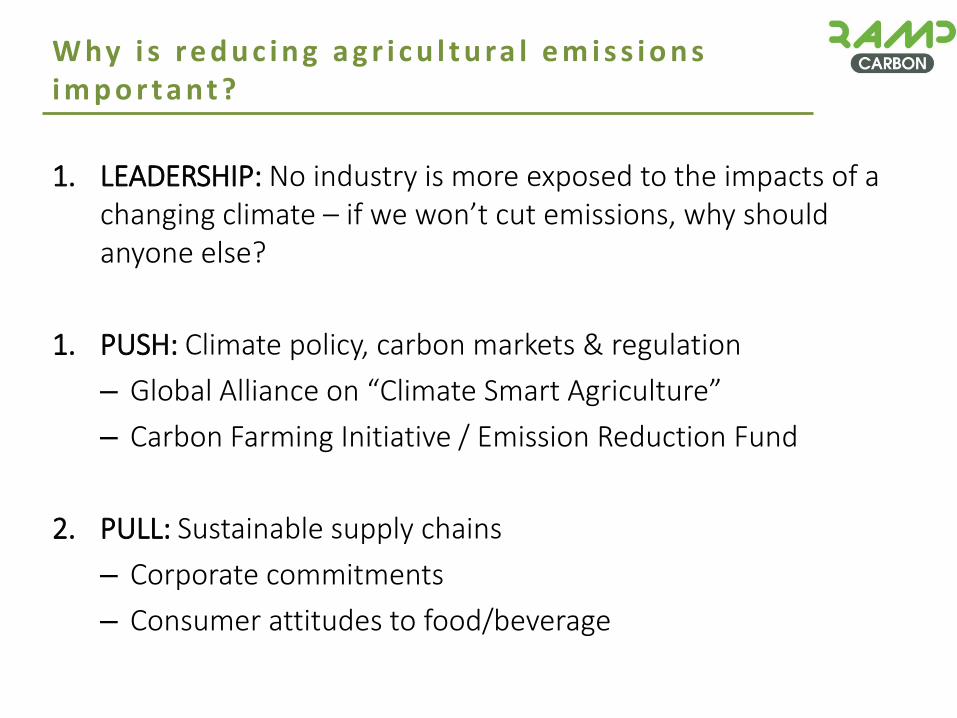
1. LEADERSHIP: No industry is more exposed to the impacts of a changing climate – if we won’t cut emissions, why should anyone else?
1. PUSH: Climate policy, carbon markets & regulation
– Global Alliance on “Climate Smart Agriculture”
– Carbon Farming Initiative / Emission Reduction Fund
2. PULL: Sustainable supply chains
– Corporate commitments
– Consumer attitudes to food/beverage
W hy i s r e d u c i n g a g r i c u l t u ra l e m i s s i o n s i m p o r ta nt ?

• Food production needs to increase by 60% to feed 9 billion by 2050.
• Climate change effects food security AND land-use contributes 25% of global emissions.
• Global Alliance for Climate Smart Agriculture:
– 500 million farmers targeted by 2030: increase productivity + income, resilience & mitigation.
– 20+ countries to promote CSA by 2020 along with 35+ organisations, including:
• McDonald’s
• Kellogs
• Yarra
• Walmart
C l i m a te S m a r t A g r i c u l t u r e

- 39 National + 23 sub-national jurisdictions have introduced cap & trade and/or carbon taxes - Cover 25% of global emissions, carbon markets valued at US$30 billion Source: World Bank 2014
G l o b a l C a r b o n M a r ke t s

Sector Total (MtCO2e) Share of Total
Electricity Generation 283.2 50.7%
Transport 90.2 16.1%
Agriculture 87.4 15.6%
Fugitive Emissions 39.9 7.1%
Industrial Processes 31.2 5.6%
Land use, land use change and forestry
15.2 2.7%
Waste 11.7 2.1%
TOTAL 558.8
Source: National Inventory Report 2012 Volume 1, Commonwealth of Australia 2014
Australia’s Emissions Inventory

Source: National Inventory Report 2012 Volume 1, Commonwealth of Australia 2014
Livestock digestion 64%
Manure management 4%
Rice cultivation 1%
Agricultural soils 18%
Savanna burning 13%
Residue burning 0%
E m i s s i o n s f r o m A g r i c u l t u r e

Emission Sources
Stationary energy, industrial
processes, fugitive coal &
transport.
80% of National Emissions
Land-use & agriculture.
20% of National Emissions
Policy to Cut Emissions
Carbon Pricing
Mechanism
~350 liable entities (180
companies)
Carbon Farming Initiative
CLEAN
ENERGY
REGULATOR
CLEAN
ENERGY
FINANCE
CORPORATION
CLIMATE
CHANGE
AUTHORITY
CLIMATE
COMMISSION
C F I & C a r b o n P r i c i n g Po l i c y
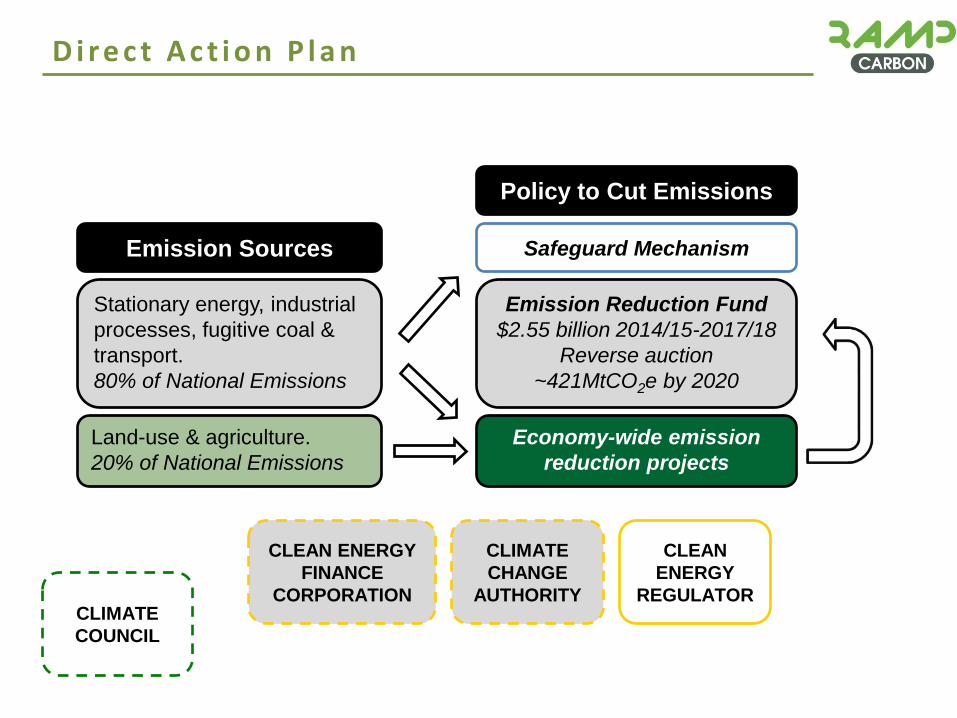
Emission Sources
Stationary energy, industrial
processes, fugitive coal &
transport.
80% of National Emissions
Land-use & agriculture.
20% of National Emissions
Policy to Cut Emissions
Emission Reduction Fund
$2.55 billion 2014/15-2017/18
Reverse auction
~421MtCO2e by 2020
Economy-wide emission
reduction projects
CLIMATE
COUNCIL
CLEAN
ENERGY
REGULATOR
CLEAN ENERGY
FINANCE
CORPORATION
CLIMATE
CHANGE
AUTHORITY
D i r e c t A c t i o n P l a n
Safeguard Mechanism

• The CFI aims to provide financial incentives for landholders and landfill operators to develop projects that will reduce greenhouse gas emissions.
• CFI projects issued with carbon credits called Australian carbon credit units (ACCUs).
• 1 ACCU = 1 tCO2e reduced or sequestered
Emissions
reduction /
sequestration
project
applies
approved
method
Emissions reductions
verified under CFI
Carbon credits sold into carbon
markets
Carbon credits issued in
accordance with the rules
of the CFI
A b o u t t h e C F I

47,237
6,056,208 467,542
2,577,690 Piggery Manure Management Landfill Methane Management Savanna Burning
Tree Planting/Forest Protection
• Projects – 9 million ACCUs issued
– 7 approved projects out of 171 relate to agriculture
– All are piggeries manure methane flaring
– No approved projects for cropping or livestock operations
ACCU issuance as at 24th October 2014
C F I & A g r i c u l t u r e

AAP: Alan Porritt SMH: Penny Bradfield
D i r e c t A c t i o n
• CFI will be folded into the ERF creating one programme.
• All existing CFI projects and methodologies will be recognized under the ERF legislation.
• Extends coverage of the CFI to allow crediting of emissions reductions across the economy.
• Reverse auctions to purchase emissions reductions by Clean Energy Regulator.
• Crediting improvements in emissions intensity.
• Safeguard Mechanism baselines prevent emissions growth.
W h a t C h a n g e s U n d e r t h e E R F ?

Project Activity
Project Developer
EMISSION REDUCTION FUND
Make-good provision
Project uses approved
methodology
Aggregator
Pre-approval Auction +
spot market? Standard contract
ACCUs
Companies operating
above baselines
S A F E G U A R D M E C H A N I S M
Adapted from CMI 2014
S O U R C E S
O F D E M A N D
Voluntary market
International market?
ERF Contract
C r e a t i n g & S e l l i n g C a r b o n C r e d i t s

• Energy efficiency
• Refrigeration + air conditioning
• Water heating + heat recovery
• Air compressor performance
• Wastewater treatment +
other renewables
• Fertiliser management
• Value-add products – grape marc methane inhibition in livestock
Source: AWRI Energy Audit fact sheet
W i n e I n d u s t r y O p t i o n s ?

• Current challenges - Policy uncertainty
- Lack of available/applicable methodologies
- Aggregation to overcome transaction costs
- Price signal is not clear (yet)
• Opportunities - Emissions sources often represent lost energy or waste
- So, cutting emissions = productivity improvement
- Major R&D + E&O effort into emissions reducing techniques
- Improved efficiency + carbon credits = increased profitability & climate leadership
C h a l l e n g e s & O p p o r t u n i t i e s