Embed Size (px)
Citation preview
Climate, lightning ignitions, and fire severityin Yosemite National Park, California, USA
James A. LutzA,E, Jan W. van WagtendonkB, Andrea E. ThodeC,Jay O. MillerD and Jerry F FranklinA
Abstract. Continental-scale studies of western North America have attributed recent increases in annual area burnedand fire size to a warming climate, but these studies have focussed on large fires and have left the issues of fire severity andignition frequency unaddressed. Lightning ignitions, any of which could burn a large area given appropriate conditionsfor fire spread, could be the first indication of more frequent fire. We examined the relationship between snowpack andthe ignition and size of fires that occurred in Yosemite National Park, California (area 3027 km2), between 1984 and2005. During this period, 1870 fires burned 77 718 ha. Decreased spring snowpack exponentially increased the number oflightning-ignited fires. Snowpack mediated lightning-ignited fires by decreasing the proportion of lightning strikes thatcaused lightning-ignited fires and through fewer lightning strikes in years with deep snowpack. We also quantified fireseverity for the 103 fires >40 ha with satellite fire-severity indices using 23 years of Landsat Thematic Mapper data. Theproportion of the landscape that burned at higher severities and the complexity of higher-severity burn patches increasedwith the logl0 of annual area burned. Using one snowpack forecast, we project that the number of lightning-ignited fireswill increase 19.1% by 2020 to 2049 and the annual area burned at high severity will increase 21.9%. Climate-induceddecreases in snowpack and the concomitant increase in fire severity suggest that existing assumptions may be understated-fires may become more frequent and more severe.
Additional keywords: burn severity, climate change, climate variability, fire regime attributes, landscape flammability,normalized burn ratio, patch complexity, RdNBR, Sierra Nevada, snowpack, snow water equivalent.
Study area
Yosemite National Park is a contiguous management unit of3027km2 (latitude 37.7oN, longitude 119.7°W) located in thecentral Sierra Nevada of California. Elevations range from 657 mat the western park boundary to 3997 m at the summit of Mt Lyellon the Sierra Nevada crest. Approximately 84% of the park isvegetated. Yosemite National Park has been in protected statussince 1890 (Russell 1992; Rothman 2007).
Yosemite National Park's climate is Mediterranean. July meanminimum and maximum temperatures are 2 and l3°C above3700-m elevation and 16 and 35°C below 800-m elevation.Annual precipitation ranges from 800 to 1720 mm, with mostprecipitation falling in the winter as snow. The highest levels ofprecipitation (above 1300 mm year-1) occur at 2500 to 3200-melevation, and the lowest levels of precipitation (below 1000 mmyear-1) occur below 2000 m and in local rain shadows (Lutz2008). Most moisture eventually made available to plants comesfrom the spring snowpack. As well as providing moisture toplants in the growing season, the snowpack keeps surface fuelswet, and surface fuels become drier after the snowpack hasmelted.
Introduction
Large-scale studies of western North America show recentincreases in annual area burned and fire size (McKenzie et al.2004; Hannigan et al. 2005; Westerling et al. 2006). These stud-ies have focussed on large fires rather than all ignitions, and haveleft the issues of fire severity and ignition patterns unaddressed.Satellite fire-severity indices (Key 2006; Key and Benson 2006;Miller and Thode 2007) allow quantification of the current fire-severity regimes, and the 23-year record of Landsat ThematicMapper (Landsat TM) data extends over a range of fire sever-ities, reflecting fires occurring in varying climatic conditionsand forest types. Climate has been shown to affect the annualarea burned by fires (Heyerdahl et al. 2001; Littell et al. 2009),but relationships between climate and fire severity have beenless studied. The present study examines the antecedent climateconditions of fire seasons in Yosemite National Park, a large con-tiguous management unit that experiences multiple fires everyyear, and also the severity of fires occurring during an entire fireseason. This study attempts to bridge the work that has been donepredicting the behavior of single fires and the continental-scalepredictions arising from climatic forecasts.
The forests of Yosemite National Park include lower mon-tane, upper montane, and subalpine vegetation. Lower montaneforest occurs on the west side of the Sierra Nevada from 1000to 1800 m and comprises 15.3% of park area. Major vegetationtypes include: California black oak (Quercus kelloggii), pon-derosa pine (Pinus ponderosa), white fir (Abies concolor) mixedconifer, Douglas-fir (Pseudotsuga menziesii) mixed conifer, andmixed evergreen forests. Upper montane forest extends from1800 to 2750 m and comprises 26.2% of park area. Forests withinthis zone include extensive stands of red fir (Abies magnifica)along with occasional stands of western white pine (Pinus monti-cola). Woodlands with Jeffrey pine (Pinus jeffreyi) and mountainjuniper (Juniperus occidentalis) occupy exposed ridges whilemeadows and quaking aspen (Populus tremuloides) stands occurin moist areas. The subalpine forest zone ranges from 2750to 3450 m and consists of lodgepole pine (Pinus contorta)and mountain hemlock (Tsuga mertensiana) forests, as well aswhite bark pine (Pinus albicaulis) woodlands and numerous largemeadow complexes. Pinus contorta forests comprise 21.7% ofpark area, and Pinus albicaulis-Tsuga mertensiana forests com-prise 9.1% of park area (van Wagtendonk and Fites-Kaufman2006; Fires-Kaufman et al. 2007; Lutz 2008).
Yosemite National Park experiences multiple fires each year,mostly lightning-ignited, and since 1972, many of these fireshave been allowed to burn under prescribed conditions (vanWagtendonk 2007). Lightning-ignited fires occur almost exclu-sively in summer months, and are concentrated in outbreaksthat last one or several days (Bartlein et al. 2008). The fireregime is mixed; fires burn with patches of high, moderate, andlow severities at intervals ranging from years to centuries (vanWagtendonk et al. 2002; Sugihara et al. 2006; van Wagtendonkand Fites-Kaufman 2006). Before 1850, the fire point returninterval for forests of Yosemite National Park ranged from 4to 187 years (Caprio and Swetnam 1995; van Wagtendonk et al.2002). Before 1850, individual trees of fire-resistant species per-sisted through multiple fires (e.g. Sequoiadendron giganteum(Kilgore and Taylor 1979; Stephens and Elliott-Fisk 1999); Pinus jeffreyi (Stephens 2001); Pinus lambertiana (van Mantgem et al.2004).
We sought to examine recent lightning-ignited fires andburn severities in Yosemite National Park to understand currentfire conditions. Understanding current fire conditions may helpassess future fire-related changes in park vegetation (Swetnamet al. 1999). Should fire frequency or severity be increas-ing, management actions such as prescribed burning to reducefuels and allowing large areas of wildland fire to burn underprescribed conditions will become increasingly important tomitigate the effects of increased fire (Agee 2003; Graber 2003;van Wagtendonk and Lutz 2007; Larson et al. 2008).
Climate projections are for higher temperatures (Meehl et al.2007), leading directly to decreased snowpack (Hayhoe et al.2004; Mote et al. 2005; Knowles et al. 2006), and also forincreased CO2 levels (Keeling et al. 1995). Increased CO2levels have in turn been associated with greater convectionand increased lightning strikes (Price and Rind 1994a). To theextent that lightning-ignited fires may depend on snowpack oron CO2, lightning fires may become more numerous (Price andRind 1994b) and annual area burned may increase (McKenzieet al. 2004; Flannigan et al. 2005; Westerling et al. 2006).
Increased burned area is expected under future climate sce-narios (Field et al. 2007), and a concomitant increase in fireseverity would imply that ecological effects of future fires andduration of post-fire recovery may currently be underestimated(Turner et al. 1997; van Wagtendonk and Fites-Kaufman 2006;Collins et al. 2007; Miller et al. 2008). We sought to examinewhether a climate-induced change in snowpack would affect thefire regime.
Three potential mechanisms could contribute to a relationshipbetween decreased snowpack and increased lightning-ignitedfires. First, if landscape flammability (the tendency of fuel toignite if struck by lightning) increases continuously as fuel mois-ture decreases, an earlier snowmelt allows fuels to become drierby the end of the summer, and hence more readily ignited.Second, if landscape flammability depends on fuel moisturethresholds, longer snow-free periods leave fuel in an ignitablecondition longer. Third, if snowmelt is earlier, increased sensibleand latent heating could result in greater convection and morelightning strikes (Price and Rind 1994a). The strong Mediter-ranean climate pattern at Yosemite National Park implies thatfire-season moisture trends will be strongly influenced by springsnowpack largely because subsequent precipitation during thefire season is unlikely.
Methods
We used a 22-year record of ignitions, area burned, snowpack,and satellite-derived fire-severity data for the period from 1984to 2005. InYosemite National Park, van Wagtendonk et al. (2004)found that satellite measurements of burn severity were cor-related with plot measurements of the Composite Burn Index(Key and Benson 2006), a direct field measure of the ecologi-cal impact of fire on vegetation. We examined the relationshipbetween fire severity and annual area burned as well as rela-tionships between snowpack and lightning-ignited fires and areaburned. We also examined the temporal trend in area burned.Ecological effects of individual fires differ by landscape position,forest type, years since previous burn, and date of occurrencewithin the fire season (Turner et al. 1997; van Wagtendonkand Fires-Kaufman 2006: Collins et al. 2007; Thompson et al.2007) and also by ignition type (lightning ignition, prescribedfire, or other human ignition; van Wagtendonk and Lutz 2007).Therefore, we aggregated lightning-ignited fires and annual areaburned by annual fire seasons to develop summaries for theYosemite National Park landscape. We used a large numberof fires to decrease the stochasticity associated with individ-ual fire behavior and to generalize about fires over an entire fireseason.
Data sourcesSnow accumulation data were obtained from the CaliforniaDepartment of Water Resources (CDWR 2007), which main-tains 22 snow monitoring stations inYosemite National Park. Wesought a single value for the spring snowpack that would serveas an a priori indicator for the summer fire season. Preliminaryanalysis suggested that the Tuolumne Meadows snow monitoringstation (elevation 2621 m) would be appropriate because snowaccumulation and melting are less affected by local topogra-phy in this large meadow, and also because the Tuolumne River

watershed includes much of the area burned within YosemiteNational Park. Examination of precipitation using 1971-2000climatological means (PRISM 2007; Daiy et al. 2008) showedthat Tuolumne Meadows receives slightly less wi(ter precip-itation than the adjacent montane and subalpine areas of thepark (elevation 1850-2500 m), implying that the melt dates forTuolumne Meadows may be representative of larger portionsof Yosemite National Park. Rather than snow depth, we usedmeasurements of snowpack snow water equivalent (the watercontent of the snow per unit area; hereafter SWE, in cm). Because1 April SWE is most representative of the year's snowpack inthe Sierra Nevada (Church 1933, 1935; Woodhouse 2003), weused it to divide the years from 1984 to 2005 into wet, dry, andaverage years. Wet years were characterized by SWE > meanSWE plus one standard deviation. Dry years were characterizedby SWE < mean SWE minus one standard deviation. Averageyears were characterized by SWE within one standard deviationof the mean.
Fire locations, causes of ignition, perimeters and total areaburned in Yosemite National Park have been mapped on theground and aerially. Mapping is virtually complete, even for firesas small as 8m2. For those fires >40 ha, the area burned wasdetermined from satellite images and mapped fire perimeters.Landsat TM images from 1984 to 2006 were used to calcu-late the Relative differenced Normalized Burn Ratio (RdNBR)for each fire >40 ha in extent between 1984 and 2005 (vanWagtendonk et al. 2004; Thode 2005; Key 2006; Miller andThode 2007; van Wagtendonk and Lutz 2007; Miller et al.2008). RdNBR is the difference in the pre-fire and post-firenormalized burn ratio (NBR), normalized by the square root ofthe pre-fire value. The NBR is calculated using near-infrared(Landsat TM band 4) and short-wave infrared (Landsat TMband 7) wavelengths. The near-infrared wavelengths are sensi-tive to living vegetation, and the short-wave infrared wavelengthsare sensitive to ash, char and water content (for satellite imageselection and processing details, see Miller and Thode 2007;Miller et al. 2008). RdNBR accounts for heterogeneity of pre-fire vegetation and is appropriate for analyses of multiple fires(Miller and Thode 2007). Proportion of area burned at higherseverity was calculated using all fires, irrespective of type of igni-tion. Fires straddling the Yosemite National Park boundary wereclipped at the boundary. Fire severity (Key 2006; Sugihara et al.2006; Miller and Thode 2007) was stratified into high-severity(nearly complete tree mortality), moderate-severity (significanttree mortality), and low-severity (little tree mortality) burnpatches, as well as fire severities too low to be detected bysatellite images taken 1 year after the fire (fire confined to theunderstorey) .
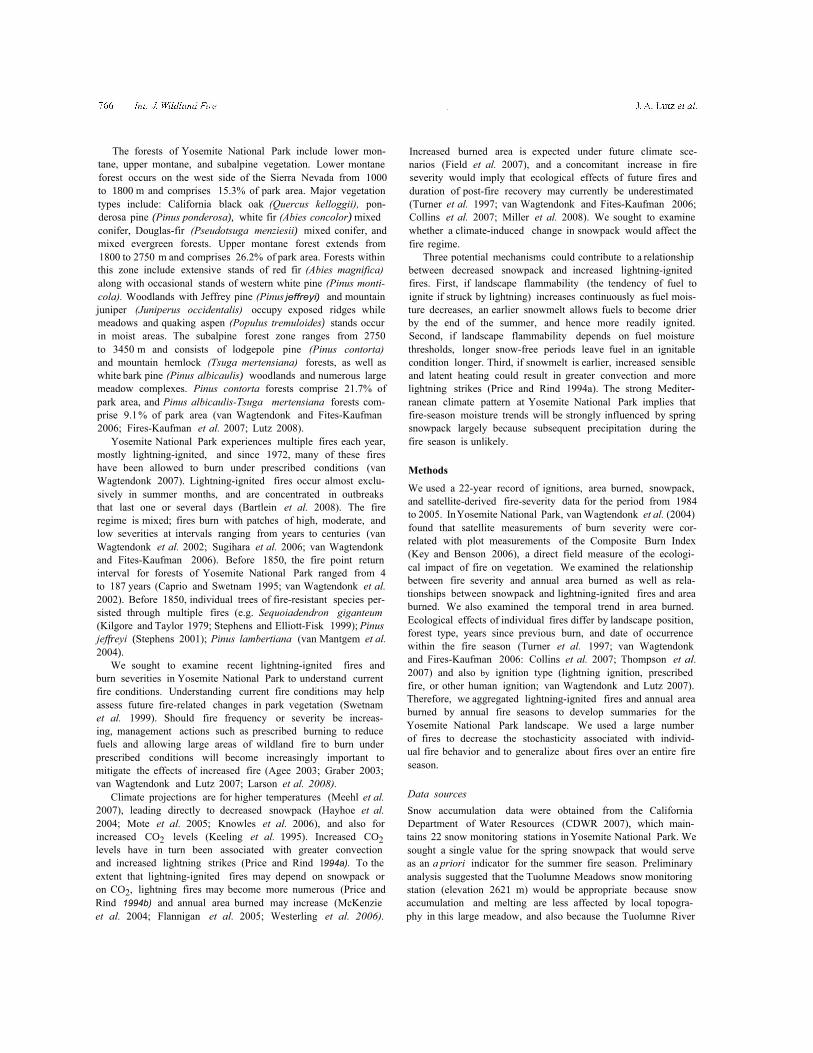
Lightning strike data for Yosemite National Park from 1985to 2000 were obtained from the National Lightning DetectionNetwork (van Wagtendonk and Cayan 2008). The availabilityof lightning strike data limited related analyses to that period.We defined landscape flammability as the number of lightning-ignited fires divided by the number of lightning strikes. Forrelationships between lightning ignitions and SWE, we fitteda two-parameter exponential curve. For relationships betweenflammability and SWE, we fitted a three-parameter exponentialcurve. For relationships between patch size, severity and areaburned, we performed linear regressions against the log10 of area
burned. Comparisons between groups of years (dry, normal, andwet) were performed with ANOVA (a =0.05).
Spatial complexity and patch sizesWe analyzed the RdNBR data with FRAGSTATS (McGarigalet al. 2002) and used the output to calculate mean patch size andthe Square Pixel (SqP) metric (Frohn 1998). SqP is an index thatruns from 0 (square, minimum complexity) to 1 (least square-like, high complexity). Unlike contagion and fractal dimension,SqP is optimized for use with data arranged in square pixels, suchas Landsat data (Frohn 1998). We fitted exponentially increasingcurves with a maximum value of one (the defined maximum ofthe SqP metric) to examine the relationships between spatialcomplexity and area burned for each burn severity.
Projected future snowpackWe used the results of one climate projection for California(Hayhoe et al. 2004) to examine the possible consequencesthat decreasing snowpack might have on lightning-ignited fires.The projection, based on the Hadley Centre Climate Model, ver-sion 3 (Gordon et al. 2000; Pope et al. 2000), coupled withthe intergovernmental Panel on Climate Change (IPCC) B 1emissions scenario (Nakicenovic et al. 2000), yielded an esti-mated decrease in snowpack of 24% between 2000 and 3000 m(Hayhoe et al. 2004). To approximate this possible future condi-tion inYosemite National Park while preserving the current rangeof variability, we took each year in our record (1984 to 2005) andgenerated a future scenario. We used our previous categorizationfor normal, wet, and dry years to characterize each year in thecurrent dataset. For each category in the current dataset (normal,wet or dry), we averaged the 1April SWE, number of lightning-ignited fires, area burned by lightning-ignited fires, and areaburned at moderate and high severities. Then we constructed afuture scenario where snowpack in each of 22 years was 24% lessthan the existing 22-year data record. We categorized each yearin the future scenario as normal, wet, or dry using the definitionsderived from the 1984 to 2005 period. We then used the categoryaverages (normal, wet, or dry) to infer a possible 22-year averagenumber of lightning strikes, lightning-ignited fires, area burnedby lightning-ignited fires, and area burned at moderate and highseverities.
Results
Between 1984 and 2005, 1870 fires burned 77 718 ha, just over10% of the park. Lightning ignited 1113 of those fires, totalling63 358 ha, which was 81.5% of area burned. During this period,103 fires >40 ha burned 73264 ha (94.3% of the area burned), ofwhich 73 were started by lightning and burned 61 524 ha (Fig. 1).
Snow water equivalent from all 22 Yosemite National Parkmonitoring stations was highly correlated, and data from anysnow monitoring station were a significant predictor (P < 0.05)of the number of lightning-ignited fires. The Tuolumne Meadowssnow monitoring station provided the best relationship. Addingadditional data from any other snow monitoring station did notimprove the relationship (partial F-test, a = 0.05). The 1 AprilSWE was inversely related to the number of lightning-ignitedfires (Fig. 2) using Tuolumne Meadows SWE as the predic-tor of the number of lightning-ignited fires (n =22, r2 = 0.69,

Between 1985 and 2000, there were a total of 15 527 light-ning strikes, resulting in 888 lightning-ignited fires. Landscapeflammability, or the proportion of strikes leading to ignitions,was 5.7% for all years between 1985 and 2000 and was relativelyconstant at SWE greater than or equal to the 22-year mean,
P < 0.001). The area burned by lightning-ignited fires was alsoinversely related to SWE, but because forest type, fuel loading,topography and fire weather determine individual fire behav-ior, area burned had a weaker relationship with SWE (n = 22,r2 = 0.13; P = 0.06).
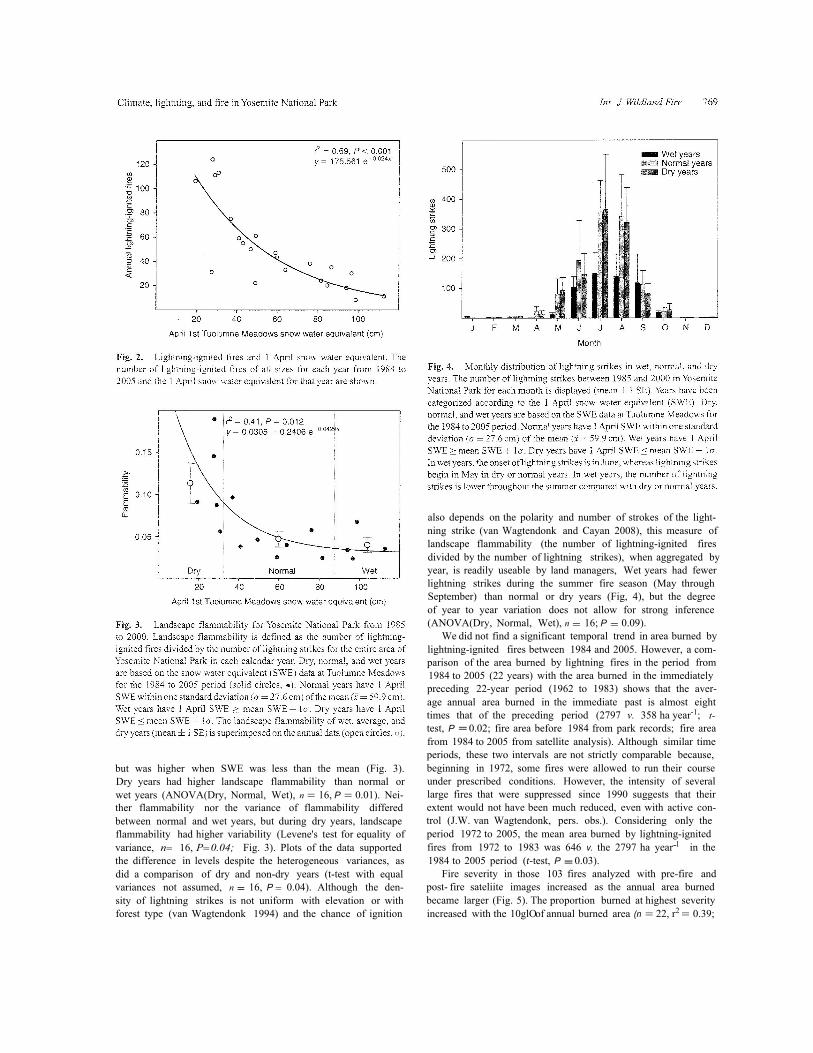
also depends on the polarity and number of strokes of the light-ning strike (van Wagtendonk and Cayan 2008), this measure oflandscape flammability (the number of lightning-ignited firesdivided by the number of lightning strikes), when aggregated byyear, is readily useable by land managers, Wet years had fewerlightning strikes during the summer fire season (May throughSeptember) than normal or dry years (Fig, 4), but the degreeof year to year variation does not allow for strong inference(ANOVA(Dry, Normal, Wet), n = 16; P = 0.09).
We did not find a significant temporal trend in area burned bylightning-ignited fires between 1984 and 2005. However, a com-parison of the area burned by lightning fires in the period from1984 to 2005 (22 years) with the area burned in the immediatelypreceding 22-year period (1962 to 1983) shows that the aver-age annual area burned in the immediate past is almost eighttimes that of the preceding period (2797 v. 358 ha year-1; t-test, P =0.02; fire area before 1984 from park records; fire areafrom 1984 to 2005 from satellite analysis). Although similar timeperiods, these two intervals are not strictly comparable because,beginning in 1972, some fires were allowed to run their courseunder prescribed conditions. However, the intensity of severallarge fires that were suppressed since 1990 suggests that theirextent would not have been much reduced, even with active con-trol (J.W. van Wagtendonk, pers. obs.). Considering only theperiod 1972 to 2005, the mean area burned by lightning-ignitedfires from 1972 to 1983 was 646 v. the 2797 ha year-l in the1984 to 2005 period (t-test, P =0.03).
Fire severity in those 103 fires analyzed with pre-fire andpost- fire sateliite images increased as the annual area burnedbecame larger (Fig. 5). The proportion burned at highest severityincreased with the 10glOof annual burned area (n = 22, r2 = 0.39;
but was higher when SWE was less than the mean (Fig. 3).Dry years had higher landscape flammability than normal orwet years (ANOVA(Dry, Normal, Wet), n = 16, P = 0.01). Nei-ther flammability nor the variance of flammability differedbetween normal and wet years, but during dry years, landscapeflammability had higher variability (Levene's test for equality ofvariance, n= 16, P=0.04; Fig. 3). Plots of the data supportedthe difference in levels despite the heterogeneous variances, asdid a comparison of dry and non-dry years (t-test with equalvariances not assumed, n = 16, P = 0.04). Although the den-sity of lightning strikes is not uniform with elevation or withforest type (van Wagtendonk 1994) and the chance of ignition

increased with the log]o of annual area burned (r2 =0.34,P = 0.007). Moderate-severity patch complexity also increasedwith the log]o of annual area burned (r2 = 0.43, P =0.002).Low-severity patch complexity and patch complexity of areaswhere no change was detected were equally complex in all years(P> 0.05).
Using the four fire-severity classes (high severity, moder-ate severity, low severity, and no change detected by satellite),the average patch size for all severity classes in all fires overall years was 3.95 ha. In years where at least one high-severitypatch was measured (20 of 22 years), high-severity patches aver-aged 3.69 ha. The size of high-severity patches showed a weakrelationship with the log10 of annual area burned (P =0.083).Moderate-severity patches, present in every year, had an aver-age size of 6.25 ha. For moderate-severity patches, patch sizeincreased with the logl0 of area burned (P = 0.005). Low-severity patches averaged 6.20 ha and had no relationship withannual area burned. The average patch size of areas that burned ata severity lower than satellite methods could detect was 2.75 ha,and the patch size was negatively related with the log10 of annualarea burned (P =0.047).
The future scenario oflower average snowpack (Hayhoe et al.2004) with current interannual variation in SWE resulted inhigher incidence of fires, greater annual area burned, anda higherproportion of high-severity fire (Table 1). The projected reduc-tion in average snowpack eliminated years currently classifiedas wet based on SWE (Fig. 3). The future scenario was princi-pally composed of years that would presently be characterizedas normal or dry, and the future fire regime resembled an aver-age of current normal and dry conditions (Table 1). Consideringthis snowpack scenario, the predicted average number of annuallightning-ignited fires over a 22-year period increases 19.1%(from 51 to 60) and the annual area burned at high severity overa 22-year period increases 21.9% (from 446 to 543 ha year-1).
Discussion
High levels of spring SWE are associated with decreased light-ning strikes, decreased numbers of lightning-ignited fires, andreduced area burned (Figs 2, 3). But by early autumn, fuels aredry irrespective of spring snowpack. Because high fuel mois-ture limits fires early in the year, fires could still reach largesizes late in a fire season, even when that season is shortened bya late snowpack with high SWE. Conversely, even fire seasonsthat would be long by virtue of a low spring SWE may exhibitlow area burned if ignitions are lower than average. The highervariance of lightning-ignited fires in dry years (Figs 2, 3) under-scores the annual variability in lightning strikes (Fig. 4). Withfew lightning strikes, years otherwise dry enough for extreme fireconditions may exhibit low area burned. Flammability will alsobe low in drier years if lightning strikes occur in early season or inconjunction with precipitation. The reduced number of lightningstrikes through May in wet years (Fig. 4) is expected, given thathigh levels of snowpack would keep surface temperature low,thereby decreasing convection. In wet years, soil and fuel mois-ture are also high, decreasing the proportion of lightning strikesthat start lightning-ignited fires (Fig. 3). However, the generallydecreased levels of lightning strikes throughout wet years (Fig. 4)suggest that the effects of high snowpacks continue well into the
P =0.001), as did the proportion burned at a combination of highand moderate severity (n = 22, r2 = 0.58; P < 0.00 l ).
Spatial complexity at higher burn severities increased withannual area burned (Fig. 6). High-severity patch complexity

phenomena are linked. Because our satellite-derived calcula-tions of fire severity are largely defined by vegetation mortality(Key 2006), larger areas burned and increased proportionsof areas burned at higher severity both imply a reduction inpost-fire vegetation on the landscape. Higher-severity burns havebeen associated with stand-replacement conditions in the SierraNevada (Miner et al. 2008); larger patches of high -severity burnshave been associated with longer recovery times in YellowstoneNational Park (Turner et al. 1997); and forest succession hasbeen found to be slower following complete stand-replacementfires (Keeton and Franklin 2005; see also French et al. 2008).Because areas burned at high severity retain very little of thepre-fire vegetation, post-fire recovery may take longer.
Our results hold for those areas burned in the study period,primarily lower montane and upper montane forests (see alsovan Wagtendonk and Lutz 2007). Although previous work hasshown individual large fires to be associated with large high-severity patches (e.g. Turner et al. 1997; Miller et al. 2008),landscape-scale studies in boreal forests have previously foundthat increasing fire size is associated with larger unburnedpatches (Eberhart and Woodard 1987). Furthermore, in borealforests, the differing vegetation and vegetation response to fire asmeasured by satellite techniques may preclude similar analyses(French et al. 2008; Verbyla et al. 2008). Therefore, our findingsshould be considered only in light offorest types similar to thoseof Yosemite National Park (see Introduction).
At snowpacks currently characterized as normal or wet(Fig. 3), the proportion of lightning strikes that result inlightning-ignited fires is relatively low and constant. The snow-pack scenario developed by Hayhoe et al. (2004) suggests thatin 20 to 30 years, snowpacks currently characterized as wet willhave become rare. If mean spring SWE decreases, landscapeflammability may increase and become more variable. Shouldclimate change decrease snowpack, these mixed fire regimeforests may experience more lightning-ignited fires, greater areaburned, and greater proportion of area burned at higher severi-ties. Our fire severity analysis supports suggestions that westernfire regimes are changing. Reduced snowpack and warmer spring
summer. Whatever the precise combination of mechanisms con-tributing to landscape flammability, 1 April SWE can provide aforecast (Fig. 3), a relationship that is strong inYosemite NationalPark because summer precipitation is low.
The spatial patterns of fire are important aspects of a fireregime (Sugihara et al. 2006) and of post-fire forest succes-sion. Forests of the Sierra Nevada are partially characterizedby their patchiness at 100-ha to 1000-ha scales (Franklin andFires-Kaufman 1996). Within large-scale patches, there is con-siderable variation in forest composition and structure at smaller(1 to l0ha) scales (Langley 1996). At least some of this hetero-geneity has been maintained by vegetation-fire feedbacks andmay be responsible for higher levels of plant and animal diversity(van Wagtendonk et al. 1998; Miller and Urban 1999; Stephens2001; Collins et al. 2007; Roberts et al. 2008). Higher levels ofpatch complexity at high and moderate fire severities are asso-ciated with increasing annual area burned (Fig. 6), which inturn suggests that the area within the perimeters of large burnedareas comprises a diversity of post-fire conditions. However,although we found a general trend of higher patch complex-ity with increasing annual area burned, the three largest firesexhibited several extensive patches of continuous high severity,suggesting localized areas of decreased landscape heterogeneity.
In Yosemite National Park, increasing annual area burnedfrom all fires - most of them unsuppressed - increases the pro-portion burned at higher severities (Fig. 5). The quantificationof this relationship - suspected but not previously documented-has only been made possible by the development of satellitefire-severity analysis and the attendant calibrations of the eco-logical meaning of satellite fire severity measurements for theSierra Nevada (van Wagtendonk et al. 2004; Thode 2005; Key2006; Miller and Thode 2007; see also French et al. 2008, andreferences therein). The result is expected from the physical char-acteristics of large fires and the fire weather that causes them(van Wagtendonk 2006). Although we have shown a correla-tion between annual area burned and severity, both could bedetermined by seasonal climatic conditions or fire weather. Irre-spective of the underlying mechanism, we show that the two

temperatures lead to an increase in area burned (Westerlinget al. 2006), but an increase in area burned also leads to anincrease in severity. Climate-induced decreases in snowpack andthe concomitant increase in fire severity suggest that existingassumptions may be understated - fires may become more fre-quent and more severe, with forests recovering commensuratelymore slowly.
Management implications
An increasingly important responsibility for land managers isto prepare for fires, to manage fires, and to plan for post-firehydrological and vegetation conditions. Many land managershave a geographic scope similar to the 3027-km2 extent of thepresent study. For fire managers inYosemite National Park, theseresults may provide quantitative a priori estimates for the num-ber of lightning-ignited fires within a fire season. The 1 AprilSWE is correlated with the number oflightning-ignited fires andarea burned: when 1 April SWE is high, snow persists longer,decreasing the possibility of lightning-ignited fires during thefire season (Figs 3, 4). Whether a given number of lightning-ignited fires translates into a severe fire season depends on theforest type, fuel loading, fuel moisture, and fire weather for eachindividual fire.
The relationship between area burned and area burned athigher severities could assist with immediate assessment of post-fire water quality, reforestation, and animal habitat issues. Thehigher levels of tree mortality associated with increased pro-portions of high-severity fire might require higher levels ofmanagement per unit area for restoration or mitigation of runoffor hazard tree dangers. Land managers may find the relationshipbetween area burned and severity useful in estimating post-fireconditions for species of interest. If the area burned at higherseverities increases, older and larger trees may experience higherlevels of mortality. in that eventuality, Yosemite National Parkcould experience decreases in late-successional forests.
AcknowledgementsWe thank Yosemite National Park the US Geological Survey Western Eco-logical Research Center, and the California Department of Water Resourcesfor data and data management. We thank J. K. Agee, A. J. Larson,D. McKenzie, and A. L. Westerling for discussions. Comments fromJ. A. Freund, A. R. Gillespie, C B. Halpern, T M. Hinckley,D. G. Sprugel, and two anonymous reviewers improved previous versions ofthis manuscript. This research was supported by National Science FoundationIGERT (0333408) and the Seattle ARCS Foundation.
ReferencesAgee JK (2003) Burning issues in fire: will we let the coarse filter oper-
ate, In 'Proceedings of Fire Conference 2000', Tallahassee, FL (EdsKEM Galley, RC Klinger, NG Sugihara) Tall Timbers Research StationMiscellaneous Publication 13, pp. 7-13. (Tallahassee, FL)
Bartlein P J, Hostetler Sw, Shafer SL, Holman JO, Solomon AM (2008)Temporal and spatial structure in a daily wildfire-start data set from thewestern United States (1986-96).lnternational Journal of Wildland Fire17.8-17. doi:101071/WF07022
CDWR (2007) Snow conditions. Database. (California Department ofWater Resources) Available at http://cdec.water.ca.gov/snow/ [Verified12 September 2009]
Caprio AC, Swetnam TW (1995) Historic fire regimes along an elevationalgradient on the west slope of the Sierra Nevada: California. In 'Proceed-ings of the Symposium on Fire in Wilderness and Park Management'(Eds JK Brown, RW Mutch CW Spoon. RH Wakimoto) USDA For-est Service, Intermountain Research Station. General Technical ReportINT-GTR-320, pp. 173-179. (Ogden, UT)
Church JE (1933) Snow surveying: its principles and possibilities. Geo-graphical Review 23, 529-563. doi 10.2307/209242
Church JE (1935) Principles of snow surveying as applied to forecastingstream flow. Journal ofAgricultural Research 51: 97···-130.
Collins BM, Kelly NM, van Wagtendonk JW, Stephens SL (2007) Spatial pat-terns of large natural fires in Sierra Nevada wilderness areas. LandscapeEcology 22. 545-557. doi: 10.1 007/S10980-006-9047-5
Daly C, Halbleib M, Smith JI. Gibson WP, Doggett MK, Taylor WPCurtis J. Pasteris PP (2008) Physiographically sensitive mapping ofclimatological temperature and precipitation across the conterminousUnited States. International Journal of Climatology 28, 2031-2064.doi: 10.1002/JOC.1688
Eberhart KE, Woodard PM (1987) Distribution of residual vegetation asso-ciated with large fires in Alberta. Canadian Journal of Forest Research17,1207-1212. doi:l0.1139/X87-186
Field CB, Mortsch LD, Brklacich M, Forbes DL, Kovacs P, Patz JA, RunningSw, Scott MJ (2007) 'North America. Climate Change 2007: Impacts,Adaptation and Vulnerability. Contribution of Working Group II tothe Fourth Assessment Report of the Intergovernmental Panel onClimate Change'. (Eds ML Parry, OF Canziani, JP Pa1utikof, PJ vander Linden, CE Hanson) pp. 617-652. (Cambridge University Press:Cambridge, UK)
Fites-Kaufman JA, Rundel P, Stephenson N, Weixelman DA (2007) Mon-tane and subalpine vegetation of the Sierra Nevada and Cascade ranges.In 'Terrestrial Vegetation of California' (Eds M Barbour, T Keeler-Wolf, AA Schoenherr) pp. 456-501. (University of California Press:Berkeley, CA)
Flannigan MD, Logan KA, Amiro BD, Skinner WR, Stocks BJ (2005) Futurearea burned in Canada. Climatic Change 72, 1-16. doi:l 0.1007/S10584-005-5935-Y
Franklin JF, Fites-Kaufman J (1996) Assessment of late-successional forestsof the Sierra Nevada. In 'Sierra Nevada Ecosystem Project: Final Reportto Congress) Volume II, Assessments and Scientific Basis for Manage-ment Options'. pp. 627--661. (University of California, Centers for Waterand Wildland Resources: Davis, CA)
French NHF, Kasischke ES, Hall RJ, Murphy KA, Verbyla DL, Hoy EE.Allen JL, (2008) Using Landsat data to assess fire and burn severityin the North American boreal forest region: an. overview and sum-mary of results. International Journal of Wildland Fire 17, 443--462.doi: 10.1 07l/WF08007
Frohn RC (1998) 'Remote Sensing for Landscape Ecology: New MetricIndicators for Monitoring, Modeling, and Assessment of Ecosystems.'(Lewis Publishers, CRC Press: Boca Raton, FL)
Gordon C, Cooper C, Senior CA, Banks H, Gregory JM. Johns TC,Mitchell JFB, Wood RA (2000) The simulation of SST, sea ice extentsand ocean heat transports in a version of the Hadley Centre cou-pled model without flux adjustments. Climate Dynamics 16, 147-168.doi: 10.1007/S003820050010
Graber DM (2003) Facing a new ecosystem management paradigmfor national parks. Ecological Research 21, 264-268. doi: 10.3368!ER.21.4.264
Hayhoe K, Cayan D, Field CB, Frumhoff PC, Maurer EP, Miller NL.Moser SC, Schneider SH (2004) Emissions pathways, climate change.and impacts on California. Proceedings of the National Academyof Sciences of the United States of America 101. 12422-12427.doi 10.1 073/PNAS.040450010 1
Heyerdahl EK, Brubaker LB, Agee JK (2001) Spatial controls of historicalfire regimes: a multiscale example from the interior west. USA. Ecology82.660-678.

Keeling CD, Whorf TP, Wahlen M, van der Plicht J (1995) Interannualextremes in the rate of rise of atmospheric carbon dioxide since 1980.Nature 375,666-670. doi: 10.1038/375666AO
Keeton WS, Franklin JF (2005) Do remnant old-growth trees accelerate ratesof succession in mature Douglas-fir forests? Ecological Monographs 751
103-118. doi: 10.1890103-0626Key CH (2006) Ecological and sampling constraints on defining landscape
fire severity. Fire Ecology 2(2), 34-59.Key CH, Benson NC (2006) landscape assessment: ground measure of
severity, the Composite Burn Index, and remote sensing of severity, theNormalized Burn Ratio. In 'FIREMON: Fire Effects Monitoring andInventory System'. (Eds DC Lutes, RE Keane, JF Caratti, CH Key,NC Benson, S Sutherland, LJ Gangi) USDA Forest Service, RockyMountain Research Station, Genera! Technical Report RMRS-GTR-I64CD, pp. LAl-LA55. (Fort Collins, CO)
Kilgore BM, Taylor D (1979) Fire history of a sequoia mixed conifer forest.Ecology 60,129-142. doi:10.2307/l936475
Knowles N, Dettinger MD, Cayan DR (2006) Trends in snowfall versusrainfall in the western United States. Journal of Climate 19,4545-4559.doi:10.1175/JCLl3850.1
Langley PG (1996) Quality assessment of late seral old-growth forest map-ping. In 'Sierra Nevada Ecosystem Project: Final Report to Congress,Volume If, Assessments and Scientific Basis for Management Options'.pp. 663--669. (University of California, Centers for Water and WildlandResources: Davis, CA)
Larson AJ. Lutz JA. Gersonde Rf, Franklin IF, Hietpas FF (2008) Produc-tivity influences the rate of forest structural development. EcologicalApplications 18,899-910. doi: 10.1890/07-1191.1
Littell JS, McKenzie D, Peterson DL, Westerling AL (2009) Climate andwildfire area burned in western US ecoprovinces, 1916-2003. EcologicalApplications 19,1003-1021. doi: 10. 1890/07-1183.1
Lutz JA (2008) Climate, fire, and vegetation change in Yosemite NationalPark. Ph.D. Dissertation. University of Washington, College of ForestResources, Seattle, Washington, USA.
Lutz JA, van Wagrendonk Jw. Franklin JF (2009) Twentieth-centurydecline of large-diameter trees in Yosemite National Park, California,USA. Forest Ecology and Management 257, 2296-2307. doi:10.1016/JFOREC02009.03009
McGarigal K, Cushman SA, Neel MC, Ene E (2002) 'FRAGSTATS: Spa-tial Pattern Analysis Program for Categorical Maps.' (University ofMassachusetts: Amherst, MA)
McKenzie D, Gedalof Z, Peterson DL, Mote P (2004) Climaticchange, wildfire, and conservation. Conservation Biology 18, 890-902.doi:10.1111/J1523-1739.2004.00492.X
Meehl GA, Stocker TF, Collins WD, Friedlingstein P, Gaye AT, GregoryJM, Kitoh A, Knutti R, Murphy JM, Noda A, Raper SCB, WattersonIG, Weaver AJ, Zhao ZC (2007) 'Global Climate Projections in Cli-mate Change 2007: the Physical Science Basis. Contribution of WorkingGroup I to the Fourth Assessment Report of the Intergovernmental Panelon Climate Change'. (Eds S Solomon, D Qin, M Manning, Z Chen,M Marquis, KB Averyt, M Tignor, HL Miller) pp. 747-845. (CambridgeUniversity Press: Cambridge, UK)
Miller C, Urban DL (1999) Interactions between forest heterogene-ity and surface fire regimes in the southern Sierra Nevada.Canadian Journal of Forest Research 29, 202-212. doi:10.11391CJFR-29-2-202
Miller JD, Thode AE (2007) Quantifying burn severity in a hetero-geneous landscape with a relative version of the delta NormalizedBurn Ratio (dNBR). Remote Sensing of Environment 109, 66-80.doi: 10 1016/lRSE.2006.12.006
Miller JD, Safford HD, Crimmins M, ThodeAE (2008) Quantitative evidencefor increasing forest fire severity in the Sierra Nevada and south-ern Cascade Mountains, California and Nevada, USA. Ecosystem, 12.16-32. doi: 10.1007/S10021-008-9201-9
Mote PW, Hamer AF, Clark MP, lettenmaier DP (2005) Declining moun-tain snowpack in western North America. Bulletin of the AmericanMeteorological Society 86, 39-49. doi: 10.1 175/BAMS-86-1-39
Nakicenovic N, Davidson O, Davis G, Grubler A, Kram T, La Revere ELMetz B, Morita T, Pepper W, Pitcher H, Sankovski A, Shukla P, Swart R,Watson R, Dadi Z (2000) 'Intergovernmental Panel on Climate ChangeSpecial Report on Emissions Scenarios.' (Cambridge University Press:Cambridge, UK)
Pope VD, Gallani ML, Rowntree PR, Stratton RA (2000) The impact ofnew physical parameterizations in the Hadley Centre climate model:HadAM3. Climate Dynamics 16, 123-146. doi: 1 0.1007/S003820050009
Price C, Rind D (1994a) Possible implications of global climate change onglobal lightning distributions and frequencies. Journal of GeophysicalResearch 99, 10823-10831. doi:10.1029/94JD00019
Price C, Rind D (1994b) The impact of a 2 x CO2 climate on lightning-caused fires. Journal of Climate 7, 1484-1494. doi:10.1175/1520-0442(1994)007<1484:TIOACC>2.0.CO:2
PRISM (2007) 'Climatological Normals, i971-2000' (Oregon StateUniversity: Corvallis, OR)
Roberts SL, van Wagtendonk Jw, Kelt DA, Miles AK, Lutz JA (2008) Mod-eling the effects of fire severity and spatiai complexity on small mammalsin Yosemite National Park, California, USA. Fire Ecology 4, 83-104.
Rothman HK (2007) 'Blazing Heritage: a History of Wildland Fire in theNational Parks.' (Oxford University Press: New York)
Russell CP (1992) 'One Hundred Years in Yosemite.' (Yosemite Association:EI Portal, CA)
Stephens SL (2001) Fire history differences in adjacent Jeffrey pineand upper montane forests in the eastern Sierra Nevada. Inter-national Journal of Wildland Fire 10, 161-167. doi:10.107l/WF01008
Stephens SL, Elliott-Fisk DL (1999) Sequioadendron giganteum-mixedconifer forest structure in 1900--1901 from the southern Sierra Nevada.Madrono 45.221-230.
Sugihara NG, van Wagtendonk JW, Fites-Kaufman J, Shaffer KE, ThodeAE (2006) Fire as an ecological process. In 'Fire in California'sEcosystems'. (Eds NG Sugihara, JW van Wagtendonk. KE Shaffer,J Fires-Kaufman, AE Thode) pp. 58-74. (University of California Press:Berkeley, CA)
Swetnam TW, Allen CD, Betancourt JL (1999) Applied historical ecology:using the past to manage for the future. Ecological Applications 9, 1189-1206. doi: 10.1890/1051-0761(1999)009[1189:AHEUTP]2.0.CO:2
ThodeAE (2005) Quantifying the fire regime attributes of severity and spatialcomplexity using field and imagery data. PhD Dissertation, UniversityofCa!ifomia, Davis, CA.
Thompson JR, Spies TA, Ganio LM (2007) Reburn severity in managed andunmanaged vegetation in a large wildfire. Proceedings of the NationalAcademy of Sciences of the United States of America 104.10743-10748.doi: 10.1073/PNAS.0700229104
Turner MG, Romme WH, Gardner RH, Hargrove WW (1997) Effects offire size and pattern on early succession in Yellowstone National Park.Ecological Monographs 67, 411-433.
van Mantgem PJ, Stephenson NL, Keifer M, Keeley J (2004) Effects of anintroduced pathogen and fire exclusion on the demography of sugar pine.Ecological Applications 14. 1590-1602. doi: 10.1890/03-5109
van Wagtendonk JW (1994) Spatial patterns of lightning strikes and fires inYosemite National Park. In 'Proceedings of the 12th Conference on Fireand Forest Meteorology' pp. 223-231. (Society of American Foresters:Bethesda, MD)
van Wagtendonk JW (2006) Fire as a physical process. 2006. In 'Firein California's Ecosystems'. (Eds NG Sugihara, 5W van Wagtendonk,KE Shaffer, J Fites-Kaufman, AE Thode) pp. 38-57. (University ofCalifornia Press: Berkeley, CA)
van Wagtendonk JW (2007) The history and evolution of wildland fire use.Fire Ecology 3(2), 3-17.

van Wagtendonk JW, Cayan D (2008) Spatial patterns of lightning strikesand tires in California. Fire Ecology 4(1),34-56.
van Wagtendonk JW, Fites-Kaufman J (2006) Sierra Nevada bioregion.In 'Fire in California's Ecosystems' (Eds NG Sugihara, JW vanWagtendonk, KE Shaffer J Files-Kaufman, AE Thode) pp. 264--294.(University of California Press: Berkeley, CA)
van Wagtendonk Jw, Lutz JA (2007) Fire regime attributes of wildland firesin Yosemite National Park, USA. Fire Ecology 3(2), 34--52.
van Wagtendonk JW, Benedict JM, Sydoriak WM (1998) Fuel bed charac-teristics of Sierra Nevada conifers. Westan Journal of Applied Forestry13(3),73-84.
van Wagtendonk JW, van Wagtendonk KA, Meyer lB. Painter KJ (2002) Theuse of geographic information for fire management planning in YosemiteNational Park. The George Wright Forum 19,19-39.
van Wagtendonk JW, Root RR, Key CH (2004) Comparison of AVIRIS andLandsat ETM+ detection capabilities for burn severity. Remote Sensingof Environment 92, 397-408. doi: 10. 1016/J.RSE.2003.12015
Verbyla DL Kasischke ES, Hoy EE (2008) Seasonal and topographic effectson estimating fire severity from Landsat TMIETM+ data. InternationalJournal of Wildiand Fire 17, 527-534. doi:l0.1071,WF08038
Westerling AL Hidalgo HG, Cayan DR, Swetnam TW (2006) Warming andearlier spring increase in western US forest wildfire activity. Science313.940-943. doi: 10.1126/SCIENCE.1128834
Woodhouse CA (2003) A 431-year reconstruction of western Coloradosnowpack from tree rings. Journal of Climate 16(10),1551-1561.


![Severity of God - Braggs Church of Christ · Severity of God – (severity means roughness, rigor, cutting off) •Rom. 11:22 •[22] Behold therefore the goodness and severity of](https://img.dokumen.tips/doc/110x75/5f5ba0a04848d10a6e0f5a0a/severity-of-god-braggs-church-of-christ-severity-of-god-a-severity-means-roughness.jpg)