Embed Size (px)
Citation preview

Climate Change and Energyg gy
Information, Challenges, and Strategies for Vermont Agency on Transportation
May 16, 2011y

Workshop Purpose
• To provide overview informationon climate change and energyg gy
• To provide foundation for state DOTs and partner agencies to respond to climate change and energy challenges
T f t ll b ti• To foster collaborative discussions on possible next steps
Parsons Brinckerhoff / Sarah J. Siwek & Associates, Inc. | Climate Change

Workshop Overview
I. Climate Change/Energy: Science, Sources, Trends II. The Importance of Climate Change for
TransportationIII. Climate Adaptation for Transportationp pIV. Reducing GHG Emissions from Transportation –
Strategies, Planning, and NEPAVI N t St f VTRANS d VTRANS P tVI. Next Steps for VTRANS and VTRANS Partner
Agencies
Parsons Brinckerhoff / Sarah J. Siwek & Associates, Inc. | Climate Change

I. Climate Change/Energy: Science Sources TrendsScience, Sources, Trends
Parsons Brinckerhoff / Sarah J. Siwek & Associates, Inc. | Climate Change
Greenhouse Effect
2. Some energy is reflected back out to space 3. Earth’s surface is
heated by the sun and radiates the heat back out towards space.
1. Solar energy th h th
4. GHG in the atmosphere trap some of the heat
passes through the atmosphere
Parsons Brinckerhoff / Sarah J. Siwek & Associates, Inc. | Climate Change5

Climate Change
The United Nations Framework Convention on Climate Change (UNFCCC) definesChange (UNFCCC) defines Climate Change as:
“A change of climate which is attributed directly oris attributed directly or indirectly to human activity that alters the composition of the global atmosphere andthe global atmosphere and which is in addition to natural climate variability observed over comparable
Parsons Brinckerhoff / Sarah J. Siwek & Associates, Inc. | Climate Change
ptime periods.”

Growing Evidence
14% i i h GHG i 1990 USA• 14% increase in human GHG since 1990 – USA• 26% increase in human GHG since 1990 – world• GHG levels are at highest in 1000s of years• 2000-2009 was the warmest decade on record worldwide2000 2009 was the warmest decade on record worldwide• Heat stored in oceans has increased substantially• Sea surface temperatures have been higher during the past three decades than at
any other time since large-scale measurement began in the late1800s. • In recent years, a higher percentage of precipitation in the United States has come in
the form of intense single-day events. • 8 of top 10 years for extreme one-day precipitation events occurred since 1990. • The occurrence of abnormally high annual precipitation totals has increased.The occurrence of abnormally high annual precipitation totals has increased.• Intensity of tropical storms in the Atlantic, Caribbean, and Gulf has risen noticeably
over the past 20 years. • 6 of the 10 most active hurricane seasons have occurred since the mid-1990s.
Parsons Brinckerhoff / Sarah J. Siwek & Associates, Inc. | Climate Change
Source: EPA, Climate Change Indicators in the U.S., May 2010
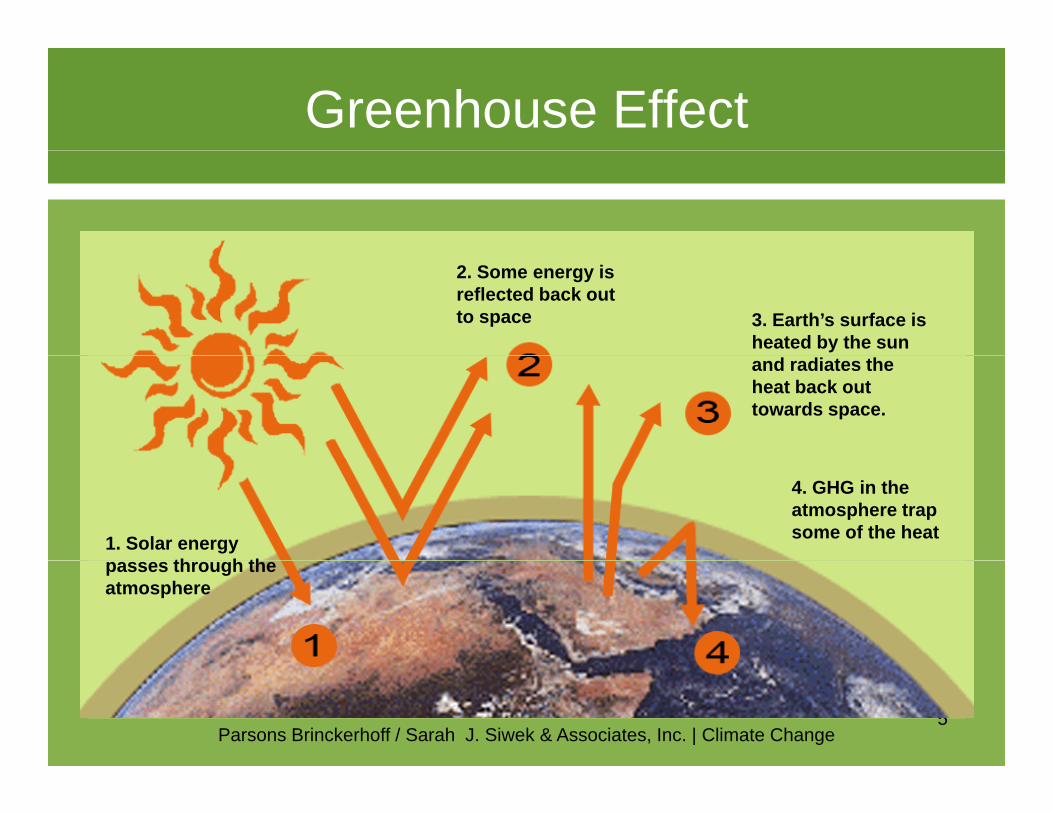
Growing Evidence (continued)
S l l ld id h i d t t f hl 0 6” d d i 1870• Sea level worldwide has increased at a rate of roughly 0.6” per decade since 1870. • Sea level increase has accelerated to more than 1”/decade in recent years. • Oceans have become more acidic over the past 20 years, and studies suggest that
the ocean is substantially more acidic now than it was a few centuries ago. Rising y g gacidity is associated with increased levels of carbon dioxide dissolved in the water, and affects sensitive organisms such as corals.
• Sept 2007 had least Arctic sea ice of any year on record, followed by 2008 and 2009. • Arctic sea ice in 2009 was 24 percent below the 1979-2000 historical average• Arctic sea ice in 2009 was 24 percent below the 1979-2000 historical average. • Glaciers in U.S. and around the world have generally shrunk since the 1960s and the
rate at which glaciers are melting appears to have accelerated over the last decade. • Glaciers worldwide have lost more than 2,000 cubic miles of water since 1960.• Average length of the growing season in the lower 48 states has increased by about
two weeks the since beginning of the 20th century. • North American bird species have shifted their wintering grounds northward by an
average of 35 miles since 1966, with a few species shifting by several hundred miles.
Parsons Brinckerhoff / Sarah J. Siwek & Associates, Inc. | Climate Change
average of 35 miles since 1966, with a few species shifting by several hundred miles. Source: EPA, Climate Change Indicators in the U.S., May 2010

GHG Scenarios
Source: Virginia Burkett, USGS, USGCRP 2009

How widespread are climate change concerns?
• Over 2000 leading scientists worldwide contributed to IPCC report• 33 U.S. states have developed climate change action plans• U.S. military is actively preparing for climate change • U.S. Climate Action Partnership includes 23 major corporations and 5
nongovernmental groups which have called for U.S. Congress to enact strong GHG targets to achieve significant reductions in GHG:
AES, Alcoa, Alstom, Boston Scientific Corporation, Chrysler, The Dow Chemical Company, Duke Energy, DuPont, Environmental Defense Fund, Exelon Corporation, Ford Motor Company, FPL Group, General p p y pElectric, General Motors, Honeywell, Johnson & Johnson, Natural Resources Defense Council, The Nature Conservancy, NRG Energy, PepsiCo, Pew Center on Global Climate Change, PG&E Corporation, PNM Resources, Rio Tinto, Shell, Siemens Corporation, Weyerhaeuser, World Resources Institute.
Parsons Brinckerhoff / Sarah J. Siwek & Associates, Inc. | Climate Change
p y
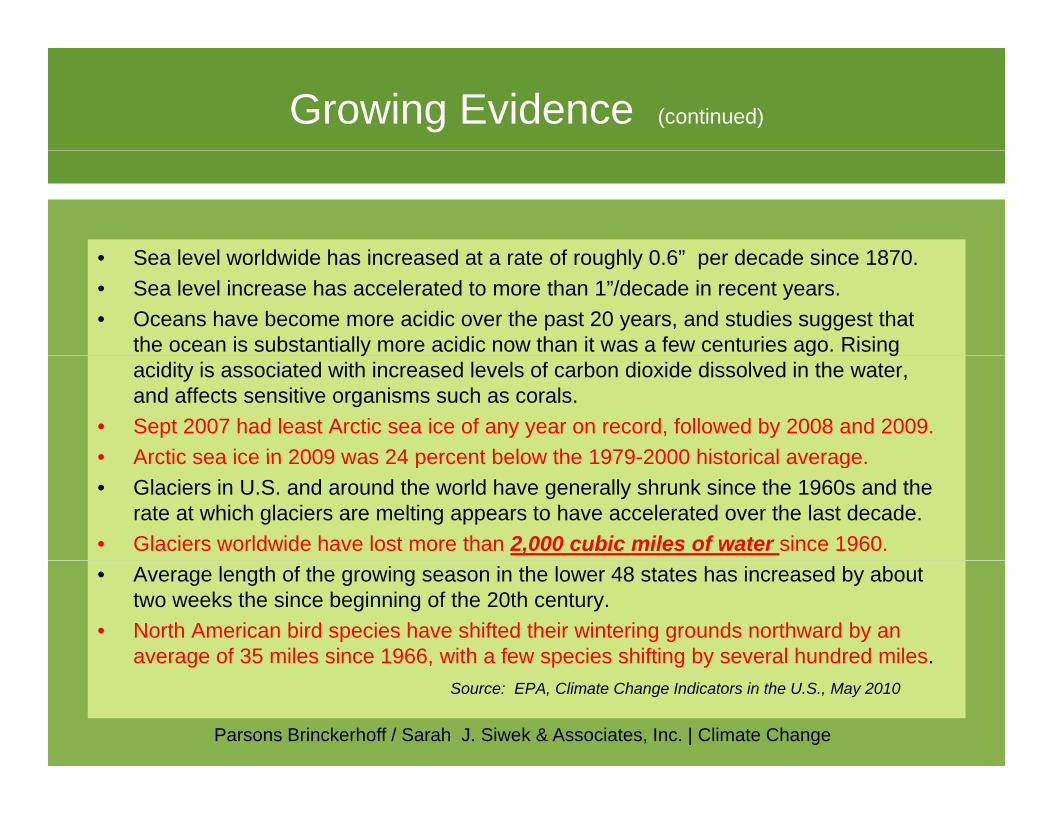
Impacts of Climate Change
Parsons Brinckerhoff / Sarah J. Siwek & Associates, Inc. | Climate Change

Temperature Changes (°F) (compared to 1961-1979 Baseline)
Low Scenario End-of-Century (2080-2099 average)
High Scenario End-of-Century(2080-2099 average)
Source: Virginia Burkett, USGS (USGCRP 2009)

Precipitation Changes (Change in Spring Precipitation – by 2090, showing
areas of highest confidence in model prediction)areas of highest confidence in model prediction)
Dryer Wetter
Figure courtesy of Mike Wehner, DoE and Katharine Hayhoe, Texas Tech for USGCRP, 2009

GHG Sources – by Country
Comparison: Annual* & Cumulative** CO2 EmissionsComparison: Annual & Cumulative CO2 Emissions
30%
27%30%
35%Annual Emissions (2004)
Cumulative Emissions (1850-2000)
22%
18%
15%15%
20%
25%
rcen
tage
6%4% 5%
1%2% 1% 1% 2% 1% 1%
7%8%
2%4%
1%2%
1% 1% 1% 1%
5%
10%
15%
Per
1% 1% 1% 1%1% 1% 0.5% 1% 1% 1%
0%
USChin
a
EU-25
Russia
India
Japa
nBraz
il
Canad
a
Mexico
Indon
esia
South
Korea
Austra
lia
South
Africa
Countries
Parsons Brinckerhoff / Sarah J. Siwek & Associates, Inc. | Climate Change
Source: * Annual Emissions for the year 2004 from IEA (2006) CO2 Emissions from Fossil Fuel Combustion** Cumulative Emissions from 1850-2000, CAIT WRI

GHG Targets
• Scientists recommend 60-80% GHG reduction below 1990 level by 2050 to avoid worst impacts
• Many states and countries have adopted similar targets• President Obama and several bills in Congress: 80%
GHG reduction below 2005 by 2050GHG reduction below 2005 by 2050• VT targets are to reduce GHG by:
25% below 1990 by 2012y50% below 1990 by 202875% below 1990 by 2050, if practical
Parsons Brinckerhoff / Sarah J. Siwek & Associates, Inc. | Climate Change

Transportation’s Share of U.S. GHGSource: U.S. DOT Report to Congress, 2010
Parsons Brinckerhoff / Sarah J. Siwek & Associates, Inc. | Climate Change

U.S. Transportation GHG TrendsS U S DOT R t t C 2010
Change 1990-2006
Source: U.S.DOT Report to Congress, 2010
Change, 1990-2006
All U.S. GHG Sources 15%
U S Transportation 27%U.S. Transportation 27%
Light Duty Vehicles 24%
Freight Trucks 77%
Parsons Brinckerhoff / Sarah J. Siwek & Associates, Inc. | Climate Change17
Commercial Aircraft 4%

U.S. VMT Growth Rates are Declining
VMT th h b t dil d li i i th 1950• VMT growth has been steadily declining since the 1950s• VMT growth slowed to about 1.5% in early 2000s• VMT growth was actually negative in 2008, pattern of upward growth in 2009• VMT is affected by population, economy, transportation prices, demographics,
land useland use
VMT GROWTH RATE PER DECADE 6
3
4
5
nt c
hang
e
0
1
2
perc
en
Parsons Brinckerhoff / Sarah J. Siwek & Associates, Inc. | Climate Change
1950's 1960's 1970's 1980's 1990's 2000's
Source: Alan Pisarski and Cambridge Systematics

DOE expects VMT and MPG both to rise
Parsons Brinckerhoff / Sarah J. Siwek & Associates, Inc. | Climate Change
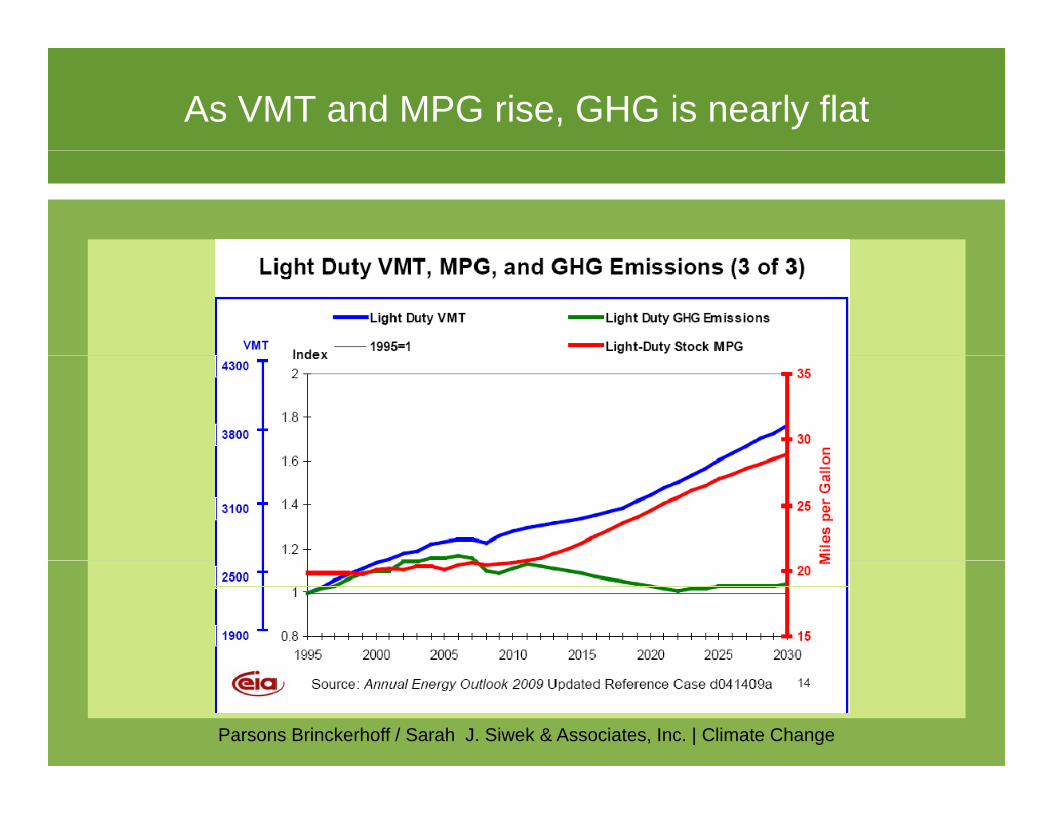
As VMT and MPG rise, GHG is nearly flat
Parsons Brinckerhoff / Sarah J. Siwek & Associates, Inc. | Climate Change
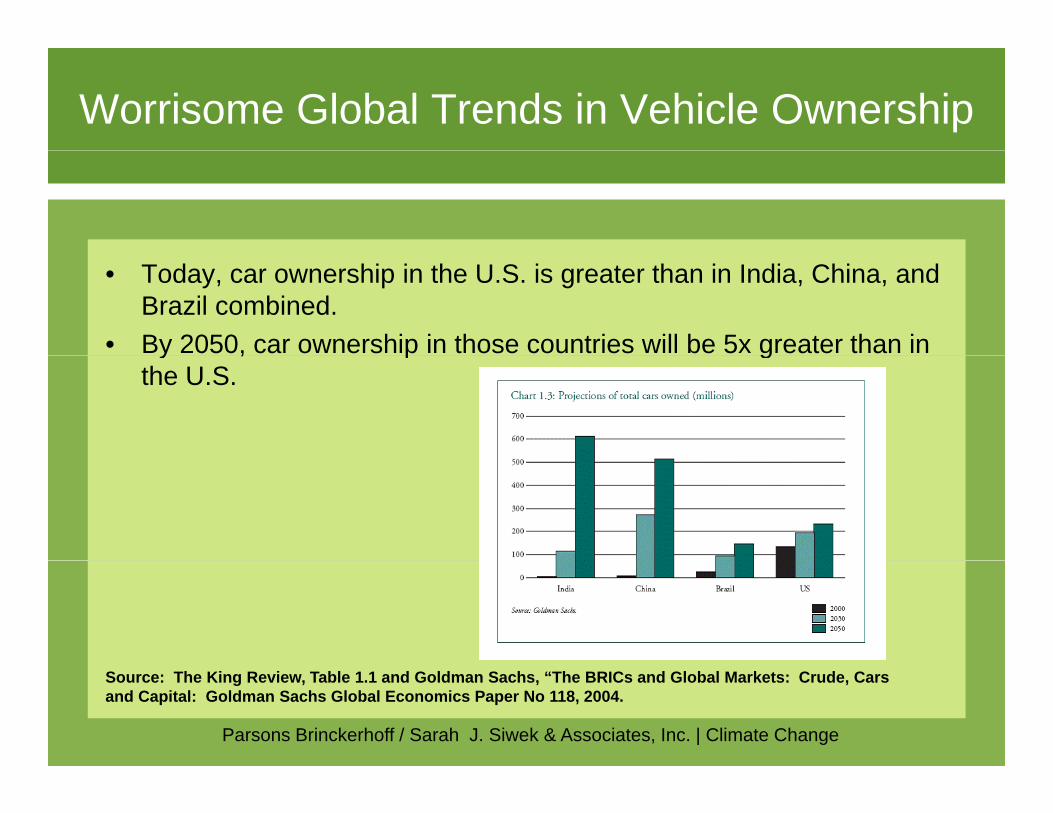
Worrisome Global Trends in Vehicle Ownership
• Today, car ownership in the U.S. is greater than in India, China, and Brazil combined.
• By 2050, car ownership in those countries will be 5x greater than in y , p gthe U.S.
Parsons Brinckerhoff / Sarah J. Siwek & Associates, Inc. | Climate Change
Source: The King Review, Table 1.1 and Goldman Sachs, “The BRICs and Global Markets: Crude, Cars and Capital: Goldman Sachs Global Economics Paper No 118, 2004.

Consider Energy Security
• Even if climate change went away energy security is a• Even if climate change went away, energy security is a growing concern
• ~$1 billion/day = U.S. payments to other countries for y p yimported oil
• Consider what $365 billion/year could do if invested in U S economy (or deficit reduction)U.S. economy (or deficit reduction) …..
• Largest transfer of wealth in human history?• 70% of U S oil consumption is from transportation70% of U.S. oil consumption is from transportation• Reducing transportation energy consumption = reduced
GHG, lower transportation costs, greater wealth retained
Parsons Brinckerhoff / Sarah J. Siwek & Associates, Inc. | Climate Change
in U.S., reduced vulnerability to hostile nations

Energy Security and Climate Change
• Most of the strategies to reduce transportation energy consumption also reduce GHG emissions:
High MPG vehicles– High MPG vehicles– Low-carbon fuels– Reduced VMT growth
Reduced congestion– Reduced congestion– Eco-driving– Energy efficient construction and maintenance practices and materials
And more– And more…..
• And they save money for budget-strapped DOTs and households
Parsons Brinckerhoff / Sarah J. Siwek & Associates, Inc. | Climate Change

Energy Costs -- Wal-Mart Perspective
“We know we need to get ready for a world in which energy will only be more expensive.”
Wal-Mart will cut 20 MMT of GHG from its supply chain by the end of 2015 — equivalent to removing >3.8 million cars from the road for a year.
W l M t i l d i i li t t k i lli “W l tWal-Mart is already requiring suppliers to cut packaging, selling “Walmart-label” CFL bulbs in Mexico, and labeling clothes as cold-water wash.
****************************************************************************************************************Should state DOTs take a page from Wal-Mart’s book?
Parsons Brinckerhoff / Sarah J. Siwek & Associates, Inc. | Climate Change

II. The Importance of Climate Change for TransportationTransportation
Parsons Brinckerhoff / Sarah J. Siwek & Associates, Inc. | Climate Change

Four Climate/Energy Issues for Transportationfor Transportation
1. Climate adaptation: Physical impacts of climate change on transportation facilities systems and operationson transportation facilities, systems and operations
2. GHG mitigation: State and federal policies calling for GHG reductions
3. Energy: Higher costs and energy volatility for agencies, households, and all levels of government
4 Transportation revenue: Declining revenue as U S4. Transportation revenue: Declining revenue as U.S. shifts to alternative energy and high MPG vehicles

What are Other State DOTs Doing on Climate Change?g
C lif i htt // d t /d /Cli t R t df• California: http://www.dot.ca.gov/docs/ClimateReport.pdf• Maryland:
http://www.mde.state.md.us/assets/document/Air/ClimateChange/AppendixC %20MDOT CLimate Action Process pdf_C_%20MDOT_CLimate_Action_Process.pdf
• Oregon: http://www.oregon.gov/ODOT/SUS/docs/EffortsOnClimateChange2008.pdf
• Vermont: http://www aot state vt us/planning/Documents/Planning/Vermont: http://www.aot.state.vt.us/planning/Documents/Planning/VTransClimateActionPlanfinal1.pdf
• Washington: http://www.wsdot.wa.gov/environment/climatechange/• New York:• New York:
http://www.nysdot.gov/nasto/repository/WS4d_Zamurs%20_AASHTO_0.ppt• Florida:
http://www.dep.state.fl.us/climatechange/files/action_plan/chap5_trans.pdf.
Parsons Brinckerhoff / Sarah J. Siwek & Associates, Inc. | Climate Change
g

VT is Among 33 States with Climate Action Plans Source: Pew Center on Climate Changeg
Parsons Brinckerhoff / Sarah J. Siwek & Associates, Inc. | Climate Change
Climate Change is a Matter of Vermont State PolicyVermont State Policy
The state of Vermont recognizes there are real environmental and economic impacts fromenvironmental and economic impacts from climate change.
Vermont has set GHG emission goals and takenVermont has set GHG emission goals and taken steps to reduce GHG
– Regional Agreements (NEGC/ECP, REGGI, TCI)– 2007 Governor’s Commission Report (available at:
http://www anr state vt us/air/Planning/htm/ccvtactions htm )http://www.anr.state.vt.us/air/Planning/htm/ccvtactions.htm )

47% of VT GHG is from TransportationTransportation

Vermont GHG Trends & Targets
Source: VT Agency of Natural Resources 2010

Sampling of State Climate Plans/Reports
State TargetY
Reduction in T t ti
Transportation Sh f ll GHGYear Transportation
GHG Share of all GHG
ReductionsVermont 2028 59% 34%New York 2020 18% 7%Connecticut 2020 N/A 7%Pennsylvania 2025 30% 8%Pennsylvania 2025 30% 8%Arizona 2020 25% 9%Minnesota 2025 27% 5%Oregon 2025 25% 8%New Mexico 2020 30% 8%Colorado 2020 22% 6%
Parsons Brinckerhoff / Sarah J. Siwek & Associates, Inc. | Climate Change
Colorado 2020 22% 6%California 2020 28% 10%
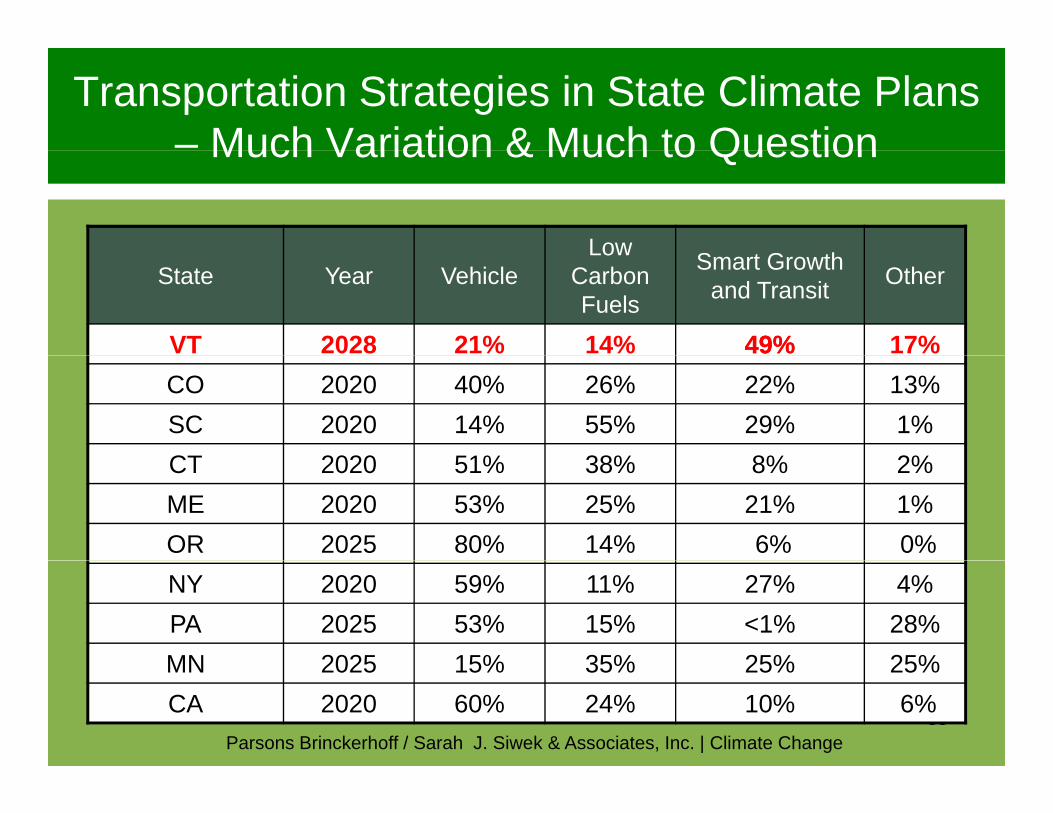
Transportation Strategies in State Climate Plans – Much Variation & Much to QuestionMuch Variation & Much to Question
Low S t G thState Year VehicleLow
Carbon Fuels
Smart Growth and Transit Other
VT 2028 21% 14% 49%49% 17%CO 2020 40% 26% 22% 13%SC 2020 14% 55% 29% 1%CT 2020 51% 38% 8% 2%CT 2020 51% 38% 8% 2%ME 2020 53% 25% 21% 1%OR 2025 80% 14% 6% 0%NY 2020 59% 11% 27% 4%PA 2025 53% 15% <1% 28%MN 2025 15% 35% 25% 25%
Parsons Brinckerhoff / Sarah J. Siwek & Associates, Inc. | Climate Change33
MN 2025 15% 35% 25% 25%CA 2020 60% 24% 10% 6%

State Climate Action Plans/Reports
Most state climate action plans/reports:• Very “aspirational”* • Managed by state environmental agencies
St i C itt h d f t t ti• Steering Committees had few or no transportation agency reps• State DOT involvement often at a technical advisory level
____________________________* For example VT strategies are expected to reduce 2030 statewide VMT from 10 5 B to 3 9 B
Parsons Brinckerhoff / Sarah J. Siwek & Associates, Inc. | Climate Change
For example, VT strategies are expected to reduce 2030 statewide VMT from 10.5 B to 3.9 B

2007 VT Climate Action Report
I d O t b 2007• Issued October 2007• 6 member Commission + 31 plenary group members• Organized around:• Organized around:
– Energy Supply & Demand– Transportation & Land Use– Agriculture Forestry & Waste ManagementAgriculture, Forestry & Waste Management
• 38 policy recommendations to meet VT targets to achieve these reductions below 1990:
• 25% by 2012• 50% by 2028• 75% by 2050, if practical
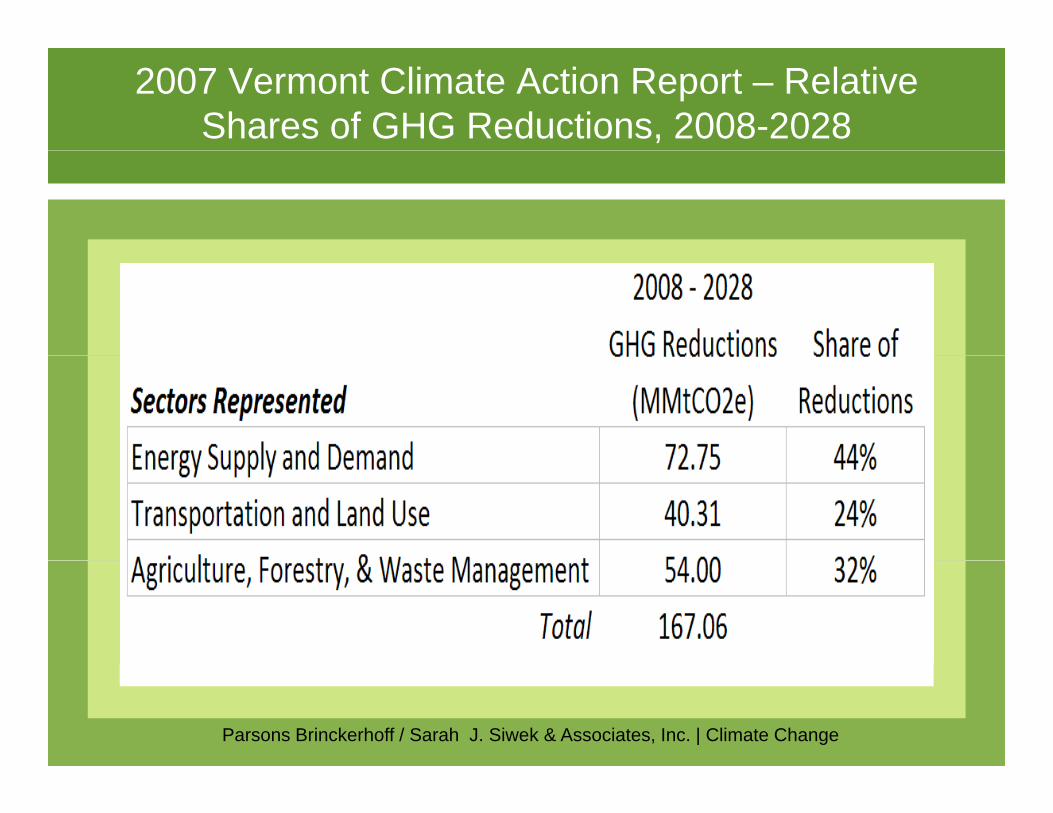
2007 Vermont Climate Action Report – Relative Shares of GHG Reductions, 2008-2028
Parsons Brinckerhoff / Sarah J. Siwek & Associates, Inc. | Climate Change

2007 VT Climate Action Report –Transportation & Land Use StrategiesTransportation & Land Use Strategies
TLU St t GHG R d ti 2028TLU Strategy GHG Reductions, 20281. Compact & Transit Oriented Development 0.99 MMT2. Alternatives to Single-Occupancy Vehicles 0.32 MMT3. Vehicle Emissions Reduction Incentives 0.63 MMT3. Vehicle Emissions Reduction Incentives 0.63 MMT4. Pay-as-You-Drive Insurance 0.32 MMT5. Alternative Fuels & Infrastructure (LCFS) 0.42 MMT6. Regional Intermodal Transportation System 0.20 MMT
-- Freight & Passenger7. Commuter Choice/Commute Benefits 0.19 MMT8. Plug-In Hybrids (part of #5 above)9 Fuel Tax Funding Mechanism (to be examined later)9. Fuel Tax Funding Mechanism (to be examined later)
TOTAL 3.07-3.64 MMT (out of 10.37 MMT reduced for all sectors)
MMT = million metric tons of CO2 equivalent
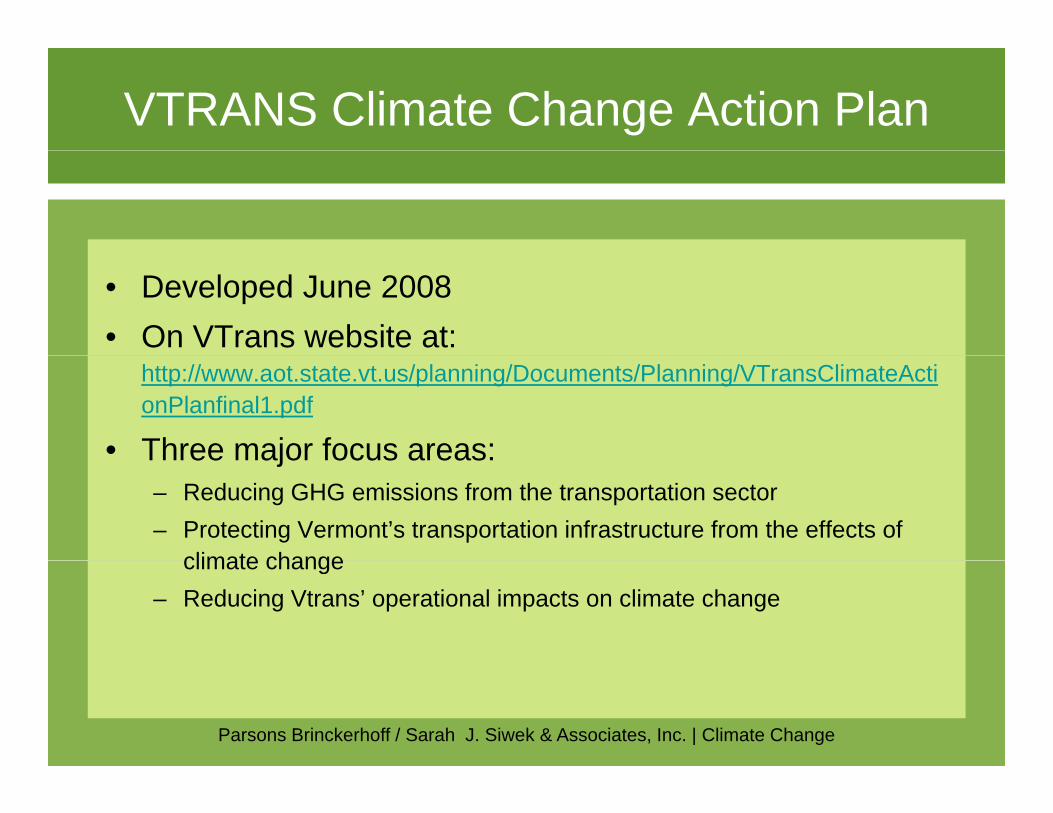
VTRANS Climate Change Action Plan
• Developed June 2008• On VTrans website at:
http://www.aot.state.vt.us/planning/Documents/Planning/VTransClimateActionPlanfinal1.pdf
• Three major focus areas:Three major focus areas:– Reducing GHG emissions from the transportation sector– Protecting Vermont’s transportation infrastructure from the effects of
climate changeclimate change– Reducing Vtrans’ operational impacts on climate change
Parsons Brinckerhoff / Sarah J. Siwek & Associates, Inc. | Climate Change
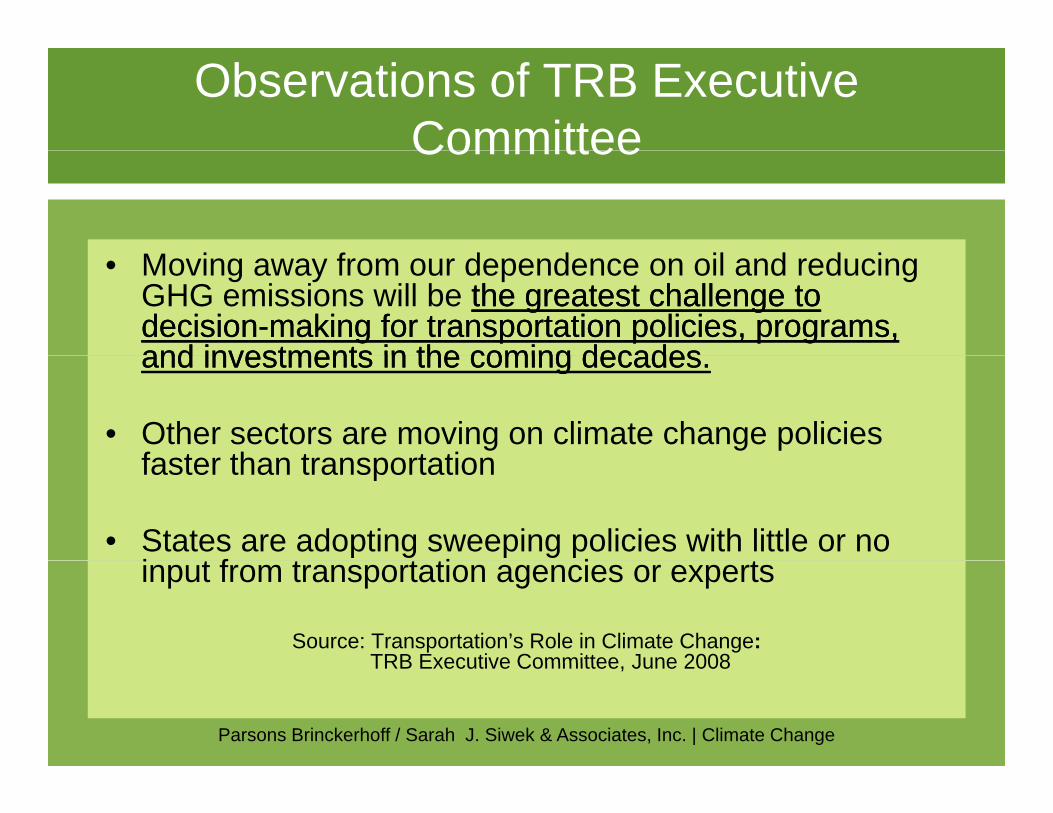
Observations of TRB Executive CommitteeCommittee
M i f d d il d d i• Moving away from our dependence on oil and reducing GHG emissions will be the greatest challenge to the greatest challenge to decisiondecision--making for transportation policies, programs, making for transportation policies, programs, and investments in the coming decadesand investments in the coming decadesand investments in the coming decades.and investments in the coming decades.
• Other sectors are moving on climate change policies faster than transportationfaster than transportation
• States are adopting sweeping policies with little or no i t f t t ti i tinput from transportation agencies or experts
Source: Transportation’s Role in Climate Change:TRB Executive Committee June 2008
Parsons Brinckerhoff / Sarah J. Siwek & Associates, Inc. | Climate Change
TRB Executive Committee, June 2008

III. Climate Adaptation for Transportation
Parsons Brinckerhoff / Sarah J. Siwek & Associates, Inc. | Climate Change

Why Transportation Agencies Should Plan for Adaptationp
I i i i– Roadway flooding– Culverts– Slope erosion
• Intense precipitation:
p– Soil stability– Maintenance needs– Bridge scour
Streambanks– Streambanks– Ditches
• Higher temperatures:– Pavement and rail
buckling– Increased maintenance– Work crew limitations
Materials choices
Parsons Brinckerhoff / Sarah J. Siwek & Associates, Inc. | Climate Change
– Materials choices– Weight limits
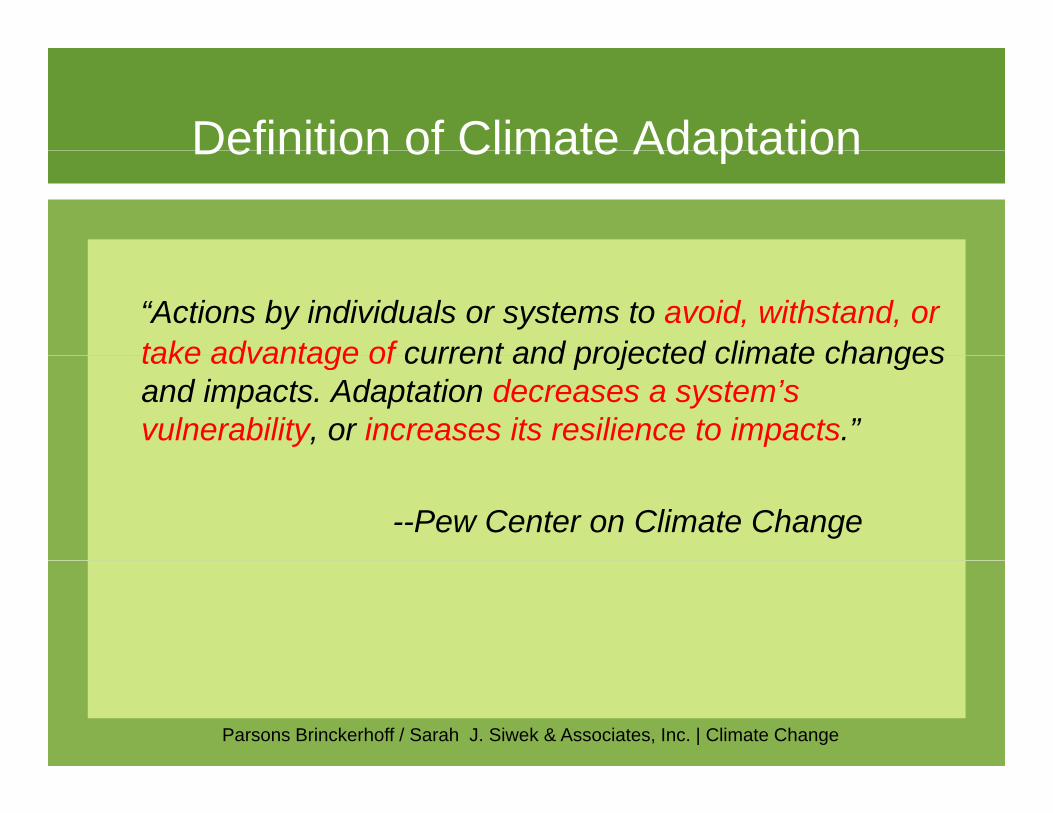
Definition of Climate AdaptationDefinition of Climate Adaptation
“Actions by individuals or systems to avoid, withstand, or take advantage of current and projected climate changestake advantage of current and projected climate changes and impacts. Adaptation decreases a system’s vulnerability, or increases its resilience to impacts.”
--Pew Center on Climate Change
Parsons Brinckerhoff / Sarah J. Siwek & Associates, Inc. | Climate Change
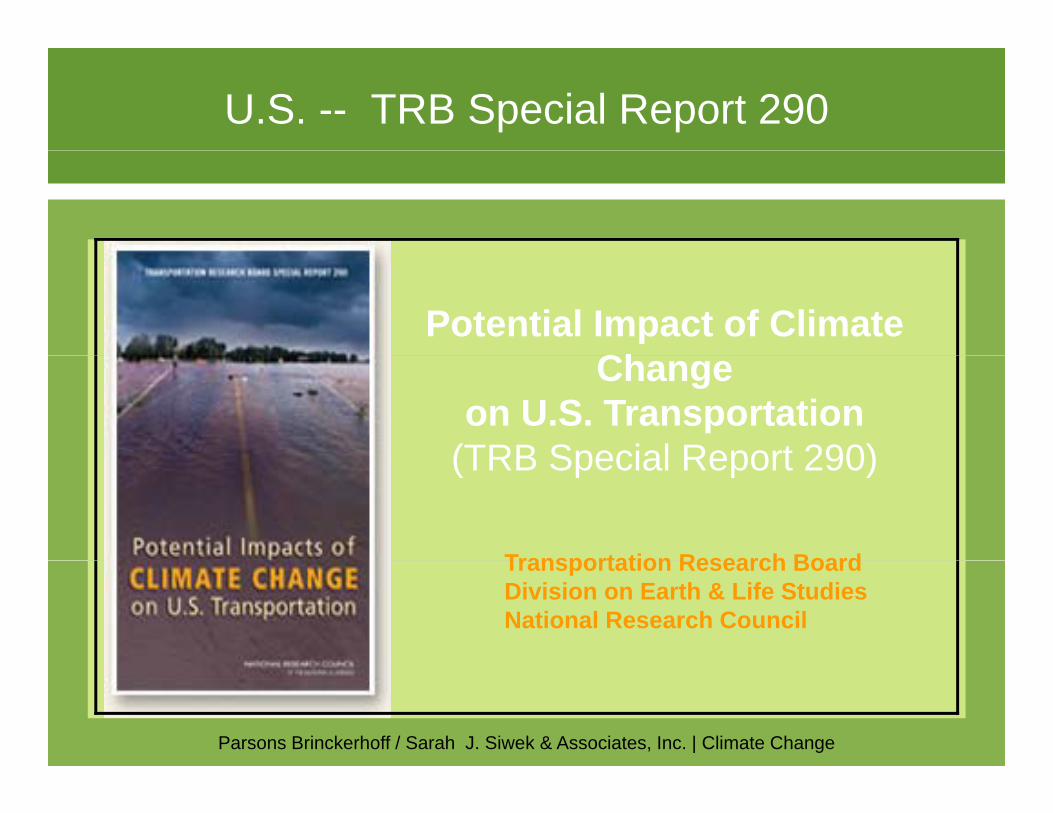
U.S. -- TRB Special Report 290
Potential Impact of Climate ChChange
on U.S. Transportation(TRB Special Report 290)(TRB Special Report 290)
Transportation Research BoardTransportation Research BoardDivision on Earth & Life StudiesNational Research Council
Parsons Brinckerhoff / Sarah J. Siwek & Associates, Inc. | Climate Change

TRB Special Report 290
Cli t h ill ff t d f• Climate change will affect every mode of transportation and every region in the United States, and the challenges to infrastructureStates, and the challenges to infrastructure providers will be new and often unfamiliar.
State and local governments and private• State and local governments and private infrastructure providers will need to incorporate adjustments for climate change into long-term j g gcapital improvement plans, facility designs, maintenance practices, operations, and emergency response plans
Parsons Brinckerhoff / Sarah J. Siwek & Associates, Inc. | Climate Change
emergency response plans.
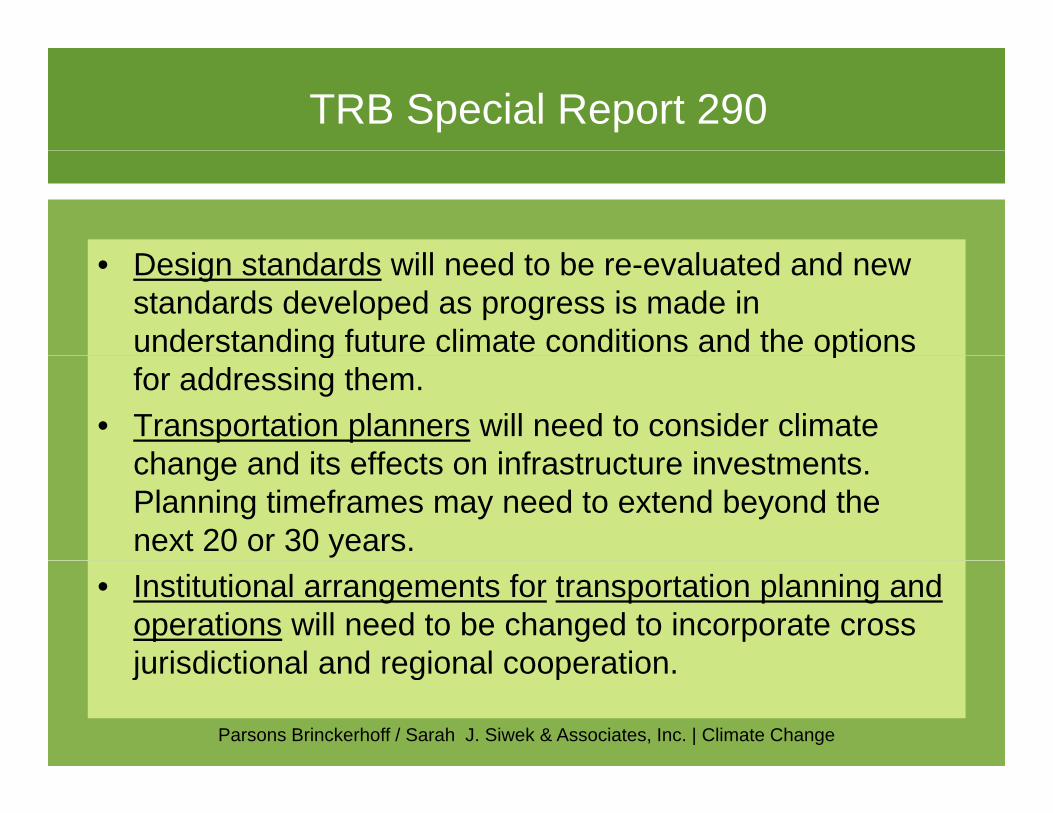
TRB Special Report 290
D i t d d ill d t b l t d d• Design standards will need to be re-evaluated and new standards developed as progress is made in understanding future climate conditions and the options g pfor addressing them.
• Transportation planners will need to consider climate change and its effects on infrastructure investmentschange and its effects on infrastructure investments. Planning timeframes may need to extend beyond the next 20 or 30 years.
• Institutional arrangements for transportation planning and operations will need to be changed to incorporate cross jurisdictional and regional cooperation
Parsons Brinckerhoff / Sarah J. Siwek & Associates, Inc. | Climate Change
jurisdictional and regional cooperation.

U.S. -- State Climate Adaptation Plans
Parsons Brinckerhoff / Sarah J. Siwek & Associates, Inc. | Climate Change

U.S. -- Recent Temperature Changes
Annual Mean Temperature Anomalies 1901-2005Annual Mean Temperature Anomalies, 1901-2005
Source: EPA

U.S. -- Recent Precipitation Changes
Annual Precipitation Trends, 1901-2005
Source: EPA

Global Climate Model Basics
Global Climate Model (GCM): a set of
t d th tcomputer codes that solve mathematical equations which qemulate the Earth’s climate system
Calculations performed at grid cell
l
Source: NOAA
scale

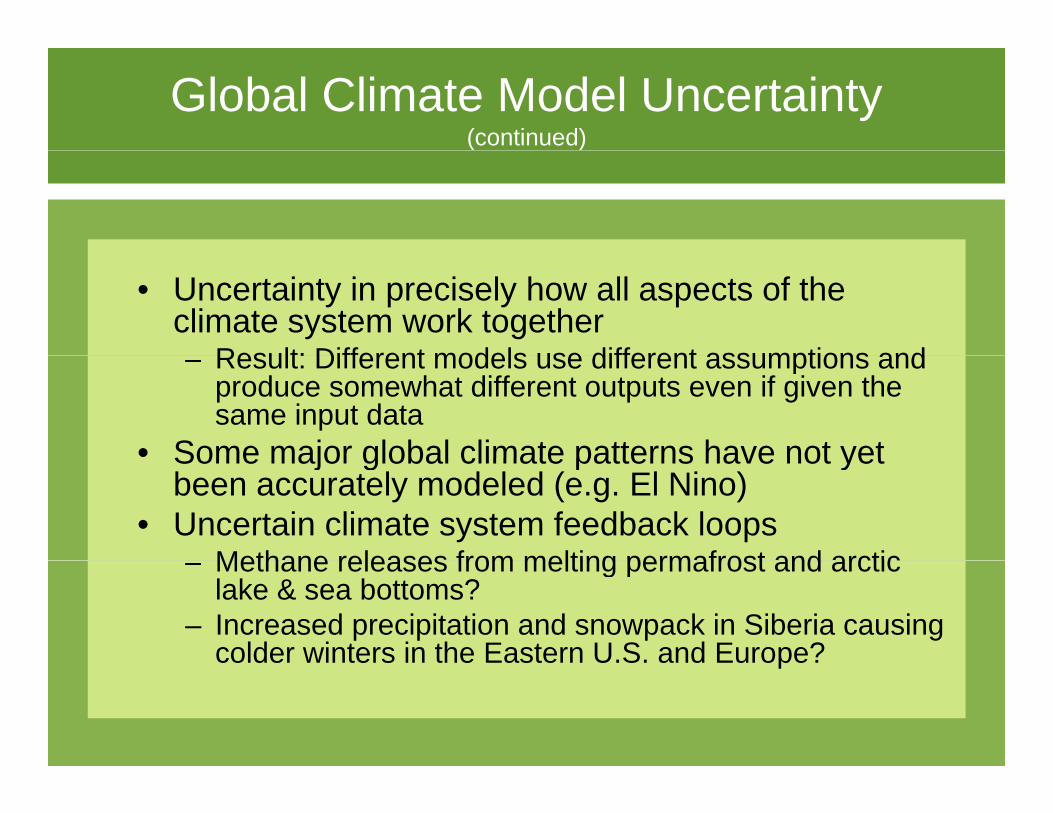
Global Climate Model Uncertainty
• Uncertainty is substantial in climate modeling and builds each step of the wayg p y
Source: Climate Change Policy, edited by Stephen H.Schneider, Armin Rosencranz, and John O. Niles.
Global Climate Model Uncertainty (continued)( )
• Uncertainty in precisely how all aspects of the climate system work together
Result: Different models use different assumptions and– Result: Different models use different assumptions and produce somewhat different outputs even if given the same input data
• Some major global climate patterns have not yetSome major global climate patterns have not yet been accurately modeled (e.g. El Nino)
• Uncertain climate system feedback loopsMethane releases from melting permafrost and arctic– Methane releases from melting permafrost and arctic lake & sea bottoms?
– Increased precipitation and snowpack in Siberia causing colder winters in the Eastern U.S. and Europe?p

2010 FHWA Climate Change Effects Report
• Provides climate projections for state DOTs– NOTE: Science is progressing, expect information to improve over
next 3-5 yearsB d l d hi h GHG i i i• Based on low and high GHG emission scenarios
• Projected changes by region:– Annual, Seasonal Temperature (change in oF)– Seasonal Precipitation (% change)– Where information exists: Sea level rise & storm activity
• Contains 9 regions (6 in continental U.S. + Alaska, Hawaii, & C ibb )Caribbean)
• NOAA, USGS, & DOE assisted FHWA• Available on FHWA climate change website
Parsons Brinckerhoff / Sarah J. Siwek & Associates, Inc. | Climate Change

New FHWA Climate Vulnerability/Risk Assessment ModelAssessment Model
• Goal: Help transportation decision makers identify assets:– most exposed to the threats from climate change; and/or – could result in the most serious consequences as a result of
those threatsthose threats
• Draft model completed in 2010• 5 pilots now underway to test model: WS NJ• 5 pilots now underway to test model: WS, NJ,
HI, VA, CA • Finalize model for wider use• Finalize model for wider use

FHWA Climate Vulnerability/Risk Assessment ModelAssessment Model
1. Develop inventory of infrastructure assets
2 Gather climate data2. Gather climate data3. Assess risk and
vulnerability of assets to yprojected climate change
4. Analyze, prioritize adaptation optionsadaptation options
5. Monitor and revisit
www.fhwa.dot.gov/hep/climate/conceptual_model62410.htm

Environmental Reviews Need to Consider Climate Impacts on ProjectConsider Climate Impacts on Project
• In NEPA process, sponsor should consider project vulnerability to future climate change US ACE i i i tl d• US ACE may raise new issues in wetland permitting due to climate impactsUSCG may raise climate impacts in bridge• USCG may raise climate impacts in bridge permitting
• DOI may raise issues & require more analysis• DOI may raise issues & require more analysis for ESA, due to uncertainty of climate impacts on species
Parsons Brinckerhoff / Sarah J. Siwek & Associates, Inc. | Climate Change
species

More Intense Storms: Potential ResponsesPotential Responses
• Changes in bridge height, foundation, and superstructure
• Larger hydraulic openings for bridges over waterways
• Changes in suspended/cable-stay bridgesChanges in suspended/cable stay bridges to withstand severe wind and turbulence
• Changes in materials specificationsCh i l t d i it d l ti• Changes in culvert design, capacity, and location
• Changes in slope design• Changes in pavement drainage systems
Parsons Brinckerhoff / Sarah J. Siwek & Associates, Inc. | Climate Change
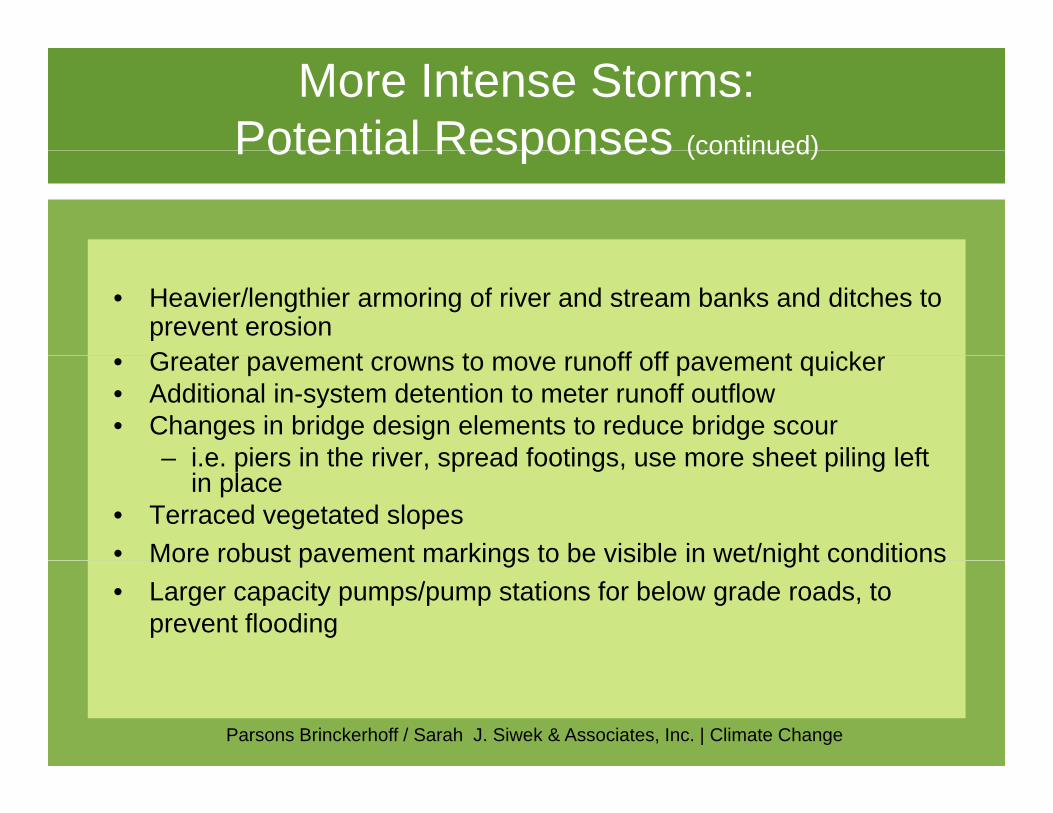
More Intense Storms: Potential Responses (continued)Potential Responses (continued)
• Heavier/lengthier armoring of river and stream banks and ditches to prevent erosionG t t t ff ff t i k• Greater pavement crowns to move runoff off pavement quicker
• Additional in-system detention to meter runoff outflow • Changes in bridge design elements to reduce bridge scour
i e piers in the river spread footings use more sheet piling left– i.e. piers in the river, spread footings, use more sheet piling left in place
• Terraced vegetated slopes • More robust pavement markings to be visible in wet/night conditionsMore robust pavement markings to be visible in wet/night conditions• Larger capacity pumps/pump stations for below grade roads, to
prevent flooding
Parsons Brinckerhoff / Sarah J. Siwek & Associates, Inc. | Climate Change

More Intense Storms: Potential Responses (continued)Potential Responses (continued)
• Stronger specifications for protection of work under construction
• Specs to require contractor response plans for work zones impacted by highintensity stormsintensity storms
• Improved Roadway Weather Information SystemsI d t l i f ti t• Improved traveler information systems to warn of outages/risks
Parsons Brinckerhoff / Sarah J. Siwek & Associates, Inc. | Climate Change

Hotter Drier Summers: Potential Responses
• More night/cooler weather work to prevent damage such as slab curling, premature cracking, loss of air entrainment in concrete pavements, rutting and flushing in asphaltin concrete pavements, rutting and flushing in asphalt pavements
• Design tougher, more resilient, lower maintenance roadways bridges facilities and roadsidesroadways, bridges, facilities and roadsides
• Design lower maintenance bridge expansion • Design seed/vegetation mixtures that create a denser,
deep-rooted vegetation mat that is more erosion resistant• Eliminate monoculture roadside vegetation designs that
may not survive extended drought periods or invasive y g pspecies attack

Hotter Drier Summers: Potential Responses (continued)Potential Responses (continued)
• Protect work in progress from effects of higher temperatures for both short term and long term durability
• Stronger specifications for Dust Control/Wind ErosionStronger specifications for Dust Control/Wind Erosion • Materials whose performance is less variable in weather extremes• Modify vegetation planting periods to ensure optimal growth and
survivalsurvival• Work crew limitations in extreme heat periods• Closer monitoring of moisture in aggregate piles
/ f• More monitoring/response for pavement rutting• More monitoring/response for rail buckling

Summary
All d f t t ti th t d• All modes of transportation threatened• Affects all transportation functions – planning,
programming environment location designprogramming, environment, location, design, construction, operations, emergency planning – and budgeting
• Low lying coastal areas especially vulnerable• Risk assessment and prioritization is key• Transportation planners need to be aware of and adapt• Transportation planners need to be aware of and adapt
to climate change impacts on our transportation infrastructure
Parsons Brinckerhoff / Sarah J. Siwek & Associates, Inc. | Climate Change
• Looming in future: where not to build or re-invest?

IV. Reducing GHG Emissions from Transportation – Strategies Planning and NEPATransportation Strategies, Planning, and NEPA
Parsons Brinckerhoff / Sarah J. Siwek & Associates, Inc. | Climate Change

CONTEXT/ALL SECTORS: McKinsey Finds Available Technologies can Reduce 3 Billion Tons GHG/Year at < $50/ton
(this is 31% of GHG economy wide in 2030)(this is 31% of GHG economy-wide in 2030)
Parsons Brinckerhoff / Sarah J. Siwek & Associates, Inc. | Climate Change
-- McKinsey & Company

What is the full array of transportation strategies to reduce GHG?strategies to reduce GHG?
Five GHG “legs”
1. Vehicle efficiency
Examples
• Higher CAFE standards 3802. Low-carbon fuels3. VMT Reductions
(including land use)
Higher CAFE standards 380 gm/mile to 250 gm/mile 2016
• CA’s low carbon fuel standard• Less travel could be in part
4. Vehicle/System Operations
5. Construction,
• Less travel, could be in part due to land use changes
• Signalization, ITS, Eco-drivingM t i l i t,
Maintenance, and Agency Operations
• Materials, maintenance practices
Parsons Brinckerhoff / Sarah J. Siwek & Associates, Inc. | Climate Change

What kinds of transportation strategies are needed? 2011 Pew Center Reportneeded? 2011 Pew Center Report
Cap and Trade
Tech Transfer
Tax Policies
Low‐Carbon Fuel Standard
L d U /VMT
System Efficiency
Vehicle Standards
City State Regional Federal International
Land Use/VMT
-- “Reducing GHG from U.S. Transportation,” by David Greene and Steve Plotkin, for the Pew Center on Global Climate Change, January 2011

How much can transportation strategies reduce GHG? 2011 Pew Center Reportreduce GHG? 2011 Pew Center Report
P t b 3 i f t t ti GHG d ti• Presents base case + 3 scenarios for transportation GHG reductions – Base case: +28% in transportation GHG, 2010-2050– Low scenario: -17% in transportation GHG, 2010-2050
Mid scenario: 35% in transportation GHG 2010 2050– Mid scenario: -35% in transportation GHG, 2010-2050– High scenario: -65% in transportation GHG, 2010-2050
• High scenario: rapid tech progress, aggressive emission standards, 80 mpg for cars transition to electric and hydrogen vehicles well80 mpg for cars, transition to electric and hydrogen vehicles well underway by 2050, auto feebates, carbon pricing, eco-driving, land use policies, congestion pricing, PATP auto insurance, automated highways in 2050 on major routes, etc.g y j ,
• GHG reductions are roughly equal from (a) vehicle efficiency; (b) low-carbon fuel; and (c) all other strategies combined.
-- “Reducing GHG from U.S. Transportation,” by David Greene and Steve Plotkin, for the Pew Center on Global Climate Change, January 2011

Washington State DOT Case Study g y
“WSDOT’s analysis suggests that implementing combinations of aggressive transportation emission reduction strategies can achieve roughly a ten percent reduction in total statewide GHG emissions g y pcompared to the 2050 baseline. Implementing many of these strategies would require changes in policy, funding, and authority, and also assumes ambitious improvements in vehicles and fuels. WSDOT did not assess the political or financial feasibility of implementing the strategies.” (highlighting added)
Source: 2011 WSDOT Sustainability reportSource: 2011 WSDOT Sustainability report
Note: 10% reduction in 2050 is for GHG from all sectors, but it is not a 10% reduction below current levels. For the on-road sector, it corresponds to about 7-31% reduction in 2050 compared to 2010 on-road GHG, using “ i t t i ”“aggressive strategies.”

Washington, D.C.- 2010 - 2030
• Reduction Goal 33 5% • Short term reductions (3 9%)• Reduction Goal 33.5%– CAFE 17.3%– Alt.Fuel 2.1%
• Short term reductions (3.9%)– Increase transit .3%– Pricing 1.5%
– TERMS* .6%– Short term 3.9%– Long-term .85%
– Operational Efficiencies 1.8%
– Reduced travel 3%g• Shortfall 8.75%
*TERMS A d i
• Long-term reductions (.85%)– Increase transit .15%
Increase bike/ped 3%• *TERMS : Access and service improvements to transit, bike/ped projects, rideshare assistance programs, telecommute programs, traffic improvements, engine technology programs
– Increase bike/ped .3%– Pricing .25%
– Reduced travel .15%p , g gy p g
Source: Washington, D.C. COG

California Climate Change Act –AB32
California GHG Emissions Reduction Measures 2020
Med/Heavy Duty Vehicle Efficiency
Cap & Trade
SB375
y yVehicle Fuel
Efficiency
Low Carbon Fuel Standard
Measures
EnergyHigh Speed Rail
Light Duty Vehicle Fuel Efficiency
Uncapped Sources
Goods Movement
Energy Efficiency
Industrial Measures
Renewable PortfolioSt d d
Million Solar Roofs
MeasuresStandard

Vehicle/Fuel Improvements Will be the Dominant Source of GHG Reductions for LDVsSource of GHG Reductions for LDVs
• 50% cut in GHG/mile is feasible from conventional technologies and biofuels by 2020-2030
• Compare these GHG rates in U S and Europe:• Compare these GHG rates in U.S. and Europe:380 grams/mile 2009 in the U.S.250 grams/mile 2016 under new Obama standard256 grams/mile 2007 actual in the E.U.256 grams/mile 2007 actual in the E.U.209 grams/mile 2012 under E.U. regulation153 grams/mile 2020 under E.U. regulation
• LDV purchase cost will rise, but fuel savings will be greater than vehicle cost increase
• Win-win-win: reduces energy use, reduces GHG, saves money
Parsons Brinckerhoff / Sarah J. Siwek & Associates, Inc. | Climate Change
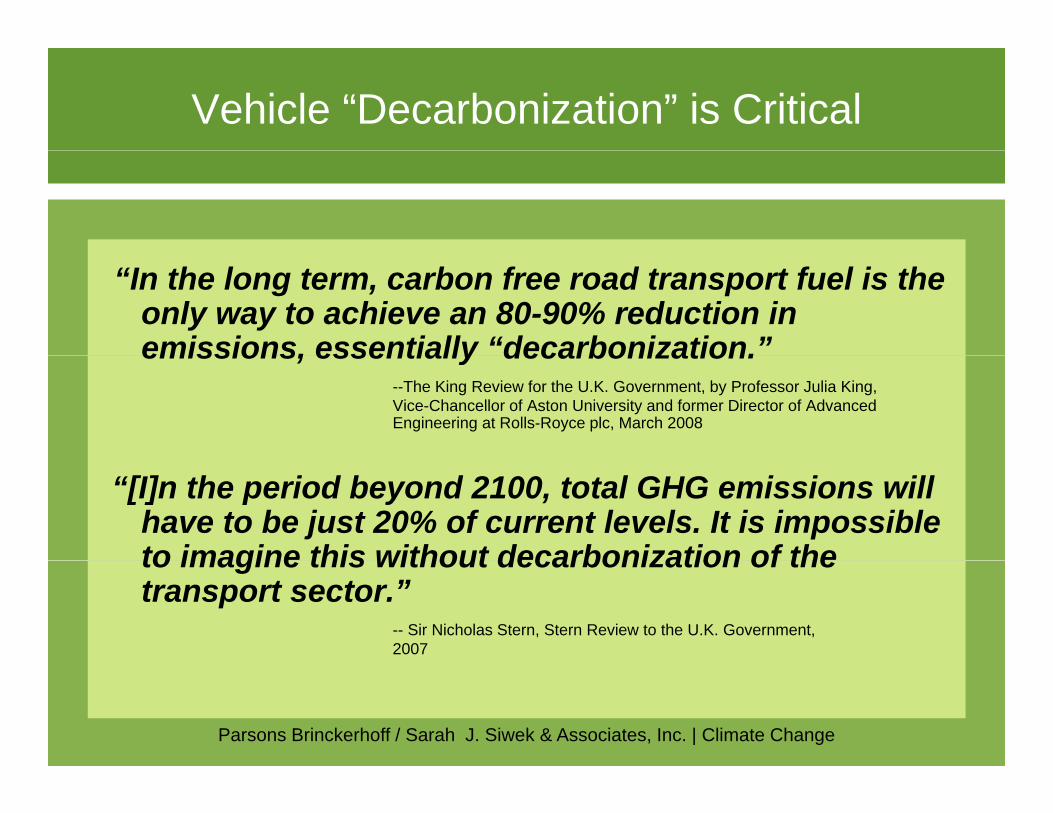
Vehicle “Decarbonization” is Critical
“In the long term, carbon free road transport fuel is the only way to achieve an 80-90% reduction in emissions, essentially “decarbonization.”emissions, essentially decarbonization.
--The King Review for the U.K. Government, by Professor Julia King, Vice-Chancellor of Aston University and former Director of Advanced Engineering at Rolls-Royce plc, March 2008
“[I]n the period beyond 2100, total GHG emissions will have to be just 20% of current levels. It is impossible to imagine this without decarbonization of theto imagine this without decarbonization of the transport sector.”
-- Sir Nicholas Stern, Stern Review to the U.K. Government,2007
Parsons Brinckerhoff / Sarah J. Siwek & Associates, Inc. | Climate Change

Vehicles: Potential Fuel Economy Increase by 2030by 2030
Parsons Brinckerhoff / Sarah J. Siwek & Associates, Inc. | Climate Change

Fuels: Low-Carbon Fuels
• Many different low-carbon fuel possibilities:– Corn ethanol - Sugar cane ethanol - Biodiesel– Cellulosic biofuel - Algae biofuels - Hydrogen
Electricity from renewable energy or nuclear power– Electricity from renewable energy or nuclear power– Electricity from utilities with carbon capture & storage
• Carbon intensity measured as GHG/unit of energy – must account for “life-l ” i icycle” emissions
• California LCFS:– Adopted in 2008Adopted in 2008– Aims to reduce carbon intensity of passenger vehicle fuels by 10% by
2020– Measures carbon-intensity on a life-cycle basis – "from field to wheel."
Parsons Brinckerhoff / Sarah J. Siwek & Associates, Inc. | Climate Change

Many Different Fuels -- Lifecycle GHG Varies
Parsons Brinckerhoff / Sarah J. Siwek & Associates, Inc. | Climate Change
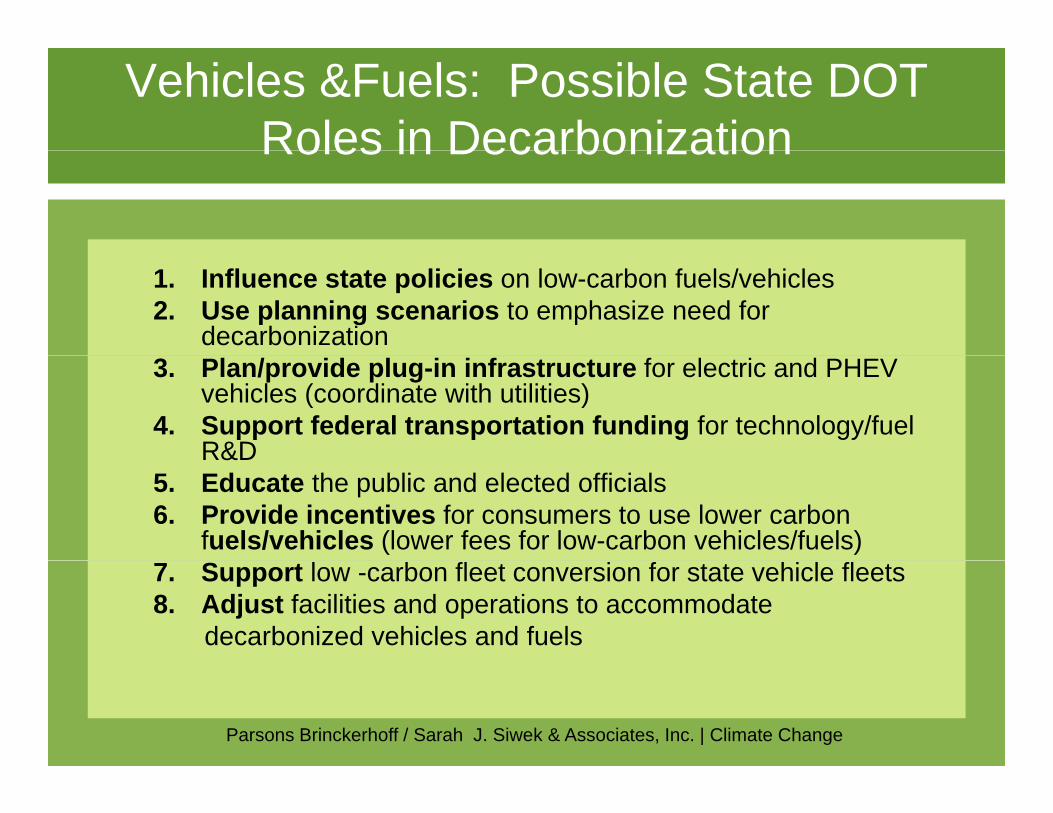
Vehicles &Fuels: Possible State DOT Roles in DecarbonizationRoles in Decarbonization
1. Influence state policies on low-carbon fuels/vehicles2. Use planning scenarios to emphasize need for
decarbonization3. Plan/provide plug-in infrastructure for electric and PHEV
vehicles (coordinate with utilities)4. Support federal transportation funding for technology/fuel
R&DR&D5. Educate the public and elected officials6. Provide incentives for consumers to use lower carbon
fuels/vehicles (lower fees for low-carbon vehicles/fuels)7. Support low -carbon fleet conversion for state vehicle fleets8. Adjust facilities and operations to accommodate
decarbonized vehicles and fuels
Parsons Brinckerhoff / Sarah J. Siwek & Associates, Inc. | Climate Change

More than Vehicles and Fuels: Achieving 74% LDV GHG Reduction by 2050 requires 100 mpgge LDV Fleet + 10%
Operational Efficiency + Lower VMT Growth (1%/year)Operational Efficiency + Lower VMT Growth (1%/year)
1600
1200
1400
1600
ons
Reducing VMT growth (smartgrowth, transit, carpooling,vanpooling, walking, TDM, andpricing-related strategies) to+1.0% annual.
System/vehicle operationalefficiency (speed limit
800
1000
1200
orta
tion
CO
2e E
mis
sio
Met
ric T
ons)
y ( preductions/enforcement,ecodriving, smoothing out trafficflow, proper tires and inflation,removing bottlenecks, etc.)
Highest LDV CO2e EmissionsReductions (79% ReductionCO2e/Vehicle Mile) by 2050
400
600
S. L
ight
Dut
y Tr
ansp
o(M
illio
n M
Light duty fleet GHG emissions
GHG Goal 70% Reduction from
0
200
5 6 7 8 9 0 2 3 4 5 6 7 8 9 0 2 3 4 5 6 7 8 9 0 2 3 4 5 6 7 8 9 0 2 3 4 5 6 7 8 9 0
U. GHG Goal 70% Reduction from
2005
Parsons Brinckerhoff / Sarah J. Siwek & Associates, Inc. | Climate Change
2005
2006
2007
2008
2009
2010
2011
2012
2013
2014
2015
2016
2017
2018
2019
2020
2021
2022
2023
2024
2025
2026
2027
2028
2029
2030
2031
2032
2033
2034
2035
2036
2037
2038
2039
2040
2041
2042
2043
2044
2045
2046
2047
2048
2049
2050

VMT: Cautionary Note
VMT is not a good metric for GHG reductions, as VMT does not take into account:
•Type of fuelyp•Fuel efficiency of vehicle•Passenger vs freight trip•Number of passengers per vehicle•As passenger fuel economy increases effectiveness of VMT•As passenger fuel economy increases, effectiveness of VMT reductions diminishes•Lessons from 1990s – marginal impacts from VMT strategies•Effect on tourism?•Effect on rural areas?
Reducing VMT is part of the strategy set – but just one element, not the end goal
Parsons Brinckerhoff / Sarah J. Siwek & Associates, Inc. | Climate Change
g

VMT: Many Strategies to Reduce VMT Growth
• Pricing - economy-wide (carbon tax or carbon cap and trade, which would raise fuel prices)
• Pricing – transportation (PAYD insurance, parking pricing, tolls, higher user fees, cordon pricing, congestion pricing, etc.)
• Carpooling and vanpooling • Bike/ped and transit • Trip chainingp g• Tele-working, tele-shopping, tele-education, tele-
medicine• Compact land use
Parsons Brinckerhoff / Sarah J. Siwek & Associates, Inc. | Climate Change
Compact land use

VMT: Consumers respond to pricing
Parsons Brinckerhoff / Sarah J. Siwek & Associates, Inc. | Climate Change

VMT: Carpooling and Vanpooling PotentialVMT: Carpooling and Vanpooling Potential
• Receives limited support and has been declining• Yet is more important than is recognized (provides 300-Yet is more important than is recognized (provides 300
400% of the PMT for work trips nationally as transit) • Low cost for government, wide availability, saves users
moneymoney• Effective in all kinds of areas – rural, small urban areas,
suburban, urban • Nearer-term payoff than most transportation strategies• Atlanta MPO and WASHCOG pay for commuters to
carpool ($3/day Atlanta, $2/day WASHCOG)
Parsons Brinckerhoff / Sarah J. Siwek & Associates, Inc. | Climate Change
p ($ y , $ y )

VMT: Carbon Intensity of Different Modes
Occupancy Lbs of GHG/PMT*Auto, SOV 1.00 0.99SUV, average 1.72 0.71, gTransit Bus, average 8.80 0.71Auto, Average 1.57 0.58Carpools, average 2.10 0.47p , gAmtrak 20.50 0.39Rail Transit, average 22.50 0.39Motorcycles, average 1.20 0.37Motorcycles, average 1.20 0.37Commuter Rail, average 31.30 0.36Vanpools, average 6.10 0.21Walking and Biking 1.00 0.00
Parsons Brinckerhoff / Sarah J. Siwek & Associates, Inc. | Climate Change
Walking and Biking 1.00 0.00* PMT = Passenger Mile Travelled – national averages, DOE data

VMT: Transit’s Potential
I i h d li b i• It is hard to generalize about transit• Transit VMT/GHG benefits are realized with highly
patronized, high-occupancy services -- a market limited t hi h l ll d l d l d idto high volume, generally densely developed corridors
• Commuter rail is 38% less carbon intensive than average auto – but bus transit is more carbon intensive than a erage a to se and less carbon intensi e thanthan average auto use and less carbon intensive than SOV (national averages; some corridors better, some worse)
• Two APTA studies: (a) Transit reduced GHG by 6 9• Two APTA studies: (a) Transit reduced GHG by 6.9 MMT* in 2005; or (b) by 37 MMT in 2005 (this is 0.3% to 1.7% of U.S. transportation GHG – and the 1.7% includes effect of transit/land use combined)
Parsons Brinckerhoff / Sarah J. Siwek & Associates, Inc. | Climate Change
includes effect of transit/land use combined)* MMT = million metric tons

VMT: Land Use Effect on GHG is Helpful but Modest
<1 to 11% * GHG reduction in 2050 on-road household GHG, for range of 3 scenarios (2009 TRB report, “Driving and the Built Environment”)
<1 to 4.4% GHG reduction in 2050 on-road GHG, for up to 90% of new development compact with high quality transit (2009 “Moving Cooler” report)(2009 Moving Cooler report)
3.5 to 5% GHG reduction for 2007-2050, cumulative, as % of transportation GHG for compact land use with verytransportation GHG, for compact land use with very aggressive assumptions (2007 “Growing Cooler” report)
Parsons Brinckerhoff / Sarah J. Siwek & Associates, Inc. | Climate Change
* TRB Panel was not in agreement on 11%. Highest reduction supported by the full TRB panel was 1.3-1.7%, in 2050

Compact Land Use + Transit + Bike + Ped + Intercity Passenger Rail + High Speed Rail + Car-Sharing +
Urban Nonmotorized Zones + Urban Parking Restraints
B dli th 9 t t i t th “A i ” l l l d t thBundling these 9 strategies at the “Aggressive” level leads to these changes in on-road GHG:
~2.7% GHG reduction cumulatively, 2005-2050
And at the “Maximum” level:~4.4% GHG reduction cumulatively, 2005-2050
What are the assumptions behind these reductions?“Maximum” level = $1.2 trillion transit expansion + $220 billion in HSR and conventional intercity rail expansion + 50% cut in all transit fares +90% of all new development is compact starting in 2005 + “complete streets” policies + bike lanes at ¼ mile intervals + 6% of CBD areas arenonmotorized by 2015 + urban parking freeze in 2015
Parsons Brinckerhoff / Sarah J. Siwek & Associates, Inc. | Climate Change
Source: Estimates based on data in Moving Cooler, 2009

Operations: Many Strategies,with 10-20% GHG Reduction Potential Overall
Potential for 10-20% LDV GHG reduction by improving traffic flow and individual driving behavior:
Managing speed (35 55 MPH is optimal)– Managing speed (35-55 MPH is optimal)– Speed limits/enforcement (could reduce fuel use 2-4%)– Eco-driving
“Active” traffic management to smooth traffic flow– Active” traffic management to smooth traffic flow – Improving signal timing (could reduce 1.315 MMT CO2/yr) – Roundabouts (multiple benefits)
R d i d t k idli– Reducing car and truck idling – Work zone management to smooth flow– Incident management
Eli i i b l k
Parsons Brinckerhoff / Sarah J. Siwek & Associates, Inc. | Climate Change
– Eliminating bottlenecks

Operations: EcoDriving
E D i d f l d CO2 b 10 15%– EcoDrivers can reduce fuel and CO2 by 10-15% through smart driving and vehicle maintenance.
– 10 years of Dutch experience found 10% GHG10 years of Dutch experience found 10% GHG reduction and extremely cost effective ($6-9.50/ton reduced)
– Pilot in Denver with 300 drivers achieved 10% fuel reduction and similar GHG reduction
– Useful for HDV MDV and LDV driversUseful for HDV, MDV, and LDV drivers– Major push in Europe as GHG strategy– Aided by dashboard displays of real-time MPG
Parsons Brinckerhoff / Sarah J. Siwek & Associates, Inc. | Climate Change
y p y

Operations: EcoDriving
• EcoDrivingUSA™ nationwide effort to increase overall vehicle• EcoDrivingUSA™ -- nationwide effort to increase overall vehicle fuel economy and preserve the environment
• Partnership of Governors, auto industry, environmental groups• Website:
– Be an EcoDriver– EcoCalculator– EcoDriving Quiz– Virtual Road Test– Is Your Community EcoDriving?– Educational Tools
N d E t– News and Events– Join the EcoDriving Movement– Link this website on your blog or site
Parsons Brinckerhoff / Sarah J. Siwek & Associates, Inc. | Climate Change
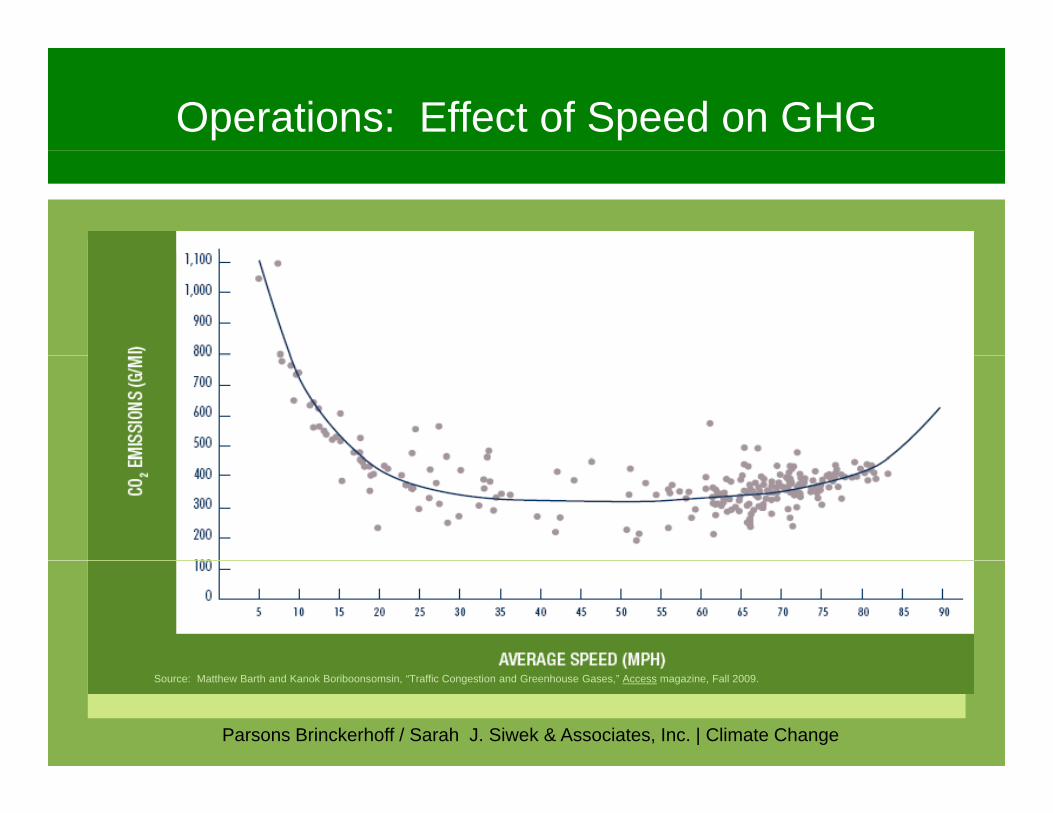
Operations: Effect of Speed on GHG
Parsons Brinckerhoff / Sarah J. Siwek & Associates, Inc. | Climate Change
Source: Matthew Barth and Kanok Boriboonsomsin, “Traffic Congestion and Greenhouse Gases,” Access magazine, Fall 2009.

Operations: Traffic Operation Strategies To Reduce CO2Reduce CO2
Parsons Brinckerhoff / Sarah J. Siwek & Associates, Inc. | Climate Change
Source: Matthew Barth and Kanok Boriboonsomsin, “Traffic Congestion and Greenhouse Gases,” Access magazine, Fall 2009.

Construction/Maintenance/Agency Operations: Strategies to Reduce GHG, Energy Use, and Costsg gy
– LED traffic lights– LED roadside lighting
Low carbon pavement– Low carbon pavement– More durable pavements – LEED buildings g– Reduced roadside mowing– Vegetation management on ROW
S l l / i d ROW– Solar panels/wind on ROW– Alt fuels and hybrid vehicles in DOT fleets– Alt fuel buses
Parsons Brinckerhoff / Sarah J. Siwek & Associates, Inc. | Climate Change
Alt fuel buses

Solar Panels for Highway Lighting –Oregon DOTg
• 594 solar panels produce 122,000 KWH/year to light interchange
• Avoids nearly 43 metric tons of GHG/year from normal electricity
• $1 28 M project in operation for over a year• $1.28 M project in operation for over a year• PPP of OR DOT, PGE, and US Bank, using state and
federal tax credits• Could be a model for other DOTs• ORDOT planning 2 additional projects
Parsons Brinckerhoff / Sarah J. Siwek & Associates, Inc. | Climate Change
• www.oregonsolarhighway.com

Washington State: West Coast Green (Electric) Highway
WA DOT i i PPP t id “Q i k Ch ”• WA DOT is using a PPP to provide “Quick Charge” stations for electric vehicles along I-5 corridor
• $1 32 million seed funding from US DOT grant$1.32 million seed funding from US DOT grant• Target completion of EV stations: 10/31/11• 9 stations along I-5 and SR-2, from OR border to g
Canadian border • Coordination with Oregon DOT and, eventually,
CaliforniaCalifornia• Pooled fund study opportunity: Strategies and Best
Practices to Support Commercialization of EV and
Parsons Brinckerhoff / Sarah J. Siwek & Associates, Inc. | Climate Change
ppInfrastructure www.westcoastgreenhighway.com

FHWA- Carbon Sequestration Pilot Program
• Two pilots: MN and NM• Assess how much carbon can be sequestered by native vegetation q y g
in the NHS right-of-way• Determine feasibility of carbon credit sales by state DOTs and
estimates of amount of revenue potential for state DOTsp• Final report available
– Estimate of NHS ROW in each stateHighway carbon sequestration estimator– Highway carbon sequestration estimator
• http://www.fhwa.dot.gov/hep/climate/carbon_sequestration/index.htm.
Parsons Brinckerhoff / Sarah J. Siwek & Associates, Inc. | Climate Change

Alternative Energy Resources for State DOTs
Mi i DOT t J 2011• Missouri DOT report, January 2011• Surveyed other state DOTs• Evaluated cost-effectiveness of various strategies• MoDOT recommended pursuing alt energy sources:
– Wastewater treatment (“baffled bio-reactors”)– LED roadway lighting (in addition to LED traffic signals)– Renewable solar/wind installations– HVAC efficiency measures– Interior building lighting (including fluorescents, reflectors, and LED lamps
High performance window systems– High performance window systems– Energy management system– Re-commissioning and continuous commissioning of buildings
Parsons Brinckerhoff / Sarah J. Siwek & Associates, Inc. | Climate Change
Source: Alternative Energy Resources for the Missouri Department of Transportation, 2011

Freight: Truck GHG is Growing Faster than Other Transportation GHGOther Transportation GHG
Parsons Brinckerhoff / Sarah J. Siwek & Associates, Inc. | Climate Change

Freight Rail Can Reduce GHG
Parsons Brinckerhoff / Sarah J. Siwek & Associates, Inc. | Climate Change

Freight: Modal GHG Comparisons Source: Texas Transportation Institute and Center for Ports and WaterwaysSource: Texas Transportation Institute and Center for Ports and Waterways
Parsons Brinckerhoff / Sarah J. Siwek & Associates, Inc. | Climate Change
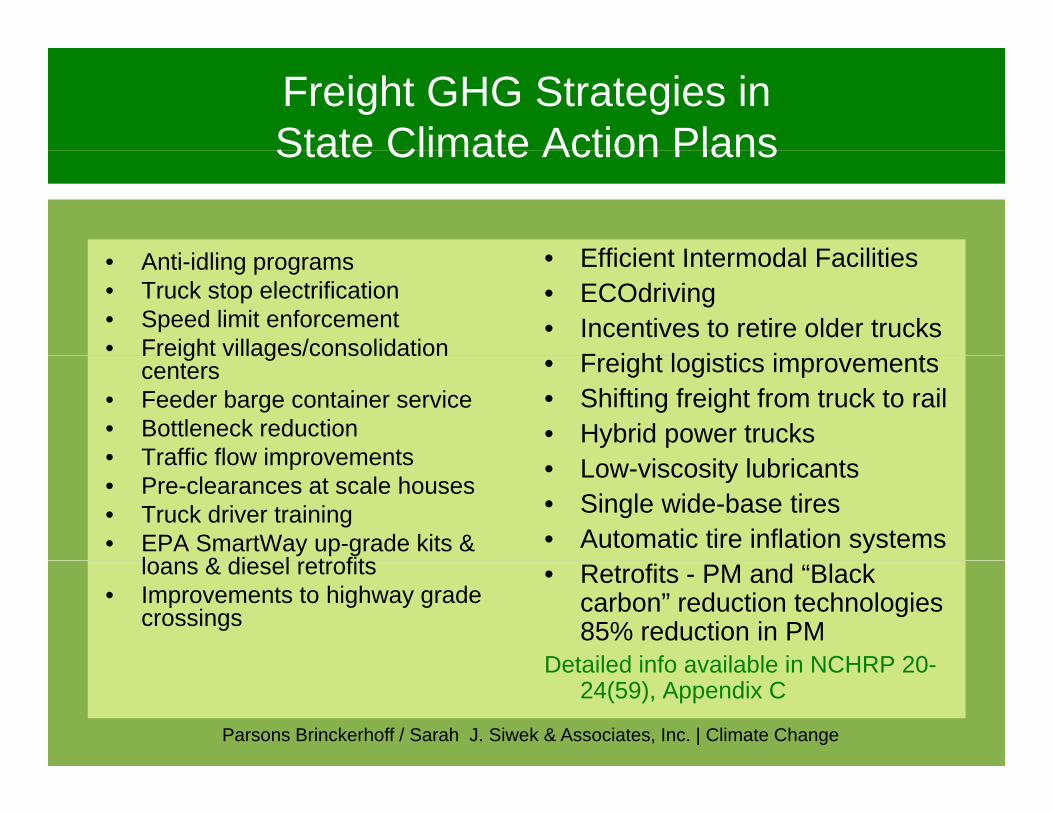
Freight GHG Strategies in State Climate Action PlansState Climate Action Plans
A i idli Efficient Intermodal Facilities• Anti-idling programs• Truck stop electrification• Speed limit enforcement• Freight villages/consolidation
• Efficient Intermodal Facilities• ECOdriving• Incentives to retire older trucks
F i ht l i ti i tFreight villages/consolidation centers
• Feeder barge container service• Bottleneck reduction • Traffic flow improvements
• Freight logistics improvements• Shifting freight from truck to rail • Hybrid power trucks
• Traffic flow improvements• Pre-clearances at scale houses• Truck driver training• EPA SmartWay up-grade kits &
l & di l t fit
• Low-viscosity lubricants• Single wide-base tires• Automatic tire inflation systems
loans & diesel retrofits• Improvements to highway grade
crossings
• Retrofits - PM and “Black carbon” reduction technologies 85% reduction in PM
Detailed info available in NCHRP 20
Parsons Brinckerhoff / Sarah J. Siwek & Associates, Inc. | Climate Change
Detailed info available in NCHRP 20-24(59), Appendix C

“Best Practices Guidebook for GHG Reductions in Freight Transportation”in Freight Transportation
• NC State University report to US DOT, 2007• Covers trucks, freight rail, marine, air freight,
pipeline• Identifies 33 “best practices” for reducing truck
G G ( f f )GHG (plus 26 for other freight modes)• All 33 could reduce truck GHG in 2025 by 12%
b l 2003 ( d t 67% i i t kbelow 2003 (compared to 67% increase in truck GHG if best practices are not implemented)
Parsons Brinckerhoff / Sarah J. Siwek & Associates, Inc. | Climate Change

Freight: GHG, Diesel and Black Carbon
• Black carbon is a major contributor to climate change, diesel engines a primary source of BCBlack carbon particles absorb sunlight generate heat in• Black carbon particles absorb sunlight, generate heat in the atmosphere, warms the air
• Every gallon of diesel emits 22 pounds of CO2• CO2 has long atmospheric lifetime; black carbon
remains in atmosphere only a few weeks– Reducing black carbon provides immediateReducing black carbon provides immediate
reduction in the rate of warming along with public health benefits
Parsons Brinckerhoff / Sarah J. Siwek & Associates, Inc. | Climate Change

Freight: Diesel Retrofits Reduce PM and Black CarbonPM and Black Carbon
• Diesel truck retrofits reduce PM 99% (= 2007 EPA standards) and also reduce black carbonstandards) and also reduce black carbon
• Locomotive retrofits reduce PM and black carbon; achieve over 76% PM and 25% fuel efficiencyCost effecti e a to red ce emissions and sa e• Cost-effective way to reduce emissions and save energy immediately
• Retrofits of construction equipment, state fleets and locomotives could be promising as state DOTs work to reduce emissions to meet air quality requirements
Parsons Brinckerhoff / Sarah J. Siwek & Associates, Inc. | Climate Change
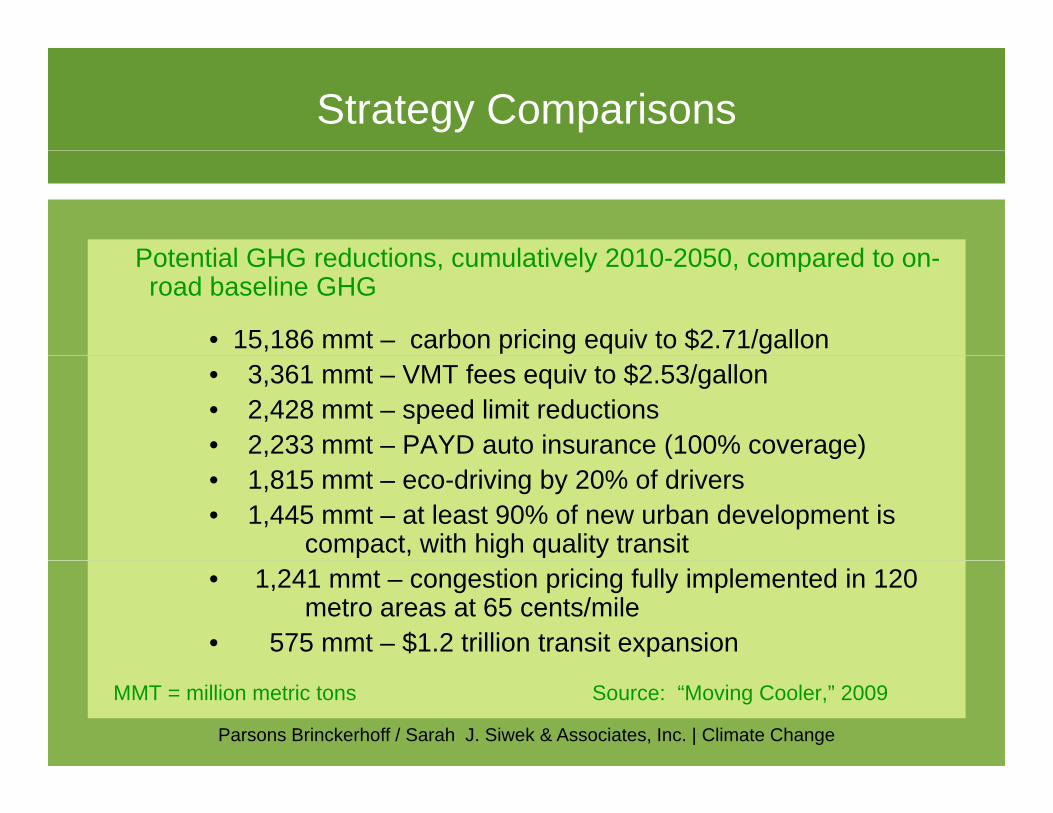
Strategy Comparisons
Potential GHG red ctions c m lati el 2010 2050 compared to onPotential GHG reductions, cumulatively 2010-2050, compared to on-road baseline GHG
• 15,186 mmt – carbon pricing equiv to $2.71/gallon • 3,361 mmt – VMT fees equiv to $2.53/gallon• 2,428 mmt – speed limit reductions• 2,233 mmt – PAYD auto insurance (100% coverage)( g )• 1,815 mmt – eco-driving by 20% of drivers• 1,445 mmt – at least 90% of new urban development is
compact, with high quality transit• 1,241 mmt – congestion pricing fully implemented in 120
metro areas at 65 cents/mile• 575 mmt – $1.2 trillion transit expansion
Parsons Brinckerhoff / Sarah J. Siwek & Associates, Inc. | Climate Change
MMT = million metric tons Source: “Moving Cooler,” 2009

Strategy Bundling
“M i ” t t b dl d l ti d GHG“Maximum” strategy bundle can reduce cumulative on-road GHG by 16% over 40 years, compared to on-road baseline:
• Tolls imposed in 2010 at 5 cents/mile on national Interstate system• Congestion pricing at 65 cents/mile in 120 metro areasg p g• $400 permit fee to park on neighborhood streets• $1.2 trillion transit expansion• Bike lanes every 1/4 mile• New and increased parking fees• New and increased parking fees • 90% of new urban development is compact, in dense Census tracts, with
high quality transit• Heavier and longer trucks allowed (up to 139,000 lbs)
Ei ht f i ht t t i• Eight more freight strategies• Eco-driving by 20% of drivers• Speed limit reductions• Top 200 bottlenecks improved to LOS
Parsons Brinckerhoff / Sarah J. Siwek & Associates, Inc. | Climate Change
p pSource: “Moving Cooler,” 2009
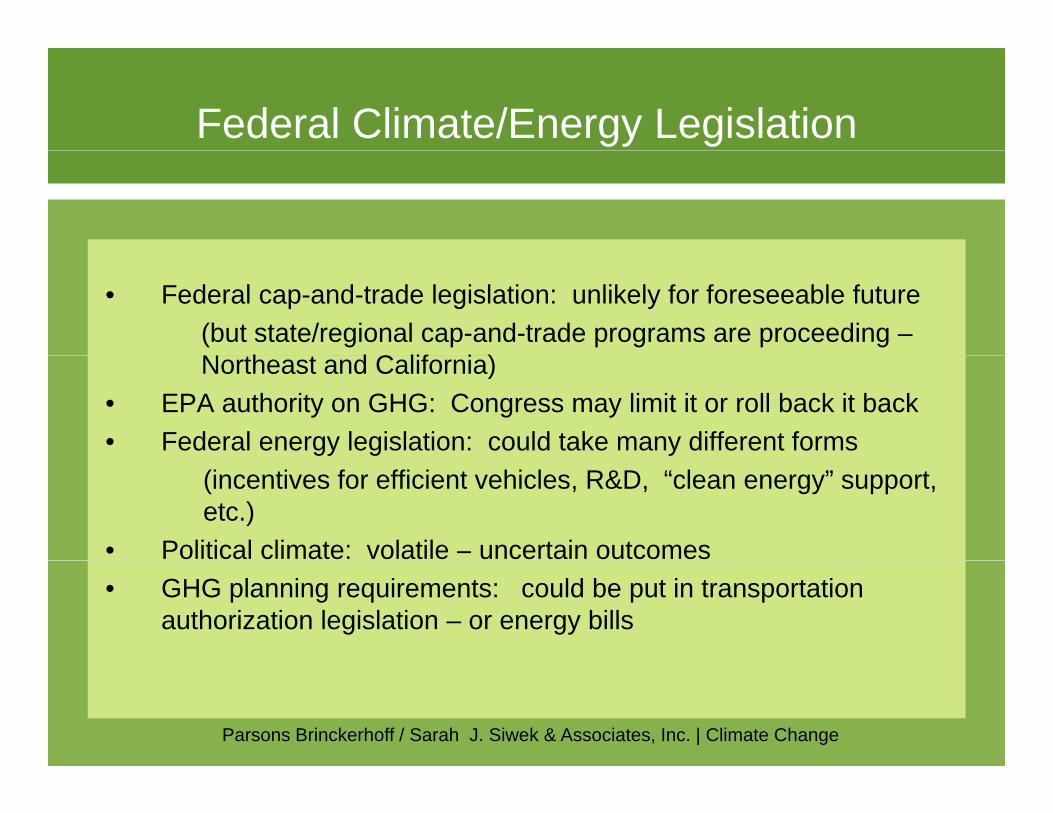
Federal Climate/Energy Legislation
• Federal cap-and-trade legislation: unlikely for foreseeable future(but state/regional cap-and-trade programs are proceeding –N th t d C lif i )Northeast and California)
• EPA authority on GHG: Congress may limit it or roll back it back• Federal energy legislation: could take many different forms
(incentives for efficient vehicles, R&D, “clean energy” support, etc.)
• Political climate: volatile – uncertain outcomes• GHG planning requirements: could be put in transportation
authorization legislation – or energy bills
Parsons Brinckerhoff / Sarah J. Siwek & Associates, Inc. | Climate Change

Existing Law: Clean Air Act – EPA GHG Endangerment FindingGHG Endangerment Finding
• EPA can regulate GHG under existing Clean Air Act (CAA)• December 2009 EPA finding:
– Atmospheric concentrations of GHG “endanger” public health p g pand welfare (per CAA section 202(a))
– Emissions of GHG from new motor vehicles “contribute to” air pollution which is endangering public health and welfarep g g p
• Based on this finding EPA is obligated to regulate GHG (e.g., GHG standards for autos)
• Based on this GHG conformity is possible but very unlikelyBased on this, GHG conformity is possible, but very unlikely• Endangerment finding challenged in court by several states• Congress may limit/roll back EPA authority over GHG
Parsons Brinckerhoff / Sarah J. Siwek & Associates, Inc. | Climate Change

Federal Legislation: Proposed Transportation Planning Provisionsp g
S l bill t i th i i hi h ld b dd d tSeveral bills contain these provisions – which could be added to authorization legislation or energy bills:
• TARGETS AND STRATEGIES: States and TMA MPOs must develop GHG reduction targets and strategies as part of transportation plansGHG reduction targets and strategies, as part of transportation plans
• PROGRESS: States and TMA MPOs must “demonstrate progress in stabilizing and reducing” GHG emissions
• METHODOLOGIES: EPA must issue regulations on transportation GHG g pgoals, standardized models, methodologies, and data collection
• CERTIFICATION: US DOT shall not certify state or MPO plans that fail to “develop, submit or publish emission reduction targets and strategies”
• PERFORMANCE REQUIREMENTS: US DOT must establish requirements, including performance measures, “to ensure that transportation plans… sufficiently meet the requirements.., including achieving progress towards national transportation-related GHG emissions
Parsons Brinckerhoff / Sarah J. Siwek & Associates, Inc. | Climate Change
achieving progress towards national transportation-related GHG emissions reduction goals.”

How should climate change be considered in NEPA ?
U d NEPA’ b d EIS /EA l d• Under NEPA’s broad scope, some EISs/EAs are already considering climate change
• Litigation history is building• CEQ issued draft guidance on February 18, 2010• Comments were due: May 24, 2010• Proposal: p
1. Evaluate proposed actions that are reasonably expected to cause direct emissions of 25,000 metric tons or more of CO2-equivalent on an annual basis, and, q , ,
2. Consider impact of climate change on the project (e.g., effect of rising sea level on coastal bridges)
• FHWA and AASHTO each provided extensive comments
Parsons Brinckerhoff / Sarah J. Siwek & Associates, Inc. | Climate Change
FHWA and AASHTO each provided extensive comments

CEQ Proposal: Consider GHG on a Project Levelj
1. Cumulative emissions over life of project*2. Construction-related emissions3 Emissions from vehicles using the highway3. Emissions from vehicles using the highway4. Up-stream emissions from fueling cycle (drilling,
refining, shipping, etc.) and vehicle cycle?5. Emissions effects of land use changes?6. Emissions from roadway maintenance, lighting, etc.? 7 Others?7. Others?_________________* 25,000 tons GHG/year is a reference point, above which to do project GHG
analysis – but this is not a “bright line test
Parsons Brinckerhoff / Sarah J. Siwek & Associates, Inc. | Climate Change
analysis but this is not a bright line test

CEQ Proposal: Roadway GHG EmissionsCEQ Proposal: Roadway GHG Emissions
25 000 t i t / 43 000 000 VMT/ b t25,000 metric tons/year = 43,000,000 VMT/year or about 120,000 VMT/day*
• Therefore, action that would increase VMT by 120,000/day (NEW VMT) could trigger analysis, with all else being equal (e.g. speeds, congestion, fleet mix, etc.)
• This conversion is based on current average MPG; in• This conversion is based on current average MPG; in future, higher MPG vehicles would allow a higher VMT before reaching 25,000 metric tons/year
Parsons Brinckerhoff / Sarah J. Siwek & Associates, Inc. | Climate Change

CEQ: Also Consider Climate Impacts on Projectp j
• Will the project be impacted by climate change? (rising sea level, more severe precipitation, etc.)
• CEQ said: Di li t h ff t th t h ld b– Discuss climate change effects that should be considered in project development such as flooding in low lying areas, development of coastal infrastructure
– Also discuss reasonably foreseeable future conditions with no action
Parsons Brinckerhoff / Sarah J. Siwek & Associates, Inc. | Climate Change
conditions with no action

AASHTO Comments on CEQ Draft
• Planning process is the appropriate venue for developing and implementing GHG reduction strategies -- not project level-- not project level
• Project-level analysis not meaningful– Inadequate tools – Disconnect between global emissions vs project-
level analysis– Basis for 25 000 metric ton threshold?Basis for 25,000 metric ton threshold?
• Major emphasis on adaptation needed in transportation policy
Parsons Brinckerhoff / Sarah J. Siwek & Associates, Inc. | Climate Change
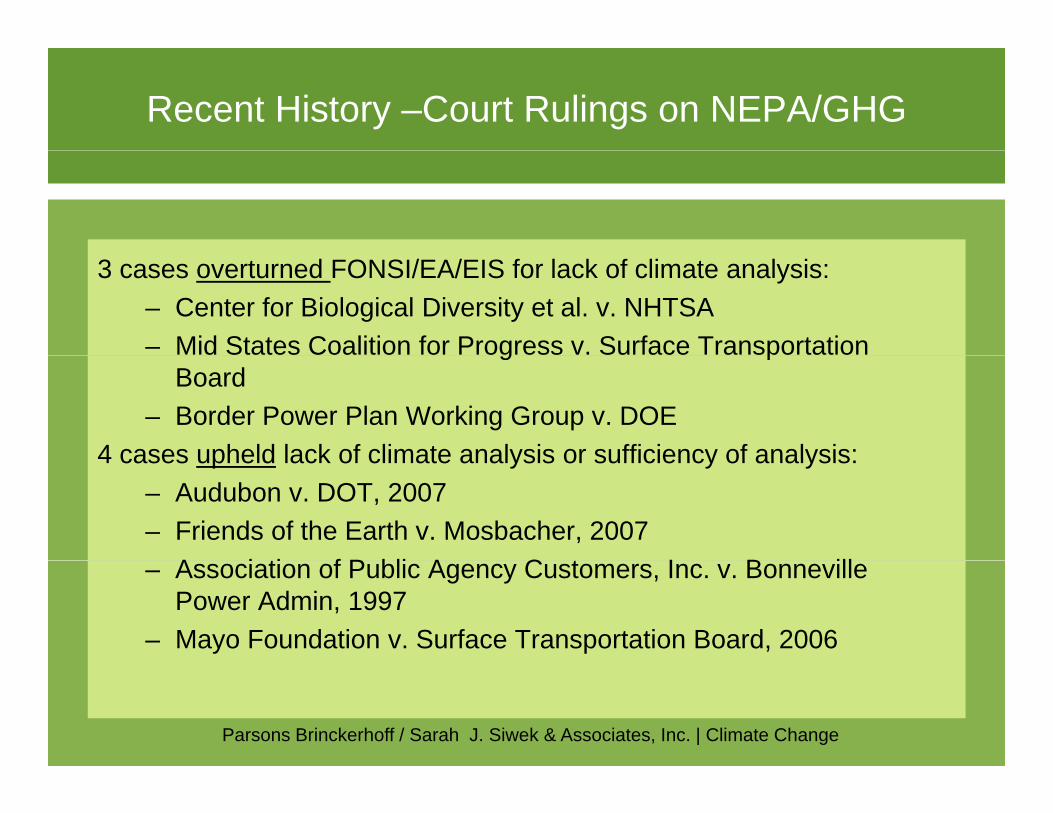
Recent History –Court Rulings on NEPA/GHG
3 cases overturned FONSI/EA/EIS for lack of climate analysis:– Center for Biological Diversity et al. v. NHTSA– Mid States Coalition for Progress v. Surface Transportation g p
Board– Border Power Plan Working Group v. DOE
4 cases upheld lack of climate analysis or sufficiency of analysis:4 cases upheld lack of climate analysis or sufficiency of analysis:– Audubon v. DOT, 2007– Friends of the Earth v. Mosbacher, 2007
A i ti f P bli A C t I B ill– Association of Public Agency Customers, Inc. v. Bonneville Power Admin, 1997
– Mayo Foundation v. Surface Transportation Board, 2006
Parsons Brinckerhoff / Sarah J. Siwek & Associates, Inc. | Climate Change
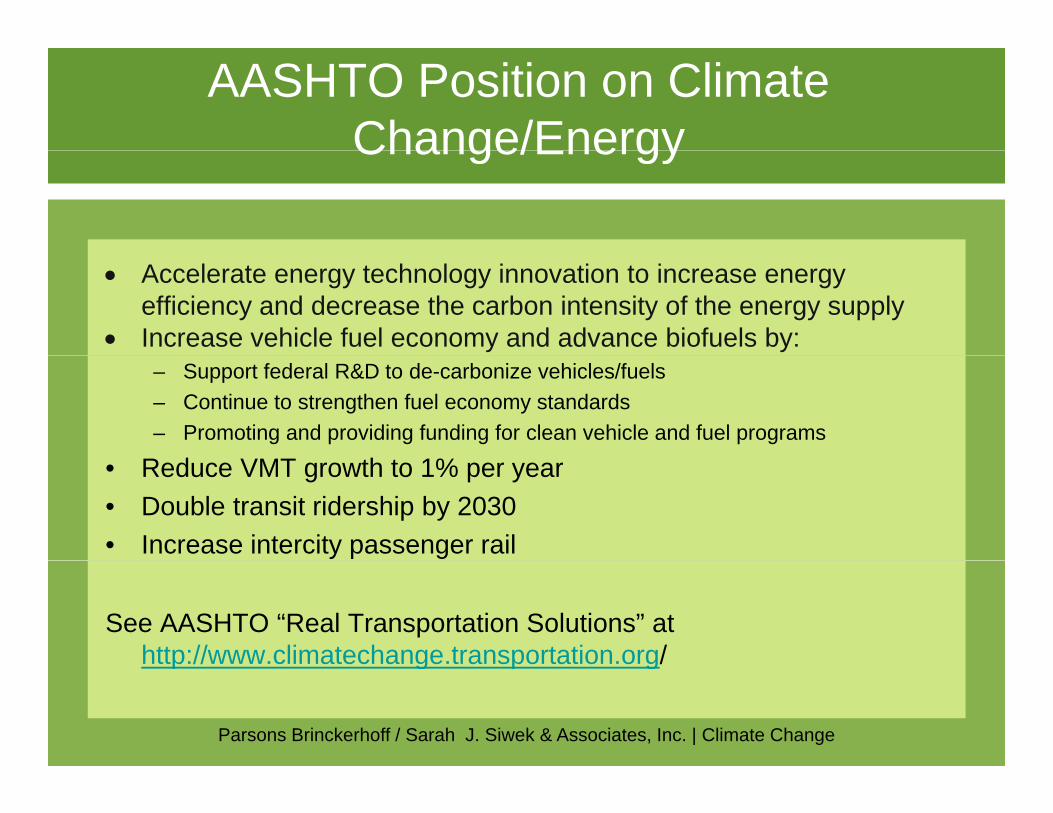
AASHTO Position on Climate Change/EnergyChange/Energy
Accelerate energy technology innovation to increase energy efficiency and decrease the carbon intensity of the energy supply
Increase vehicle fuel economy and advance biofuels by: – Support federal R&D to de-carbonize vehicles/fuels – Continue to strengthen fuel economy standards– Promoting and providing funding for clean vehicle and fuel programs
R d VMT h 1%• Reduce VMT growth to 1% per year• Double transit ridership by 2030• Increase intercity passenger rail
See AASHTO “Real Transportation Solutions” at http://www.climatechange.transportation.org/
Parsons Brinckerhoff / Sarah J. Siwek & Associates, Inc. | Climate Change
http://www.climatechange.transportation.org/

FHWA Climate Change Activities
Current activities:• Research (Gulf Coast study, VMT, GHG mitigation strategies, GHG estimation tools,
adaptation pilots)( C Q& )• Education (webinars, workshops, Clearinghouse, Q&As, peer-to-peer exchanges)
• Outreach/collaboration (NOAA, USGS, CEQ, EPA, DOE, FTA, HUD, Pew Center on Climate Change, AASHTO, AMPO, etc.)
• Technical assistance (GHG modeling, adaptation, NEPA documentation)( g, p , )• Input for CEQ guidance on NEPA/climate change• Linkages with sustainability, CSS, planning, including FHWA’s new sustainable
highways self-evaluation tool
Future activities:• Reauthorization proposal re climate change• Guidance for considering adaptation in NEPA documentsg p• Working with EPA and others on data/modeling issues
Parsons Brinckerhoff / Sarah J. Siwek & Associates, Inc. | Climate Change

FHWA Is Developing Tools for GHG EstimationGHG Estimation
F ti t l d d t ti t GHG• Forecasting tools needed to estimate GHG impacts of strategies
• Most statewide and regional travel models not• Most statewide and regional travel models not sensitive to GHG/TSM/TDM strategies
• Travel models need to link with GHG emission models
• FHWA is sponsoring carbon calculator and iti ti t t i id b kmitigation strategies guidebook
– Enhancing GreenSTEP model for this project– Developing users manual
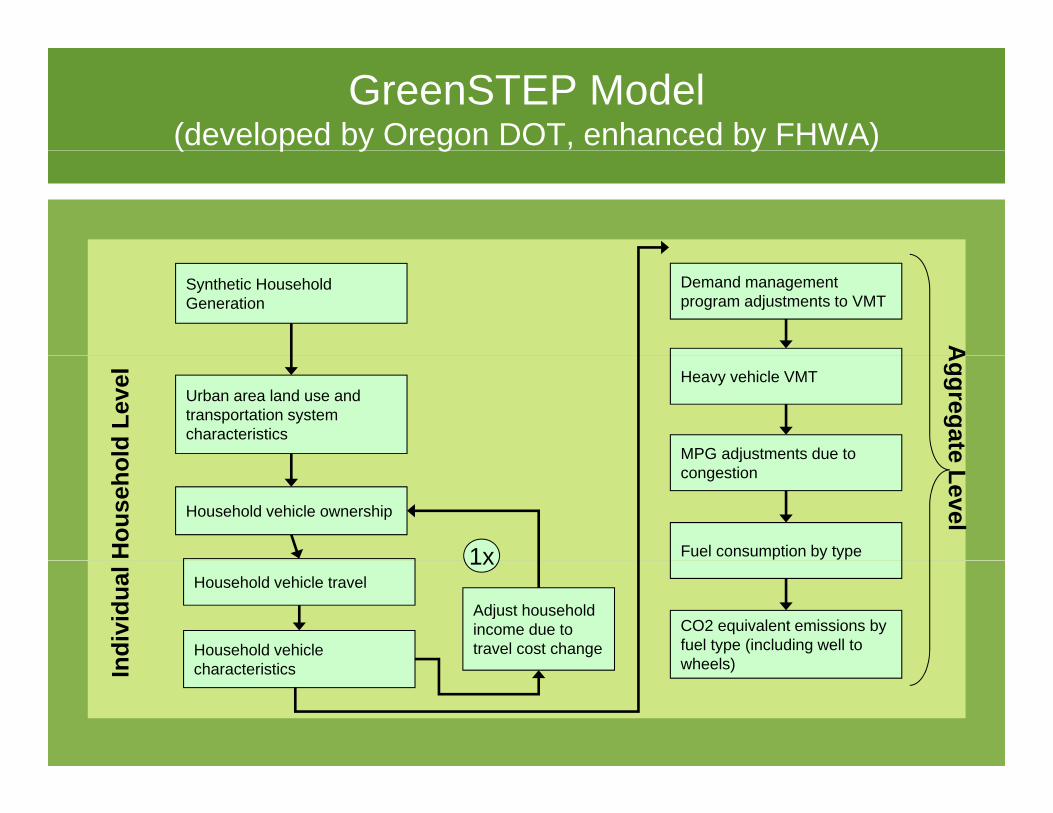
GreenSTEP Model (developed by Oregon DOT, enhanced by FHWA) ( p y g y )
Synthetic Household Generation
Demand management program adjustments to VMT
A
Urban area land use and transportation system characteristics
MPG adjustments due to
Heavy vehicle VMT
old
Leve
lA
ggregate
Household vehicle ownership
MPG adjustments due to congestion
Fuel consumption by type1xHou
seho
e Level
Household vehicle travel
Household vehicle h i i
CO2 equivalent emissions by fuel type (including well to wheels)
Adjust household income due to travel cost change
1x
ndiv
idua
l
characteristics wheels)In

GreenSTEP Inputs OutputsInputs Outputs
• Demographic changes• Urban/rural development share• Metropolitan/other densities
U b f• Urban form• Transit service• Highway capacity• Vehicle fuel efficiency and ages
• VMT
• Fuel usey g• Electric vehicles• Pricing (fuel, carbon, VMT)• Demand management• Congestion effects on MPG
• Electricity use
• CO2 equivalent emissions• Congestion effects on MPG• Carbon content of fuels• CO2 production from electrical
power use for transportation
Parsons Brinckerhoff / Sarah J. Siwek & Associates, Inc. | Climate Change

Example: Using GreenSTEP to Analyze GHG Policy Optionsy p
Used GreenSTEP to analyze:Used GreenSTEP to analyze:• Travel Demand Management• Vehicle Technology: increased vehicle MPG and more EVs• TDM and Vehicle TechnologyTDM and Vehicle Technology
Results:
TDM
Vehicle Technology
TDM and VehicleTDM and Vehicle Technology

Vermont Climate Action Plan 38 strategies that achieve the goal38 strategies that achieve the goal
Parsons Brinckerhoff / Sarah J. Siwek & Associates, Inc. | Climate Change

MPG GHG
Chittenden County GHG Analysis
T%
VM
T
Parsons Brinckerhoff / Sarah J. Siwek & Associates, Inc. | Climate Change

V. Next Steps for VTRANS and VTRANS Partner AgenciesVTRANS Partner Agencies
Parsons Brinckerhoff / Sarah J. Siwek & Associates, Inc. | Climate Change
RESOURCES
Parsons Brinckerhoff / Sarah J. Siwek & Associates, Inc. | Climate Change
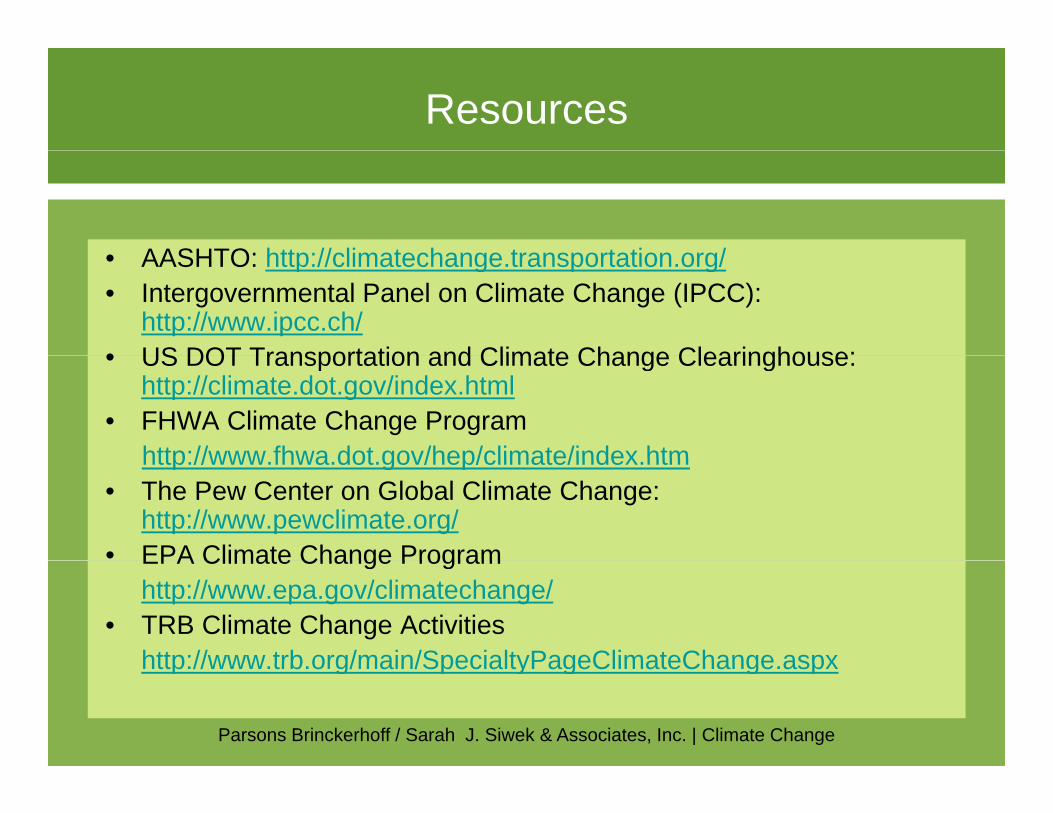
Resources
AASHTO http //climatechange transportation org/• AASHTO: http://climatechange.transportation.org/• Intergovernmental Panel on Climate Change (IPCC):
http://www.ipcc.ch/• US DOT Transportation and Climate Change Clearinghouse:• US DOT Transportation and Climate Change Clearinghouse:
http://climate.dot.gov/index.html• FHWA Climate Change Program
http://www fhwa dot gov/hep/climate/index htmhttp://www.fhwa.dot.gov/hep/climate/index.htm• The Pew Center on Global Climate Change:
http://www.pewclimate.org/• EPA Climate Change ProgramEPA Climate Change Program
http://www.epa.gov/climatechange/• TRB Climate Change Activities
http://www trb org/main/SpecialtyPageClimateChange aspx
Parsons Brinckerhoff / Sarah J. Siwek & Associates, Inc. | Climate Change
http://www.trb.org/main/SpecialtyPageClimateChange.aspx

Resources – Key Documents
• AASHTO, “Primer on Transportation and Climate Change,” 2008• NCHRP 20-24 (59), “Strategies for Reducing the Impacts of Surface
T t ti Gl b l Cli t Ch ” 2009Transportation on Global Climate Change,” 2009• European Council of Ministers of Transport, “Review of CO2
Abatement Policies for the Transport Sector,” 2006• U S DOE “Annual Energy Outlook ” 2009 (primary source of official• U.S. DOE, Annual Energy Outlook, 2009 (primary source of official
U.S. data on energy and GHG)• TRB Special Report 290: “Potential Impacts of Climate Change on
U.S. Transportation,” 2008U.S. Transportation, 2008• Pew Center on Climate Change, “Climate Change 101” and
“Reducing GHG Emissions from U.S. Transportation
Parsons Brinckerhoff / Sarah J. Siwek & Associates, Inc. | Climate Change
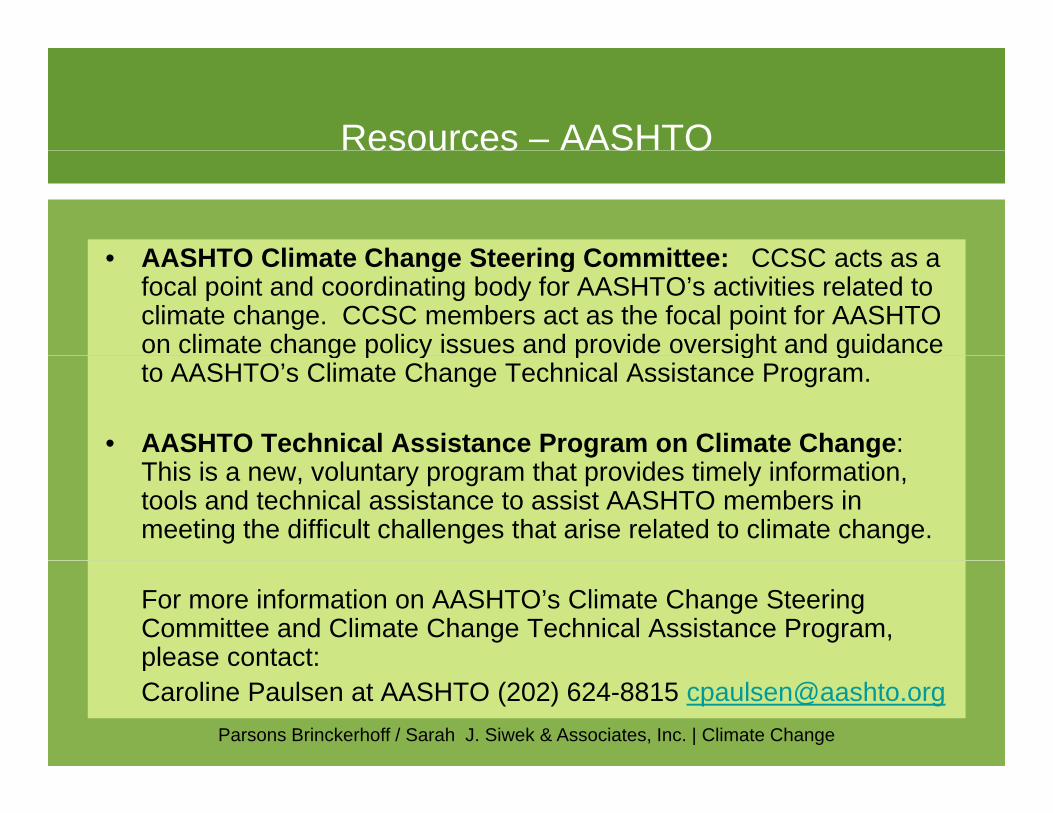
Resources – AASHTOesou ces S O
AASHTO Climate Change Steering Committee CCSC acts as a• AASHTO Climate Change Steering Committee: CCSC acts as a focal point and coordinating body for AASHTO’s activities related to climate change. CCSC members act as the focal point for AASHTO on climate change policy issues and provide oversight and guidance g p y p g gto AASHTO’s Climate Change Technical Assistance Program.
• AASHTO Technical Assistance Program on Climate Change: This is a new, voluntary program that provides timely information, tools and technical assistance to assist AASHTO members in meeting the difficult challenges that arise related to climate change.
For more information on AASHTO’s Climate Change Steering Committee and Climate Change Technical Assistance Program, please contact:
Parsons Brinckerhoff / Sarah J. Siwek & Associates, Inc. | Climate Change
please contact:Caroline Paulsen at AASHTO (202) 624-8815 [email protected]

Contact Info for Workshop Instructors
Cynthia J. Burbank Sarah SiwekParsons Brinckerhoff Sarah J. Siwek & [email protected] [email protected] 310-417-6660 x224
Stephen LaweResource Systems Group y [email protected]
Parsons Brinckerhoff / Sarah J. Siwek & Associates, Inc. | Climate Change