Embed Size (px)
Citation preview
The INL is a U.S. Department of Energy National Laboratory operated by Battelle Energy Alliance
INL/EXT-14-33529Revision 0
Climate Change Vulnerability Assessment for Idaho National Laboratory
Polly C. Buotte, Jeffrey A. Hicke, Alexander Peterson, Christopher P. Ischay, Ernest L. Fossum
October 2014
DISCLAIMER
This information was prepared as an account of work sponsored by an agency of the U.S. Government. Neither the U.S. Government nor any agency thereof, nor any of their employees, makes any warranty, expressed or implied, or assumes any legal liability or responsibility for the accuracy, completeness, or usefulness, of any information, apparatus, product, or process disclosed, or represents that its use would not infringe privately owned rights. References herein to any specific commercial product, process, or service by trade name, trade mark, manufacturer, or otherwise, does not necessarily constitute or imply its endorsement, recommendation, or favoring by the U.S. Government or any agency thereof. The views and opinions of authors expressed herein do not necessarily state or reflect those of the U.S. Government or any agency thereof.

INL/EXT-14-33529Revision 0
Climate Change Vulnerability Assessment for Idaho National Laboratory
Polly C. Buotte, Jeffrey A. Hicke, Alexander Peterson, Christopher P. Ischay, Ernest L. Fossum
October 2014
Idaho National Laboratory Sustainable INL Program Idaho Falls, Idaho 83415
http://www.inl.gov
Prepared for the U.S. Department of Energy Office of Nuclear Energy
Under DOE Idaho Operations Office Contract DE-AC07-05ID14517


v
EXECUTIVE SUMMARY
The University of Idaho (UI) was asked to participate in the development of a climate change vulnerability assessment for Idaho National Laboratory (INL). This report describes the outcome of that assessment. The climate change happening now, due in large part to human activities, is expected to continue in the future. UI and INL used a common framework for assessing vulnerability that considers exposure (future climate change), sensitivity (system or component responses to climate), impact (exposure combined with sensitivity), and adaptive capacity (capability of INL to modify operations to minimize climate change impacts) to assess vulnerability.
Analyses of climate change (exposure) revealed that warming that is ongoing at INL will continue in the coming decades, with increased warming in later decades and under scenarios of greater greenhouse gas emissions. Projections of precipitation are more uncertain, with multi-model means exhibiting somewhat wetter conditions and more wet days per year. Additional impacts relevant to INL include estimates of more burned area and increased evaporation and transpiration, leading to reduced soil moisture and plant growth.
Expected climate change will lead to impacts on multiple systems important to INL: energy supply, infrastructure and transportation, maintenance and support personnel capacity, heating, ventilation, and air conditioning (HVAC), and wildland fire response and management. Some of these key systems or components have higher adaptive capacity; therefore, some systems have medium or low vulnerability. Examples include HVAC cooling systems, which will operate longer each year given warming. However, INL has the adaptive capacity to turn on these systems earlier in the year and/or turn them off later in the year, lowering vulnerability. In contrast, some key systems or components have lower adaptive capacity; therefore, the systems have higher vulnerability. Examples include shutting down the Training Research Isotope (General Atomic) (TRIGA) reactor for more days each year as threshold temperatures are exceeded more often. It may be important to note that despite a low rating of vulnerability, adapting a system or component to significant expected impacts may be costly to INL in terms of finances, personnel, and/or time.
Climate change vulnerability assessments can be iterative and/or ongoing processes. Possible next steps for INL are to develop and incorporate cost estimates in the adaptive capacity ratings and produce a climate change risk assessment that considers both probability (as informed by this vulnerability assessment) and consequence (costs) of impacts.

vi

vii
CONTENTS
EXECUTIVE SUMMARY .......................................................................................................................... v
ACRONYMS ............................................................................................................................................... ix
1. BACKGROUND ................................................................................................................................ 1
1.1 Climate Change Vulnerability Assessments ............................................................................ 1
1.2 The Science of Climate Change ............................................................................................... 1
1.3 Climate Change Adaptation and DOE ..................................................................................... 4
2. THE CLIMATE CHANGE VULNERABILITY ASSESSMENT PROCESS .................................. 5
3. CLIMATE CHANGE AT INL ........................................................................................................... 6
3.1 Overview .................................................................................................................................. 6
3.2 Other Relevant Climate Change Information ........................................................................... 9
4. CLIMATE CHANGE SENSITIVITIES, IMPACTS, ADAPTIVE CAPACITY, AND VULNERABILITIES AT INL ......................................................................................................... 10
4.1 Energy Supply ........................................................................................................................ 10
4.2 Infrastructure and Transportation ........................................................................................... 11
4.3 Maintenance and Support Personnel ...................................................................................... 11
4.4 HVAC Systems, Cooling Towers, and Reactors.................................................................... 11
4.5 Wildland Fire ......................................................................................................................... 11
5. BASELINE TO OTHER DOE SITES AND FEDERAL AGENCIES ............................................ 12
6. REFERENCES ................................................................................................................................. 13
Appendix A INL Climate Change Vulnerability Assessment Worksheet ................................................. 15
Appendix B INL Climate Change Exposure Methodology and Additional Results .................................. 37
Appendix C Climate Change Adaptations Comparisons (prepared by INL personnel) ............................ 45

viii
FIGURES Figure 1. Multiple indicators of a changing global climate. Figure from the Intergovernmental
Panel on Climate Change Fifth Assessment Report (Stocker et al. 2013). .................................. 2
Figure 2. Observations and model simulations of changes in global average temperature. Figure from the Third US National Climate Assessment (Walsh et al. 2014). ........................................ 3
Figure 3. Time series of historical and projected global annual mean air surface temperatures anomalies relative to 1985–2005. Figure from the Intergovernmental Panel on Climate Change Fifth Assessment Report (Stocker et al. 2013). .............................................................. 3
Figure 4. The components of a vulnerability assessment. Figure from Glick et al. (2011). ........................ 5
Figure 5. Study area for the climate change (exposure) analyses. ................................................................ 6
Figure 6. Distribution of projected changes in annual and seasonal temperature for climatological periods 2020–2029, 2020–2049, and 2050–2099 from 20 global climate models. ...................... 7
Figure 7. Changes in maximum temperature threshold-days. ....................................................................... 8
Figure 8. Changes in Mean Annual and Seasonal Precipitation ................................................................... 9
Figure B-1. Projected trends in average annual temperature based on 20 general circulation models. ........................................................................................................................................ 40
Figure B-2. Projected changes in average annual temperature based on 20 general circulation models relative to the 1950–2005 climatological normal. .......................................................... 40
Figure B-3. Distribution of projected average annual, winter (DJF), spring (MAM), summer (JJA), and fall (SON) temperature for climatological periods 2020–2029, 2020–2049, and 2050–2099 from 20 global climate models. ......................................................................... 41
Figure B-4. Changes in minimum temperature threshold-days. ................................................................. 41
Figure B-5. Changes in the annual number of wet days (days experiencing 0.5 in. or greater precipitation) and the mean annual longest consecutive stretch of wet days averaged over 20 general circulation models. ............................................................................................ 42
Figure B-6. Changes in the annual number of dry days (days experiencing 0.1 in. or less precipitation) and the mean annual longest consecutive stretch of wet days averaged over 20 general circulation models. ............................................................................................ 42
Figure B-7. Projected changes in annual and seasonal heating degree days for climatological periods 2020–2029, 2020–2049, and 2050–2099 compared to the 1950–2005 climatological average. ............................................................................................................... 43
Figure B-8. Projected changes in annual and seasonal cooling degree days for climatological periods 2020–2029, 2020–2049, and 2050–2099 compared to the 1950–2005 climatological average. ............................................................................................................... 43
Figure B-9. Projected changes in annual and seasonal wind speeds for the periods 2020–2029, 2020–2049, and 2050–2099 relative to the 1950–2005 climatological normal. ......................... 44

ix
ACRONYMS
ARM Atmospheric Radiation Measurement
BNL Brookhaven National Laboratory
CCSI Climate Change Science Institute
DHS Department of Homeland Security
DOE Department of Energy
EPA Environmental Protection Agency
GCM general circulation model
GHG greenhouse gas
HVAC heating, ventilation, and air conditioning
IAEA International Atomic Energy Agency (Austria)
IES Integrated Environmental Strategies
INL Idaho National Laboratory
IPCC Intergovernmental Panel on Climate Change
JGCRI Joint Global Change Research Institute
LANL Los Alamos National Laboratory
LBNL Lawrence Berkeley National Laboratory
LLNL Lawrence Livermore National Laboratory
LDRD laboratory-directed research and development
LSS Laboratory Shift Superintendent
MACA Multivariate Adaptive Constructed Analogs\
NASA National Aeronautics and Space Administration
NREL National Renewable Energy Laboratory
OEM Office of Emergency Management
ORNL Oakridge National Laboratory
PNNL Pacific Northwest National Laboratory
PPPL Princeton Plasma Physics Laboratory
PRIMA Platform for Regional Integrated Modeling and Analysis
RCP Representative Concentration Pathway
SLAC Stanford Linear Accelerator Center
SSPP Strategic Sustainability Performance Plan
TRIGA Training Research Isotope (General Atomic)
TVA Tennessee Valley Authority
UI University of Idaho

x
1
Climate Change Vulnerability Assessment for Idaho National Laboratory
1. BACKGROUND
1.1 Climate Change Vulnerability Assessments This vulnerability assessment informs Idaho National Laboratory (INL) personnel about climate
change in several aspects. First, the process identifies systems or components at INL that are influenced by climate and may be affected by climate change. Second, the impacts of climate change on these systems or components are described, thereby informing management about potential future changes. Third, the adaptive capacity, or capability of INL to minimize negative impacts, of affected systems is identified. Although adaptive capacity may exist, such capacity may come with increased costs in terms of money, time, and/or personnel.
Also, when significant impacts are anticipated yet adaptive capacity is lower, vulnerable systems can be identified. A climate change vulnerability assessment informs management about anticipated changes and allows for additional planning to minimize effects. Multiple organizations and government agencies have recognized the need to prepare for a changing climate. The Department of Energy (DOE) conducted a climate change vulnerability assessment for the U.S. energy sector (DOE 2013); the U.S. Forest Service has conducted multiple vulnerability assessments (e.g., Halofsky et al., 2011, Raymond et al., 2013); and several guidebooks have been written to facilitate this process (e.g., Glick et al., 2011, Peterson et al., 2011, Snover et al., 2007).
1.2 The Science of Climate Change Earth is a livable planet due in part to the greenhouse effect. Solar radiation warms the earth and the
planet loses energy through emission of infrared radiation. Greenhouse gases (primarily water vapor, carbon dioxide, methane, ozone, and nitrous oxide) trap some of infrared radiation and radiate infrared radiation back to the surface, thereby warming the surface (the greenhouse effect). Without this natural greenhouse effect, Earth’s surface would be about 60°F cooler (Walsh et al., 2014). One of the primary greenhouse gases is carbon dioxide.
Atmospheric carbon dioxide concentration has varied substantially over earth’s history. Over the past 800,000 years, carbon dioxide concentrations have fluctuated between 170 and 300 parts per million. Concentrations have been increasing since the mid-1700s due to human activities, and current concentrations have exceeded 400 parts per million (Walsh et al., 2014).
As a result of increasing greenhouse gas concentrations, there has been a 1.5°F increase in average global temperature since 1880 (Walsh et al., 2014). Multiple additional indicators have been identified of a changing global climate, including increases in sea temperatures, higher sea level, and decreased Arctic sea ice (Figure 1, Stocker et al., 2013). According the Fifth Assessment Report of the Intergovernmental Panel on Climate Change (IPCC), global warming is unequivocal and unprecedented over timescales of decades to millennia (IPCC 2013).

2
Figure 1. Multiple indicators of a changing global climate. Figure from the Intergovernmental Panel on Climate Change Fifth Assessment Report (Stocker et al. 2013).
In Figure 1, each line represents an independently derived estimate of change in the climate element.
The observed changes in global temperature since 1950 can only be explained by considering changes in human-induced concentrations of greenhouse gases, not by changes in natural factors such as solar radiation or volcanic activity alone (Figure 2, Walsh et al., 2014). The latest IPCC report concludes “It is extremely likely that human influence has been the dominant cause of the observed warming since the mid-20th century,” (IPCC 2013).

3
Figure 2. Observations and model simulations of changes in global average temperature. Figure from the Third US National Climate Assessment (Walsh et al., 2014).
In Figure 2, observed changes in global average temperature are represented by the black line, global climate model simulations using only changes in natural factors (solar and volcanic) in green, and model simulations with the addition of human-induced emissions in blue (Walsh et al., 2014).
If anthropogenic sources of greenhouse gases continue to increase, as expected, global average temperatures will likely continue to rise (Figure 3, IPCC 2013). Future precipitation trends will vary across the globe, with contrasts between wet and dry regions likely to increase (IPCC 2013). Precipitation is generally expected to decline in the subtropics and increase at higher latitudes (Walsh et al., 2014). Extreme precipitation events are projected to occur two to five times as often over all regions of the United States, even those that are projected to receive less annual precipitation (Walsh et al. 2014).
Figure 3. Time series of historical and projected global annual mean air surface temperatures anomalies relative to 1985–2005. Figure from the Intergovernmental Panel on Climate Change Fifth Assessment Report (Stocker et al., 2013).
In Figure 3, solid lines are means from multiple models; bands indicate the 5–95% confidence interval from the distribution of models. Projections are computed with different scenarios for greenhouse gas emissions (RCPs 2.6, 4.5, 6.0, 8.5) and are represented by different colors.

4
1.3 Climate Change Adaptation and DOE The following text describes the DOE’s response to climate change adaptation and is taken from the
“Idaho National Laboratory FY14 Site Sustainability Plan” (INL 2013):
The Intergovernmental Panel on Climate Change defines climate adaptation as “adjustment in natural or human systems in response to actual or expected climatic stimuli or their effects, which moderates harm or exploits beneficial opportunities.” The White House Council on Environmental Quality’s Interagency Climate Change Adaptation Task Force has established a framework for conducting climate change adaptation planning, and DOE Secretary Chu adopted this framework in his Climate Adaptation Policy Statement of June 2, 2011. According to this document, the Federal Government’s core role should be to:
Promote and implement best practices for adaptation
Build greater public awareness and understanding of the importance of adaptation
Maintain dialogue and partnerships with stakeholders and decision makers
Enhance services that enable informed decisions based on the best available science
Work with the international community to improve knowledge sharing.
This report also emphasizes that the Federal Government must exercise a leadership role to address climate impacts on federal infrastructure interests and on natural, cultural, and historic resources that it has statutory responsibilities to protect; and provides eight Guiding Principles for climate adaptation. These are (i) adopt integrated approaches, (ii) prioritize the most vulnerable, (iii) use the best available science, (iv) build strong partnerships, (v) apply risk management methods and tools, (vi) apply ecosystem based approaches, (viii) maximize mutual benefits, and (viii) continuously evaluate performance.
Secretary Chu’s Policy Statement of June 2, 2011 also established a DOE Climate Change Adaptation Planning Working Group, who would draft a climate adaptation plan and integrate it into the SSPP. Secretary Chu’s policy statement also notes that climate change adaptation efforts have the potential to provide synergy with DOE’s clean energy mission, and states that DOE will explore these opportunities while planning for climate adaptation. The 2012 SSPP established three priority actions for Climate Change Adaptation for FY 2012. In brief, these actions would:
Outline a strategy to develop realistic climate scenarios, using the best available science
Gain a better understanding of DOE programmatic implications and opportunities
Use DOE’s existing emergency management, hazard assessment, risk management, and frameworks to evaluate climate change impacts at DOE sites.”
5
2. THE CLIMATE CHANGE VULNERABILITY ASSESSMENT PROCESS
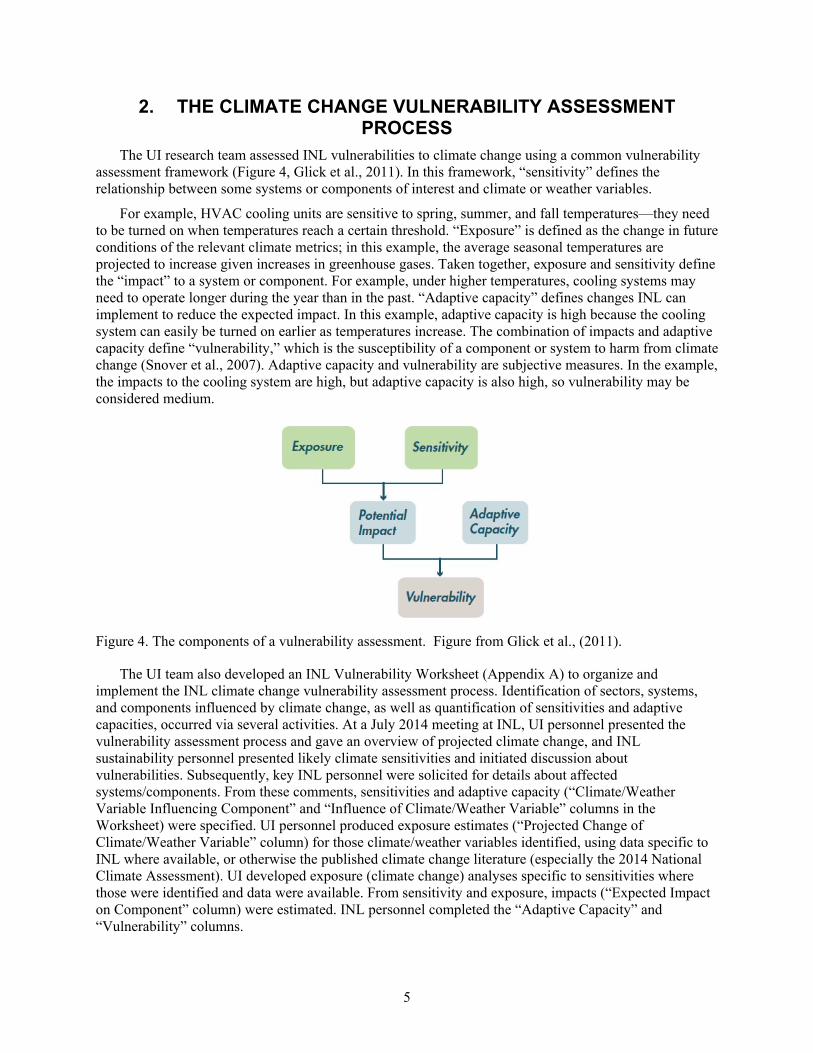
The UI research team assessed INL vulnerabilities to climate change using a common vulnerability assessment framework (Figure 4, Glick et al., 2011). In this framework, “sensitivity” defines the relationship between some systems or components of interest and climate or weather variables.
For example, HVAC cooling units are sensitive to spring, summer, and fall temperatures—they need to be turned on when temperatures reach a certain threshold. “Exposure” is defined as the change in future conditions of the relevant climate metrics; in this example, the average seasonal temperatures are projected to increase given increases in greenhouse gases. Taken together, exposure and sensitivity define the “impact” to a system or component. For example, under higher temperatures, cooling systems may need to operate longer during the year than in the past. “Adaptive capacity” defines changes INL can implement to reduce the expected impact. In this example, adaptive capacity is high because the cooling system can easily be turned on earlier as temperatures increase. The combination of impacts and adaptive capacity define “vulnerability,” which is the susceptibility of a component or system to harm from climate change (Snover et al., 2007). Adaptive capacity and vulnerability are subjective measures. In the example, the impacts to the cooling system are high, but adaptive capacity is also high, so vulnerability may be considered medium.
Figure 4. The components of a vulnerability assessment. Figure from Glick et al., (2011).
The UI team also developed an INL Vulnerability Worksheet (Appendix A) to organize and implement the INL climate change vulnerability assessment process. Identification of sectors, systems, and components influenced by climate change, as well as quantification of sensitivities and adaptive capacities, occurred via several activities. At a July 2014 meeting at INL, UI personnel presented the vulnerability assessment process and gave an overview of projected climate change, and INL sustainability personnel presented likely climate sensitivities and initiated discussion about vulnerabilities. Subsequently, key INL personnel were solicited for details about affected systems/components. From these comments, sensitivities and adaptive capacity (“Climate/Weather Variable Influencing Component” and “Influence of Climate/Weather Variable” columns in the Worksheet) were specified. UI personnel produced exposure estimates (“Projected Change of Climate/Weather Variable” column) for those climate/weather variables identified, using data specific to INL where available, or otherwise the published climate change literature (especially the 2014 National Climate Assessment). UI developed exposure (climate change) analyses specific to sensitivities where those were identified and data were available. From sensitivity and exposure, impacts (“Expected Impact on Component” column) were estimated. INL personnel completed the “Adaptive Capacity” and “Vulnerability” columns.

6
3. CLIMATE CHANGE AT INL
3.1 Overview The UI team assessed climate change (exposure in Figure 4) using various metrics of climate that
included temperature, precipitation, and wind. Downscaled climate projections were used from the Multivariate Adaptive Constructed Analogs (MACA) dataset (Abatzoglou & Brown 2012; http://maca.northwestknowledge.net/). The MACA dataset provides general circulation model (GCM) results of daily climate variables for historical (1950–2005) and future (2006–2099) periods across the conterminous United States at a 4-km spatial resolution from 20 GCMs. As noted previously, projections of warming depend on scenarios of future greenhouse gas concentrations. GCMs forced with scenarios of an intermediate Representative Concentration Pathway (RCP) of 4.5 and a high RCP of 8.5, atmospheric greenhouse gas concentration were selected. Climate projections are shown for three periods: 2020–2029, 2020–2049, and 2050-2099. The period 2020–2029 allows discussion on shorter-term projections, and the periods 2020–2049 and 2050–2099 describe longer-term projections.
The INL study area (Figure 5) encompasses the main INL research site, the city of Idaho Falls and nearby communities, and wildland fire perimeters from the past decade. The northwestern points were removed to decrease sources of error due to topographic heterogeneity between the mountains of the Lost River Range and the lower-elevation Snake River Plain.
Sensitivity to several climate metrics common to multiple systems/components emerged from the INL Vulnerability Worksheet (Appendix A), and projections of exposure of these metrics are summarized in this section. Methods for calculating these, and additional exposure metrics, are described in Appendix B.
Figure 5. Study area for the climate change (exposure) analyses.
7
Summer temperatures, storm severity and frequency, and drought conditions are likely to have the greatest impact on systems and components at INL. The INL Site is projected to be warmer in all seasons, and experience little change in annual precipitation but an increased frequency of wet days. Heavy precipitation events are likely to occur more often. Projections of temperature trends are more certain (more consistency among models) than projections of precipitation trends.
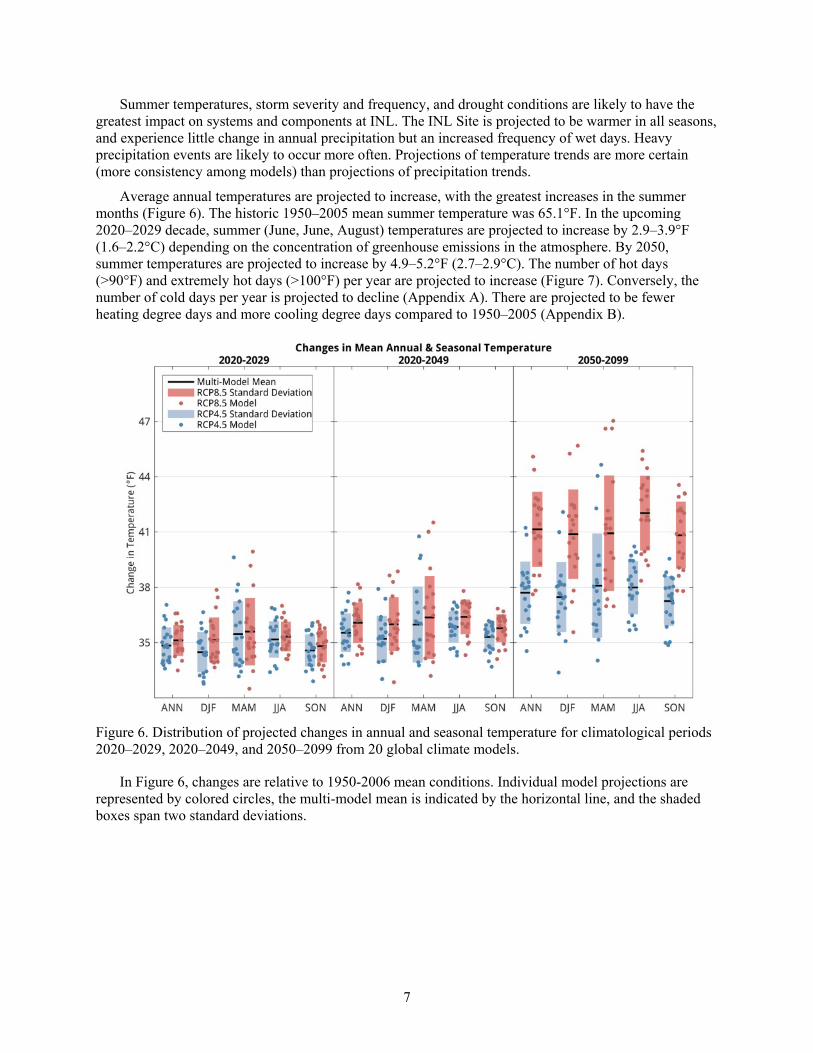
Average annual temperatures are projected to increase, with the greatest increases in the summer months (Figure 6). The historic 1950–2005 mean summer temperature was 65.1°F. In the upcoming 2020–2029 decade, summer (June, June, August) temperatures are projected to increase by 2.9–3.9°F (1.6–2.2°C) depending on the concentration of greenhouse emissions in the atmosphere. By 2050, summer temperatures are projected to increase by 4.9–5.2°F (2.7–2.9°C). The number of hot days (>90°F) and extremely hot days (>100°F) per year are projected to increase (Figure 7). Conversely, the number of cold days per year is projected to decline (Appendix A). There are projected to be fewer heating degree days and more cooling degree days compared to 1950–2005 (Appendix B).
Figure 6. Distribution of projected changes in annual and seasonal temperature for climatological periods 2020–2029, 2020–2049, and 2050–2099 from 20 global climate models.
In Figure 6, changes are relative to 1950-2006 mean conditions. Individual model projections are represented by colored circles, the multi-model mean is indicated by the horizontal line, and the shaded boxes span two standard deviations.

8
Figure 7. Changes in maximum temperature threshold-days.
In Figure 7, projected changes under RCP 4.5 (moderate future emissions scenario) are in blue, changes under RCP 8.5 (high future emissions scenario) are in red, and historical changes are in gray. Changes are relative to 1950–2005 means. The left column shows changes in days per year and the right column shows changes in consecutive days per year. The top row shows these changes for hot days, defined as a threshold of 90°F, and the bottom row shows changes for extremely hot days with a threshold of 100°F.
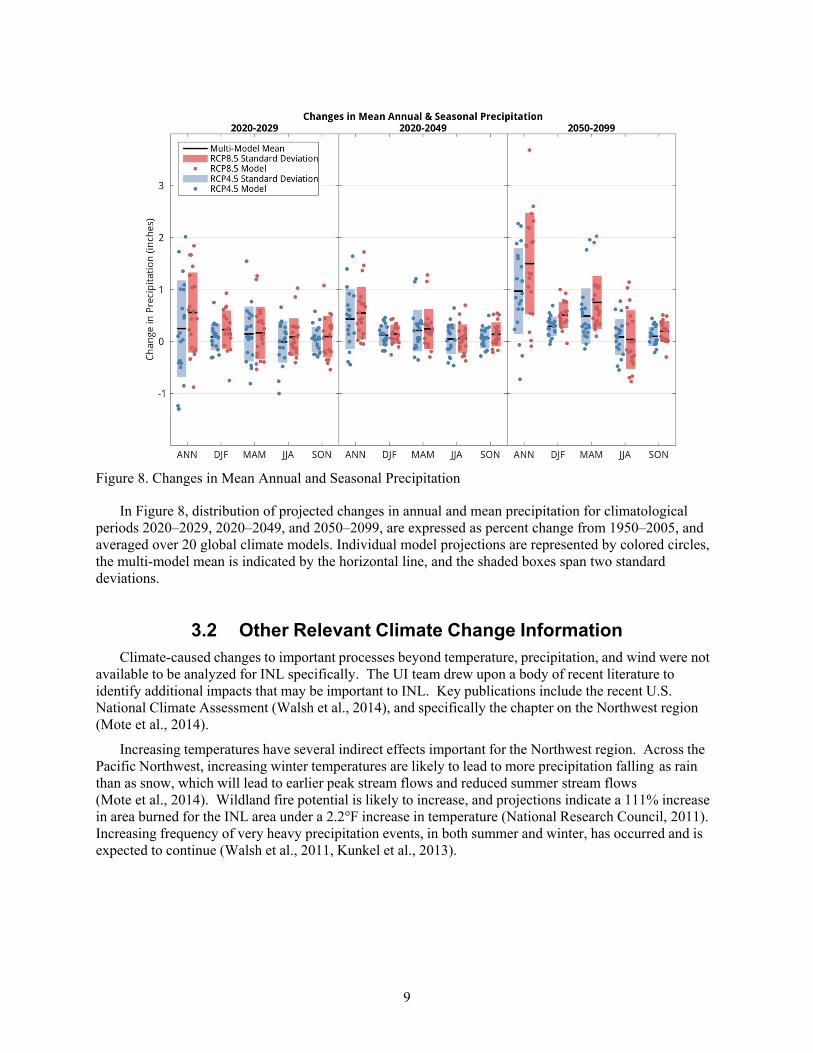
Precipitation projections indicate a slight increase of 0.2–0.6 in. in 2020–2029, and an overall increase of mean annual precipitation of 1.0–1.5 in. by 2099 (Figure 8). There is a high degree of variability among GCMs in the magnitude and sign of precipitation projections. The number of wet days is projected to increase slightly (Figure 9). These local projections are consistent with the conterminous U.S. projections for increased frequency and severity of precipitation events (Walsh et al., 2014). Although annual precipitation at INL is projected to remain similar in the near future, the increase in temperature without an increase in precipitation will likely lead to higher climatic water deficit, or demand for evaporation not met by precipitation (Dalton et al., 2013). This increased evaporation has implications for reduced soil moisture and plant growth in agricultural and urban areas, as well as for water delivery and management of reservoirs.
9
Figure 8. Changes in Mean Annual and Seasonal Precipitation
In Figure 8, distribution of projected changes in annual and mean precipitation for climatological periods 2020–2029, 2020–2049, and 2050–2099, are expressed as percent change from 1950–2005, and averaged over 20 global climate models. Individual model projections are represented by colored circles, the multi-model mean is indicated by the horizontal line, and the shaded boxes span two standard deviations.
3.2 Other Relevant Climate Change Information Climate-caused changes to important processes beyond temperature, precipitation, and wind were not
available to be analyzed for INL specifically. The UI team drew upon a body of recent literature to identify additional impacts that may be important to INL. Key publications include the recent U.S. National Climate Assessment (Walsh et al., 2014), and specifically the chapter on the Northwest region (Mote et al., 2014).
Increasing temperatures have several indirect effects important for the Northwest region. Across the Pacific Northwest, increasing winter temperatures are likely to lead to more precipitation falling as rain than as snow, which will lead to earlier peak stream flows and reduced summer stream flows (Mote et al., 2014). Wildland fire potential is likely to increase, and projections indicate a 111% increase in area burned for the INL area under a 2.2°F increase in temperature (National Research Council, 2011). Increasing frequency of very heavy precipitation events, in both summer and winter, has occurred and is expected to continue (Walsh et al., 2011, Kunkel et al., 2013).
10
4. CLIMATE CHANGE SENSITIVITIES, IMPACTS, ADAPTIVE CAPACITY, AND VULNERABILITIES AT INL
Based on the INL Vulnerability Worksheet (Appendix A), several broad categories were identified where climate change would have significant impacts across multiple sectors at INL. These categories are energy supply, infrastructure and transportation, maintenance and support personnel capacity, HVAC systems, and wildland fire. Climate change sensitivities, impacts, adaptive capacity, and vulnerability to INL for each of these categories are summarized in the following subsections.
Additional details for these and other sectors and systems can be found in the INL Vulnerability Worksheet (Appendix A).
4.1 Energy Supply A consistent power supply was listed as critical to multiple sectors and systems at INL (Appendix A).
The production, transmission, and storage of energy will be affected by climate change (DOE 2013). Geographic regions of the U.S. face varying impacts, but due to the interconnected nature of energy production and distribution, disruptions in one sector or geographic region can have cascading effect on other sectors and regions. Unless otherwise noted, energy generation and transmission sensitivity information was drawn from the DOE report on U.S. energy sector vulnerabilities to climate change and extreme weather (DOE 2013).
Power generation systems are sensitive to air and water temperature and water availability. Thermoelectric plants operate less efficiently and at lower capacity at higher air temperatures. Higher water temperatures reduce hydropower facility cooling efficiency and increase the risk of exceeding thermal intake and effluent limits, resulting in partial to complete facility shutdown. By the 2080s, there is the potential for a 20% reduction in hydropower production to preserve in-stream flows for endangered fish (Mote et al., 2014). Indirect effects of climate change that manifest for thousands of miles will influence energy supply to INL. Oil-based generation facilities in the Arctic can be damaged by thawing permafrost, and declining Arctic sea ice limits the use of ice-based infrastructure. Storms can damage offshore facilities. Decreased water availability reduces drilling, production, and refining capacities.
Energy transmission systems, on and off the INL Site, are also sensitive to temperatures, water availability, storm events, and wildland fire. Higher temperatures reduce the efficiency and capacity of electrical transmission lines. Severe storms and fires can damage power lines, and floods can damage pipelines.
Given these sensitivities and the projected increases in temperature, increased potential for more frequent and severe storms, reduced summer stream flows, and increased the potential for drought across the western United States, there is an increased risk of energy supply disruptions at INL. The source of these disruptions could be in energy generation, energy transmission to INL, or energy transmission across the INL Site. Therefore, it is likely the INL backup power system will need to be used more in the future. This will increase operation and maintenance costs of the backup power system. If the backup power systems are not able to handle the increased load, this could cause disruptions to workflow in multiple sectors, including communications, and laboratory research and development. Because long-term experiments require consistent temperatures, the ability to conduct critical INL business is potentially compromised with more frequent power supply disruptions.
The likelihood of more frequent disruptions, or impacts, is high, and the adaptive capacity of the backup system was rated medium. Therefore, vulnerability of the backup system is medium to high. In addition, damaging impacts to the transmission lines and poles on the INL Site are likely; the adaptive capacity to minimize these impacts is low, and thus vulnerability of this component to climate change is high.

11
4.2 Infrastructure and Transportation Multiple components of INL infrastructure and transportation are likely to be affected by climate
conditions at the INL Site. Rates of roof, road, and parking lot material degradation will increase with higher summer temperatures. Infrastructure and transportation systems, as well as energy transmission systems (described above) are sensitive to severe storms.
These sensitivities and expected increases in summer temperature and increased frequency and severity of storm events will lead to impacts across multiple sectors at INL. Increased material damage will lead to increased costs to maintain the infrastructure. Storm damage to roads will likely increase not only cost but time required to perform maintenance. Road closures for maintenance could lead to a higher potential for disruptions to workflow in all sectors. The adaptive capacity of infrastructure and transportation systems was generally rated as medium to high, and vulnerability as medium to high.
4.3 Maintenance and Support Personnel Humans are sensitive to weather conditions, particularly heat stress. Given projected increases in both
average summer temperatures and the number of hot days, personnel are likely to experience an increase in conditions unsuitable for performing their work. This has a direct negative impact on those employees’ health and well-being. Climate change will also have an indirect negative impact on the ability of other employees to perform their work, if for example, roads cannot be maintained or power lines cannot be repaired quickly enough. The expected impacts to personnel are likely to be high, the adaptive capacity is medium, and the vulnerability is high.
4.4 HVAC Systems, Cooling Towers, and Reactors Building heating and cooling systems at INL are sensitive to air temperature. Projected decreases in
heating degree days and increases in cooling degree days will mean heating systems will probably be used less but cooling systems will probably be used more. During 2020–2029, there are projected to be 309-438 fewer days requiring heating (or 31–44 days per year, on average) and 103–160 more days requiring cooling. Increased cooling demand will occur in the summer when there is the greatest potential for energy supply disruptions. The likelihood of impacts to the building HVAC systems is high, adaptive capacity is high, and vulnerability is medium.
Reactor cooling towers are likewise sensitive to air temperatures, and reactors need to be shut down when temperatures exceed a critical threshold. During 2020–2029, the number of hot days (>90°F) is projected to double compared to the historical period. Reactor cooling towers will likely need to be turned on more often, increasing operation and maintenance costs, and the number of days reactors need to be shut down will increase. Impacts to the reactors and cooling towers are likely, adaptive capacity is low, and vulnerability is high.
4.5 Wildland Fire The potential for wildand fire is higher in the future. Fire impacts multiple sectors at INL, and
adaptive capacity to minimize effects of increased wildland fire is low; therefore, vulnerability to fire at INL is high. Increased wildland fire will increase emergency management costs. Similar to backup power systems, it is worth considering if the current emergency management capacity is sufficient to handle a 111% increase in area burned. Increased area burned will likely cause more damage to infrastructure, including buildings, roads, parking lots, power poles and lines, and transformers.

12
The INL Vulnerability Worksheet (Appendix A) identifies environmental regulatory compliance as potentially sensitive to climate change. UI personnel identified additional sensitivities specific to sage-grouse, an endangered species. Sage-grouse are sensitive to particular habitat requirements. Prolonged drought may reduce sage-grouse habitat (Aldridge et al., 2008). Similarly, an increased risk of the expansion of cheatgrass (Bradley et al., 2009), an invasive plant species detrimental to sage-grouse habitat, could increase fire risk and reduce sage-grouse habitat. These habitat reductions would trigger restoration actions required under the Endangered Species Act. Impacts to sage-grouse habitat are likely; the adaptive capacity is low, and vulnerability is high.
5. BASELINE TO OTHER DOE SITES AND FEDERAL AGENCIES INL personnel compiled climate change adaptation activity at other Federal locations. Sixteen DOE
laboratories, two non-labs, and three non-DOE Federal Agency sustainability plans were investigated. The INL team used the publicly available sustainability plans from individual website locations. If a plan was not publicly available, it is noted as such.
Each location is in a varying state of climate change resiliency development. Twelve of 16 labs have some climate change vulnerability assessment work completed or in progress. Of these, 10 labs have sitewide assessments completed or in progress, and two have sector specific assessments. See Appendix C for more details.
All of the publicly available sustainability plans contain a climate change section. INL has reproduced, word for word, each of those climate change sections in Appendix C. Although the format was changed to meet the standards of this report, no information was changed and each climate change section was reproduced as published.
13
6. REFERENCES Abatzoglou J. T., and T. J. Brown, 2011, “A comparison of statistical downscaling methods suited for
wildfire applications,” International Journal of Climatology, DOI: 10.1002/joc.2312, March 17, 2011, pp. 772–780.
Aldridge, C. L., S. E. Nelson, H. L. Beyer, M. S. Boyce, J. W.Connelly, S.T. Knick, and M.A. Schroeder, 2008, “Range-wide patterns of sage-grouse persistence,” Diversity and Distributions, Vol.14, pp.983–994.
Bradley, B. A., M. Oppenheimer, and D. S. Wilcove, 2008, “Climate change and plant invasions: restoration opportunities ahead?” Global Change Biology, Vol. 15No. 6, , Nov. 3, 2008, pp. 1511–1521.
Dalton, M. M., P. W. Mote, and A. K. Snover, 2013, Climate Change in the Northwest: Implications for Our Landscapes, Waters, and Communities. Washington, D.C.: Island Press.
DOE, 2013, U.S. Energy Sector Vulnerabilities to Climate Change and Extreme Weather, U.S. Department of Energy, DOE/PI-0013, July 2013.
Georgakakos, A., P. Fleming, M. Dettinger, C. Peters-Lidard, T. C. Richmond, K. Reckhow, K. White, and D. Yates, 2014 (J. M. Melillo, Terese (T.C.) Richmond, and G. W. Yohe ),Water Resources. Climate Change Impacts in the United States: The Third National Climate Assessment, U.S. Global Change Research Program, DOI:10.7930/ J0G44N6T, Ch. 3, pp. 69–112, , 2014.
Glick, P., B. A. Stein, and N. A. Edelson, eds., 2011, Scanning the Conservation Horizon: A Guide to Climate Change Vulnerability Assessment, National Wildlife Federation, Washington, D.C., ISBN 978-0-615-40233-8, 2011.
Halofsky, J. E., D. L. Peterson, K. A. O’Halloran, and C. Hawkins Hoffman, eds., (U.S. Department of Agriculture, Forest Service, Pacific Northwest Research Station), 2011, Adapting to climate change at Olympic National Forest and Olympic National Park, Gen. Tech. Rep. PNW-GTR-844, p.130, August 2011.
INL, 2013, FY 2014 INL Site Sustainability Plan with the FY 2013 Annual Report, Idaho National Laboratory, DOE/ID-11383, Rev. 5, December, 2013.
IPCC, 2013, Summary for Policymakers, In: Climate Change 2013: The Physical Science Basis. Contribution of Working Group I to the Fifth Assessment Report of the Intergovernmental Panel on Climate Change (Stocker, T.F., D. Qin, G.-K. Plattner, M. Tignor, S.K. Allen, J. Boschung, A. Nauels, Y. Xia, V. Bex, and P.M. Midgley, eds.), Cambridge University Press, Cambridge, United Kingdom and New York, 2013.
Kunkel, K. E. et al., 2013, “Monitoring and understanding trends in extreme storms: State of knowledge,” Bulletin of the American Meteorological Society, Vol. 94, DOI: 10.1175/BAMS-D-11- 00262.1, April 16, 2013.
MACA, (Abatzoglou, J., and Brown, T. J.), University of Idaho, Multivariate Adaptive Constructed Analogs (MACA) Statistical Downscaling Method http://maca.northwestknowledge.net/, 2011.
Mote, P., A. K. Snover, S. Capalbo, S. D. Eigenbrode, P. Glick, J. Littell, R. Raymondi, and S. Reeder, (J. M. Melillo, TT. C. Richmond, and G. W. Yohe, eds.,) 2014, Northwest. Climate Change Impacts in the United States: The Third National Climate Assessment, U.S. Global Change Research Program, doi:10.7930/J04Q7RWX, Ch. 21, 2014, pp. 487–513,, 2014.
National Research Council, 2011, Climate Stabilization Targets: Emissions, Concentrations, and Impacts over Decades to Millennia, The National Academies Press, Washington, D.C.

14
Peterson, D. L., C. I. Millar, L. A. Joyce, M. J. Furniss, J. E. Halofsky, R. P. Neilson, and T. L. Morelli, (U.S. Department of Agriculture, Forest Service, Pacific Northwest Research Station) 2011, Responding to climate change in national forests: a guidebook for developing adaptation options. Gen. Tech. Rep. PNW-GTR-855, , , Feb. 8, 2011, p.109.
Raymond, C. L., D. L. Peterson, and R. M. Rochefort, 2013, “The North Cascadia Adaptation Partnership: A Science-Management Collaboration for Responding to Climate Change,” Sustainability, Vol. , 5, Jan 8, 2013, pp. 136–159.
Snover, A. K., L. Whitley Binder, J. Lopez, J. Kays, D. Howell, and J. Simmonds, 2007, Preparing for Climate Change: A Guidebook for Local, Regional, and State Governments, In association with and published by ICLEI – Local Governments for Sustainability, Oakland, California
Walsh, J., D. Wuebbles, K. Hayhoe, J. Kossin, K. Kunkel, G. Stephens, P. Thorne, R. Vose, M. Wehner, J. Willis, D. Anderson, V. Kharin, T. Knutson, F. Landerer, T. Lenton, J. Kennedy, and R. Somerville, 2014, Climate Science Supplement. Climate Change Impacts in the United States: The Third National Climate Assessment, J. M. Melillo, Terese (T.C.) Richmond, and G. W. Yohe, Eds., U.S. Global Change Research Program, DOI:10.7930/J0KS6PHH, App. 3, 2014, pp. 735–789.
.

15
Appendix A
INL Climate Change Vulnerability Assessment Worksheet

16

17
Appendix A INL Climate Change Vulnerability Assessment Worksheet
Sector System Component
Climate/Weather Variable Influencing
Component
Influence of Climate/Weather
Variable Projected Change of Climate/Weather Variable Expected Impact on
Component Adaptive Capacity
(Low/Medium/High) Vulnerability
(Low/Medium/High)
Facilities HVAC System Cooling (chillers, packaged HVAC units, cooling coils, etc.)
Spring, summer, fall temperatures.
HVAC cooling systems turned on when temperatures exceed a threshold.
In the upcoming 2020–2029 decade, spring (March, April, May), summer (June, July, August), and fall (September, October, November) temperatures are projected to increase under both emission scenarios. The historic 1950–2005 mean spring temperature was 43.3°F; projected changes are +1.7°F and +2.1°F for RCP4.5 and RCP8.5, respectively. By mid-century, spring temperatures are projected to increase 2.3°F and 2.2°F for RCP4.5 and RCP8.5, respectively.
The historic 1950–2005 mean summer temperature was 65.1°F; projected changes in the 2020–2029 decade are +2.9°F and +3.9°F for RCP4.5 and RCP8.5, respectively. Mid-century projections show an increase of 4.9°F under RCP4.5, and 5.2°F under RCP8.5.
The historic 1950–2005 mean fall temperature was 43.9°F; projected changes in the 2020–2029 decade are +2.3°F and +3.3°F for RCP4.5 and RCP8.5, respectively. Mid-century projections show an increase of 3.2°F under RCP4.5, and 3.7°F under RCP8.5.
The study region averaged an annual 152 cooling degree days using a base temperature of 65°F in the historic 1950–2005 period. In the 2020–2029 decade, annual degree days will increase 103 and 160 for RCP4.5 and RCP8.5, respectively. Mid-century projections under RCP4.5 are +195 cooling degree days, and +216 cooling degree days under RCP8.5
A majority of the historic mean annual cooling degree days occurred in summer (145 degree days), with projections showing +94 degree days under RCP4.5, and +141 degree days under RCP8.5 in the 2020–2029 decade. By mid-century, projections show +177 and +190 cooling degree days in Summer for RCP4.5 and RCP8.5, respectively.
HVAC cooling systems will operate more, requiring additional maintenance
High Medium

18
Sector System Component
Climate/Weather Variable Influencing
Component
Influence of Climate/Weather
Variable Projected Change of Climate/Weather Variable Expected Impact on
Component Adaptive Capacity
(Low/Medium/High) Vulnerability
(Low/Medium/High)
Facilities HVAC System Heating (boilers, packaged HVAC units, furnaces, radiators, heating coils, etc.)
Extreme/intermittent winter temperatures
HVAC heating systems turned on when temperatures are below freezing
The historic 1950–2005 mean winter (Dec., Jan., Feb.) temperature was 20.4°F. Under RCP4.5, mean temperatures will increase 1.0°F in the 2020–2029 decade, and 1.8°F by mid-century. Under RCP8.5, projected changes in the 2020–2029 decade are +2.2°F and +2.8°F by mid-century.The historic mean number of days with low temperatures at or below 32°F (cold days) was 195 and the mean number of consecutive days with low temperatures at or below 32°F (consecutive cold days) was 74. In the 2020–2029 decade, the number of cold days will decrease 9 days and 16 days under RCP4.5 and RCP8.5, respectively. Consecutive cold days will likewise shorten by 6 days and 5 days for RCP4.5 and RCP8.5, respectively. Mid-century projections under RCP4.5 are -14 cold days and -7 consecutive cold days. Under RCP8.5, mid-century projections are -18 cold days, with consecutive cold days decreasing by 6 days.The historic mean number of days with low temperatures at or below 0°F (extremely cold days) was 47 and the mean number of consecutive extreme cold days was 11. In the 2020–2029 decade, the number of extremely cold days will decrease 7 days and 14 days under RCP4.5 and RCP8.5, respectively. Consecutive extremely cold days will shorten by 2 and 4 days for RCP4.5 and RCP8.5, respectively. Mid-century projections under RCP4.5 are -12 extremely cold days and -2 consecutive extremely cold days. Under RCP8.5, mid-century projections are -17 extremely cold days and -4 consecutive extremely cold days.The study region averaged an annual 4527 heating degree days using a base temperature of 65°F in the historic 1950–2005 period. In the 2020–2029 decade, annual heating degree days will decrease 309 degree days and 438 degree days for RCP4.5 and RCP8.5, respectively. Mid-century projections under RCP4.5 are -431 degree days, and -497 degree days under RCP8.5.A majority of the historic mean annual heating degree days occurred in winter (2225 degree days), with projections showing -48 degree days under RCP4.5, and -111 degree days under RCP8.5 in the 2020–2029 decade. By mid-century, projections show -89 degree days and -142 degree days under RCP4.5 and RCP8.5, respectively.
Heating system will likely have to operate less in the future.
High Low
Facilities Building Envelope
Roofs Summer temperatures
Increased rate of degradation of roof materials at higher temperatures
The historic 1950–2005 mean summer temperature was 65.1°F; projected changes are +2.9°F and +3.9°F for RCP4.5 and RCP8.5, respectively. Mid-century projections show an increase of 4.9°F under RCP4.5, and 5.2°F under RCP8.5.
The historic mean number of days with high temperatures at or above 90°F (hot days) was 15 and the mean number of consecutive days at or above 90°F (consecutive hot days) was 6. In the 2020–2029 decade, the number of hot days is projected to increase 16 days and 23 days for RCP4.5 and RCP8.5, respectively. Consecutive hot days will increase 5 days and 8 days for RCP4.5 and RCP8.5, respectively. Mid-century projections under RCP4.5 show +28 hot days and +12 consecutive hot days. Under RCP8.5, mid-century projections are +29 hot days and +13 consecutive hot days.
The historic mean number of days with high temperature at or above 100°F (extremely hot days) and consecutive days with high temperature at or above 100°F (consecutive extremely) hot days hovered around 0. The number of extremely hot days remains relatively stable through 2020–2029, with +1 days and +2 days under RCP4.5 and RCP8.5, respectively; projections increase to 2 days and 3 days by mid-century. Additional extremely hot days in the 2020–2029 decade and by mid-century are likely to be consecutive.
Roof materials will likely degrade under higher temperatures and need to be replaced more often.
Low High
19
Sector System Component
Climate/Weather Variable Influencing
Component
Influence of Climate/Weather
Variable Projected Change of Climate/Weather Variable Expected Impact on
Component Adaptive Capacity
(Low/Medium/High) Vulnerability
(Low/Medium/High)
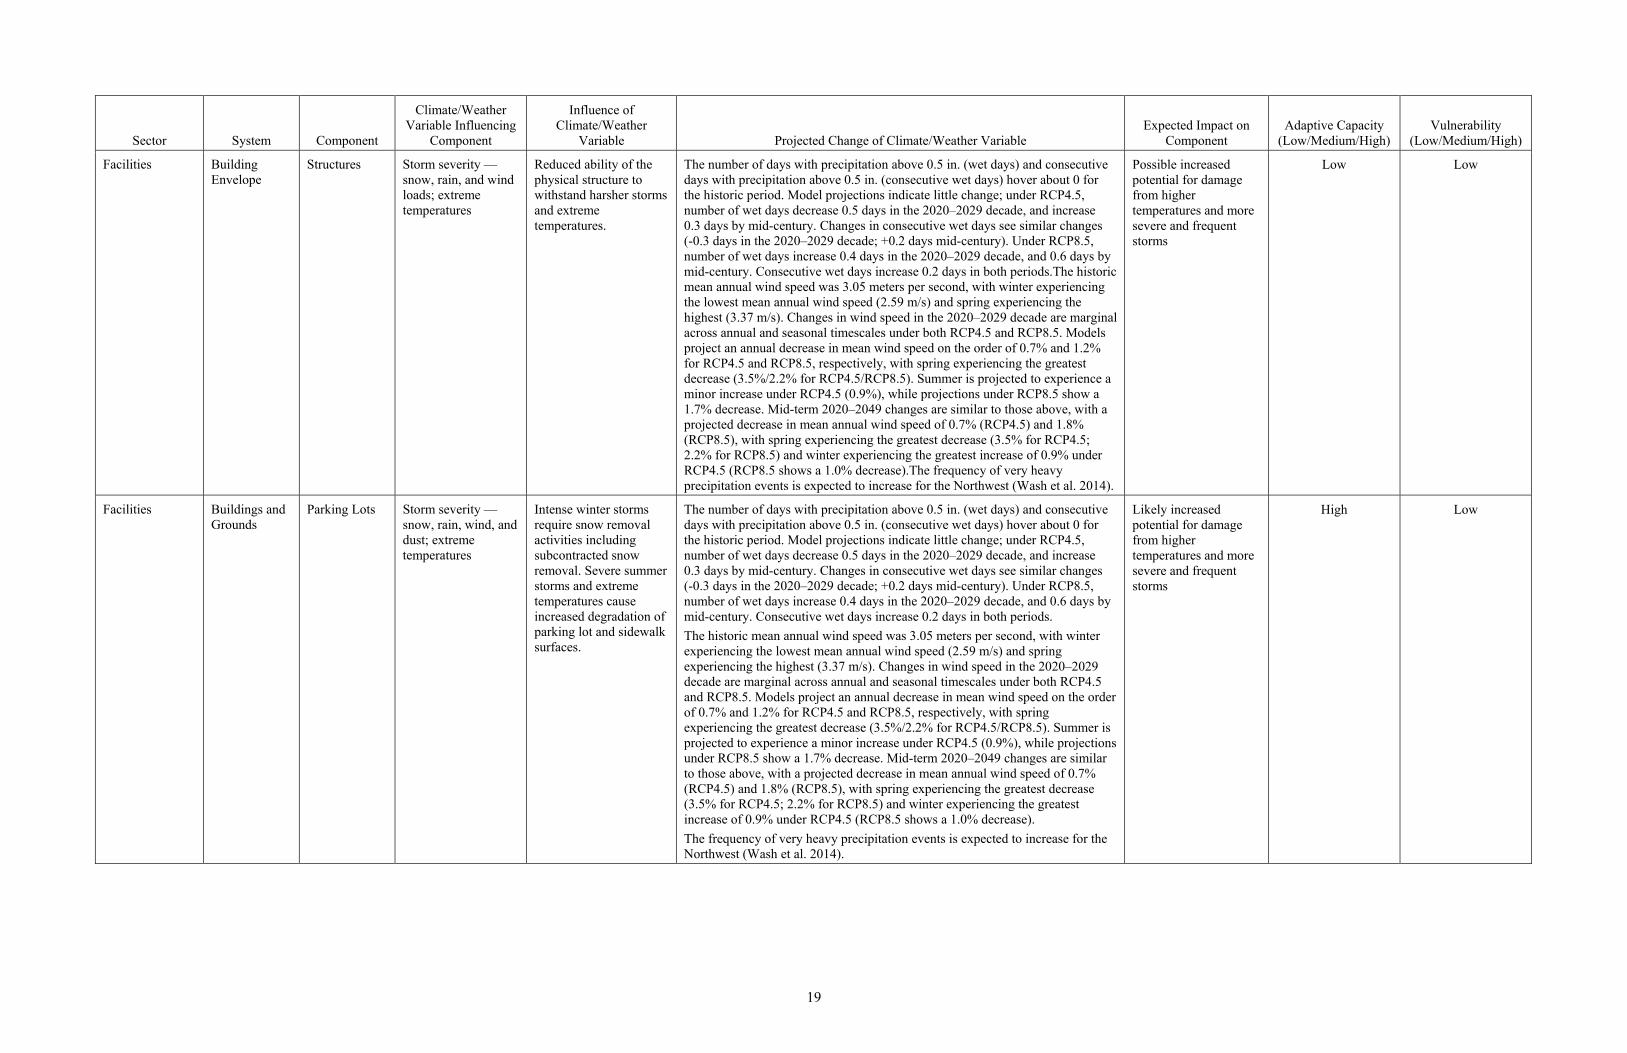
Facilities Building Envelope
Structures Storm severity — snow, rain, and wind loads; extreme temperatures
Reduced ability of the physical structure to withstand harsher storms and extreme temperatures.
The number of days with precipitation above 0.5 in. (wet days) and consecutive days with precipitation above 0.5 in. (consecutive wet days) hover about 0 for the historic period. Model projections indicate little change; under RCP4.5, number of wet days decrease 0.5 days in the 2020–2029 decade, and increase 0.3 days by mid-century. Changes in consecutive wet days see similar changes (-0.3 days in the 2020–2029 decade; +0.2 days mid-century). Under RCP8.5, number of wet days increase 0.4 days in the 2020–2029 decade, and 0.6 days by mid-century. Consecutive wet days increase 0.2 days in both periods.The historic mean annual wind speed was 3.05 meters per second, with winter experiencing the lowest mean annual wind speed (2.59 m/s) and spring experiencing the highest (3.37 m/s). Changes in wind speed in the 2020–2029 decade are marginal across annual and seasonal timescales under both RCP4.5 and RCP8.5. Models project an annual decrease in mean wind speed on the order of 0.7% and 1.2% for RCP4.5 and RCP8.5, respectively, with spring experiencing the greatest decrease (3.5%/2.2% for RCP4.5/RCP8.5). Summer is projected to experience a minor increase under RCP4.5 (0.9%), while projections under RCP8.5 show a 1.7% decrease. Mid-term 2020–2049 changes are similar to those above, with a projected decrease in mean annual wind speed of 0.7% (RCP4.5) and 1.8% (RCP8.5), with spring experiencing the greatest decrease (3.5% for RCP4.5; 2.2% for RCP8.5) and winter experiencing the greatest increase of 0.9% under RCP4.5 (RCP8.5 shows a 1.0% decrease).The frequency of very heavy precipitation events is expected to increase for the Northwest (Wash et al. 2014).
Possible increased potential for damage from higher temperatures and more severe and frequent storms
Low Low
Facilities Buildings and Grounds
Parking Lots Storm severity — snow, rain, wind, and dust; extreme temperatures
Intense winter storms require snow removal activities including subcontracted snow removal. Severe summer storms and extreme temperatures cause increased degradation of parking lot and sidewalk surfaces.
The number of days with precipitation above 0.5 in. (wet days) and consecutive days with precipitation above 0.5 in. (consecutive wet days) hover about 0 for the historic period. Model projections indicate little change; under RCP4.5, number of wet days decrease 0.5 days in the 2020–2029 decade, and increase 0.3 days by mid-century. Changes in consecutive wet days see similar changes (-0.3 days in the 2020–2029 decade; +0.2 days mid-century). Under RCP8.5, number of wet days increase 0.4 days in the 2020–2029 decade, and 0.6 days by mid-century. Consecutive wet days increase 0.2 days in both periods.
The historic mean annual wind speed was 3.05 meters per second, with winter experiencing the lowest mean annual wind speed (2.59 m/s) and spring experiencing the highest (3.37 m/s). Changes in wind speed in the 2020–2029 decade are marginal across annual and seasonal timescales under both RCP4.5 and RCP8.5. Models project an annual decrease in mean wind speed on the order of 0.7% and 1.2% for RCP4.5 and RCP8.5, respectively, with spring experiencing the greatest decrease (3.5%/2.2% for RCP4.5/RCP8.5). Summer is projected to experience a minor increase under RCP4.5 (0.9%), while projections under RCP8.5 show a 1.7% decrease. Mid-term 2020–2049 changes are similar to those above, with a projected decrease in mean annual wind speed of 0.7% (RCP4.5) and 1.8% (RCP8.5), with spring experiencing the greatest decrease (3.5% for RCP4.5; 2.2% for RCP8.5) and winter experiencing the greatest increase of 0.9% under RCP4.5 (RCP8.5 shows a 1.0% decrease).
The frequency of very heavy precipitation events is expected to increase for the Northwest (Wash et al. 2014).
Likely increased potential for damage from higher temperatures and more severe and frequent storms
High Low

20
Sector System Component
Climate/Weather Variable Influencing
Component
Influence of Climate/Weather
Variable Projected Change of Climate/Weather Variable Expected Impact on
Component Adaptive Capacity
(Low/Medium/High) Vulnerability
(Low/Medium/High)
Laboratories and R&D Activities
Laboratory and Scientific Equipment
Backup Power Systems
Severe weather that creates brown-outs or interruptions.
Backup power systems need to be turned on when main power source fails
The number of days with precipitation above 0.5 in. (wet days) and consecutive days with precipitation above 0.5 in. (consecutive wet days) hover about 0 for the historic period. Model projections indicate little change; under RCP4.5, number of wet days decrease 0.5 days in the 2020–2029 decade, and increase 0.3 days by mid-century. Changes in consecutive wet days see similar changes (-0.3 days in the 2020–2029 decade; +0.2 days mid-century). Under RCP8.5, number of wet days increase 0.4 days in the 2020–2029 decade, and 0.6 days by mid-century. Consecutive wet days increase 0.2 days in both periods.The historic mean annual wind speed was 3.05 meters per second, with winter experiencing the lowest mean annual wind speed (2.59 m/s) and spring experiencing the highest (3.37 m/s). Changes in wind speed in the 2020–2029 decade are marginal across annual and seasonal timescales under both RCP4.5 and RCP8.5. Models project an annual decrease in mean wind speed on the order of 0.7% and 1.2% for RCP4.5 and RCP8.5, respectively, with spring experiencing the greatest decrease (3.5%/2.2% for RCP4.5/RCP8.5). Summer is projected to experience a minor increase under RCP4.5 (0.9%), while projections under RCP8.5 show a 1.7% decrease. Mid-term 2020–2049 changes are similar to those above, with a projected decrease in mean annual wind speed of 0.7% (RCP4.5) and 1.8% (RCP8.5), with spring experiencing the greatest decrease (3.5% for RCP4.5; 2.2% for RCP8.5) and winter experiencing the greatest increase of 0.9% under RCP4.5 (RCP8.5 shows a 1.0% decrease).The frequency of very heavy precipitation events is expected to increase for the Northwest (Wash et al. 2014).
Backup power systems will likely need to operate more in the future than in the past
Medium Medium to High
Laboratories and R&D Activities
Buildings and Grounds
Parking Lots and Sidewalks
Storm severity — snow, rain, wind, and dust.
Snow needs to be cleared after each storm; storms can damage parking lots and sidewalks
The number of days with precipitation above 0.5 in. (wet days) and consecutive days with precipitation above 0.5 in. (consecutive wet days) hover about 0 for the historic period. Model projections indicate little change; under RCP4.5, number of wet days decrease 0.5 days in the 2020–2029 decade, and increase 0.3 days by mid-century. Changes in consecutive wet days see similar changes (-0.3 days in the 2020–2029 decade; +0.2 days mid-century). Under RCP8.5, number of wet days increase 0.4 days in the 2020–2029 decade, and 0.6 days by mid-century. Consecutive wet days increase 0.2 days in both periods.
The historic mean annual wind speed was 3.05 meters per second, with winter experiencing the lowest mean annual wind speed (2.59 m/s) and spring experiencing the highest (3.37 m/s). Changes in wind speed in the 2020–2029 decade are marginal across annual and seasonal timescales under both RCP4.5 and RCP8.5. Models project an annual decrease in mean wind speed on the order of 0.7% and 1.2% for RCP4.5 and RCP8.5, respectively, with spring experiencing the greatest decrease (3.5%/2.2% for RCP4.5/RCP8.5). Summer is projected to experience a minor increase under RCP4.5 (0.9%), while projections under RCP8.5 show a 1.7% decrease. Mid-term 2020–2049 changes are similar to those above, with a projected decrease in mean annual wind speed of 0.7% (RCP4.5) and 1.8% (RCP8.5), with spring experiencing the greatest decrease (3.5% for RCP4.5; 2.2% for RCP8.5) and winter experiencing the greatest increase of 0.9% under RCP4.5 (RCP8.5 shows a 1.0% decrease).
The frequency of very heavy precipitation events is expected to increase for the Northwest (Wash et al. 2014).
Some potential for increased need for snow removal. Reduced ability to operate 24-hour experiments if on and off-hours access to laboratories by employees and vendors is prohibited.
High Low

21
Sector System Component
Climate/Weather Variable Influencing
Component
Influence of Climate/Weather
Variable Projected Change of Climate/Weather Variable Expected Impact on
Component Adaptive Capacity
(Low/Medium/High) Vulnerability
(Low/Medium/High)
triga HVAC System Cooling (chillers, packaged HVAC units, cooling coils, etc.)
Spring and fall temperatures.
Long-term experiments need consistent/steady temperatures. Cooling system turned on when temperature exceeds a threshold
The historic 1950–2005 mean spring temperature was 43.3°F; projected changes in the 2020–2029 decade are +1.7°F and +2.1°F for RCP4.5 and RCP8.5, respectively. By mid-century, spring temperatures are projected to increase 2.3°F and 2.2°F for RCP4.5 and RCP8.5, respectively.The historic 1950–2005 mean fall temperature was 43.9°F; projected changes in the 2020–2029 decade are +2.3°F and +3.3°F for RCP4.5 and RCP8.5, respectively. Mid-century projections show an increase of 3.2°F under RCP4.5, and 3.7°F under RCP8.5.The study region averaged an annual 152 cooling degree days using a base temperature of 65°F in the historic 1950–2005 period. In the 2020–2029 decade, annual degree days will increase 103 and 160 for RCP4.5 and RCP8.5, respectively. Mid-century projections under RCP4.5 are +195 cooling degree days, and +216 cooling degree days under RCP8.5. A majority of the historic mean annual cooling degree days occurred in summer (145 degree days), with projections showing +94 degree days under RCP4.5, and +141 degree days under RCP8.5 in the 2020–2029 decade. By mid-century, projections show +177 and +190 cooling degree days in summer for RCP4.5 and RCP8.5, respectively.
Cooling system will need to be turned on earlier or more often
High Medium
Laboratories and R&D Activities
HVAC System Heating (boilers, packaged HVAC units, furnaces, radiators, heating coils, etc.)
Extreme/intermittent winter temperatures.
Long-term experiments need consistent/steady temperatures. Heating systems turned on when temperature thresholds are reached
The historic 1950–2005 mean winter (Dec., Jan., Feb.) temperature was 20.4°F. Under RCP4.5, mean temperatures will increase 1.0°F in the 2020–2029 decade, and 1.8°F by mid-century. Under RCP8.5, projected changes in the 2020–2029 decade are +2.2°F and +2.8°F by mid-century.
The historic mean number of days with low temperatures at or below 32°F (cold days) was 195 and the mean number of consecutive days with low temperatures at or below 32°F (consecutive cold days) was 74. In the 2020–2029 decade, the number of cold days will decrease 9 days and 16 days under RCP4.5 and RCP8.5, respectively. Consecutive cold days will likewise shorten by 6 days and 5 days for RCP4.5 and RCP8.5, respectively. Mid-century projections under RCP4.5 are -14 cold days and -7 consecutive cold days. Under RCP8.5, mid-century projections are -18 cold days, with consecutive cold days decreasing by 6 days.
The historic mean number of days with low temperatures at or below 0°F (extremely cold days) was 47 and the mean number of consecutive extreme cold days was 11. In the 2020–2029 decade, the number of extremely cold days will decrease 7 days and 14 days under RCP4.5 and RCP8.5, respectively. Consecutive extremely cold days will shorten by 2 and 4 days for RCP4.5 and RCP8.5, respectively. Mid-century projections under RCP4.5 are -12 extremely cold days and -2 consecutive extremely cold days. Under RCP8.5, mid-century projections are -17 extremely cold days and -4 consecutive extremely cold days.
The study region averaged annual 4527 heating degree days using a base temperature of 65°F in the historic 1950–2005 period. In the 2020–2029 decade, annual heating degree days will decrease 309 degree days and 438 degree days for RCP4.5 and RCP8.5, respectively. Mid-century projections under RCP4.5 are -431 degree days, and -497 degree days under RCP8.5. A majority of the historic mean annual heating degree days occurred in winter (2225 degree days), with projections showing -48 degree days under RCP4.5, and -111 degree days under RCP8.5 in the 2020–2029 decade. By mid-century, projections show -89 degree days and -142 degree days under RCP4.5 and RCP8.5, respectively.
Heating system will likely need to be turned on less frequently in the future.
High Low

22
Sector System Component
Climate/Weather Variable Influencing
Component
Influence of Climate/Weather
Variable Projected Change of Climate/Weather Variable Expected Impact on
Component Adaptive Capacity
(Low/Medium/High) Vulnerability
(Low/Medium/High)
Process Operations
Reactor or Other Process Operations
Backup Power Systems
Severe weather Backup power systems need to be turned on when primary power supply fails
The number of days with precipitation above 0.5 in. (wet days) and consecutive days with precipitation above 0.5 in. (consecutive wet days) hover about 0 for the historic period. Model projections indicate little change; under RCP4.5, number of wet days decrease 0.5 days in the 2020–2029 decade, and increase 0.3 days by mid-century. Changes in consecutive wet days see similar changes (-0.3 days in the 2020–2029 decade; +0.2 days mid-century). Under RCP8.5, number of wet days increase 0.4 days in the 2020–2029 decade, and 0.6 days by mid-century. Consecutive wet days increase 0.2 days in both periods.The historic mean annual wind speed was 3.05 meters per second, with winter experiencing the lowest mean annual wind speed (2.59 m/s) and spring experiencing the highest (3.37 m/s). Changes in wind speed in the 2020–2029 decade are marginal across annual and seasonal timescales under both RCP4.5 and RCP8.5. Models project an annual decrease in mean wind speed on the order of 0.7% and 1.2% for RCP4.5 and RCP8.5, respectively, with spring experiencing the greatest decrease (3.5%/2.2% for RCP4.5/RCP8.5). Summer is projected to experience a minor increase under RCP4.5 (0.9%), while projections under RCP8.5 show a 1.7% decrease. Mid-term 2020–2049 changes are similar to those above, with a projected decrease in mean annual wind speed of 0.7% (RCP4.5) and 1.8% (RCP8.5), with spring experiencing the greatest decrease (3.5% for RCP4.5; 2.2% for RCP8.5) and winter experiencing the greatest increase of 0.9% under RCP4.5 (RCP8.5 shows a 1.0% decrease).The frequency of very heavy precipitation events is expected to increase for the Northwest (Wash et al. 2014).
Backup power systems will likely need to operate more in the future than they have in the past
Medium Medium to High
Process Operations
Buildings and Grounds
Process Waste Water Ponds
Drought Large game getting into waste ponds more frequently to look for water.
Annual cumulative precipitation averages 10.0 in. over the 1950–2005 historic period. In the 2020–2029 decade, annual cumulative precipitation is projected to decrease 1.3 in. and 0.3 in. under RCP4.5 and RCP8.5, respectively. Mid-century projections show minor changes at -0.2 in. and +0.1 in. for RCP4.5 and RCP8.5, respectively.
Summer cumulative precipitation averages 2.3 in. over the 1950–2005 historic period. Under RCP4.5, summer cumulative precipitation is projected to decrease 0.7 in. in the 2020–2029 decade and 0.4 in. by mid-century. Under RCP8.5, summer cumulative precipitation is similar to the historic period, with changes of -0.1 in. projected in the 2020–2029 decade and +0.1 in. by mid-century.
The historic mean annual number of days with precipitation below 0.1 in. (dry days) was 333 days, and consecutive days with precipitation below 0.1 in. (consecutive dry days) was 67. In the 2020–2029 decade, the number of dry days is projected to increase 6 days and 2 days under RCP4.5 and RCP8.5, respectively. Mid-century projections show +2 days and 0 days changes. Consecutive dry days are projected to increase; in the 2020–2029 decade, consecutive dry days will increase 11 days and 9 days under RCP4.5 and RCP8.5, respectively. The projections for mid-century are +6 days and 0 days for RCP4.5 and RCP8.5, respectively.
Likely increased damage to pond liners from big game searching out water.
High Medium

23
Sector System Component
Climate/Weather Variable Influencing
Component
Influence of Climate/Weather
Variable Projected Change of Climate/Weather Variable Expected Impact on
Component Adaptive Capacity
(Low/Medium/High) Vulnerability
(Low/Medium/High)
Process Operations
Reactor or Other Process Operations
Cooling Towers - TRIGA or ATR
Outdoor temperature Need to shut down reactor when temperatures exceed 98°F or the cooling tower capacity is exceeded.
The historic mean number of days with high temperatures at or above 90°F (hot days) was 15 and the mean number of consecutive days at or above 90°F (consecutive hot days) was 6. In the 2020–2029 decade, the number of hot days is projected to increase 16 days and 23 days for RCP4.5 and RCP8.5, respectively. Consecutive hot days will increase 5 days and 8 days for RCP4.5 and RCP8.5, respectively. Mid-century projections under RCP4.5 show +28 hot days and +12 consecutive hot days. Under RCP8.5, mid-century projections are +29 hot days and +13 consecutive hot days.The historic mean number of days with high temperature at or above 100°F (extremely hot days) and consecutive days with high temperature at or above 100°F (consecutive extremely) hot days hovered around 0. The number of extremely hot days remains relatively stable through 2020–2029, with +1 days and +2 days under RCP4.5 and RCP8.5, respectively; projections increase to +2 days and +3 days by mid-century. Additional extremely hot days in the 2020–2029 decade and by mid-century are likely to be consecutive.
Increased number of days that the reactor needs to be shut down in the future; impacts to ability to conduct experiments
Low High
Process Operations
Buildings and Grounds
Deep Wells/ Pumps
Water table in aquifer If water levels drop below deep well pump suction, there is a potential for complete shutdown of the facility.
Annual cumulative precipitation averages 10.0 in. over the 1950–2005 historic period. In the 2020–2029 decade, annual cumulative precipitation is projected to decrease 1.3 in. and 0.3 in. under RCP4.5 and RCP8.5, respectively. Mid-century projections show minor changes at -0.2 in. and +0.1 in. for RCP4.5 and RCP8.5, respectively.
The number of days with precipitation above 0.5 in. (wet days) and consecutive days with precipitation above 0.5 in. (consecutive wet days) hover about 0 for the historic period. Model projections indicate little change; under RCP4.5, number of wet days decrease 0.5 days in the 2020–2029 decade, and increase 0.3 days by mid-century. Changes in consecutive wet days see similar changes (-0.3 days in the 202–2029 decade; +0.2 days mid-century). Under RCP8.5, number of wet days increase 0.4 days in the 2020–2029 decade, and 0.6 days by mid-century. Consecutive wet days increase 0.2 days in both periods.
Projected climate change is expected to affect groundwater recharge, but the sign and magnitude of any changes are uncertain (Georgakakos et al. 2014).
There is a potential for decreased recharge of aquifer, but projections are uncertain
Low Low

24
Sector System Component
Climate/Weather Variable Influencing
Component
Influence of Climate/Weather
Variable Projected Change of Climate/Weather Variable Expected Impact on
Component Adaptive Capacity
(Low/Medium/High) Vulnerability
(Low/Medium/High)
Process Operations
Buildings and Grounds
Parking Lots and Sidewalks
Storm severities — snow, rain, wind, and dust.
Greater winter storm intensity will increase the need for snow removal, potentially affecting on and off-hours access to laboratories by employees and vendors. Increased frequency of extended work schedules. Severe storms in any season could lead to reduced ability to access and operate heavy equipment such as forklifts and cranes, and reduce ability to maintain 24-hour operations.
The number of days with precipitation above 0.5 in. (wet days) and consecutive days with precipitation above 0.5 in. (consecutive wet days) hover about 0 for the historic period. Model projections indicate little change; under RCP4.5, number of wet days decrease 0.5 days in the 2020–2029 decade, and increase 0.3 days by mid-century. Changes in consecutive wet days see similar changes (-0.3 days in the 2020–2029 decade; +0.2 days mid-century). Under RCP8.5, number of wet days increase 0.4 days in the 2020–2029 decade, and 0.6 days by mid-century. Consecutive wet days increase 0.2 days in both periods.
The historic mean annual wind speed was 3.05 meters per second, with winter experiencing the lowest mean annual wind speed (2.59 m/s) and spring experiencing the highest (3.37 m/s). Changes in wind speed in the 2020–2029 decade are marginal across annual and seasonal timescales under both RCP4.5 and RCP8.5. Models project an annual decrease in mean wind speed on the order of 0.7% and 1.2% for RCP4.5 and RCP8.5, respectively, with spring experiencing the greatest decrease (3.5%/2.2% for RCP4.5/RCP8.5). Summer is projected to experience a minor increase under RCP4.5 (0.9%), while projections under RCP8.5 show a 1.7% decrease. Mid-term 2020–2049 changes are similar to those above, with a projected decrease in mean annual wind speed of 0.7% (RCP4.5) and 1.8% (RCP8.5), with spring experiencing the greatest decrease (3.5% for RCP4.5; 2.2% for RCP8.5) and winter experiencing the greatest increase of 0.9% under RCP4.5 (RCP8.5 shows a 1.0% decrease).
The frequency of very heavy precipitation events is expected to increase for the Northwest (Wash et al. 2014).
Likely increased need for summer maintenance
High Medium

25
Sector System Component
Climate/Weather Variable Influencing
Component
Influence of Climate/Weather
Variable Projected Change of Climate/Weather Variable Expected Impact on
Component Adaptive Capacity
(Low/Medium/High) Vulnerability
(Low/Medium/High)
Power and Power Distribution
Utility Resource Availability and Rate Structure
Electric and Utility costs
Temperature and precipitation
Higher temperatures increase energy demand and reduce energy production capacity; drought reduces energy production capacity; energy prices rise as demand increases and supply potential declines
The historic 1950–2005 mean summer temperature was 65.1°F; projected changes are +2.9°F and +3.9°F for RCP4.5 and RCP8.5, respectively. Mid-century projections show an increase of 4.9°F under RCP4.5, and 5.2°F under RCP8.5.The historic mean number of days with high temperatures at or above 90°F (hot days) was 15 and the mean number of consecutive days at or above 90°F (consecutive hot days) was 6. In the 2020–2029 decade, the number of hot days is projected to increase 16 days and 23 days for RCP4.5 and RCP8.5, respectively. Consecutive hot days will increase 5 days and 8 days for RCP4.5 and RCP8.5, respectively. Mid-century projections under RCP4.5 show +28 hot days and +12 consecutive hot days. Under RCP8.5, mid-century projections are +29 hot days and +13 consecutive hot days.The historic mean number of days with high temperature at or above 100°F (extremely hot days) and consecutive days with high temperature at or above 100°F (consecutive extremely) hot days hovered around 0. The number of extremely hot days remains relatively stable through 2020–2029, with +1 days and +2 days under RCP4.5 and RCP8.5, respectively; projections increase to +2 days and +3 days by mid-century. Additional extremely hot days in the 2020–2029 decade and by mid-century are likely to be consecutive.Summer cumulative precipitation averages 2.3 in. over the 1950–2005 historic period. Under RCP4.5, summer cumulative precipitation is projected to decrease 0.7 in. in the 2020–2029 decade and 0.4 in. by mid-century. Under RCP8.5, summer cumulative precipitation is similar to the historic period, with changes of -0.1 in. projected in the 2020–2029 decade and +0.1 in. by mid-century.Winter cumulative precipitation averaged 2.2 in. over the 1950–2005 historic period. Under RCP4.5, winter cumulative precipitation is projected to increase 0.2 in. and 0.3 in. in the 2020–2029 decade and by mid-century, respectively. Under RCP8.5, precipitation is projected to increase 0.1 in. and .02 in. in the 2020–2029 decade and by mid-century, respectively.Spring cumulative precipitation averaged 3.4 in. over the 1950–2005 historic period. In the 2020–2029 decade, spring cumulative precipitation is projected to decrease-0.5 in. and 0.2 in. for RCP4.5 and RCP8.5, respectively. By mid-century, projections show -0.3 in. and 0 in. change under RCP4.5 and RCP8.5, respectively.
Higher energy prices are likely
Low High

26
Sector System Component
Climate/Weather Variable Influencing
Component
Influence of Climate/Weather
Variable Projected Change of Climate/Weather Variable Expected Impact on
Component Adaptive Capacity
(Low/Medium/High) Vulnerability
(Low/Medium/High)
Power and Power Distribution
Utility Electric Generation, Transmission, and Distribution systems
Utility-owned Substations and Delivered Power
Severe weather Substations and transmission lines can be damaged by storms or severe weather
The number of days with precipitation above 0.5 in. (wet days) and consecutive days with precipitation above 0.5 in. (consecutive wet days) hover about 0 for the historic period. Model projections indicate little change; under RCP4.5, number of wet days decrease 0.5 days in the 2020–2029 decade, and increase 0.3 days by mid-century. Changes in consecutive wet days see similar changes (-0.3 days in the 2020–2029 decade; +0.2 days mid-century). Under RCP8.5, number of wet days increase 0.4 days in the 2020–2029 decade, and 0.6 days by mid-century. Consecutive wet days increase 0.2 days in both periods.
The historic mean annual wind speed was 3.05 meters per second, with winter experiencing the lowest mean annual wind speed (2.59 m/s) and spring experiencing the highest (3.37 m/s). Changes in wind speed in the 2020–2029 decade are marginal across annual and seasonal timescales under both RCP4.5 and RCP8.5. Models project an annual decrease in mean wind speed on the order of 0.7% and 1.2% for RCP4.5 and RCP8.5, respectively, with spring experiencing the greatest decrease (3.5%/2.2% for RCP4.5/RCP8.5). Summer is projected to experience a minor increase under RCP4.5 (0.9%), while projections under RCP8.5 show a 1.7% decrease. Mid-term 2020–2049 changes are similar to those above, with a projected decrease in mean annual wind speed of 0.7% (RCP4.5) and 1.8% (RCP8.5), with spring experiencing the greatest decrease (3.5% for RCP4.5; 2.2% for RCP8.5) and winter experiencing the greatest increase of 0.9% under RCP4.5 (RCP8.5 shows a 1.0% decrease).
The frequency of very heavy precipitation events is expected to increase for the Northwest (Wash et al. 2014).
Increases in damage are likely
Low Medium

27
Sector System Component
Climate/Weather Variable Influencing
Component
Influence of Climate/Weather
Variable Projected Change of Climate/Weather Variable Expected Impact on
Component Adaptive Capacity
(Low/Medium/High) Vulnerability
(Low/Medium/High)
Power and Power Distribution
Onsite Substations and Transmission / Distribution Systems
Transformers and Switch Gear
Temperature At higher temperatures transformers and substation efficiency declines; energy demand increases
The historic 1950–2005 mean spring temperature was 43.3°F; projected changes in the 2020–2029 decade are +1.7°F and +2.1°F for RCP4.5 and RCP8.5, respectively. By mid-century, spring temperatures are projected to increase 2.3°F and 2.2°F for RCP4.5 and RCP8.5, respectively.The historic 1950–2005 mean summer temperature was 65.1°F; projected changes in the 2020–2029 decade are +2.9°F and +3.9°F for RCP4.5 and RCP8.5, respectively. Mid-century projections show an increase of 4.9°F under RCP4.5, and 5.2°F under RCP8.5.The historic 1950–2005 mean fall temperature was 43.9°F; projected changes in the 2020–2029 decade are +2.3°F and +3.3°F for RCP4.5 and RCP8.5, respectively. Mid-century projections show an increase of 3.2°F under RCP4.5, and 3.7°F under RCP8.5.The historic 1950–2005 mean winter (Dec., Jan., Feb.) temperature was 20.4°F. Under RCP4.5, mean temperatures will increase 1.0°F in the 2020–2029 decade, and 1.8°F by mid-century. Under RCP8.5, projected changes in the 2020–2029 decade are +2.2°F and +2.8°F by mid-century.The historic mean number of days with high temperatures at or above 90°F (hot days) was 15 and the mean number of consecutive days at or above 90°F (consecutive hot days) was 6. In the 2020–2029 decade, the number of hot days is projected to increase 16 days and 23 days for RCP4.5 and RCP8.5, respectively. Consecutive hot days will increase 5 days and 8 days for RCP4.5 and RCP8.5, respectively. Mid-century projections under RCP4.5 show +28 hot days and +12 consecutive hot days. Under RCP8.5, mid-century projections are +29 hot days and +13 consecutive hot days.The historic mean number of days with high temperature at or above 100°F (extremely hot days) and consecutive days with high temperature at or above 100°F (consecutive extremely) hot days hovered around 0. The number of extremely hot days remains relatively stable through 2020–2029, with +1 days and +2 days under RCP4.5 and RCP8.5, respectively; projections increase to +2 days and +3 days by mid-century. Additional extremely hot days in the 2020–2029 decade and by mid-century are likely to be consecutive. For a 1°C (1.8°F) increase in temperature, the National Research Council reported that burned area will double in the ecoregion that contains INL (National Research Council. 2011. Climate Stabilization Targets: Emissions, Concentrations, and Impacts over Decades to Millennia. The National Academies Press, Washington, D.C.).
Increased risk of overloading of substation and primary transformers due to the heat and the increased demand from the facilities during the summer.
Medium Medium
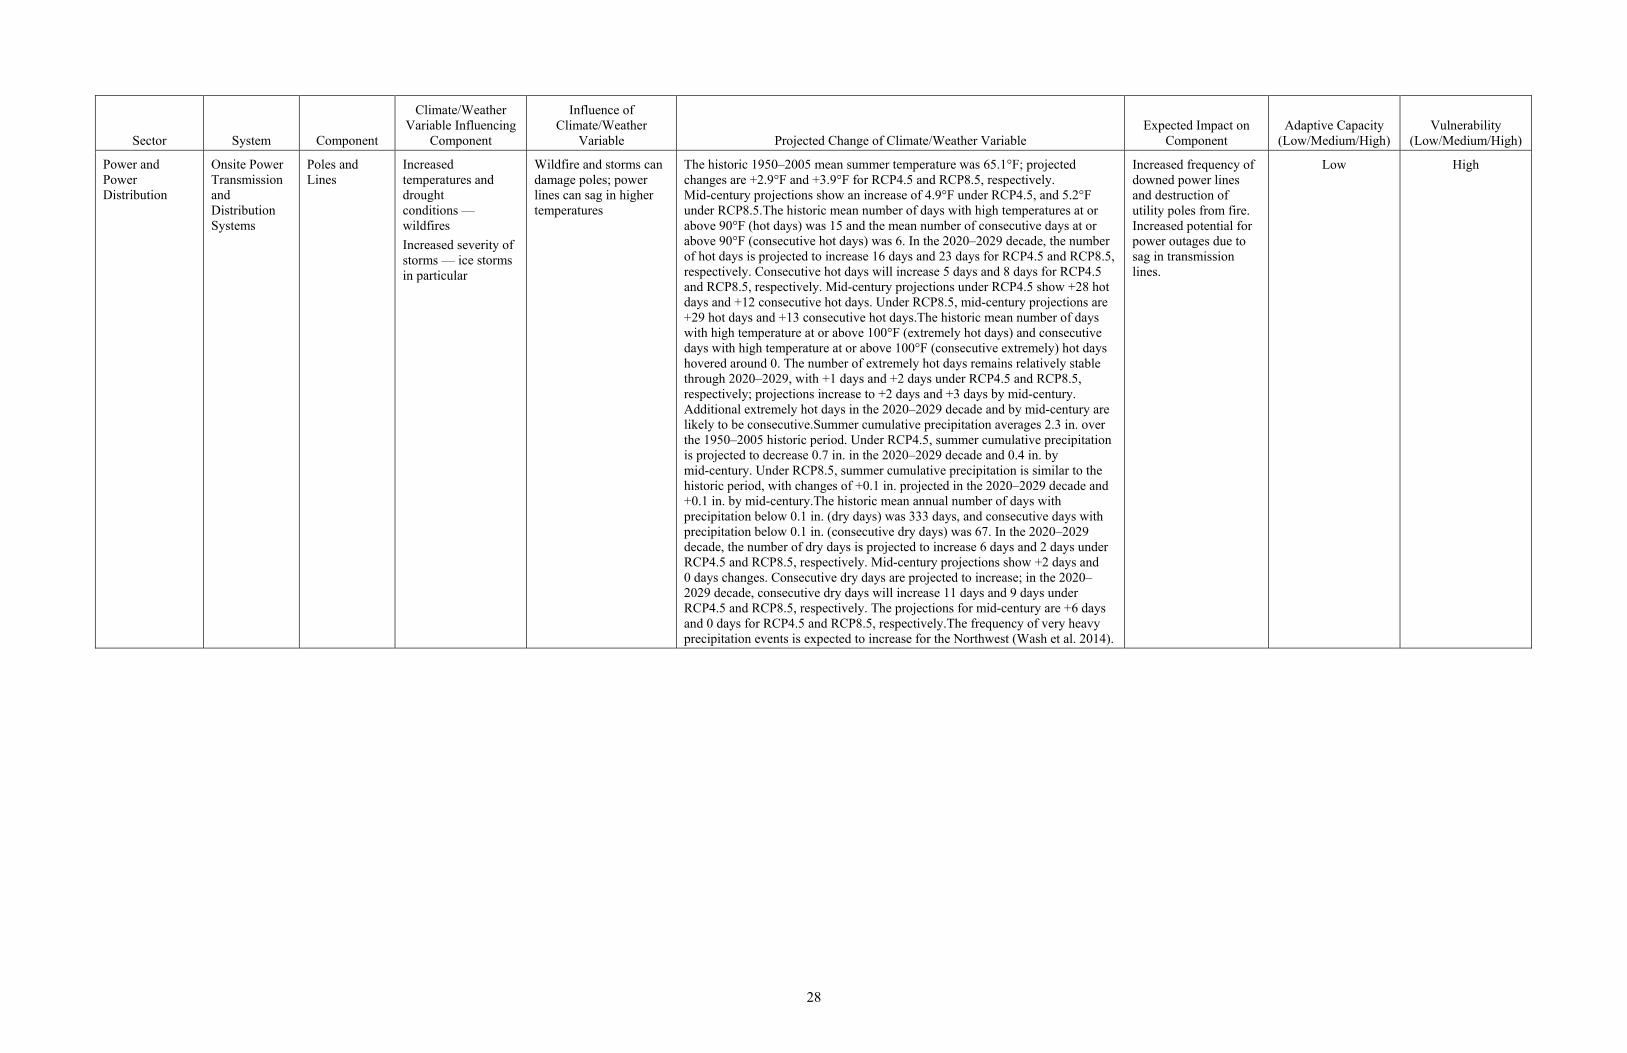
28
Sector System Component
Climate/Weather Variable Influencing
Component
Influence of Climate/Weather
Variable Projected Change of Climate/Weather Variable Expected Impact on
Component Adaptive Capacity
(Low/Medium/High) Vulnerability
(Low/Medium/High)
Power and Power Distribution
Onsite Power Transmission and Distribution Systems
Poles and Lines
Increased temperatures and drought conditions — wildfires
Increased severity of storms — ice storms in particular
Wildfire and storms can damage poles; power lines can sag in higher temperatures
The historic 1950–2005 mean summer temperature was 65.1°F; projected changes are +2.9°F and +3.9°F for RCP4.5 and RCP8.5, respectively. Mid-century projections show an increase of 4.9°F under RCP4.5, and 5.2°F under RCP8.5.The historic mean number of days with high temperatures at or above 90°F (hot days) was 15 and the mean number of consecutive days at or above 90°F (consecutive hot days) was 6. In the 2020–2029 decade, the number of hot days is projected to increase 16 days and 23 days for RCP4.5 and RCP8.5, respectively. Consecutive hot days will increase 5 days and 8 days for RCP4.5 and RCP8.5, respectively. Mid-century projections under RCP4.5 show +28 hot days and +12 consecutive hot days. Under RCP8.5, mid-century projections are +29 hot days and +13 consecutive hot days.The historic mean number of days with high temperature at or above 100°F (extremely hot days) and consecutive days with high temperature at or above 100°F (consecutive extremely) hot days hovered around 0. The number of extremely hot days remains relatively stable through 2020–2029, with +1 days and +2 days under RCP4.5 and RCP8.5, respectively; projections increase to +2 days and +3 days by mid-century. Additional extremely hot days in the 2020–2029 decade and by mid-century are likely to be consecutive.Summer cumulative precipitation averages 2.3 in. over the 1950–2005 historic period. Under RCP4.5, summer cumulative precipitation is projected to decrease 0.7 in. in the 2020–2029 decade and 0.4 in. by mid-century. Under RCP8.5, summer cumulative precipitation is similar to the historic period, with changes of +0.1 in. projected in the 2020–2029 decade and +0.1 in. by mid-century.The historic mean annual number of days with precipitation below 0.1 in. (dry days) was 333 days, and consecutive days with precipitation below 0.1 in. (consecutive dry days) was 67. In the 2020–2029 decade, the number of dry days is projected to increase 6 days and 2 days under RCP4.5 and RCP8.5, respectively. Mid-century projections show +2 days and 0 days changes. Consecutive dry days are projected to increase; in the 2020–2029 decade, consecutive dry days will increase 11 days and 9 days under RCP4.5 and RCP8.5, respectively. The projections for mid-century are +6 days and 0 days for RCP4.5 and RCP8.5, respectively.The frequency of very heavy precipitation events is expected to increase for the Northwest (Wash et al. 2014).
Increased frequency of downed power lines and destruction of utility poles from fire. Increased potential for power outages due to sag in transmission lines.
Low High
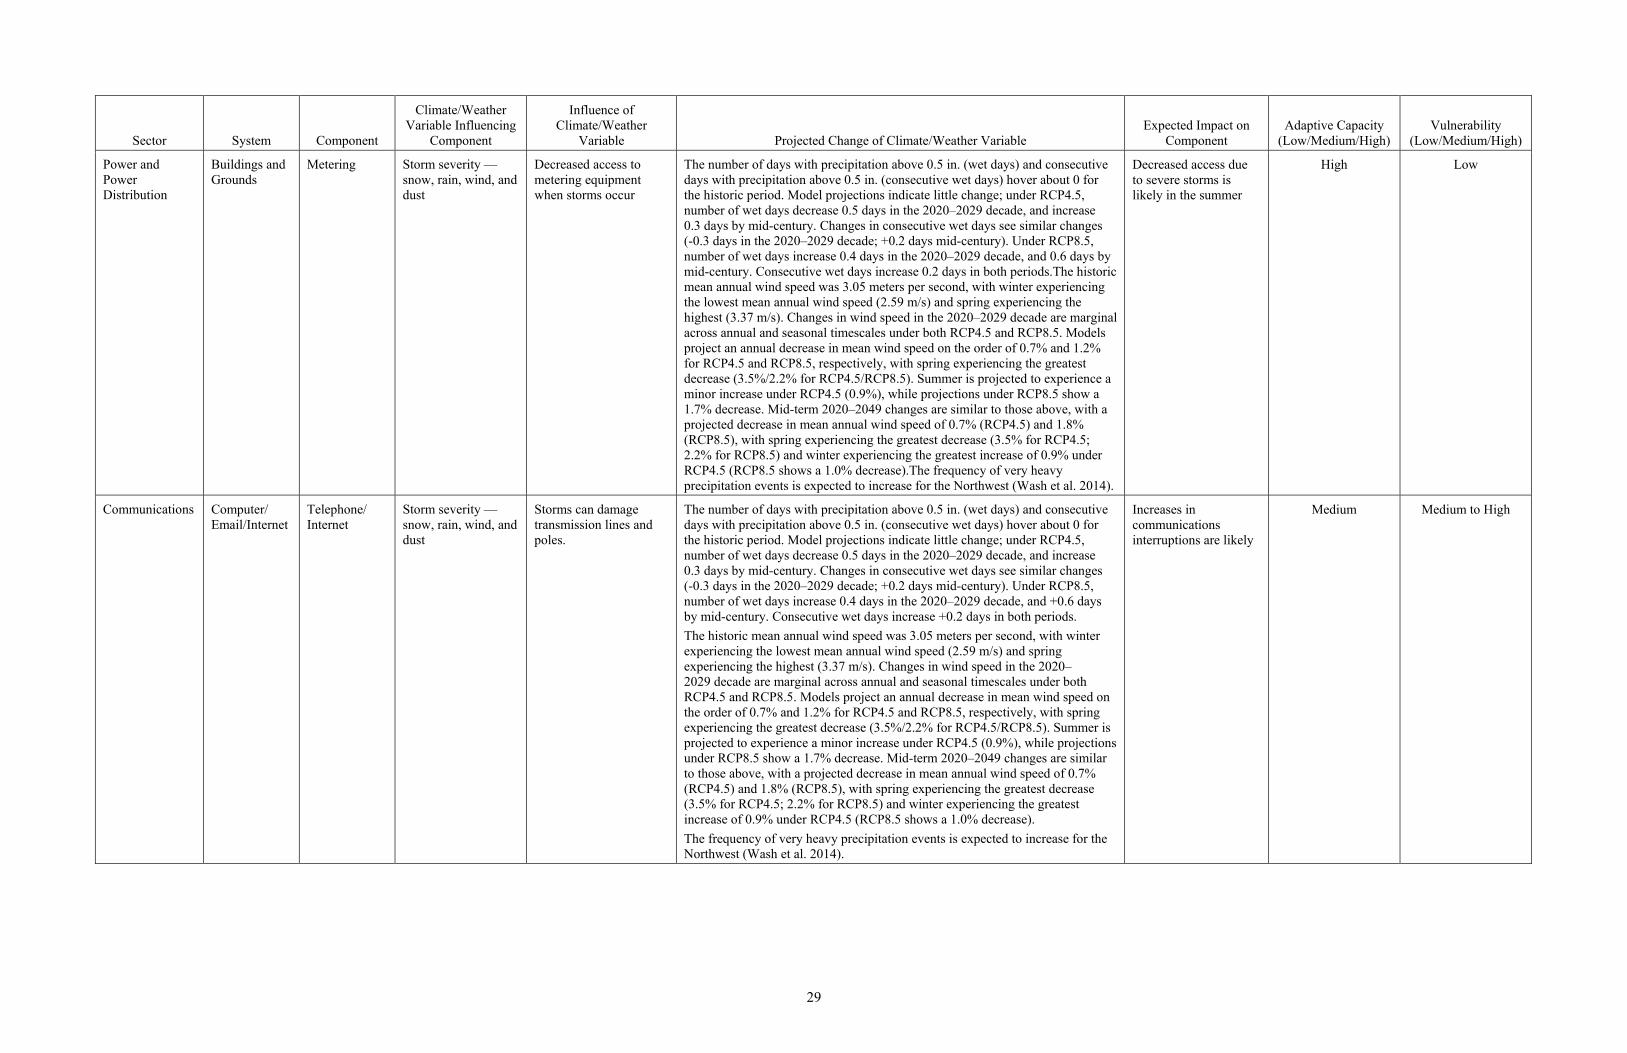
29
Sector System Component
Climate/Weather Variable Influencing
Component
Influence of Climate/Weather
Variable Projected Change of Climate/Weather Variable Expected Impact on
Component Adaptive Capacity
(Low/Medium/High) Vulnerability
(Low/Medium/High)
Power and Power Distribution
Buildings and Grounds
Metering Storm severity — snow, rain, wind, and dust
Decreased access to metering equipment when storms occur
The number of days with precipitation above 0.5 in. (wet days) and consecutive days with precipitation above 0.5 in. (consecutive wet days) hover about 0 for the historic period. Model projections indicate little change; under RCP4.5, number of wet days decrease 0.5 days in the 2020–2029 decade, and increase 0.3 days by mid-century. Changes in consecutive wet days see similar changes (-0.3 days in the 2020–2029 decade; +0.2 days mid-century). Under RCP8.5, number of wet days increase 0.4 days in the 2020–2029 decade, and 0.6 days by mid-century. Consecutive wet days increase 0.2 days in both periods.The historic mean annual wind speed was 3.05 meters per second, with winter experiencing the lowest mean annual wind speed (2.59 m/s) and spring experiencing the highest (3.37 m/s). Changes in wind speed in the 2020–2029 decade are marginal across annual and seasonal timescales under both RCP4.5 and RCP8.5. Models project an annual decrease in mean wind speed on the order of 0.7% and 1.2% for RCP4.5 and RCP8.5, respectively, with spring experiencing the greatest decrease (3.5%/2.2% for RCP4.5/RCP8.5). Summer is projected to experience a minor increase under RCP4.5 (0.9%), while projections under RCP8.5 show a 1.7% decrease. Mid-term 2020–2049 changes are similar to those above, with a projected decrease in mean annual wind speed of 0.7% (RCP4.5) and 1.8% (RCP8.5), with spring experiencing the greatest decrease (3.5% for RCP4.5; 2.2% for RCP8.5) and winter experiencing the greatest increase of 0.9% under RCP4.5 (RCP8.5 shows a 1.0% decrease).The frequency of very heavy precipitation events is expected to increase for the Northwest (Wash et al. 2014).
Decreased access due to severe storms is likely in the summer
High Low
Communications Computer/ Email/Internet
Telephone/ Internet
Storm severity — snow, rain, wind, and dust
Storms can damage transmission lines and poles.
The number of days with precipitation above 0.5 in. (wet days) and consecutive days with precipitation above 0.5 in. (consecutive wet days) hover about 0 for the historic period. Model projections indicate little change; under RCP4.5, number of wet days decrease 0.5 days in the 2020–2029 decade, and increase 0.3 days by mid-century. Changes in consecutive wet days see similar changes (-0.3 days in the 2020–2029 decade; +0.2 days mid-century). Under RCP8.5, number of wet days increase 0.4 days in the 2020–2029 decade, and +0.6 days by mid-century. Consecutive wet days increase +0.2 days in both periods.
The historic mean annual wind speed was 3.05 meters per second, with winter experiencing the lowest mean annual wind speed (2.59 m/s) and spring experiencing the highest (3.37 m/s). Changes in wind speed in the 2020–2029 decade are marginal across annual and seasonal timescales under both RCP4.5 and RCP8.5. Models project an annual decrease in mean wind speed on the order of 0.7% and 1.2% for RCP4.5 and RCP8.5, respectively, with spring experiencing the greatest decrease (3.5%/2.2% for RCP4.5/RCP8.5). Summer is projected to experience a minor increase under RCP4.5 (0.9%), while projections under RCP8.5 show a 1.7% decrease. Mid-term 2020–2049 changes are similar to those above, with a projected decrease in mean annual wind speed of 0.7% (RCP4.5) and 1.8% (RCP8.5), with spring experiencing the greatest decrease (3.5% for RCP4.5; 2.2% for RCP8.5) and winter experiencing the greatest increase of 0.9% under RCP4.5 (RCP8.5 shows a 1.0% decrease).
The frequency of very heavy precipitation events is expected to increase for the Northwest (Wash et al. 2014).
Increases in communications interruptions are likely
Medium Medium to High

30
Sector System Component
Climate/Weather Variable Influencing
Component
Influence of Climate/Weather
Variable Projected Change of Climate/Weather Variable Expected Impact on
Component Adaptive Capacity
(Low/Medium/High) Vulnerability
(Low/Medium/High)
Communications Radio Systems, Computer Networks, Data Centers, and Radiological Monitoring
Backup Power Systems
Severe weather that creates brownouts or interruptions
Backup power system needs to be turned on when primary power source fails.
The number of days with precipitation above 0.5 in. (wet days) and consecutive days with precipitation above 0.5 in. (consecutive wet days) hover about 0 for the historic period. Model projections indicate little change; under RCP4.5, number of wet days decrease 0.5 days in the 2020–2029 decade, and increase 0.3 days by mid-century. Changes in consecutive wet days see similar changes (-0.3 days in the 2020–2029 decade; +0.2 days mid-century). Under RCP8.5, number of wet days increase 0.4 days in the 2020–2029 decade, and +0.6 days by mid-century. Consecutive wet days increase 0.2 days in both periods.The historic mean annual wind speed was 3.05 meters per second, with winter experiencing the lowest mean annual wind speed (2.59 m/s) and spring experiencing the highest (3.37 m/s). Changes in wind speed in the 2020–2029 decade are marginal across annual and seasonal timescales under both RCP4.5 and RCP8.5. Models project an annual decrease in mean wind speed on the order of 0.7% and 1.2% for RCP4.5 and RCP8.5, respectively, with spring experiencing the greatest decrease (3.5%/2.2% for RCP4.5/RCP8.5). Summer is projected to experience a minor increase under RCP4.5 (0.9%), while projections under RCP8.5 show a 1.7% decrease. Mid-term 2020–2049 changes are similar to those above, with a projected decrease in mean annual wind speed of 0.7% (RCP4.5) and 1.8% (RCP8.5), with spring experiencing the greatest decrease (3.5% for RCP4.5; 2.2% for RCP8.5) and winter experiencing the greatest increase of 0.9% under RCP4.5 (RCP8.5 shows a 1.0% decrease).The frequency of very heavy precipitation events is expected to increase for the Northwest (Wash et al. 2014).
Backup power systems will likely need to operate more in the future than they have in the past
Medium Medium to High
Emergency Management
Emergency Response Resources
Firefighting equipment and labor (teams).
Summer temperatures and year round precipitation
Increased risk of fire with higher temperatures and less precipitation resulting in increased need for firefighting equipment and labor
In the upcoming 2020–2029 decade, spring, summer, and fall temperatures are projected to increase under both emission scenarios. The historic 1950–2005 mean spring temperature was 43.3°F; projected changes are +1.7°F and +2.1°F for RCP4.5 and RCP8.5, respectively. By mid-century, spring temperatures are projected to increase 2.3°F and 2.2°F for RCP4.5 and RCP8.5, respectively.
The historic 1950–2005 mean summer temperature was 65.1°F; projected changes in the 2020–2029 decade are +2.9°F and +3.9°F for RCP4.5 and RCP8.5, respectively. Mid-century projections show an increase of 4.9°F under RCP4.5, and 5.2°F under RCP8.5.
The historic 1950–2005 mean fall temperature was 43.9°F; projected changes in the 2020–2029 decade are +2.3°F and +3.3°F for RCP4.5 and RCP8.5, respectively. Mid-century projections show an increase of 3.2°F under RCP4.5, and 3.7°F under RCP8.5.
Annual cumulative precipitation averaged 10.0 in. over the 1950–2005 historic period. In the 2020–2029 decade, annual cumulative precipitation is projected to decrease 1.3 in. and 0.3 in. under RCP4.5 and RCP8.5, respectively. Mid-century projections show minor changes at -0.2 in. and +0.1 in. for RCP4.5 and RCP8.5, respectively.
Increased probability for wildland fires (Mote et al. 2014).
Increased probability for fires.
Low High

31
Sector System Component
Climate/Weather Variable Influencing
Component
Influence of Climate/Weather
Variable Projected Change of Climate/Weather Variable Expected Impact on
Component Adaptive Capacity
(Low/Medium/High) Vulnerability
(Low/Medium/High)
Transportation Fleet Operations
Onsite and Offsite Roads and Grounds
Storm severity Decreased ability of buses to navigate clogged roads, and ability of vendors to make deliveries.
The number of days with precipitation above 0.5 in. (wet days) and consecutive days with precipitation above 0.5 in. (consecutive wet days) hover about 0 for the historic period. Model projections indicate little change; under RCP4.5, number of wet days decrease 0.5 days in the 2020–2029 decade, and increase 0.3 days by mid-century. Changes in consecutive wet days see similar changes (-0.3 days in the 2020–2029 decade; +0.2 days mid-century). Under RCP8.5, number of wet days increase 0.4 days in the 2020–2029 decade, and 0.6 days by mid-century. Consecutive wet days increase 0.2 days in both periods.The historic mean annual wind speed was 3.05 meters per second, with winter experiencing the lowest mean annual wind speed (2.59 m/s) and spring experiencing the highest (3.37 m/s). Changes in wind speed in the 2020–2029 decade are marginal across annual and seasonal timescales under both RCP4.5 and RCP8.5. Models project an annual decrease in mean wind speed on the order of 0.7% and 1.2% for RCP4.5 and RCP8.5, respectively, with spring experiencing the greatest decrease (3.5%/2.2% for RCP4.5/RCP8.5). Summer is projected to experience a minor increase under RCP4.5 (0.9%), while projections under RCP8.5 show a 1.7% decrease. Mid-term 2020–2049 changes are similar to those above, with a projected decrease in mean annual wind speed of 0.7% (RCP4.5) and 1.8% (RCP8.5), with spring experiencing the greatest decrease (3.5% for RCP4.5; 2.2% for RCP8.5) and winter experiencing the greatest increase of 0.9% under RCP4.5 (RCP8.5 shows a 1.0% decrease).The frequency of very heavy precipitation events is expected to increase for the Northwest (Wash et al. 2014).
More frequent restricted access to roads is likely during the summer
High Low
Transportation Fleet Operations
Engine and Fuel Systems
Extreme/intermittent winter temperatures
Fuel gels at low temperatures
The historic mean number of days with low temperatures at or below 32°F (cold days) was 195 and the mean number of consecutive days with low temperatures at or below 32°F (consecutive cold days) was 74. In the 2020–2029 decade, the number of cold days will decrease 9 days and 16 days under RCP4.5 and RCP8.5, respectively. Consecutive cold days will likewise shorten by 6 days and 5 days for RCP4.5 and RCP8.5, respectively. Mid-century projections under RCP4.5 are -14 cold days and -7 consecutive cold days. Under RCP8.5, mid-century projections are -18 cold days, with consecutive cold days decreasing by 6 days.
The historic mean number of days with low temperatures at or below 0°F (extremely cold days) was 47 and the mean number of consecutive extreme cold days was 11. In the 2020–2029 decade, the number of extremely cold days will decrease 7 days and 14 days under RCP4.5 and RCP8.5, respectively. Consecutive extremely cold days will shorten by 2 and 4 days for RCP4.5 and RCP8.5, respectively. Mid-century projections under RCP4.5 are -12 extremely cold days and -2 consecutive extremely cold days. Under RCP8.5, mid-century projections are -17 extremely cold days and -4 consecutive extremely cold days.
Possible link between climate change and extremely low winter temperatures (sometimes referred to as associated with the “polar vortex”) has been suggested but scientific understanding remains limited.
Increases in the number of days with temperatures low enough for gelling to occur are unlikely in the future.
Medium Low

32
Sector System Component
Climate/Weather Variable Influencing
Component
Influence of Climate/Weather
Variable Projected Change of Climate/Weather Variable Expected Impact on
Component Adaptive Capacity
(Low/Medium/High) Vulnerability
(Low/Medium/High)
Transportation Fleet Operations
Fuel Usage Extreme temperatures
Increased idling for bus passenger compartment heating/cooling.
The historic mean number of days with low temperatures at or below 32°F (cold days) was 195 and the mean number of consecutive days with low temperatures at or below 32°F (consecutive cold days) was 74. In the 2020–2029 decade, the number of cold days will decrease 9 days and 16 days under RCP4.5 and RCP8.5, respectively. Consecutive cold days will likewise shorten by 6 days and 5 days for RCP4.5 and RCP8.5, respectively. Mid-century projections under RCP4.5 are -14 cold days and -7 consecutive cold days. Under RCP8.5, mid-century projections are -18 cold days, with consecutive cold days decreasing by 6 days.
The historic mean number of days with low temperatures at or below 0°F (extremely cold days) was 47 and the mean number of consecutive extreme cold days was 11. In the 2020–2029 decade, the number of extremely cold days will decrease 7 days and 14 days under RCP4.5 and RCP8.5, respectively. Consecutive extremely cold days will shorten by 2 and 4 days for RCP4.5 and RCP8.5, respectively. Mid-century projections under RCP4.5 are -12 extremely cold days and -2 consecutive extremely cold days. Under RCP8.5, mid-century projections are -17 extremely cold days and -4 consecutive extremely cold days.
Likely increase in idling occurrence during the summer, resulting in more fuel use and higher fuel costs.
High Medium
Transportation Fleet Operations
Fleet Fueling - Dispensing Equipment
Extreme/intermittent winter temperatures
Gelling of fuel could occur during transfer, but storage in underground tanks would likely not be an issue.
The historic 1950–2005 mean winter (Dec., Jan., Feb.) temperature was 20.4°F. Under RCP4.5, mean temperatures will increase 1.0°F in the 2020–2029 decade, and 1.8°F by mid-century. Under RCP8.5, projected changes in the 2020–2029 decade are +2.2°F and +2.8°F by mid-century.The historic mean number of days with low temperatures at or below 32°F (cold days) was 195 and the mean number of consecutive days with low temperatures at or below 32°F (consecutive cold days) was 74. In the 2020–2029 decade, the number of cold days will decrease 9 days and 16 days under RCP4.5 and RCP8.5, respectively. Consecutive cold days will likewise shorten by 6 days and 5 days for RCP4.5 and RCP8.5, respectively. Mid-century projections under RCP4.5 are -14 cold days and -7 consecutive cold days. Under RCP8.5, mid-century projections are -18 cold days, with consecutive cold days decreasing by 6 days.The historic mean number of days with low temperatures at or below 0°F (extremely cold days) was 47 and the mean number of consecutive extreme cold days was 11. In the 2020–2029 decade, the number of extremely cold days will decrease 7 days and 14 days under RCP4.5 and RCP8.5, respectively. Consecutive extremely cold days will shorten by 2 and 4 days for RCP4.5 and RCP8.5, respectively. Mid-century projections under RCP4.5 are -12 extremely cold days and -2 consecutive extremely cold days. Under RCP8.5, mid-century projections are -17 extremely cold days and -4 consecutive extremely cold days.Possible link between climate change and extremely low winter temperatures (sometimes referred to as associated with the “polar vortex”) has been suggested but scientific understanding remains limited.
Increased instances of fuel gelling are unlikely
Medium Low

33
Sector System Component
Climate/Weather Variable Influencing
Component
Influence of Climate/Weather
Variable Projected Change of Climate/Weather Variable Expected Impact on
Component Adaptive Capacity
(Low/Medium/High) Vulnerability
(Low/Medium/High)
Transportation Fleet Operations
Road Clearing Equipment
Strom severity — snow, rain, wind, and dust
Equipment needs to operate more often
The number of days with precipitation above 0.5 in. (wet days) and consecutive days with precipitation above 0.5 in. (consecutive wet days) hover about 0 for the historic period. Model projections indicate little change; under RCP4.5, number of wet days decrease 0.5 days in the 2020–2029 decade, and increase 0.3 days by mid-century. Changes in consecutive wet days see similar changes (-0.3 days in the 2020–2029 decade; +0.2 days mid-century). Under RCP8.5, number of wet days increase 0.4 days in the 2020–2029 decade, and 0.6 days by mid-century. Consecutive wet days increase 0.2 days in both periods.
The historic mean annual wind speed was 3.05 meters per second, with winter experiencing the lowest mean annual wind speed (2.59 m/s) and spring experiencing the highest (3.37 m/s). Changes in wind speed in the 2020–2029 decade are marginal across annual and seasonal timescales under both RCP4.5 and RCP8.5. Models project an annual decrease in mean wind speed on the order of 0.7% and 1.2% for RCP4.5 and RCP8.5, respectively, with spring experiencing the greatest decrease (3.5%/2.2% for RCP4.5/RCP8.5). Summer is projected to experience a minor increase under RCP4.5 (0.9%), while projections under RCP8.5 show a 1.7% decrease. Mid-term 2020–2049 changes are similar to those above, with a projected decrease in mean annual wind speed of 0.7% (RCP4.5) and 1.8% (RCP8.5), with spring experiencing the greatest decrease (3.5% for RCP4.5; 2.2% for RCP8.5) and winter experiencing the greatest increase of 0.9% under RCP4.5 (RCP8.5 shows a 1.0% decrease).
Increased road clearing activity likely in the summer.
High Low

34
Sector System Component
Climate/Weather Variable Influencing
Component
Influence of Climate/Weather
Variable Projected Change of Climate/Weather Variable Expected Impact on
Component Adaptive Capacity
(Low/Medium/High) Vulnerability
(Low/Medium/High)
Transportation Fleet Operations
Support Equipment
Severity and frequency of snow storms. Frequency of wildland fires. Extreme temperatures.
Equipment may be used more frequently and therefore need to be maintained more frequently; additional equipment may be necessary; equipment failures may increase
The historic mean number of days with high temperatures at or above 90°F (hot days) was 15 and the mean number of consecutive days at or above 90°F (consecutive hot days) was 6. In the 2020–2029 decade, the number of hot days is projected to increase 16 days and 23 days for RCP4.5 and RCP8.5, respectively. Consecutive hot days will increase 5 days and 8 days for RCP4.5 and RCP8.5, respectively. Mid-century projections under RCP4.5 show +28 hot days and +12 consecutive hot days. Under RCP8.5, mid-century projections are +29 hot days and +13 consecutive hot days.The historic mean number of days with high temperature at or above 100°F (extremely hot days) and consecutive days with high temperature at or above 100°F (consecutive extremely) hot days hovered around 0. The number of extremely hot days remains relatively stable through 2020–2029, with +1 days and +2 days under RCP4.5 and RCP8.5, respectively; projections increase to +2 days and +3 days by mid-century. Additional extremely hot days in the 2020–2029 decade and by mid-century are likely to be consecutive.The historic mean number of days with low temperatures at or below 32°F (cold days) was 195 and the mean number of consecutive days with low temperatures at or below 32°F (consecutive cold days) was 74. In the 2020–2029 decade, the number of cold days will decrease 9 days and 16 days under RCP4.5 and RCP8.5, respectively. Consecutive cold days will likewise shorten by 6 days and 5 days for RCP4.5 and RCP8.5, respectively. Mid-century projections under RCP4.5 are -14 cold days and -7 consecutive cold days. Under RCP8.5, mid-century projections are -18 cold days, with consecutive cold days decreasing by 6 days.The historic mean number of days with low temperatures at or below 0°F (extremely cold days) was 47 and the mean number of consecutive extreme cold days was 11. In the 2020–2029 decade, the number of extremely cold days will decrease 7 days and 14 days under RCP4.5 and RCP8.5, respectively. Consecutive extremely cold days will shorten by 2 and 4 days for RCP4.5 and RCP8.5, respectively. Mid-century projections under RCP4.5 are -12 extremely cold days and -2 consecutive extremely cold days. Under RCP8.5, mid-century projections are -17 extremely cold days and -4 consecutive extremely cold days.The number of days with precipitation above 0.5 in. (wet days) and consecutive days with precipitation above 0.5 in. (consecutive wet days) hover about 0 for the historic period. Model projections indicate little change; under RCP4.5, number of wet days decrease 0.5 days in the 2020–2029 decade, and increase 0.3 days by mid-century. Changes in consecutive wet days see similar changes (-0.3 days in the 2020–2029 decade; +0.2 days mid-century). Under RCP8.5, number of wet days increase 0.4 days in the 2020–2029 decade, and 0.6 days by mid-century. Consecutive wet days increase 0.2 days in both periods.
Likely increased maintenance of support equipment and increase in temperature related failures in the future.
High Low
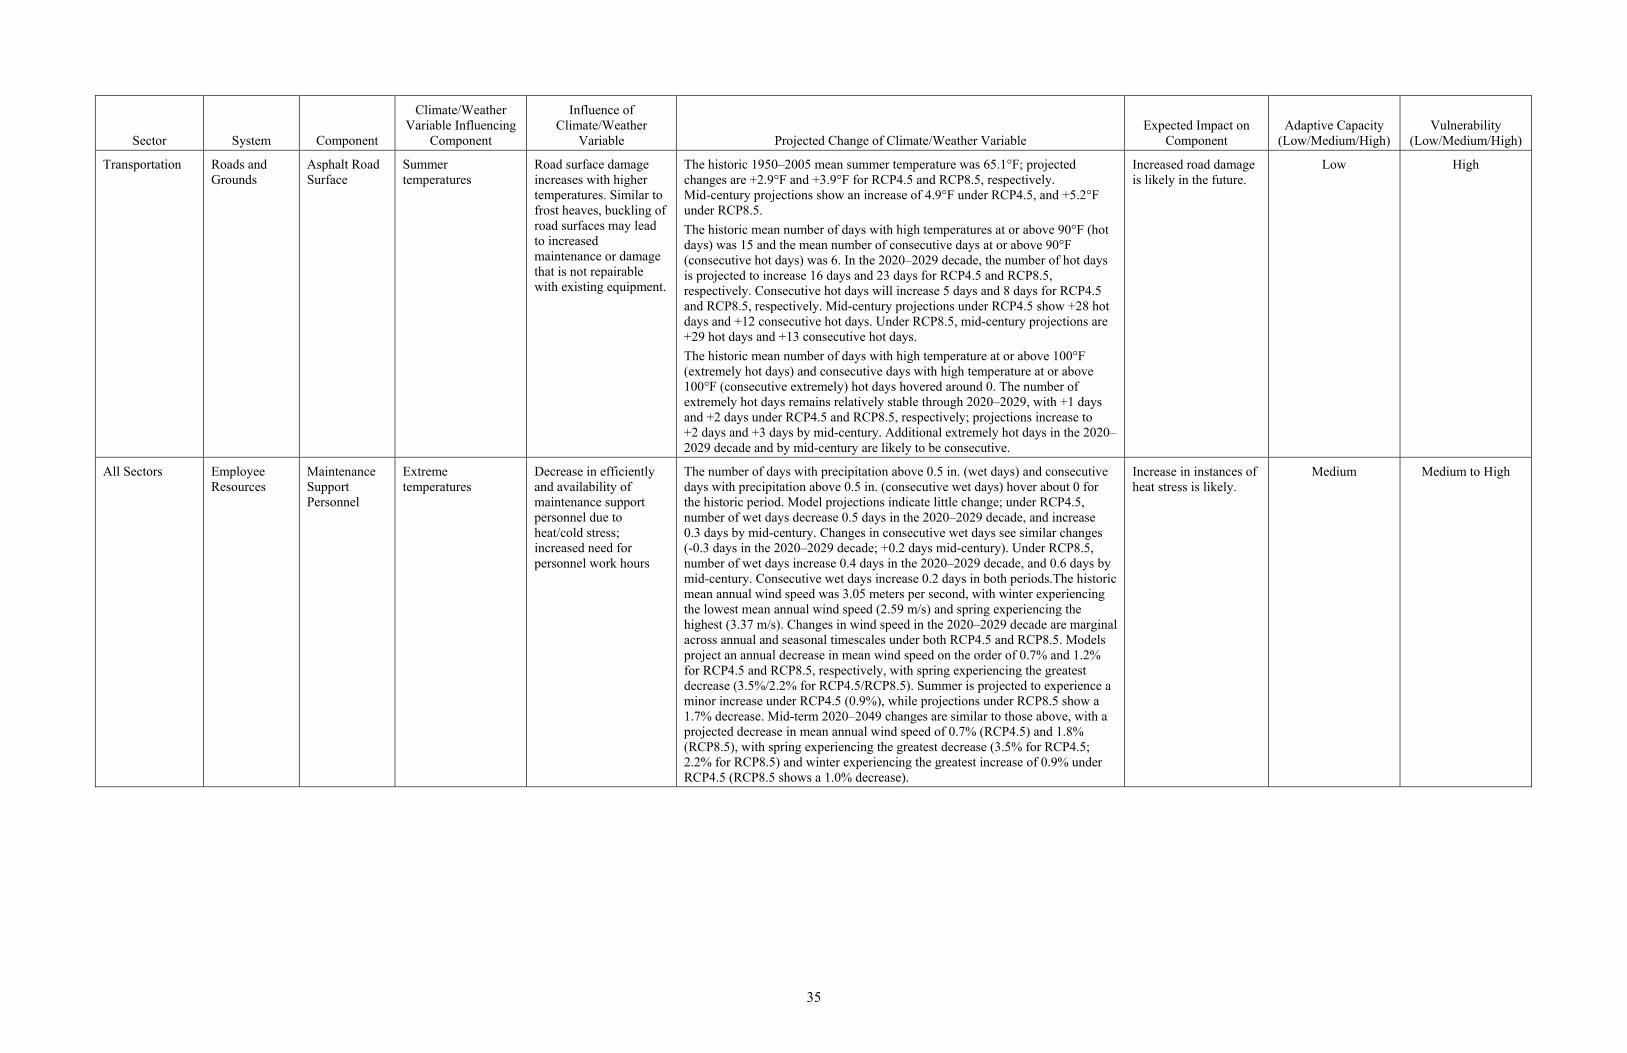
35
Sector System Component
Climate/Weather Variable Influencing
Component
Influence of Climate/Weather
Variable Projected Change of Climate/Weather Variable Expected Impact on
Component Adaptive Capacity
(Low/Medium/High) Vulnerability
(Low/Medium/High)
Transportation Roads and Grounds
Asphalt Road Surface
Summer temperatures
Road surface damage increases with higher temperatures. Similar to frost heaves, buckling of road surfaces may lead to increased maintenance or damage that is not repairable with existing equipment.
The historic 1950–2005 mean summer temperature was 65.1°F; projected changes are +2.9°F and +3.9°F for RCP4.5 and RCP8.5, respectively. Mid-century projections show an increase of 4.9°F under RCP4.5, and +5.2°F under RCP8.5.
The historic mean number of days with high temperatures at or above 90°F (hot days) was 15 and the mean number of consecutive days at or above 90°F (consecutive hot days) was 6. In the 2020–2029 decade, the number of hot days is projected to increase 16 days and 23 days for RCP4.5 and RCP8.5, respectively. Consecutive hot days will increase 5 days and 8 days for RCP4.5 and RCP8.5, respectively. Mid-century projections under RCP4.5 show +28 hot days and +12 consecutive hot days. Under RCP8.5, mid-century projections are +29 hot days and +13 consecutive hot days.
The historic mean number of days with high temperature at or above 100°F (extremely hot days) and consecutive days with high temperature at or above 100°F (consecutive extremely) hot days hovered around 0. The number of extremely hot days remains relatively stable through 2020–2029, with +1 days and +2 days under RCP4.5 and RCP8.5, respectively; projections increase to +2 days and +3 days by mid-century. Additional extremely hot days in the 2020–2029 decade and by mid-century are likely to be consecutive.
Increased road damage is likely in the future.
Low High
All Sectors Employee Resources
Maintenance Support Personnel
Extreme temperatures
Decrease in efficiently and availability of maintenance support personnel due to heat/cold stress; increased need for personnel work hours
The number of days with precipitation above 0.5 in. (wet days) and consecutive days with precipitation above 0.5 in. (consecutive wet days) hover about 0 for the historic period. Model projections indicate little change; under RCP4.5, number of wet days decrease 0.5 days in the 2020–2029 decade, and increase 0.3 days by mid-century. Changes in consecutive wet days see similar changes (-0.3 days in the 2020–2029 decade; +0.2 days mid-century). Under RCP8.5, number of wet days increase 0.4 days in the 2020–2029 decade, and 0.6 days by mid-century. Consecutive wet days increase 0.2 days in both periods.The historic mean annual wind speed was 3.05 meters per second, with winter experiencing the lowest mean annual wind speed (2.59 m/s) and spring experiencing the highest (3.37 m/s). Changes in wind speed in the 2020–2029 decade are marginal across annual and seasonal timescales under both RCP4.5 and RCP8.5. Models project an annual decrease in mean wind speed on the order of 0.7% and 1.2% for RCP4.5 and RCP8.5, respectively, with spring experiencing the greatest decrease (3.5%/2.2% for RCP4.5/RCP8.5). Summer is projected to experience a minor increase under RCP4.5 (0.9%), while projections under RCP8.5 show a 1.7% decrease. Mid-term 2020–2049 changes are similar to those above, with a projected decrease in mean annual wind speed of 0.7% (RCP4.5) and 1.8% (RCP8.5), with spring experiencing the greatest decrease (3.5% for RCP4.5; 2.2% for RCP8.5) and winter experiencing the greatest increase of 0.9% under RCP4.5 (RCP8.5 shows a 1.0% decrease).
Increase in instances of heat stress is likely.
Medium Medium to High

36
Sector System Component
Climate/Weather Variable Influencing
Component
Influence of Climate/Weather
Variable Projected Change of Climate/Weather Variable Expected Impact on
Component Adaptive Capacity
(Low/Medium/High) Vulnerability
(Low/Medium/High)
INL Footprint Collaborative Ownership
Regulatory Compliance
Agreements between Fish and Game (Protected Species and Nuisance Animals), DOE-ID, Bureau of Land Management, Tribes (Protected Landscape)
Temperature and precipitation
Higher temperatures and less precipitation could increase the probability of fire and affect the potential for cheatgrass expansion
The historic 1950–2005 mean summer temperature was 65.1°F; projected changes are +2.9°F and +3.9°F for RCP4.5 and RCP8.5, respectively. Mid-century projections show an increase of 4.9°F under RCP4.5, and 5.2°F under RCP8.5.
The historic mean number of days with high temperatures at or above 90°F (hot days) was 15 and the mean number of consecutive days at or above 90°F (consecutive hot days) was 6. In the 2020–2029 decade, the number of hot days is projected to increase 16 days and 23 days for RCP4.5 and RCP8.5, respectively. Consecutive hot days will increase 5 days and 8 days for RCP4.5 and RCP8.5, respectively. Mid-century projections under RCP4.5 show +28 hot days and +12 consecutive hot days. Under RCP8.5, mid-century projections are +29 hot days and +13 consecutive hot days.
The historic mean number of days with high temperature at or above 100°F (extremely hot days) and consecutive days with high temperature at or above 100°F (consecutive extremely) hot days hovered around 0. The number of extremely hot days remains relatively stable through 2020–2029, with +1 days and +2 days under RCP4.5 and RCP8.5, respectively; projections increase to +2 days and +3 days by mid-century. Additional extremely hot days in the 2020–2029 decade and by mid-century are likely to be consecutive.
Summer cumulative precipitation averages 2.3 in. over the 1950–2005 historic period. Under RCP4.5, summer cumulative precipitation is projected to decrease 0.7 in. in the 2020–2029 decade and 0.4 in. by mid-century. Under RCP8.5, summer cumulative precipitation is similar to the historic period, with changes of -0.1 in. projected in the 2020–2029 decade and +0.1 in. by mid-century.
The historic mean annual number of days with precipitation below 0.1 in. (dry days) was 333 days, and consecutive days with precipitation below 0.1 in. (consecutive dry days) was 67. In the 2020–2029 decade, the number of dry days is projected to increase 6 days and 2 days under RCP4.5 and RCP8.5, respectively. Mid-century projections show +2 days and 0 days changes. Consecutive dry days are projected to increase; in the 2020–2029 decade, consecutive dry days will increase 11 days and 9 days under RCP4.5 and RCP8.5, respectively. The projections for mid-century are +6 days and 0 days for RCP4.5 and RCP8.5, respectively.
Increased probability of wildland fires could trigger the need to provide restoration of land cover (e.g., for sage-grouse habitat).
Low High

37
Appendix B
INL Climate Change Exposure Methodology and Additional Results

38

39
Appendix B INL Climate Change Exposure Methodology and
Additional Results Climate metrics chosen for analysis include: annual and seasonal changes in mean temperatures;
annual and seasonal changes in precipitation; annual number of and longest consecutive stretch of hot days (days with highs exceeding 90°F), extremely hot days (days with highs exceeding 100°F), cold days (days with lows exceeding 32°F), and extremely cold days (days with lows exceeding 0°F); annual and seasonal heating and cooling degree days; and annual and seasonal changes in mean wind speed across the study region. These metrics were derived employing a similar methodology, where daily climatological variables such as minimum temperature were averaged annually, and from which a historical 1950–2005 baseline (known as a climatological normal) was calculated. The differences between the mean annual values and the climatological normal were then aggregated to the three future periods 2020–2029, 2020–2049, and 2050–2099. To calculate seasonal changes, the daily climatological variables were aggregated on a 3-month timescale, where December, January, February (DJF) correspond to winter; March, April, May (MAM) correspond to spring; June, July, August (JJA) correspond to summer; and September, October, November (SON) correspond to fall. Changes in these metrics are reported using the multi-general circulation model mean, and the standard deviation across models reports the uncertainty in projections.
Threshold-days are measures of days per year meeting or exceeding a set temperature or precipitation threshold, and are useful metrics for examining changes in extremes. To better gauge yearly changes, the UI team examined the annual number of threshold-days in addition to consecutive threshold-days, which can be indicative of longer-term heat or cold stress, drought, or changes in regional precipitation. These metrics were derived by employing a binary classification for all days from 1950–2099 across the study region; if the maximum temperature, minimum temperature, or precipitation for a day met or exceeded the set threshold the day was classified as 1; if the threshold was not met, the day was classified as 0. To obtain annual threshold-days, all 1s for each year were summed; to obtain consecutive threshold-days, the longest sequence of 1s was summed. The metrics are reported as the multi-model mean value.
Degree days are a proxy of the energy demand to heat or cool a building, and are defined relative to an 18°C (64°F) base temperature. To calculate “heating degree days,” the positive difference between the base temperature and the daily mean temperature for the study region was summed, whereas “cooling degree days” was calculated by summing the negative difference. To report degree days, both heating and cooling days were annually aggregated and averaged over the historical 1950–2005 period and the three future periods. Seasonal aggregations mirror the previous methods of averaging across the 3-month periods DJF for winter; MAM for spring; JJA for summer; and SON for fall.

40
Figure B-1. Projected trends in average annual temperature based on 20 general circulation models.
In Figure B-1, the solid blue and red lines are the smoothed multi-model mean projected change under RCP4.5 and RCP8.5, respectively. The shaded areas are 95th percentile projections, and the dark gray line shows observed departures from normal derived from 4-km gridded monthly PRISM data.
Figure B-2. Projected changes in average annual temperature based on 20 general circulation models relative to the 1950–2005 climatological normal.
In Figure B-2, the solid blue and red lines are the smoothed multi-model mean projected change under RCP4.5 and RCP8.5, respectively. The shaded areas are 95th percentile projections, and the dark gray line shows observed departures from normal derived from 4-km gridded monthly PRISM data.

41
Figure B-3. Distribution of projected average annual, winter (DJF), spring (MAM), summer (JJA), and fall (SON) temperature for climatological periods 2020–2029, 2020–2049, and 2050–2099 from 20 global climate models.
In Figure B-3, changes are relative to model results from 1950–2006. Individual model projections are represented by colored circles, the multi-model mean is indicated by the horizontal line, and the shaded boxes span two standard deviations.
Figure B-4. Changes in minimum temperature threshold-days.
In Figure B-4, projected changes under RCP 4.5 (medium greenhouse gas concentration) are in blue, changes under RCP 8.5 (high greenhouse gas concentration) are in red and historical changes about the mean are in gray. The left column shows changes in days per year, and the right column shows changes in consecutive days per year. The top row shows these changes for cold days, defined with a threshold of 32°F, while the bottom row shows changes for extremely cold days with a set threshold of 0°F.

42
Figure B-5. Changes in the annual number of wet days (days experiencing 0.5 in. or greater precipitation) and the mean annual longest consecutive stretch of wet days averaged over 20 general circulation models.
In Figure B-5, the historical period is shown in gray, with projections made under RCP 4.5 (medium greenhouse gas concentration) shown in blue and projections made under RCP 8.5 (high greenhouse gas concentration) shown in red.
Figure B-6. Changes in the annual number of dry days (days experiencing 0.1 in. or less precipitation) and the mean annual longest consecutive stretch of wet days averaged over 20 general circulation models.
In Figure B-6, the historical period is shown in gray, with projections made under RCP 4.5 (medium greenhouse gas concentration) shown in blue and projections made under RCP 8.5 (high greenhouse gas concentration) shown in red.

43
Figure B-7. Projected changes in annual and seasonal heating degree days for climatological periods 2020–2029, 2020–2049, and 2050–2099 compared to the 1950–2005 climatological average.
In Figure B-7, individual general circulation model projections are represented by colored circles, the multi-model mean is indicated by the horizontal line, and the shaded boxes span two standard deviations.
Figure B-8. Projected changes in annual and seasonal cooling degree days for climatological periods 2020–2029, 2020–2049, and 2050–2099 compared to the 1950–2005 climatological average.
In Figure B-8, individual general circulation model projections are represented by colored circles, the multi-model mean is indicated by the horizontal line, and the shaded boxes span two standard deviations.

44
Figure B-9. Projected changes in annual and seasonal wind speeds for the periods 2020–2029, 2020–2049, and 2050–2099 relative to the 1950–2005 climatological normal.
In Figure B-9, individual general circulation model projections are represented by colored circles, the multi-model mean is indicated by the horizontal line, and the shaded boxes span two standard deviations.

45
Appendix C
Climate Change Adaptations Comparisons (prepared by INL personnel)

46

47
Appendix C Climate Change Adaptations Comparisons (prepared
by INL personnel)
Site Sustainability Plans Climate Change Adaptation
C-1 DOE NATIONAL LABS ................................................................................................................ 49
C-1.1 Ames Laboratory ................................................................................................. 49
C-1.2 Argonne National Laboratory ........................................................................ 50
C-1.3 Brookhaven National Laboratory .................................................................... 51
C-1.4 Fermi National Accelerator Laboratory .......................................................... 53
C-1.5 Lawrence Berkeley National Laboratory ........................................................ 53
C-1.6 Lawrence Livermore National Laboratory ..................................................... 57
C-1.7 Los Alamos National Laboratory ..................................................................... 59
C-1.8 National Energy Technology Laboratory ...................................................... 61
C-1.9 National Renewable Energy Laboratory ........................................................ 61
C-1.10 Oak Ridge National Laboratory ........................................................................ 63
C-1.11 Pacific Northwest National Laboratory .......................................................... 64
C-1.12 Princeton Plasma Physics Laboratory ........................................................... 66
C-1.13 Sandia National Laboratory ............................................................................... 67
C-1.14 Savannah River National Laboratory .............................................................. 67
C-1.15 SLAC National Accelerator Laboratory .......................................................... 68
C-1.16 Thomas Jefferson National Accelerator Facility ......................................... 68
C-2. DOE NON-LABS ........................................................................................................................... 69
C-2.1 Office of Legacy Management .......................................................................... 69
C-2.2 Other DOE Sites/Offices ..................................................................................... 70
Other Federal Agencies Department of the Interior: http://home.doi.gov/greening/sustainability_plan/upload/2013_DOI_SSPP_website.pdf
Environmental Protection Agency: http://www.epa.gov/climatechange/pdfs/EPA-climate-change-adaptation-plan-final-for-public-comment-2-7-13.pdf
Department of Defense: http://www.acq.osd.mil/ie/download/green_energy/dod_sustainability/2012/DoD%20SSPP%20FY12-FINAL.PDF

48

49
C-1 DOE NATIONAL LABS
C-1.1 Ames Laboratory Per EO 13514, Sections 8(i) and 16, and subsequent CEQ Implementing Instructions, DOE developed
and submitted a Climate Change Adaptation Plan with its 2012 SSPP. The DOE Climate Change Adaptation Plan directs DOE Programs to ensure that all facilities address climate change adaptation in their 2013 SSPs, and establishes the following goals and objectives applicable to DOE sites:
Performance Status
Goal 1: Improve Understanding of Climate Change Effects and Impacts
- Objective 1.1: Work with other agencies to improve our understanding of climate change.
The contractor for the Ames Laboratory, Iowa State University, has established the Climate Science Program to study the cause, effects and impacts of climate change globally and locally. The program draws from the diverse areas of expertise available at Iowa State including, but not limited to, Agronomy, Chemistry, Engineering, Geological and Atmospheric Sciences, Statistics, and Natural Resource Ecology and Management.
- Objective 1.2: Work with other Federal agencies and local jurisdictions (as appropriate) to develop regional partnerships for climate change information sharing and collaboration
and
- Objective 4.2: Identify or establish and participate in regional climate change adaptation partnerships, as appropriate, for all DOE facilities
Ames Laboratory actively collaborates with other DOE laboratories and government agencies through participation in the World Energy Engineering Congress, Energy Efficiency Working Groups, and other such activities.
Goal 2: Improve Understanding of Climate Change Vulnerabilities and Risk
- Objective 2.2: Conduct detailed risk or vulnerability assessments, as appropriate, for specific DOE programs or facilities
Ames Laboratory has reviewed the April 2012 DOE High Level Analysis of Vulnerability to Climate Change, and will conduct a preliminary high-level assessment/analysis of potential major vulnerabilities to climate change by 2014. Ames Laboratory will review a climate change vulnerability/risk assessment by the ISU Climate Sciences Department to understand possible local climate change effects.
Near term challenges could include exposure to more frequent severe storm events, heat waves, flooding, drought, and related power disruptions. Longer term challenges may include exposure to sustained water shortages, increased water and energy costs as well as more frequent flooding events.
Ames Laboratory is planning to undertake specific efforts by 2015 to better understand and/or begin preparing for local climate change effects at its facilities.
Goal 4: Improve the Climate Resiliency of all DOE Sites
- Objective 4.1: Update all appropriate DOE site plans to address climate change resiliency
In addition to this SSP, the Laboratory will update related plans and procedures affected by the results of climate change contingency planning.

50
C-1.2 Argonne National Laboratory Climate change adaptation differs from climate change mitigation. Specifically, climate change
adaptation can be described as “measures to improve our ability to cope with or avoid harmful impacts and take advantage of beneficial ones, now and in the future” (source: U.S. Global Change Research Project- USGCRP).
Argonne is addressing climate change adaptation in a multifaceted manner as described in the following goals and objectives:
Goal 1: Improve the Understanding of Climate Change Effects and Impacts
Argonne’s Joint Center for Energy Storage Research brings together scientists and engineers from academia, national laboratories, and private industry, and provides them with the tools and institutional backing they need to discover new materials, accelerate technology development, and commercialize revolutionary new energy storage technologies a key component to increased use of renewables.
Another energy storage project being led by Argonne in collaboration with four partners is improvement of the high-resolution computer modeling and simulation of advanced pumped-storage (PS) hydropower facilities. Advanced PS designs have the flexibility and technical capabilities to integrate clean energy into the electric grid. PS plants work somewhat like a large battery: to “charge” the plant, relatively low-cost electricity is used to pump water uphill from a lower reservoir to a higher one, generating power to satisfy peak demand on the grid. In the area of solar photovoltaic power generation, one of several avenues of solar energy research are currently underway as part of the Argonne-Northwestern Solar Energy Research Center (ANSER), a collaborative enterprise that seeks to investigate a number of possible improvements to the current generation of photovoltaic devices. At ANSER, an Energy Frontier Research Centers established by DOE’s Office of Science, organic solar cells are of particular interest.
Argonne and the Illinois Tollway are conducting a fleet research study aimed at identifying fuel cost savings and efficiencies that will make the tollway more sustainable. Argonne researchers are looking for ways to improve fuel economy, reduce vehicle idling, and study vehicle aerodynamics.
Goal 2: Improve Understanding of Climate change Vulnerabilities and Risk
Argonne operations teams regularly evaluate risks to the site’s critical systems. In FY 2012, a risk-based reliability assessment was completed to evaluate vulnerabilities of the central chilled water system and electrical system. In FY 2013, a Feasibility Study of Redundancy Options for Industrial Water Supply was conducted, determining a methodology to increase the stability of supply for industrial cooling water using wastewater and municipal water.
Integrating renewable, distributed generation sources presents a different challenge. Demand and production patterns are being altered radically by the advent of smart grids, renewable generation, hybrid electric vehicles, and storage technologies. To address these challenges, Argonne is working on developing, analyzing, and integrating predictive models of system behavior, new optimization-based sampling approaches, and scalable algorithms with a goal to ensure the efficiency and resiliency of critical energy systems. The findings will be applied to DOE mission-critical problems: next-generation architectures for electricity generation, storage, and distribution; predictive control of cascading blackouts; and real-time contingency analysis.
NOTE: Goal 3 of the DOE Climate Change Adaptation Plan has been excluded from this section as it is not applicable to individual sites.

51
Goal 4: Improve the Climate Resiliency of all DOE Sites
In addition to the SSP, Argonne plans to update its other related plans and strategies to address climate change adaptation considerations (e.g., its site modernization plan, as well as infrastructure and construction specifications).
At a research level, in order to determine the complex interconnectedness between factors that influence climate, Argonne is working with partners to develop next generation high performance pre-exascale computing.
The existing supercomputing facility Mira is being used at Argonne for various simulations, including climate change-related projects. For example, the Mira computing facility is used to understand the role of clouds in climate. The goal of this project is to explore the frontier of weather prediction and climate modeling with the newly developed Geophysical Fluid Dynamics Laboratory’s global cloud-resolving model, and to validate the global cloud-resolving climate models via hurricane hindcasts.
C-1.3 Brookhaven National Laboratory
Climate Change Effects and Impacts
Objective 1.1: Work with other agencies to improve our understanding of climate change
The Atmospheric Science Division in the Department of Environmental Sciences at BNL has a Science Focus Area award from DOE to study the effects of clouds and aerosols on climate forcing, as well as a separate award focused on improving the representation of clouds in climate models at the global down to regional scale. The Department has strong research collaborations with NASA-Goddard Institute for Space Studies and the National Oceanic and Atmospheric Administration’s (NOAA’s) Geophysical Fluid Dynamic Laboratory at Princeton. These collaborations will continue and will be expanded if appropriate.
Objective 1.2: Work with other Federal agencies and local jurisdictions (as appropriate) to develop regional partnerships for climate change information sharing and collaboration
BNL is a major partner in the Atmospheric Radiation Measurement (ARM) Climate Research Facility within DOE. The ARM Climate Research Facility provides data on atmospheric conditions around the world. BNL ARM-funded staff develop and maintain state-of-the-art instrumentation, data analysis techniques, data interpretation, and web-based data retrieval and visualization tools. The department also manages meteorological instrumentation on-site. The data collected by BNL staff scientists is shared through the ARM facility as well as through publications with other agencies and researchers.
The Environmental Science Department provides detailed meteorological data to evaluate the performance of the LISF, which is a partnership between BNL and LIPA.
Vulnerabilities and Risk
Objective 2.2: Conduct detailed risk or vulnerability assessments, as appropriate, for specific DOE programs or facilities
One of the anticipated outcomes of BNL’s effort in the NYS Resiliency Institute for Storm and Emergencies consortium is a better assessment of the risk for landfall hurricanes on Long Island. Hurricanes can lead to a major disruption of Laboratory operations, infrastructure and services in the surrounding communities, and prevent employees living in high-risk areas to come to work even if the Laboratory is functioning.

52
Larger-scale global models will provide guidance on average temperature changes as well as the likelihood of changes in precipitation and heat waves, which can affect operations, employee health, and on‐site energy demand. The effort to develop a regional climate model may provide predictions at a spatially more resolved scale than current global models.
The on‐site meteorology station provides real-time data on current weather conditions via a publicly accessible webpage. The site provides historical data as well as forecasts.
Climate Resiliency
Objective 4.1: Update all appropriate DOE site plans to address climate change resiliency
BNL continues to refine hurricane and storm preparedness, including updating employee personal contact information. During hurricanes and other events, the Office of Emergency Management (OEM) uses the Everbridge Mass Notification System to send urgent messages to Laboratory employees via email, text messaging, and voice messages. In addition, an emergency notification banner is posted on the BNL’s internal and external homepages and a Laboratory-wide broadcast email is sent to every @bnl.gov address.
In October 2012, the site experienced the effects of a record hurricane, Sandy, which impacted most of the northeast. Most utility systems remained operational during this event. The greatest effects were those of downed trees and minor building envelope issues. Significant upfront planning was initiated for this storm to understand building vulnerabilities and potential effects on the science mission. Directly after the storm, Preliminary Damage Assessment (PDA) Teams were directed by OEM to begin the process of assessing the site and restoring services. As a direct result of planning and coordination, the overall impact to BNL was minimal and there was no major impact to any ongoing project on-site. BNL was able to re-open for business earlier than planned, which provided a significant cost savings to BNL and DOE, and enabled researchers to continue their experiments.
In February 2013, BNL experienced another severe weather event with Winter Storm Nemo, which resulted in historic snowfall of 30+ inches. OEM implemented the Severe Weather Plan and closed the Laboratory to all but emergency personnel. As a result of planning and recovery efforts, there was no disruption to any BNL mission essential functions. A three-phased Damage Assessment Plan was implemented for storm recovery.
Another area of focus is how the regional electric grids function and perform during severe weather events and other major events. Through the Governor’s Regional Economic Development Initiative, support has been provided for SGRID3. SGRID3 combines resources from SBU’s AERTC with BNL to create two leading edge facilities and establish New York as the undisputed leader in design and control of “smarter grid” systems and technology development and deployment. SGRID3 will provide a laboratory for proving existing technologies, developing needed technologies, and improving operational effectiveness.
Objective 4.2: Identify or establish and participate in regional climate change adaptation partnerships
BNL is a partner in a new consortium formed in the aftermath of Superstorm Sandy. The consortium, NYS Resiliency Institute for Storm and Emergencies, is funded by the State and spearheaded by SBU and New York University. BNL contributes in three areas: 1) Improvement of long-range data for long-lead prediction of landfall hurricanes affecting the NY area; 2) Data-driven analysis of the impact of storm on power distribution systems; and 3) Simulation and visualization of storm surge levels on community scales on the web and on the Virtual Reality Deck, a high definition, large-scale visualization system located at SBU.

53
In order to establish leadership in renewable energy and sustainability in the northeast, BNL has developed strong relationships with NYSERDA and the New York State Smart Grid Consortium (NYSSGC). BNL has also developed a strong presence in energy storage and solar energy as a member of the New York Battery and Energy Storage Technology Consortium (NYBEST) and research partner with the U.S. Photovoltaic Manufacturing Consortium (PVMC), respectively.
In October 2012, BNL hosted a highly successful DOE State Energy Advisory Board (STEAB) meeting. The STEAB develops recommendations for the DOE and Congress regarding initiation, design, implementation, and evaluation of federal energy efficiency and renewable energy programs. STEAB praised BNL as a model for leadership and engagement in working with NYS and regional entities, including NYSERDA, LIPA, NYSSGC, and NYBEST.
C-1.4 Fermi National Accelerator Laboratory Unable to find a Site Sustainability Plan
C-1.5 Lawrence Berkeley National Laboratory
Climate Change Adaptation
Work with other agencies to improve our understanding of climate change
Work with other Federal agencies and local jurisdictions (as appropriate) to develop regional partnerships for climate change information sharing and collaboration
Conduct a site specific detailed risk or vulnerability assessment
Updates to appropriate site emergency response, sustainability planning and other appropriate documents to address change resiliency
Identify or establish and participate in regional climate change adaptation partnerships
The changing global climate will impact Berkeley Lab operations and research programs. Some of these expected impacts will require adjustments to Berkeley Lab operations, may lead to occasional disruptions in operations and could affect the cost of doing business. On the other hand, climate change has already created opportunities for LBNL research programs to seek out adaptation solutions.
Potential impacts to Berkeley Lab from climate change include:
Increasingly scarce and competitive regional water supplies used in providing LBNL sites and programs with electricity, process use water, or domestic use water,
Declining springtime snowpack in the northwest, where a large portion of LBNL’s electrical supply is generated for the Western Area Power Administration, would reduce summer stream flows, with potential reductions in hydro-electric power generation,
Higher frequency of extreme weather events leading to increasing temperature, drought, urban- wildland wildfire and invasive plant species,
Extreme weather events produce an increased frequency and altered timing of flooding that increases risks to people, ecosystems and infrastructure and
Significant sea-level rise and storm surge could impact existing or future off-site facilities.

54
As stated in Berkeley Lab’s Long Range Development Plan, its environmental research programs will continue to address the major challenge presented by climate change. A new generation of bioscience laboratories will be required to reveal the molecular mechanisms of living systems’ adaptation and response to their environment, utilize microbes and plants to provide a new basis for fuels production, develop biological processes for legacy waste cleanup and sequester carbon to reduce the advancement of global warming.
While LBNL has yet to formalize a policy on how it intends to adapt to predicted climate changes for both routine operations and emergency response situations, the topic is already influencing programs at the site within the Lab’s Energy and Environmental Sciences, Biosciences and Computing Sciences Directorates that seek world class solutions to help fight the climate change problem. Some of the most active include the Lab’s Carbon Cycle 2.0 Initiative and research programs in its Computational Research, Earth Sciences and Environmental Energy Technologies Divisions.
In early 2010, Berkeley Lab Director Paul Alivisatos announced the creation of the Carbon Cycle 2.0 Initiative. The objective of this initiative is to stimulate innovative, cross-disciplinary research that will accelerate the development of a carbon-neutral global energy system. By connecting researchers in basic energy sciences with experts in energy analysis, climate modeling and the developing world, Berkeley Lab aims to join bench-top science with global needs and realities, to speed and scale new energy technologies into widespread use.
Research areas that this initiative focuses on include:
Artificial Photosynthesis
Biofuels
Carbon Capture and Storage
Combustion
Energy Efficiency
Energy Storage
Photovoltaic Solar Cells
Using the computational power of onsite facilities like the National Energy Research Scientific Computing Center, researchers in the Computational Research Division collaborate with the world-wide climate science community to analyze and visualize massive climate data sets that aid in the understanding of how our climate is changing. Researchers also design, develop and deploy leading-edge computer vision, image processing and analysis technology to aid science researchers in understanding how to best store carbon dioxide in porous media.
The Earth Sciences Division's Climate Sciences Department is dedicated to atmospheric and climate science. With roughly a dozen distinguished scientists, specialists and technicians, this world-class team leads the Division towards creating a new kind of climate model, integrating cutting-edge climate science, such as the pioneering work on the carbon cycle conducted at the Lab and drawing on work by scientists at UC Berkeley and other universities and national laboratories. The goal is not to predict climate alone, but also to predict the interactions among climate, water and energy on a global scale, therefore improving our ability to adapt to these changes.

55
Research in the Environmental Energy Technologies Division is aimed at understanding the factors and associated feedback mechanisms driving global climate change and its consequences as these consequences will have major effects on the world's environment, the economy and the health of humans and ecosystems. Areas where the Division has significant investments in climate change research include:
Global climate modeling and development
Global and regional climate change and past/future trends
Uncertainties in long-term climate effects
Aerosol-cloud-climate interactions
Role of deep convective and mixed-phase stratus cloud systems on climate
Climate impact assessment
Implications for wildfire
Air quality and health effects
Impacts of changes in precipitation on crops
Economic impacts
Impacts on the insurance industry
Synergisms between technologies and strategies for adaptation and mitigation
In performing this research, scientists collaborate with several government agencies, including the U.S. Department of Energy, U.S. Environmental Protection Agency, U.S. Agency for International Development and the National Aeronautics and Space Administration, plus The Intergovernmental Panel on Climate Change.
Performance Status
The Carbon Cycle 2.0 Initiative has a very visible presence. The Initiative sponsors dozens of events each year to highlight crosscutting research in one of the focus areas. Hosted events in FY 2013 included:
Weekly seminars given by recipients of Laboratory Directed Research and Development awards related to climate and energy.
Big Questions in Energy seminars aimed at answering the most pressing questions in energy and how they can be addressed. “What is Fracking?” was the topic of one such seminar.
The Initiative also promotes the Center for Information Technology Research in the Interest of Society (CITRIS) Research Exchange Seminar Series. CITRIS is an institution involving four University of California campuses; Berkeley, Davis, Merced and Santa Cruz. The Research Exchange Seminar Series is a weekly roundtable of presentations and discussions that highlights ways to frame and tackle societal-scale research issues.
Some of the research highlights from FY 2013 involving climate change adaptation include the following:
Researchers in Computational Research Division and Earth Sciences Division were lead authors of chapters on long-term climate change projections and climate models in the recently released Fifth Assessment Report of the Intergovernmental Panel on Climate Change.
In a perspective written for the journal Nature Climate Change, Environmental Energy Technologies Division researchers showed how energy models can reduce a data center’s footprint through different carbon management strategies.

56
Earth Sciences Division research published in the journal Nature Geoscience maps how Earth’s myriad climates and the ecosystems that depend on them will move from one area to another as global temperatures rise. The research foresees big changes for boreal forests, which as they shift north, will relinquish more trapped carbon than most current climate models predict.
A special Earth Day edition of Berkeley Lab’s Science at the Theater —”How Hot Will It Get?” — attracted a full house of 600 to the Berkeley Repertory Theatre in downtown Berkeley while another 300 watched the show online via a live stream option. Lab climate scientists and a UC Berkeley economist presented the latest projections about the extent of planetary warming and the dire consequences of our growing carbon imbalance.
Environmental Energy Technologies Division researchers examined how our electricity system will respond to global warming as the century proceeds. They found that as climate change is expected to bring hotter and longer heat waves, more frequent wildfires and rising sea levels, our power plants, transmission lines and substations will be at greater risk of damage and inefficiencies.
The insurance industry, the world’s largest business with $4.6 trillion in revenues, is making larger efforts to manage climate change-related risks, according to a study by a researcher in the Environmental Energy Technologies Division. The study’s author said that weather and climate-related insurance losses “have more than doubled each decade since the 1980s, adjusted for inflation. Insurers have become quite adept at quantifying and managing the risks of climate change and using their market presence to drive broader societal efforts at mitigation and adaptation.” Hurricane Sandy is only the most recent U.S. example of the kinds of increasing liabilities posed by severe weather events in a changing climate
At the annual meeting of the American Geophysical Union in San Francisco, Berkeley Lab scientists from the Computational Research Division presented how their real-time Weather Risk Attribution Forecast system seeks to understand how much greenhouse gas emissions influence the risk of extreme weather events. The project was just awarded a DOE INCITE grant of 150 million supercomputing hours, which they intend to use to run their model at resolutions as small as 25 kilometers, which will enable them to analyze the risks of short-term storms and other severe weather.
Also at the annual American Geophysical Union meeting, other Lab researchers in the in the Environmental Energy Technologies Division presented their findings that atmospheric warming may necessitate up to 38% additional peak generation capacity and up to 31% additional transmission capacity in California alone by the end of the century. Further, up to 25 coastal power plants and 86 substations are at risk of flooding or compromised operation due to sea level rise and storm surges. However, the study concluded that large negative impacts from climate change are avoidable.
Plans and Projected Performance
In FY 2014 and future years, Berkeley Lab expects to ever increase its commitment to adapting to climate change in several ways. The reason for doing so is simple. Research findings from the Lab’s own programs continue to show the inevitability and consequences of climate change. Out of necessity, Berkeley Lab will need to develop plans to adapt its routine and emergency operations for a changing climate. The Lab will continue implementing its numerous sustainability initiatives, all aimed at reducing its environmental impact and carbon footprint. And finally, Lab research programs will continue to play a pivotal role in cutting edge research aimed at improving our ability to cope with or avoid harmful impacts of climate change.

57
C-1.6 Lawrence Livermore National Laboratory LLNL is addressing climate change and climate change adaptation both internally for the site, and
externally for its stakeholders. Internally, LLNL has incorporated climate change adaptation planning as a part of its status as an NNSA lab, with services and equipment critical to the security of the nation. These capabilities, including the NARAC, the Biodefense Knowledge Center, and NIF, necessitate resilience with respect to extreme weather events, changes in heat and precipitation, and sea level. For its external stakeholders, LLNL views assistance in planning for climate change adaptation as a part of its mission, “to ensure the safety and security of the nation through applied science and technology.” In the following section, details to internal and external activities in climate change adaptation are presented.
Developing Resilience to Climate Change Adaptation for the LLNL Site
There are numerous ways that climate change could impact the LLNL site, directly and indirectly. These include:
Heat waves
Wildfires
Sea level change
Changes in precipitation
The degree to which these impacts affect the lab varies. The table below summarizes how these impacts trigger site-relevant events, the relative degree of those events, and ongoing actions for adapting to those impacts. It should be noted that LLNL climate scientists have reported that forecasts at the local scale can be highly uncertain. In particular, multiple climate and weather forecasts for the San Francisco Bay Area have shown divergent trends in temperature and precipitation forecasts. While the LLNL site may see no change to average local temperature or precipitation, LLNL is prepared for a multitude of climate change impacts in the following ways:
Climate Impact Regional Impact
Site-Relevant Events
Degree of Importance of those Events
LLNL Adaptation to those Events
Heat Waves Increased local temperature
Greater cooling needs in buildings, increased costs and GHGs expended in cooling buildings
Medium LLNL is working to make its building more responsive to temperature changes, and building more efficient buildings that will use less energy in the future.
Heat waves California-wide strains on the electrical system
Black-outs or brown-outs of local electrical grid
High LLNL has sufficient electrical backup for the site as part of its electric plan.
Wildfires Increased risk to Site 300
Transportation challenges to staff, suppliers and stakeholders
Low Site 300 constantly manages its open space through controlled burns and other approaches.
Sea Level Change
Increase sea level of San Francisco Bay
Transportation challenges to staff, suppliers, and stakeholders
Low LLNL works with local transportation organizations to provide alerts and planning assistance to its employees.

58
Climate Impact Regional Impact
Site-Relevant Events
Degree of Importance of those Events
LLNL Adaptation to those Events
Changes in Precipitation
Drought Reduced water availability for cooling water
Medium LLNL is able to access two separate and different water sources, one from the Sierra Nevada, one a local source. It is unlikely that both sources will be impacted. In addition, the site is exploring non-water based cooling techniques for future facility electrical cooling needs.
Changes in Precipitation
Drought Reduced water availability for vegetation
Low LLNL is progressing towards drought resistant landscaping, and captures rainwater through the Water Conservation Test Bed Project.
Changes in Precipitation
Flood Site flooding and impacts to local transportation
Medium LLNL is in constant communication with local and regional planning departments, including water runoff, and long-term planning as a part of that discussion.
External Stakeholder Assistance to Climate Change Adaptation
As part of its mission to assist the nation and its partners in Energy and Environmental security, LLNL seeks to “advance science to better understand climate change and its impacts and develop technologies supportive of a carbon-free energy future.” LLNL contributes to efforts in climate change adaptation in two ways, in advancing climate science, and in delivering expert opinion and advice on the impacts of climate change to its different stakeholders.
Advancing Climate Science
LLNL’s PCMDI is the cornerstone of the scientific community’s climate change research. Since 1989, PCMDI has been leading efforts to develop improved methods and tools for the diagnosis and intercomparison of general circulation models that simulate the global climate. These models of climate change, from collaborators worldwide, are used to determine the potential impacts of climate change on the civilization, and used to assess the potential impacts of that change. PCMDI enables a non-biased comparison of techniques and model results, resulting in a level of rigor in climate modeling that is unsurpassed. As a result of PCMDI’s contributions, the Intergovernmental Panel on Climate Change (IPCC), who reports on scientific conclusions from climate change modeling, was awarded the Nobel Prize in 2007.

59
Stakeholder Guidance on Climate Change Adaptation
LLNL scientists have long been working with stakeholders on efforts to quantify the impacts and risks of climate change to the human and natural environment, as well as on the economy, and international and domestic security. In addition to working with its federal partners (e.g., the Departments of Defense, Agriculture, Homeland Security, Intelligence Agencies), LLNL scientists have contributed to climate change adaptation planning efforts by the Department of Energy’s Sustainability Performance Office, the City of Livermore, and the San Francisco Bay Area.
C-1.7 Los Alamos National Laboratory
GOAL 9: Climate Change Adaptation
Goal: Improve Understanding of Climate Change Effects and Impacts
Objective: Work with other agencies to improve our understanding of climate change.
- LANL is the leading DOE site for research in climate and ecosystem programs. The atmosphere, Climate, and Ecosystem Science Team at Los Alamos develops and applies numerical models to a range of atmospheric phenomena: including coupled wildfire atmosphere interactions, wind energy optimization, and regional climate impacts at high latitude. DOE’s Atmospheric Radiation Measurement climate research facility sites, operated by LANL, are in the Tropical Western Pacific, as well as mobile research facilities recently deployed in China and India, and currently deployed in Cape Cod.
- LANL contributes to the DOE-BER Next Generation Ecosystem Experiment to examine climate change impacts and feedbacks in sensitive Arctic landscapes. Los Alamos researchers also study the impact of fire emissions and aerosol-cloud- precipitation interactions on global climate, improved sensing and attribution of greenhouse gas emissions across multiple scales, and validation of satellite greenhouse gas observations. Scientists at Los Alamos also use field observations, manipulations and modeling to quantify the response of ecosystems to climate variability, including increasing frequency and magnitude of droughts, and feedbacks on climate through the release of stored carbon. As a leader in climate sciences, Los Alamos scientists strive to integrate terrestrial and atmospheric measurements, mechanistic understanding, and numerical simulation to improve prediction of regional and global climate change impacts.
- Laboratory’s Directed Research and Development program for research includes a Scientific Pillar to discover climate and energy impact signatures to facilitate mitigation of energy-use impacts, by developing signal detection hardware, computation and analytical techniques.
- LANL has one of the largest supercomputing centers, with massive resources being used for applied scientific simulation of climate change prediction. The result is a unique and tight integration of theory, modeling, and computational science being developed and utilized for climate change modeling and risk assessment.
Objective: Work with other Federal agencies and local jurisdictions to develop regional partnerships for climate change information sharing and collaboration.
- Using tree-ring growth record with historic information, climate records and, computer model projections of future climate trends; a team of scientists from LANL, the U.S. Geological Survey, University of Arizona, and several other partner organizations predicted the future of trees in the southwestern United States. Described in a paper published in Nature Climate Change in October, 2012, “Temperature as a potent driver of regional forest drought stress and tree mortality,” the team concluded that in the warmer and drier Southwest of the near future, widespread tree mortality will cause forest and species distributions to change substantially.
60
Goal: Improve Understanding of Climate Change Vulnerabilities and Risk
Objective: Conduct detailed risk or vulnerability assessments, as appropriate, for specific DOE programs or facilities.
- The Laboratory’s long-time planning also includes addressing land management challenges with plans to develop an Integrated Land Management Plan that addresses large scale environmental changes in the region in 20, 40, and 70 years. Significant temperature and habitat changes are predicted for the region of Northern New Mexico around Los Alamos. In 2013 an Integrated Land Management Plan was outlined to be developed in 2014 to address future environmental changes to the Los Alamos site over the next 70 years.
Goal: Improve the Climate Resiliency of all DOE Sites
Objective: Update all appropriate DOE site plans to address climate change resiliency.
Climate models project substantial changes in New Mexico’s climate over the next fifty to one hundred years, if no measures are taken to reduce global greenhouse gas emissions. Projected climate changes in New Mexico in the next 50 years are predicted to have air temperatures warmer by 6-12°F on average.
The Long-Term Strategy sets forth the following long-term environmental grand challenges and objectives, which the Laboratory will achieve through integration of the Laboratory’s environmental and operational programs, providing a coordinated approach to environmental stewardship. Each goal is accompanied by a series of objectives and strategies within projected climate-driven environmental changes:
- Grand Challenge 1: Collaborate with our stakeholders and tribal governments to ensure that LANL’s impact on the environment is as low as reasonably achievable.
- Grand Challenge 2: Remove or stabilize pollutants from the Manhattan Project and Cold War eras.
- Grand Challenge 3: Protect water resource quality and reduce water use.
- Grand Challenge 4: Eliminate industrial emissions, discharges and releases to the environment.
- Grand Challenge 5: Protect human and environmental health by managing and restoring lands.
- Grand Challenge 6: Produce zero radioactive, hazardous, liquid, or solid wastes.
- Grand Challenge 7: Use energy efficiently while creating sustainable energy resources. The Laboratory will be implementing the objectives through the Laboratory’s ISO 14001 registered EMS. Climate resiliency and adaption to changes to the changes on the Laboratory’s landscape and environment are specifically addressed in the plan. In addition, the Integrated Land Management Plan will address environmental resiliency to climate changes through adaptive forest health management practices.
Objective: Identify or establish and participate in regional climate change adaptation partnerships, as appropriate, for all DOE facilities
- In addition to the Long-term Strategy for Environmental Stewardship and Sustainability. LANL is a partner in the National Environmental Research Parks. The Parks were formally created in the 1970’s following passage of the National Environmental Policy Act (1969). As specified by the Department of Energy in 1976, the charter of the Environmental Research Parks is to assess, monitor and predict the environmental impact of energy use and other human activities. Los Alamos is looking to build on the partnerships with the other eight Research Parks and develop integrated research plans for climate change adaption and effects.

61
- LANL has a strong relationship with our neighbors at Bandelier National Monument where we have several long-term collaborative research projects investigating the impacts of drought and environmental changes in the region. Other local partnerships in sharing environmental information and research projects include the Nature Conservancy, the U.S. Forest Service, and all neighboring Indian Pueblos.
C-1.8 National Energy Technology Laboratory Unable to find a Site Sustainability Plan.
C-1.9 National Renewable Energy Laboratory
Strategy and Performance Summary
Mitigating climate change is fundamental to NREL’s mission of researching and deploying renewable energy and energy efficiency technologies. By advancing low-carbon energy alternatives, NREL is playing a leading role with international climate and clean energy initiatives to achieve large GHG reductions and build climate resiliency. In support of the President’s Climate Action Plan (June 2013), EO 13653 Preparing the United States for the Impacts of Climate Change (November 2013), and in light of current extreme weather events in Colorado—including flooding, intense storms, and wildfires—NREL is also putting a renewed emphasis in advancing our role in climate change adaptation. By collaborating with internal and external stakeholders, NREL is supporting DOE’s efforts within Colorado and the nation to create climate resiliency.
Improve Understanding of Climate Change Effects and Impacts
NREL actively partners with other organizations, including local and other federal entities, to develop a better understanding of climate change, support information sharing, and collaborate in the development of adaptation approaches.
Integrated Environmental Strategies Program
NREL provides technical support for the Integrated Environmental Strategies (IES)1 program. Initiated by the Environmental Protection Agency, the IES program promotes integrated planning to address local environmental concerns and also reduce associated GHG emissions. The program encourages developing countries to analyze and implement policy, technology, and infrastructure measures with multiple public health, economic, and environmental benefits. Government agencies and research institutions in Argentina, Brazil, Chile, China, India, Mexico, the Philippines, and South Korea have participated in the IES program.
Intergovernmental Panel on Climate Change
In FY 2013, NREL contributed to the Renewable Energy Sources and Climate Change Mitigation Intergovernmental Panel on Climate Change (IPCC)2 Special Report. In addition, NREL has formed a partnership with the Integrated Assessment Modeling Collaborative for research to improve the representation of renewable energy resources and technologies in integrated assessment models. Those models will provide key analysis and scenario input to the IPCC’s Fifth Assessment Report.
U.S. Energy Sector Vulnerabilities to Climate Change and Extreme Weather
In FY 2013, NREL co-authored a report for DOE that analyzed vulnerabilities of the energy sector to climate change and extreme weather3 events. The report builds on President Obama’s Climate Action Plan, going further to identify critical areas at risk from climate change and extreme weather, as well as activities already underway to address these challenges, and potential opportunities to make the energy sector more resilient.
62
U.S. OpenLabs Program
In partnership with the U.S. Agency for International Development and DOE, NREL and other DOE labs have established U.S. OpenLabs4 a multi-laboratory expert team that is assisting developing countries on clean energy and climate issues.
Open Energy Information (OpenEI)
NREL has established the OpenEI portal5 for DOE to serve as a global community platform for information on clean energy technologies, analysis, policies, and resources.
Regional Climate Change Symposium
In FY 2013, two esteemed NREL researchers presented at the Regional Climate Change Symposium in Golden, hosted by Organizing for Action volunteers, Conservation Colorado, Colorado Wildlife Federation, and Environment Colorado. The event focused on educating and activating the community on climate change risks and impacts.
Climate Neutral Research Campuses
Under NREL’s Climate Neutral Research Campuses initiative, the Climate Action Planning Tool6 was developed. The purpose of this tool is to help research campuses and universities identify the technology options that will have the most impact on reducing greenhouse gas emissions and inform campus climate action plans. The Climate Action Planning Tool provides an interactive way to input data and adjust GHG emission goals. The deployment of this tool empowers approximately 400 research universities across the nation to determine the best pathway to reach their energy goals.
Improve Understanding of Climate Change Vulnerabilities and Risk
NREL actively seeks educational opportunities to improve the understanding of climate change risk and resiliency measures that can be incorporated into site planning and operations. NREL is also working to develop appropriate methodologies that allow for comparative climate change risk analysis and prioritizing of climate change resiliency actions for our campuses.
Recognizing that climate change poses a wide range of hazards to NREL and its infrastructure, in FY 2013, NREL initiated work to conduct a pilot climate change vulnerability assessment and develop a resiliency plan for our campuses. NREL has been undertaking research efforts to understand current climate science projections for the region. This information will be used to uncover site-specific vulnerabilities and risks to operations, ultimately developing a plan that establishes a proactive approach to adaptation that reduces the potential social, economic, and public health impacts of climate change.
Improve the Climate Resiliency of All DOE Sites
As appropriate, strategies and other pertinent information obtained during the vulnerability assessment process will be incorporated into existing site emergency response, risk management, and development plans to improve resiliency to extreme climate events. As a next step, NREL intends to engage community stakeholders (i.e., local governments and service providers) as active participants in the vulnerability assessment and plan development to foster future information sharing and potential collaboration to reduce collective risks and provide benefits beyond campus boundaries.
Additionally, NREL will develop tools to share best practices from this process and provide assistance to other federal sites and local communities engaged in similar activities. NREL also participates in regional collaborations to promote sustainability and will explore these vehicles to disseminate information on adaptation planning efforts.

63
C-1.10 Oak Ridge National Laboratory
Performance Status
ORNL has reviewed the April 2012 report DOE High Level Analysis of Vulnerability to Climate Change by means of the Guidance for FY 2014 DOE Site Sustainability Plans (August 2013). Operations personnel have not been notified of any change in mandatory reporting or of any new DOE orders to address this directive. ORNL is located in East Tennessee, in a temperate, noncoastal geo graphic area where the mountain and ridge systems protect it from major weather events such as hurricanes or widespread flooding. TVA maintains a complex and effective system of dams and local flood control structures that further protect local infrastructure. ORNL is involved in several climate change and adaptation research projects. A recent report produced by ORNL, The State of the Future for a Sustainable Tennessee: Grand Challenges and Grand Opportunities under a Changing Climate, summarizes key climate change issues and opportunities in Tennessee. In addition, ORNL is home to the Climate Change Science Institute (CCSI), an interdisciplinary, cross-directorate research organization created in 2009 to advance climate change science research. Over 100 researchers from the Computing and Computational Sciences Directorate and the Energy and Environmental Sciences Directorate form CCSI. Research programs are organized across the following four themes.
Earth System Modeling
Data Integration, Dissemination, and Informatics
Terrestrial Ecosystem and Carbon Cycle Science
Impacts, Adaptation, and Vulnerability Science
This integration of staff across directorates merges computational scientists and modelers with environmental field researchers and data specialists to execute large‐scale, model‐driven field research. Outcomes from modeling efforts and field research can link directly with research in the Impacts, Adaptation, and Vulnerability Science theme. This research integration approach has been successful in executing projects such as SPRUCE (Spruce and Peatland Responses Under Climatic and Environmental Change), NGEE (Next-Generation Ecosystem Experiments)-Arctic, and PiTS (Partitioning in Trees and Soil).
ORNL is also involved with information sharing with other agencies on the subject of climate change. This has been done mainly through the Southern Appalachian Man and the Biosphere (SAMAB) association. Agencies involved with SAMAB include the EPA, US Forest Service, US Fish and Wildlife Service, US Geological Survey, US National Park Service, Great Smoky Mountains National Park, and North Carolina Department of Environment and Natural Resources.
Climate Change Adaptation Research and Technical Assistance at ORNL
ORNL is a globally recognized center of expertise in climate change adaptation research. It is leading two chapters of the Intergovernmental Panel on Climate Change Fifth Assessment Report related to adaptation, and it is playing leadership roles in the US National Climate Assessment related to energy supply and use, connected built infrastructures, scenarios, and indicators. ORNL is funded by the DOE Office of Science to incorporate adaptation of integrated assessment research tools and applications, which will become a new DOE Science Focus Area for ORNL in FY 2014. Other support for climate change adaptation research in recent years has come from the National Oceanic and Atmospheric Administration, the US Department of Defense, the US Department of Homeland Security, the government of Australia, the private sector, and the Laboratory Directed Research and Development program. To support regional cooperation, in August 2012—in collaboration with Sustainable Tennessee—ORNL produced the report The State of the Future for a Sustainable Tennessee: Grand Challenges and Grand Opportunities under a Changing Climate (http://sustainabletennessee.org/wpcontent/uploads/2012/09/Sustainable_TN.pdf).

64
Plans and Projected Performance
ORNL plans to discuss the feasibility (including costs) of conducting a high-level assessment/analysis of potential major site-specific/local vulnerabilities to climate change during FY 2014. Any development of potential climate change adaptation plans or vulnerability assessments will be best addressed as part of any new requirements issued by the DOE Sustainability Performance Office and/or the Office of Science. In addition, updates to ORNL’s emergency response plans can provide an effective way to promote adaptation to potential climate change events such as the increase in intensity and frequency of major weather events. The office of the Laboratory Shift Superintendent (LSS) and its supporting information center is the primary means of conveying emergency information to staff and surrounding first-response organizations. During an emergency, LSS often becomes ORNL’s Emergency Response Center and coordinates both internal and external communications and manages activities designed to manage risk and minimize losses. Several Standards-Based Management System procedures cover LSS and the laboratory’s emergency response operations.
C-1.11 Pacific Northwest National Laboratory During FY14, we will continue seeking opportunities to participate in existing partnerships with
agencies in the Pacific Northwest region that focus on adaptation strategies.
PNNL continues to examine the impacts of climate variability and change on our site’s operations and is integrating approaches to managing these impacts into strategic planning efforts for our campus.
Goal 1: Improve Understanding of Climate Change Effects and Impacts
Objective 1.1: Work with other agencies to improve our understanding of climate change
PNNL has a number of collaborative research efforts underway that seek to improve our understanding of climate change effects and impacts. Our Climate and Earth Systems Science research tackles key questions related to atmospheric aerosols, clouds, and precipitation; human systems such as agriculture and energy; the cycling of water, carbon, and other important constituents; and the impacts of and potential responses to climate change. To help better understand these systems and their interactions, PNNL draws from core research capabilities in:
- climate, aerosol, and cloud physics
- regional and global scale modeling
- integrated assessment of energy and the environment
- complex regional meteorology and chemistry
- computational science and mathematics
Much of this work involves collaboration with other federal entities, including DOE, DHS, EPA, National Aeronautics and Space Administration (NASA), universities, and industry. A few examples of the programs and facilities we bring to climate research include the following:
- Joint Global Change Research Institute (JGCRI) – With the University of Maryland, PNNL has domestic and international collaborators to deepen our understanding of the interactions between climate, energy production and use, economic activity, and the environment.
- The Platform for Regional Integrated Modeling and Analysis (PRIMA) initiative – A Laboratory
- Directed Research and Development (LDRD) initiative, PRIMA evaluates interactions among climate, energy, land, and water systems at a regional scale in an integrated manner.

65
- Atmospheric Radiation Measurement (ARM) Climate Research Facility – PNNL plays a leadership role in the multi-laboratory ARM program. A scientific user facility aimed at improving climate models, ARM provides in situ and remote sensing climate measurements from strategically located sites around the world.
Objective 1.2: Work with other Federal agencies and local jurisdictions (as appropriate) to develop regional partnerships for climate change information sharing and collaboration
and
Objective 4.2: Identify or establish and participate in regional climate change adaptation partnerships, as appropriate, for all DOE facilities
In FY13, PNNL staff reached out to the DOE-Hanford Site Sustainability Program lead to discuss opportunities for information sharing and coordination on climate change adaptation plans. PNNL staff met with the Hanford Site Sustainability Working Group and presented our climate change vulnerability and risk assessment, along with the emerging adaptation plans and actions. PNNL will continue to seek opportunities to collaborate with Hanford Site subcontractors on climate adaptation measures. In FY14, PNNL also plans to perform outreach to local government authorities (i.e., City of Richland Public Utilities) to understand how local agencies view the potential impacts of climate change – particularly about local hydro and nuclear power supply – and to collaborate on climate change adaptation planning.
Goal 2: Improve Understanding of Climate Change Vulnerabilities and Risk
Objective 2.2: Conduct detailed risk or vulnerability assessments, as appropriate, for specific DOE programs or facilities
The DOE High Level Analysis of Vulnerability to Climate Change and the Washington State Integrated Climate Response Strategy (both April 2012) were used to establish potential climate change vulnerabilities at PNNL’s major sites east and west of the Cascade Mountains. There have been no documented changes to these assessments in the past year.
The greatest vulnerabilities and risks to PNNL’s operations in the Pacific Northwest region are described below.
- Facility energy shortages – Projected declines in springtime snowpack will lead to reduced stream flows during the summer months and potentially reduced hydro-electric power generation. Considering that over 75% of Richland’s fuel mix currently comes from regional hydropower sources, changes in water supply could affect the seasonal availability of and reliability of power to PNNL.
- Reduced water supply – Projected reductions in seasonal water supply may lead to policy changes regarding Columbia River water use. As the Columbia River Treaty between the United States and Canada is renegotiated in the year ahead, anticipated climate impacts will likely inform this process (e.g., Canada may not offer as much flood protection, which has implications for domestic hydropower production). PNNL currently withdraws the full amount of its water permit – 330 mil gals of water each year, half of the total annual water usage – for use in our cooling ponds and facility landscaping and to irrigate Battelle-owned land adjacent to PNNL facilities. Changes to PNNL’s water permit could necessitate increased withdraws from municipal sewer/water and groundwater sources and would impair our ability to perform aquaculture research in support of our DOE mission.
- Physical damage from wildfires – Higher summer temperatures and earlier spring snowmelt are projected to increase the risk of later dry season wildfires.

66
- Physical damage from sea level rise and storm surge – Increases in sea level and/or in the frequency or intensity of coastal storms could pose a physical threat to PNNL coastal research facilities in Sequim, Washington.
- Loss of fish and natural systems – Higher summer stream temperatures and reduced flow are projected to increase lethal stream conditions for salmon and other coldwater species. Sea level rise is also projected to eliminate valuable coastal habitats, and increased acidity in marine waters from CO2 emissions and upland runoff threatens the aquaculture and shellfish industry.
- Increase in extreme precipitation events – In addition to long-term changes in the overall and seasonal distribution of rainfall, it is expected that a higher fraction of precipitation will fall in extreme events (i.e., when it does rain, it will rain harder). These occurrences can impact various aspects of campus operations, some of which have already occurred. For example, a flood from a heavy rainfall event caused a significant computer outage at PNNL this past year.
Goal 4: Improve the Climate Resiliency of All DOE Sites
Objective 4.1: Update all appropriate DOE site plans to address climate change resiliency
During FY13, PNNL Sustainability Program members met with several individuals responsible for near- and long-term planning to discuss the climate change vulnerabilities and risks posed to our operations, as outlined above. The team identified and reviewed three plans that either currently addressed or presented an opportunity to address climate change adaption: the Building Emergency Plan, Business Continuity Plan, and Campus Master Plan.
The current Building Emergency Plan was determined to address adequately the vulnerabilities in the areas of physical damage from wildfires, sea level rise, and flooding/storm surge. Currently in progress, the Business Continuity Plan is examining a response to the resulting impacts of some of these vulnerabilities (e.g., loss of power), with processes for keeping buildings operating and people safe immediately after an event. While these short-term solutions would help PNNL in the event of a rolling blackout due to power supply shortages, it was determined that the Business Continuity Plan is less relevant to long-term adaptation planning.
The Campus Master Plan was determined to present the most important opportunity to address climate adaptation planning. The current 2012 Plan does not specifically address climate change adaptation but does include commitments to climate change mitigation through sustainable campus design. The Plan is scheduled to be revised during FY14, and the campus planning team is now committed to working with the Sustainability Program to understand and address the greatest vulnerabilities to PNNL in the Plan, particularly facility energy shortages and reduced water supply.
C-1.12 Princeton Plasma Physics Laboratory As a relatively small facility located in Central New Jersey, climate change represents a fairly limited
direct risk to the PPPL facility. DOE’s recently completed high level vulnerability assessment indicated that DOE sites will be exposed to general regional and location-specific effects of climate change. While there is uncertainty as to the exact local character and timing of climate change effects at specific sites, DOE facilities in every major U.S. climate region will be affected. DOE’s mission, site operations and programs have varying degrees of sensitivity, depending on location and type of work. National and global climate change implications relevant to the DOE mission must also be considered. Potential impacts at PPPL include:
Operational and budget impacts due to magnified water and energy/electricity shortages, greater energy price fluctuations and/or prolonged droughts,
Damage to facility infrastructure or operational disruptions due to flooding or other extreme weather events,

67
Operational constraints due to increased temperatures, as well as supply chain and energy disruptions,
Workforce issues due to heat, health, quality of life, and cost of living
Reduced operational efficiency, increased costs and other operational constraints, disruptions, and/or delays due to regional and international impacts, and
New mission opportunities, both domestic and international to enhance U.S. climate change resilience and ensure U.S. energy and economic security
Research indicates that severe weather events are more likely as a result of global climate change. Potential direct impacts from such events may include more frequent strong storms. The existing site stormwater infrastructure may need improvement or reconfiguration to accommodate such storms.
Waterways and wetlands adjacent to the site may be subject to more frequent and more severe flooding. Some buildings and infrastructure near these features have been identified for potential relocation to other parts of the site. Capital projects to support such relocations were previously identified for other purposes, however funding for the relocations has not been identified. Increased hot and cold weather extremes will impact the site’s energy use profile, potentially resulting in increased GHG emissions from the added heating and cooling loads.
The disruption of energy supplies, materials, subcontracted services, and the displacement of employees are potential indirect risks to Laboratory operations. Recent operating experience, especially hurricanes Irene (2011) and Sandy (2012), indicates that such severe weather events will likely affect regional infrastructure, such as roads and bridges, even if the Laboratory is not directly impacted. Regional damage will likely impact employee’s ability to report for work, may result in extended power and/or water outages, and may result in fuel and other supply chain shortages. Such disruptions could result in reduced Laboratory operations and a resulting impact to scientific progress.
PPPL is participating in the DOE Climate Change Adaptation Working Group and participated in the first National Climate Change Adaptation Forum. PPPL is engaged the developing state climate change adaptation efforts led by Rutgers University and will continue to participate in this effort as appropriate to Laboratory planning and operations.
C-1.13 Sandia National Laboratory Sandia has a Site Sustainability Plan, but it is inaccessible.
C-1.14 Savannah River National Laboratory Unable to find a Site Sustainability Plan.

68
C-1.15 SLAC National Accelerator Laboratory
SSPP No. 9.0 Climate Change
SLAC is a participant in the climate change adaptation working group which is being coordinated by Stanford University.
The San Francisco Bay area as a whole is likely to be affected by risks from warmer temperatures, varying precipitation patterns, increased wildfires and rising sea levels. The correlated risks include endangered human health, reduced transportation and emergency services, constrained water supply and energy supply and ecosystem and agricultural stress.
Vulnerabilities identified that are applicable to SLAC include:
Water and energy supplies from the Sierra Nevada and San Joaquin-Sacramento River Delta could be stressed and affect water supply and hydro power capabilities. Reduced snow levels and increased cooling energy demand on the grid.
SLAC has already made positive steps to consider the effect of warmer temperatures in the design of new buildings. Naturally ventilated buildings are most susceptible to climate change and was the case in the design of the Science and User Support Building (B053). SLAC will continue to participate in the Stanford University climate change adaptation working group.
C-1.16 Thomas Jefferson National Accelerator Facility 3 Climate Change Adaptation
Jefferson Lab’s coastal Mid-Atlantic location has increased vulnerability to extreme coastal storms (hurricanes) and potential related flooding that may increase in frequency and intensity if climate change impact advances. Neighboring communities, especially Norfolk, Virginia have significant exposure to increasing sea levels and resulting coastal erosion and flooding. Norfolk and New Orleans, Louisiana have been identified as the two most endangered cities in the U.S. from rising sea levels. Although Jefferson Lab may experience indirect negative effects of seal level rise from staff residing in the Norfolk area, the Lab’s specific site location at thirty three feet above sea level should not see direct sea level increase impact. However, coastal storms have disrupted Lab operations and caused significant site damage.
For example, a recent severe storm (Aug, 2012) produced approximately 6 inches of rain at the Lab site and surrounding area in about one hour. Consequently, significant flood damage occurred to sub surface experimental hall facilities and other infrastructure.
Jefferson Lab’s site surface waste drainage, with an extensive network of feeder and main ditches, had been adequate protection from previous storm events. However, the combination of prior ground saturation, followed by torrential rain and increased construction in the surrounding community, overwhelmed the capacity of the off-site (municipal) drainage systems and streambeds.
Site Mitigation Plans
Subsequent to the above event, Jefferson Lab is preparing to develop a storm water management system (retention pond) on site to control storm water flow from extreme quantities of future rain events. Further, water control remediation systems (flood gates) will need to be installed at access points to all sub surface experimental halls to prevent future flood damage.

69
C-2 DOE NON-LABS
C-2.1 Office of Legacy Management
III. Climate Change Adaptation
According to EO 13514, Sections 8(i) and 16, and subsequent Council on Environmental Quality Implementing Instructions, DOE developed and submitted+ a Climate Change Adaptation Plan with its SSPP. The DOE Climate Change Adaptation Plan directs DOE programs to ensure that all facilities address climate change adaptation in their 2013 SSPs, and establishes goals and objectives applicable to DOE sites. These goals/objectives are discussed in the next sections.
Objectives 2.1, 3.1, and 3.2 in the Adaptation Plan have been excluded from this discussion, as they are not applicable to individual sites. Objective 1.2 and 4.2 overlap, so they are addressed together.
Goal 1: Improve Understanding of Climate Change Effects and Impacts
Objective 1.1: Work with other agencies to improve our understanding of climate change.
The DOE Grand Junction Projects Office hosted a collaborative workshop in 1994 titled “Climate Change in the Four Corners and Adjacent Regions.” Attendees from over 20 different agencies and organizations shared interagency knowledge of climate change implications for environmental restoration and land-use planning. Ongoing LM projects stemming from that exchange are in place to monitor long-term disposal cell performance.
In FY 2012, the plan for further climate change investigations included an extensive framework for projecting long-term disposal cell cover performance and a survey of current approaches for evaluating climate change effects. An LM scientist attended the Ecological Society of America annual meeting in August 2012 to survey current climate change science essential to LM’s efforts to project long-term cover performance.
In August 2012, LM hosted a workshop with the IAEA to discuss the challenges of management and regulatory oversight of legacy sites all over the world. One of the presentations, “Long-Term Performance Cover Monitoring,” a collaborative effort between LM scientists and the University of Wisconsin-Madison, explored the possibilities of engineering disposal cells to function more effectively in changing environmental conditions. Covers evolve over time as materials equilibrate with the natural setting. Understanding these changes is useful in interpreting changes in hydrologic performance and anticipating potential effects due to climate change.
Additional efforts to improve understanding of climate change included LM personnel participating in the online Climate Vulnerability Assessment Training provided by the U.S. Fish and Wildlife Service National Conservation Training Center; LM personnel attending the GreenGov Climate Change Adaptation workshop presentations provided by United States Global Change Research Program and National Climate Assessment; and continually reviewing information as provided in the resources posted on the DOE Working Group SharePoint site and FedCenter.
Objective 1.2: Work with other Federal agencies and local jurisdictions (as appropriate) to develop regional partnerships for climate change information sharing and collaboration.
Objective 4.2: Identify or establish and participate in regional climate change adaptation partnerships, as appropriate, for all DOE facilities.
In 2011 LM participated in the DOE voluntary review of the cross-cutting energy section of the National Fish, Wildlife, and Plants Climate Adaptation Strategy.
70
LM plans to invigorate previous relationships in the Four Corners region as well as establish new relationships with agencies in other parts of the country. LM is in the process of making contacts with the Bureau of Land Management, NRC, EPA, U.S. Geological Survey, and local universities to explore regional partnership opportunities.
Members of the Surface Biogeochemical Research program, which is part of the of the Climate and Environmental Sciences division of the DOE Office of Science, are working on a bioremediation research project at the Old Rifle site. LM plans to explore the potential for climate-oriented evaluation with this program as well.
Goal 2: Improve Understanding of Climate Change Vulnerabilities and Risk
Objective 2.2: Conduct detailed risk or vulnerability assessments, as appropriate, for specific DOE programs or facilities.
LM reviewed and contributed to the April 2012 DOE High Level Analysis of Vulnerability to Climate Change. LM is in the process of determining which vulnerability/risk assessment approach would be most effective for LM sites and whether any climate change vulnerability/risk assessments have been completed by institutions near LM sites.
Disposal cells are one aspect of several LM sites that are in the process of being evaluated for climate change vulnerabilities. LM is considering a framework that would screen future environmental scenarios and possible future disposal cell cover states. This information, along with climate variables, would be input to an ecohydrology model to project cover performance for that environmental scenario.
Goal 4: Improve the Climate Resiliency of all DOE Sites
Objective 4.1: Update all appropriate LM site plans to address climate change resiliency.
Once LM has established a comprehensive climate change assessment approach, site managers and site leads will be informed and engaged in the assessment strategy. LM will determine which program and site documents would be most appropriate for noting climate change adaptation considerations and will establish a schedule for making those updates.
C-2.2 Other DOE Sites/Offices No other DOE Sites or offices had their own Site Sustainability Plans; defer to the DOE plan.