Embed Size (px)
Citation preview

Climate Change Science and the Limits of Confidence
John Nielsen-Gammon
Dept. of Atmospheric Sciences
Texas A&M University
97% of Climate Scientists agree:
• The global climate has warmed over the past century
• Humans are a major contributing factor• Impacts will be catastrophic unless we
reduce or eliminate our use of fossil fuels

97% of Climate Scientists agree:
• The global climate has warmed over the past century
• Humans are a major contributing factor• Impacts will be catastrophic unless we
reduce or eliminate our use of fossil fuels

Sources
• Intergovernmental Panel on Climate Change– Assessment Report #5– Working Groups
• 1: The Physical Science Basis• 2: Impacts, Adaptation, and Vulnerability• 3: Mitigation of Climate Change
• IPCC AR5 WG1, etc.: http://ipcc.ch

Global Surface Temperature

Pattern of Temperature Trend

Regional Temperatures, 1-2000(PAGES 2013)
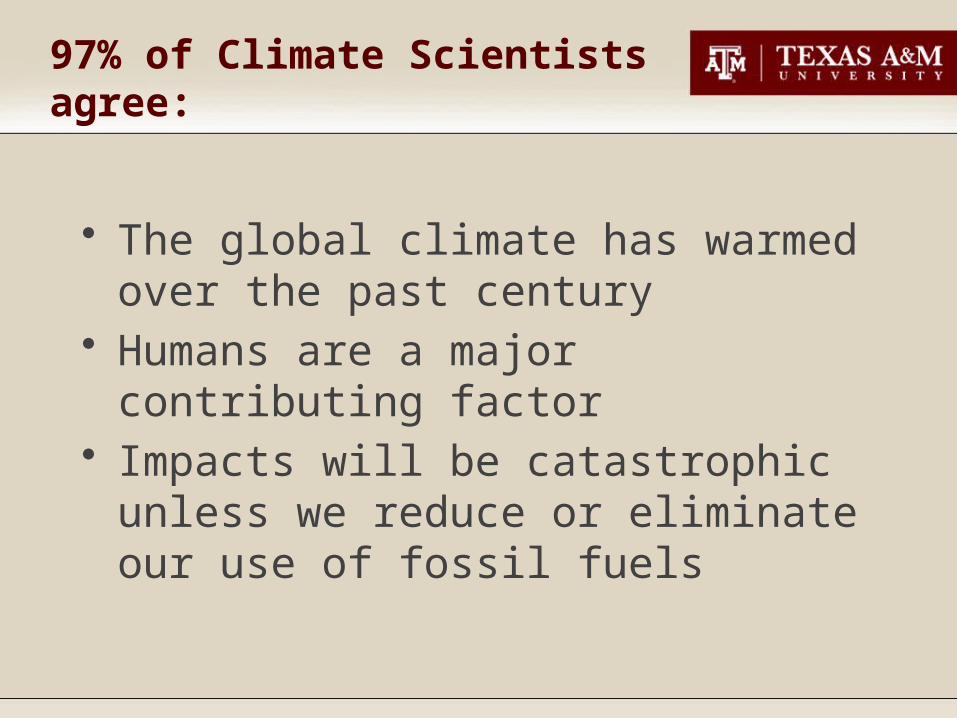
Multiple datasets & analyses(AR5 WG1 FAQ2.1)

Energy gained by oceans


Mass change, ice sheets (AR5 WG1 Figs 4.13d-4.14d)

Changes in Water and Ice (AR5 WG1 FAQ2.1)


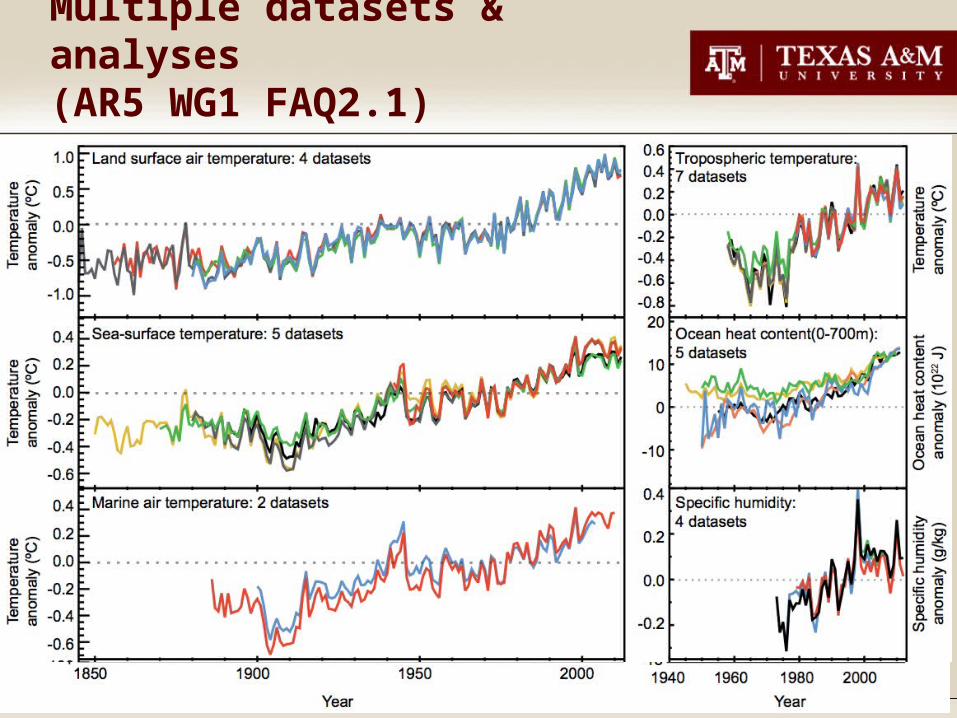
Global Energy Balance, Part 1
Sun
Atmosphere
Each arrow = 20 W/m2
Earth

Scientific Principles
• Energy Imbalance implies a net gain or loss of energy
• Typical annually averaged energy imbalances are << 1% of the energy flow
Global Energy Balance, Part 1
Sun
Atmosphere
Each arrow = 20 W/m2
Earth

Global Energy Balance, Part 1
Sun
Atmosphere
Each arrow = 20 W/m2
Earth

Global Energy Balance, Part 1
Sun
Atmosphere
Earth
Each arrow = 20 W/m2

Global Energy Balance, Part 1
Sun
Atmosphere
Earth
Each arrow = 20 W/m2

Global Energy Balance, Part 1
Sun
Atmosphere
Earth
Each arrow = 20 W/m2

Global Energy Balance, Part 2
Sun
Atmosphere
Earth
Each arrow = 20 W/m2

Global Energy Balance, Part 2
Sun
Atmosphere
Earth
Each arrow = 20 W/m2

Global Energy Balance, Part 2
Sun
Atmosphere
Earth
Each arrow = 20 W/m2

Global Energy Balance, Part 2
Sun
Atmosphere
Earth
Each arrow = 20 W/m2

Evolution of Estimated Forcings (AR5 WG1 Fig. 8.18)

Mid-20th Century Attribution (AR5 WG1 Fig. 10.5)


Changes in Precipitation/Storms
• PrecipitationNH midlatitudes: increase since 1901/1951– Elsewhere: ???
• Intense rainfall events– Increase over many land areas
• Drought– Since 1950, some increases and some
decreases, some increase overall?• Tropical cyclone activity
– Increase over past century?

Natural Variability
Climate Change


Summary
• The climate is changing• Over the long haul, it’s us• Future changes are hard to pin down• Some impacts are easy
– It’ll get warmer• Some impacts are hard
– More droughts?• The scientists aren’t arguing over what
you think they’re arguing over

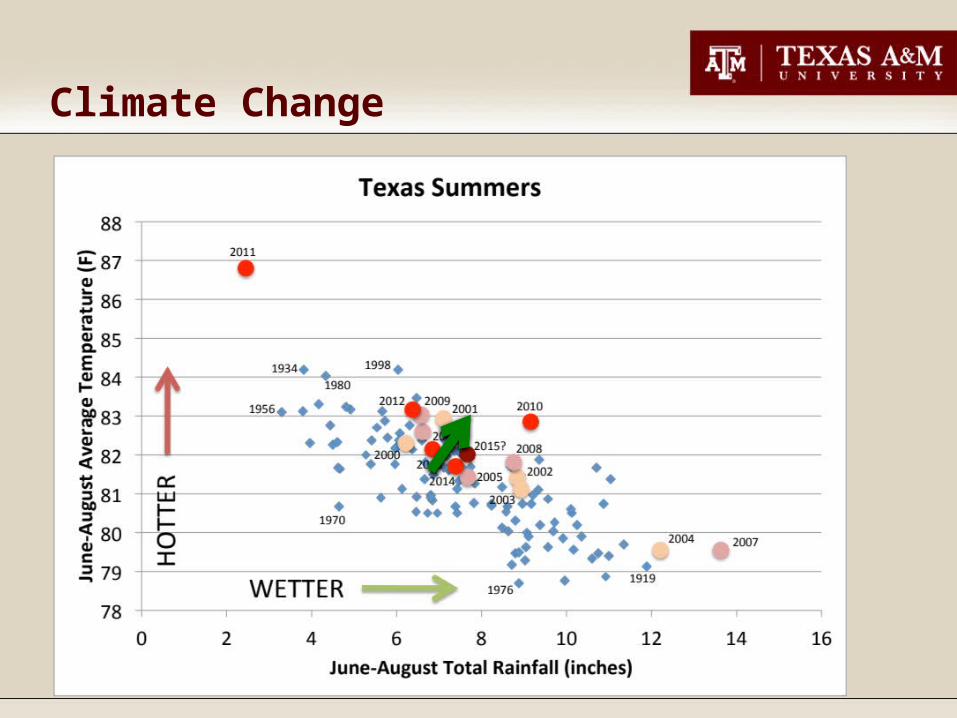
Texas expectations
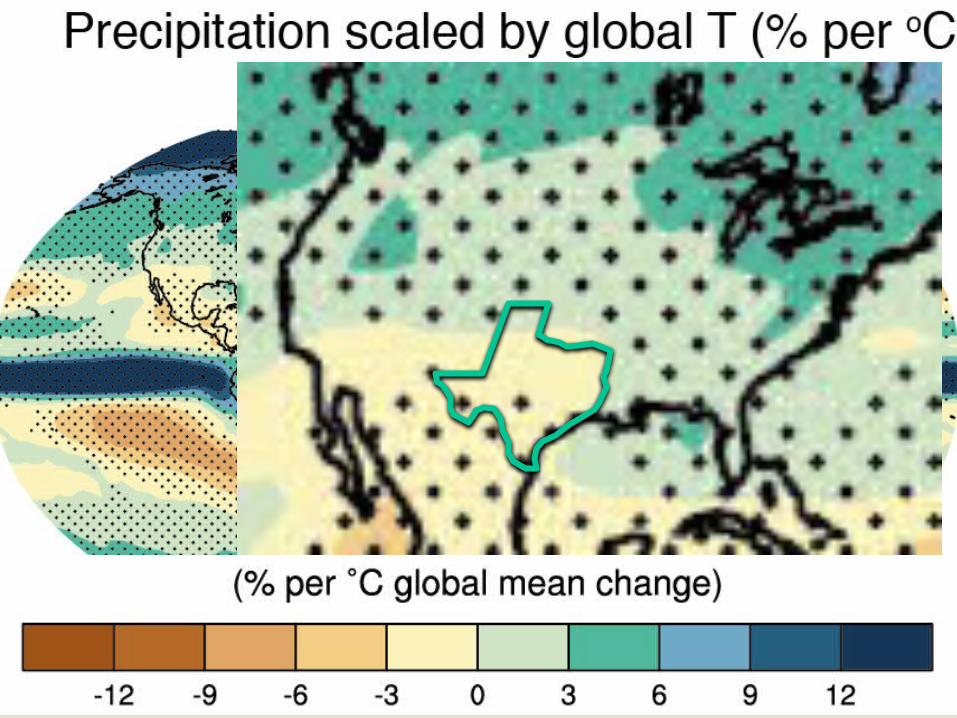
• Over multiple decades, Texas will get warmer (1-2 °F by mid-century?)
• For now, natural variability will continue to rule Texas precipitation
• Streamflow changes: increased water use, increased evaporation
• Largest impacts: bay/estuary ecosystems
Climate Change as Aggravating Factor
• Water supply• Coastal subsidence• Endangered species• Wildfire• Agriculture• Ocean acidification• Population displacement
Contact Information
• John W. Nielsen-Gammon• [email protected]• 979-862-2248• http://climatexas.tamu.edu• http://ClimateChangeNationalForum.org