Embed Size (px)
Citation preview

Climate Change Policy Overview and Recent Policy DevelopmentsDavid GriffinClimate Change BranchAgriculture and Natural Resources Policy
June 2009June 2009
Outline
Opening Remarks
Part 1: National & State Policy frameworks
Part 2: Emissions trading - CPRS
Part 3: CPRS for agriculture & forestry
Part 4: Questions

Opening Remarks
AgricultureForestryFisheries
Adaptation / Mitigation responses
Market and tradeimpacts
Policy impacts
Biophysical impacts
Climate change

1: National Policy Agenda
• Reducing emissions/improving
productivity
• Livestock a focus for research
• National Framework for Climate
Change R&D
1. Reducing Livestock Emissions R&D Program ($26.8m)
2. Nitrous Oxide R&D Program ($11.8 m)
3. Soil Carbon R&D Program ($20 million)

1: National Policy Agenda - Mitigation
Carbon Pollution
Reduction Scheme (CPRS)
National GHG &
Energy Reporting System (NGERS)
Renewable Energy Target (RET)

1: State Government Policies
Future Farming strategies and programs:
– Planning for Climate Change - $5.2m
– New technologies and strategies -$6.22m
– Drive innovation in the dairy industry -$8.57m
– Boost productivity through research, development and extension - $77m

1: State Government Policies
Victorian Government’s Responding to Climate Change Program (R&D)
Reducing greenhouse gases from agriculture:
– $1.86m to reduce nitrous oxide emissions in high rainfall legume/wheat cropping systems;
– $1.7m to investigate nitrous oxide inhibitors for animal production systems.
– Better soil management:
– $1.65m for soil carbon cycle R&D for Victorian dairy, sheep, cereal and beef systems;

Climate Change Strategy Green Paper Priorities:
– Position Victorian Industry to capitalise on opportunities
– Support private action to adapt to climate change
– Help regions, businesses and communities to adjust
– Build business and community awareness of climate change
– Planning and building standards support low emissions future
– Victoria’s transport system to reduce emissions
1: State Government Policies

• A market based instrument: ETS v carbon tax
• Regulation – mandatory emission standards e.g. cars
• Public information and advice - codes of practice
• Public investment in innovation - R&D/ practice change
• Public investment in infrastructure – ports & channels
• Public subsidies and incentives - tax rebates
1: Policy response
Policy options to address global market failure to reduce greenhouse gases

1. Emissions trading vs Carbon tax
National target…X tonnes of GHG emissions by date Y
What gives us the best chance of hitting that target?
• Tax = Cost is known ($ set by government) but emissions
quantity actually reduced (extent of response to a given
price) is not known.
• Emissions trading = quantity to be reduced (cap) is
known (set by government) but price is not known (let
the market decide)

1. Other considerations in GHG mitigation:
• Ability to find ‘least cost’ / economically ‘optimal’ solutions
• Link to international trading schemes
• Globally or regionally tradeable commodity
• Incentives for research, innovation, new industries
• Administrative simplicity
– Broad coverage of economy but minimal number of parties regulated
• Risk management / hedging through derivatives market
• Government assisting structural adjustment.
‘Cap & Trade’ emissions trading……..on balance the best option

2: Carbon Trading – how does it work?
• Governments set a ‘cap’ on amount of pollution permitted
• Number of permits to be issued are limited (the ‘cap’)
• Large emitters (liable parties) need to acquire a carbon
• pollution permit for every tonne of emissions
• Note: No emission limits on individual entities
• Permits have a value – carbon becomes a cost of production
• Emissions are monitored and audited
• Surrender of permits at the end of the compliance year
• Permits can be traded (and spare ones ‘banked’)
• The ‘cap’ (availability of permits) is progressively reduced

2: Carbon Trading – how does it work?
• Liable parties (directly impacted)
–measure, report, manage, purchase & surrender permits
–absorb or pass costs on or generate income
• Non-liable parties (indirectly impacted)
–no reporting or permit management
–will pay carbon cost through purchase of goods & services

2: Carbon Trading – How does it work?
Top 1000 emitters
Carbon market
sets the permit price
Scheme Regulator
oversees process
Emitters buy permits
at auction
(plus receive free
permits)
Surrender one
permit for every
tonne of CO2-e
Permits can be
banked or sold to the
market for cash
Australian Government• Sets cap on emissions• Redistributes auction
revenue (Climate Change Action Fund)
Eligible reforestation
projects earn a free
permit/ tonne CO2-e
Emissions sinks
ReportGHGs
AuditGHGs

2: Carbon Trading - International
Kyoto Protocol
• Global cap and trade system for Annex 1
signatories (ratified 2005)
– Cut GHGs to 95% of 1990 levels by 2012
– Australia’s 108% of 1990 levels by 2012
• NZ ETS under review,
– forestry included from 1 January 2008
– proposed inclusion of agriculture 2013
• EU 10% reduction from sectors not
covered in EU ETS, such as agriculture
• US early stages of ETS

2: National Carbon Pollution Reduction Scheme
Carbon Pollution Reduction Scheme
Softer/ delayed start but tougher 2020 target
– 5-25% cut on 2000 levels by 2020
– Targets top 1,000 emitters
– Covers stationary energy, transport, industrial
processes, waste and fugitive emissions
(75%)
– Agriculture not included (until at least 2015)
– 1 July 2011 @ $10/ tonne CO2e
– Permits only valid in 2011-12
– Reforestation projects eligible from 01/07/10


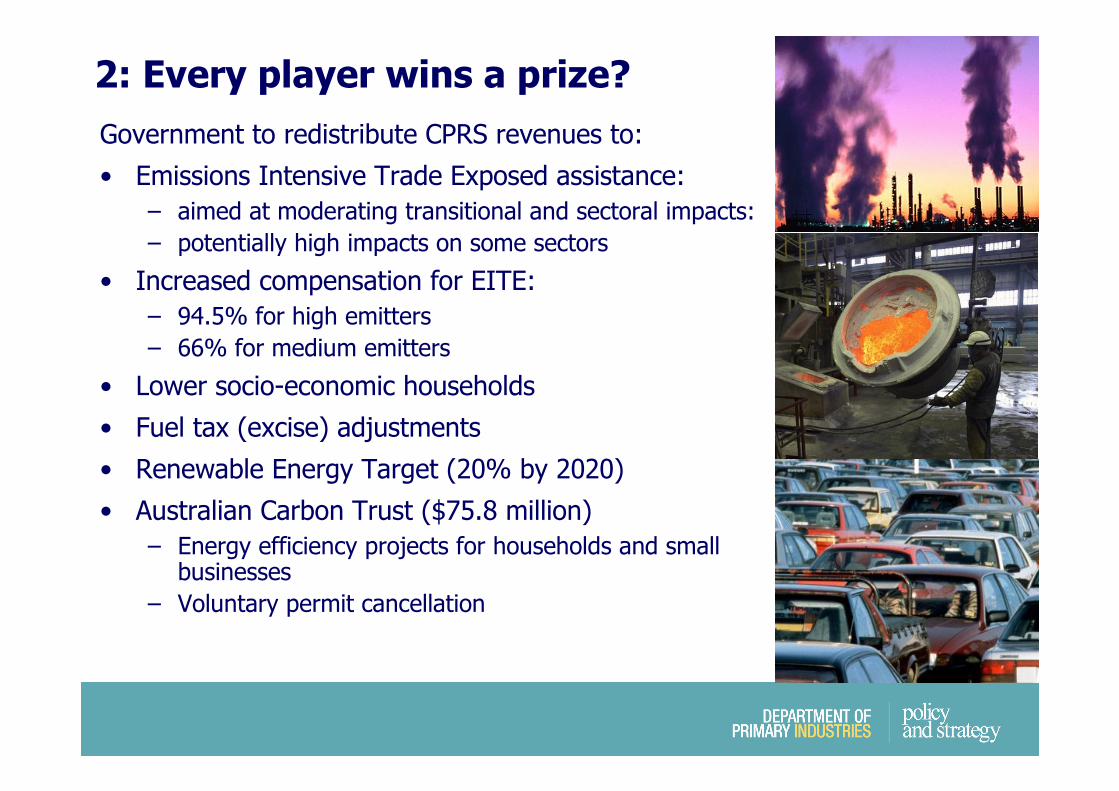
2: Every player wins a prize?
Government to redistribute CPRS revenues to:
• Emissions Intensive Trade Exposed assistance:
– aimed at moderating transitional and sectoral impacts:
– potentially high impacts on some sectors
• Increased compensation for EITE:
– 94.5% for high emitters
– 66% for medium emitters
• Lower socio-economic households
• Fuel tax (excise) adjustments
• Renewable Energy Target (20% by 2020)
• Australian Carbon Trust ($75.8 million)
– Energy efficiency projects for households and small businesses
– Voluntary permit cancellation

Agriculture’s inclusion deferred until at
least 2015
– Final decision in 2013 (coverage vs offset provider)
– No agricultural offsets prior to 2015
– Commonwealth’s preferred position to include agriculture but some easing of hardline stance
– Work program commencing in 2009 to support this decision
– Mandatory emissions reporting to being in 2011
3: CPRS – What about agriculture?
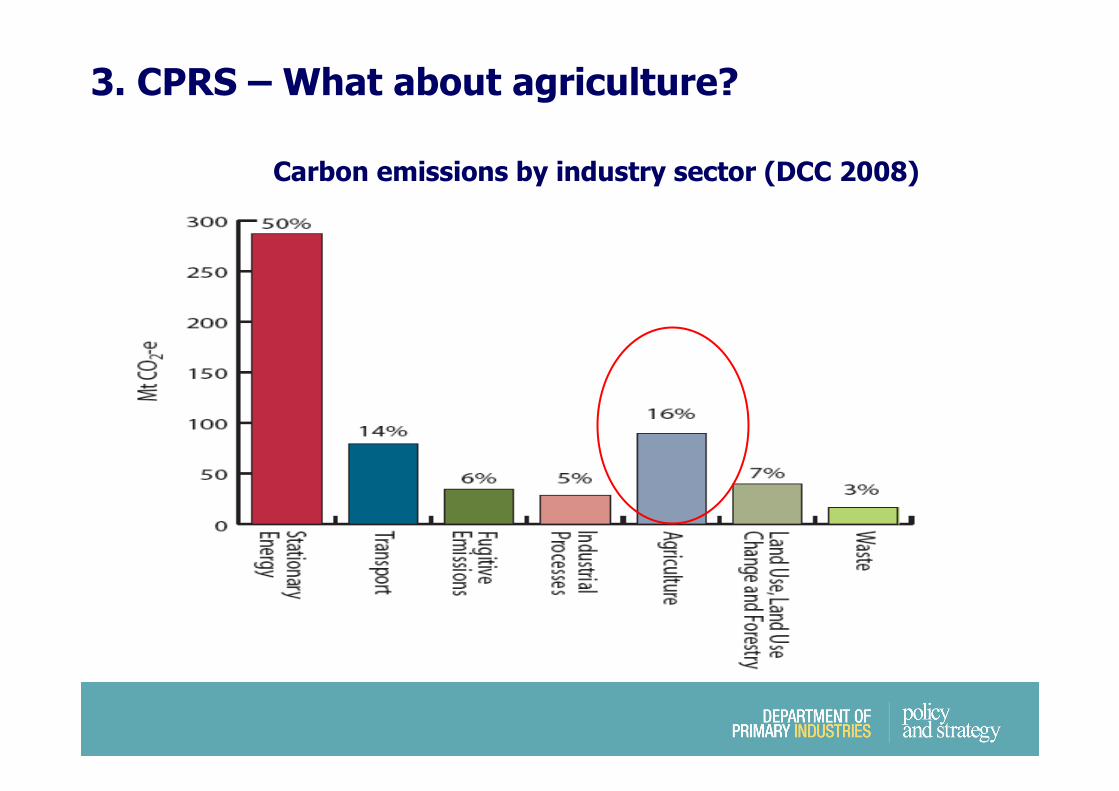
3. CPRS – What about agriculture?
Carbon emissions by industry sector (DCC 2008)
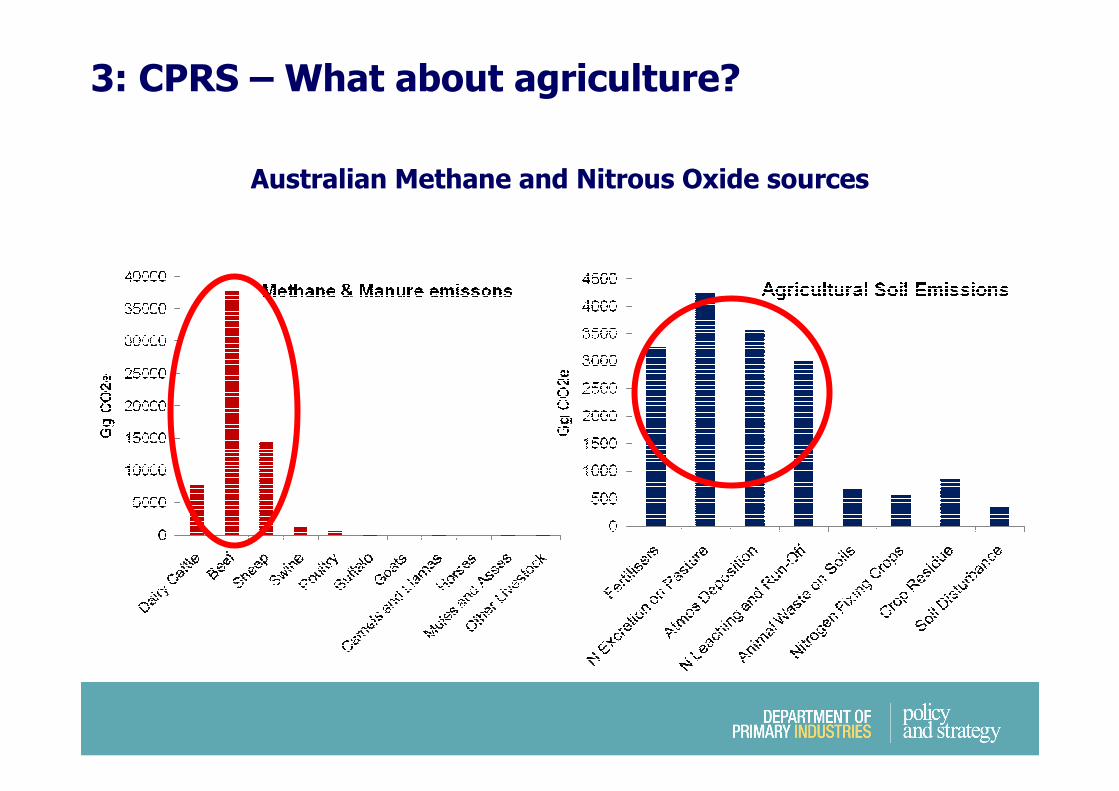
3: CPRS – What about agriculture?
Australian Methane and Nitrous Oxide sources

If included in the CPRS:
• New threshold: less than 25,000 tonnes of emissions per annum
• New Zealand to include agriculture as a covered sector by 2013
• Covered agriculture eligible for EITE assistance in 2015-16:- 94.5% for beef, sheep, dairy- 66.0% pigs and sugar cane
• Decision to be made on point of obligation – farm level or processor?
3: CPRS – What about agriculture?
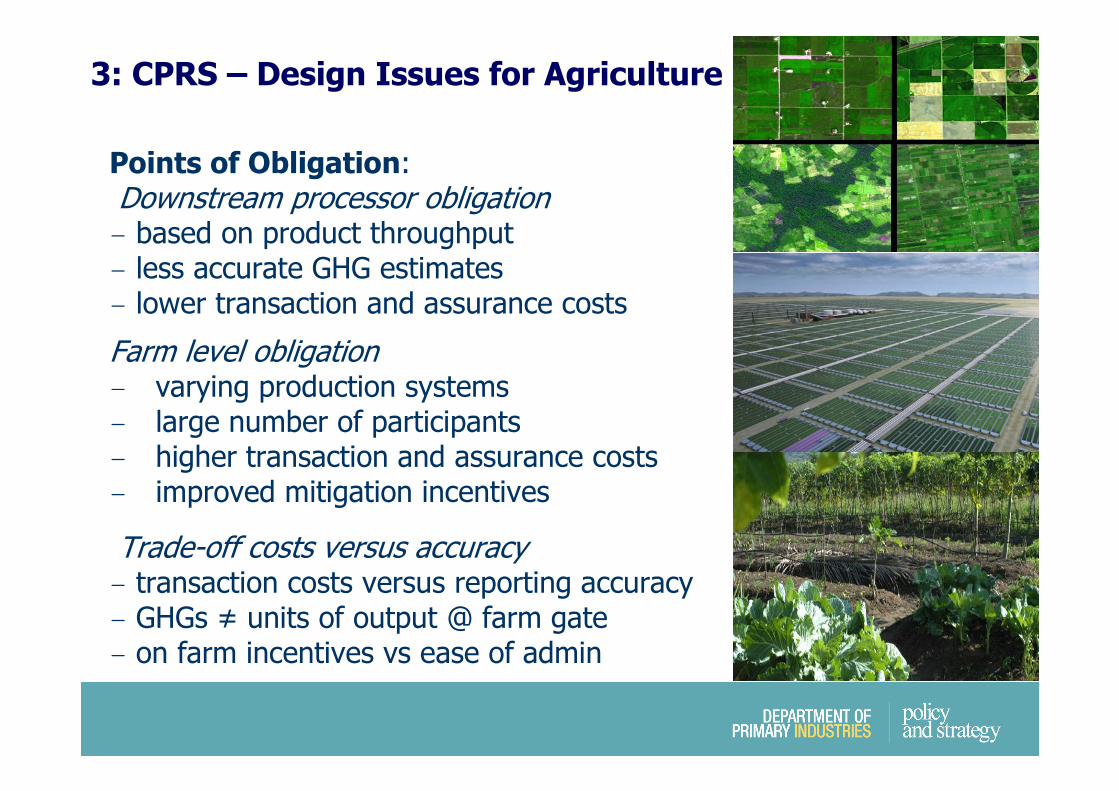
3: CPRS – Design Issues for Agriculture
Points of Obligation:Downstream processor obligation- based on product throughput - less accurate GHG estimates- lower transaction and assurance costs
Farm level obligation- varying production systems - large number of participants- higher transaction and assurance costs- improved mitigation incentives
Trade-off costs versus accuracy- transaction costs versus reporting accuracy- GHGs ≠ units of output @ farm gate- on farm incentives vs ease of admin

Impacts will vary depending on:
– type of business: e.g. livestock vs. cropping
– energy & input intensity of business
– distance to markets
– management practices
– opportunities for reforestation
3: CPRS – Implications for Agriculture
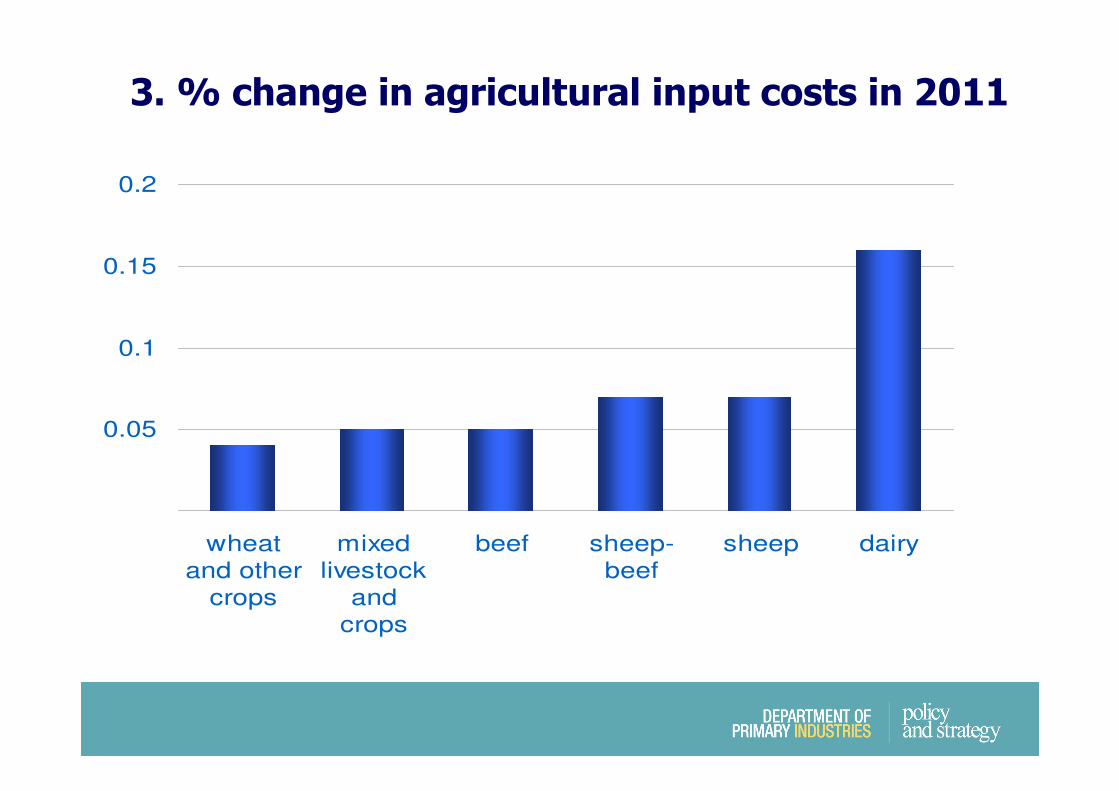
0.05
0.1
0.15
0.2
wheat
and other
crops
mixed
livestock
and
crops
beef sheep-
beef
sheep dairy
3. % change in agricultural input costs in 2011

-8
-6
-4
-2
2
4
6
beef &
sheep
meat
dairy cattle other
animals
grains other crops
2020
2030
Modelled CPRS impacts in 2020 & 2030 –
(relative to reference case)
Source: ABARE 2009


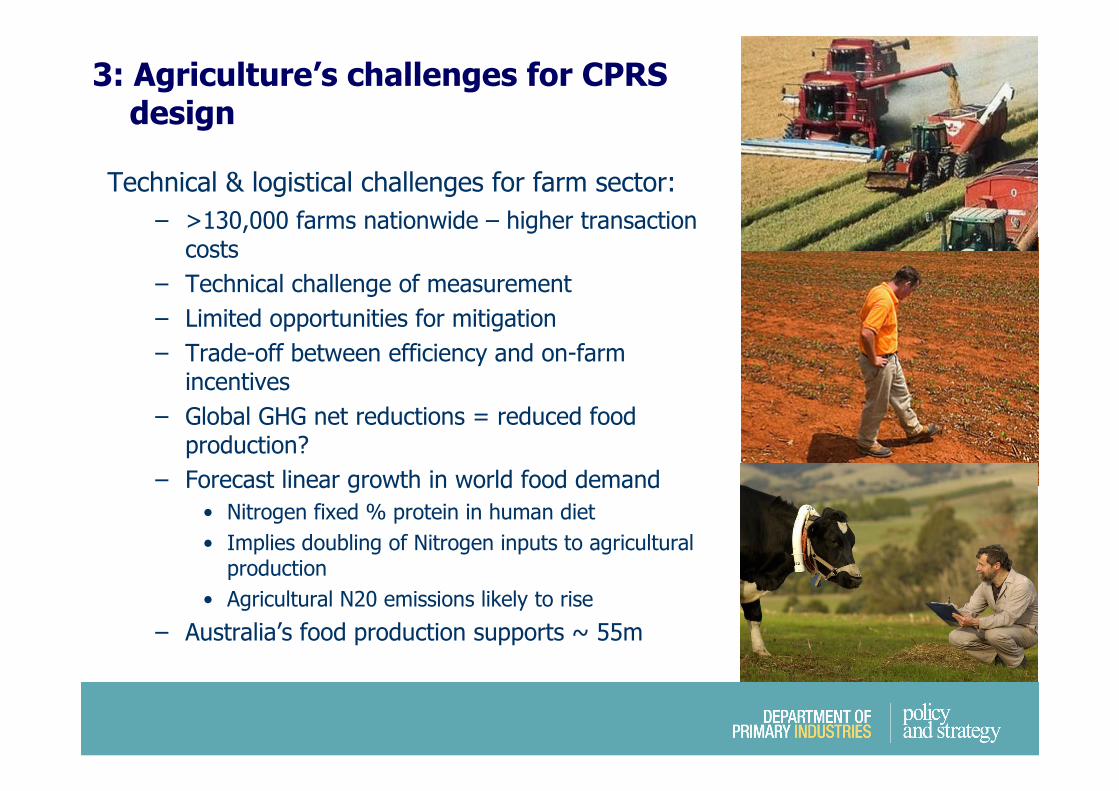
3: Agriculture’s challenges for CPRS design
Technical & logistical challenges for farm sector:
– >130,000 farms nationwide – higher transaction costs
– Technical challenge of measurement
– Limited opportunities for mitigation
– Trade-off between efficiency and on-farm incentives
– Global GHG net reductions = reduced food production?
– Forecast linear growth in world food demand
• Nitrogen fixed % protein in human diet
• Implies doubling of Nitrogen inputs to agricultural production
• Agricultural N20 emissions likely to rise
– Australia’s food production supports ~ 55m

3: Alternatives to CPRS
Fonterra pushing a baseline & credit scheme in New Zealand
– Point of obligation on farm for CH4 and N2O;
– Focused on reducing GHGs not production;
– Incentives to on farm R&D & technology adoption;
– No impost for best practice operators
Victoria & NSW jointly exploring feasibility and merits of alternative policies to the CPRS:
– Information based
– Other market based instruments
– Promoting R&D and innovation on farm

• Reforestation included on a voluntary basis from 2010: – based upon Kyoto Article 3-3– forest stands of at least 0.2ha x 2m x 20% canopy cover
– projects must remain for 100 years• Eligible participants:
– landowners– certain forest & carbon owners
• Harvested wood products excluded but Commonwealth to lobby for international inclusion
• Avoided deforestation not included in the CPRS – laws are in place in Australia to prevent deforestation
3: CPRS - Reforestation
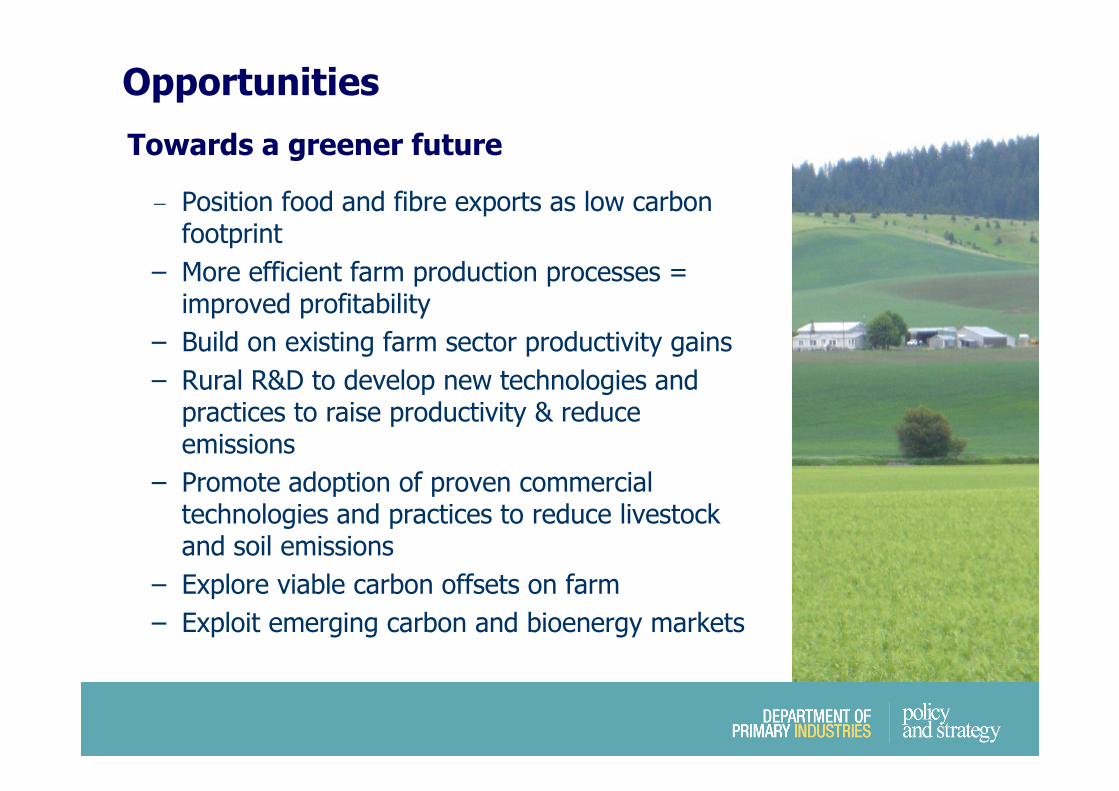
Opportunities
- Position food and fibre exports as low carbon footprint
– More efficient farm production processes = improved profitability
– Build on existing farm sector productivity gains
– Rural R&D to develop new technologies and practices to raise productivity & reduce emissions
– Promote adoption of proven commercial technologies and practices to reduce livestock and soil emissions
– Explore viable carbon offsets on farm
– Exploit emerging carbon and bioenergy markets
Towards a greener future

Questions?

• Kyoto Protocol Article 3.4
• Soil carbon cycle – CO2 in / CO2 out
• Biochar – potential carbon store?
– potential source of bioenergy
– potential for retaining soil moisture
– potential for retaining nutrients
• Improved soil carbon = improved soil health =
improved productivity
• Pasture roughly carbon neutral – until you put
cattle or sheep on it
• Cropping more or less of an emitter depending
on usage of fertilizer and tilling pratices
3: CPRS - Soil carbon

3. The carbon cycle in soils – it comes and goes
Atmospheric
CO2
Plant
Biomass
Plant Residues
(short-lived)
Particulate
Organic C
Humus
Organic C
Microbial
Biomass
Resistant organic carbon:
long-lived (geologic >1000 yrs)
SenescencePostharvest
Photosynthesis
Mineralisation (days to years)
Decomposition
Mineral nutrients in
soil profile
Natural:
Charcoal
Phytoliths
Managed:
Biochar
58%
100%

3. Soil as a carbon store – how can we tell?
Soil as an ecosystem:
• dynamic and complex physical, chemical and biological processes, functions and services
• changes occur slowly but significant due to scale (34m. ha under crop)
Soil as a carbon store:
• 55% of Australia’s continental carbon store
• Victoria’s average carbon (OM) content 1.6% (0.5-8.0%)
• Equiv. 64t/ha of carbon (OM) over 10 million ha (DPI,
2009)
• Victoria’s carbon store ~ 640m. tonnes (OM, 370m. tC), current practice
Managing the carbon store (agronomy):
• potential increase 1.6 t/ha/yr under pasture
• potential increase 0.5 t/ha/yr under crop
Measuring the carbon store:
• carbon increase does not exceed detection errors until 20 years
Incentive for permanent plantings - carbon sinks
– Treasury estimated: 5-40m ha new trees by 2050 (1.82m ha now)
– Plantations 2020 Vision 3m ha nationally by 2020
– Boost for not-for-harvest plantings
Weaker incentives for plantations – smaller sinks
– Harvest sub-rule (permit liabilities cannot > permits earned)
– Lower carbon credit reflects rotation length
– Uncertainty over post-2012 Kyoto rules for forestry & HWP
– Limited to Kyoto compliant forests (post-1990)
3: CPRS – Implications for Forestry

Measurement & Reporting requirements
• Initial accreditation requires forest management plan
• Annual reporting by exception
• Periodic audit & reconciliation every 5 years
• ‘Average crediting basis’
• Relinquishment obligation buffer
3: CPRS – Implications for Forestry

3: CPRS – Implications for Forestry
Average Accounting - Rotation x 2

3: CPRS – Implications for Forestry
Average Accounting – Permanent plantings