Embed Size (px)
Citation preview

Climate Change Performance Index 2013 • Components
Primary Energy Supply per Capita
Emissions from Deforestation per Capita
Target-Performance Comparison
CO2 Emissions from Electricity and Heat Production
CO2 Emissions per Capita
CO2 Emissions from Manufacturing and Industry
7.5%
7.5%
10%
5%
10%
8%4% 4%
CO2 Emissions from Residential Use and Buildings
CO2 Emissions from Aviation
Share of Renewable Energys in Total Primary Energies Supply
Development of Energy Supply from Renewable
Energy Sources
International Climate Policy
National Climate Policy
Efficiency Trend
Efficiency Level
CO2 Emissions from Road Traffic
8%
4%2%
10%
10%
5%
5%
30%Emissions
Level
30%Development of Emissions
10%Efficiency
Renewable Energies
10%
20%Climate Policy
© Germanwatch 2012
Components of the CCPI
CLIMATE CHANGE PERFORMANCE
index2013
Climate Change Performance Index 2013 • Overall Results
Index Categories
Emissions Level (30% weighting)
Emissions Development (30% weighting)
Renewable Energy (10% weighting)
Efficiency (10% weighting)
Policy (20% weighting)
Rating
Very good
Good
Moderate
Poor
Very poor
Table 1Table 1: Overall Results
76
comparison with previous year, using the revised methodology
32 Thailand 58.32
33 Brazil 58.20
34 Austria 58.09
35 Belarus 57.98
36 Indonesia 57.07
37 – South Africa 56.70
38 Finland 56.58
39 ▲ Croatia 56.37
40 Australia 55.39
41 – New Zealand 54.48
42 Bulgaria 54.27
43 United States 53.51
44 Poland 52.47
45 Estonia 52.45
46 Algeria 52.34
47 Japan 52.10
48 Greece 52.04
49 Netherlands 50.28
50 Argentina 49.97
51 Korea 49.93
52 Chinese Taipei 49.40
53 – Singapore 49.13
54 China 49.03
55 Malaysia 47.53
56 Russian Federation 46.65
57 Turkey 46.60
58 Canada 45.16
59 – Kazakhstan 39.96
60 – Islamic Rep. of Iran 35.81
61 – Saudi Arabia 26.90
© Germanwatch 2012
Rank Country Score**Tendency
Table 1:
1* –
2* –
3* –
4 ▲ Denmark 72.61
5 – Sweden 69.37
6Portugal 67.81
7 ▲ Switzerland 67.61
8 Germany 67.54
9 ▲ Ireland 67.48
10 United Kingdom 67.33
11 ▲ Malta 67.07
12 ▲ Hungary 66.41
13 Belgium 65.20
14 Mexico 64.91
15 – France 64.74
16 Slovak Republic 64.64
17 Iceland 64.16
18 Romania 62.67
19 Ukraine 62.22
20 Morocco 62.01
21 Italy 61.26
22 Slovenia 60.98
23 – Cyprus 60.94
24 India 60.77
25 Lithuania 60.23
26 Luxembourg 59.56
27 Spain 59.18
28 Czech Republic 59.13
29 Egypt 59.04
30 Latvia 58.63
31 Norway 58.38
© Germanwatch 2012comparison with previous year, using the revised methodology
Rank Country Score**Tendency
© Germanwatch 2012 © Germanwatch 2012comparison with previous year, using the revised methodology comparison with previous year, using the revised methodology
* None of the countries achieved positions one to three. No country is doing enough to prevent dangerous climate change.
** rounded
CLIMATE CHANGE PERFORMANCE
index2013

CCPI Rank 2012 2013
Country Share of Global
CO2 Emissions*
Share of Global Primary Energy
Supply
Share of Global GDP
Share of World
Population
Germany 6 8 2.34 % 2.56 % 3.99 % 1.19 %
India 18 24 4.94 % 5.42 % 5.49 % 17.15 %
Brazil 14 33 4.19 % 2.08 % 2.86 % 2.85 %
Indonesia 32 36 2.33 % 1.62 % 1.36 % 3.51 %
United States 50 43 16.26 % 17.36 % 19.02 % 4.54 %
Japan 42 47 3.52 % 3.89 % 5.69 % 1.86 %
Korea 44 51 1.73 % 1.95 % 1.93 % 0.71 %
China 55 54 21.42 % 19.34 % 13.76 % 19.71 %
Russian Federation 54 56 4.84 % 5.49 % 2.93 % 2.07 %
Canada 57 58 1.65 % 1.97 % 1.75 % 0.50 %
Total 63.26% 61.73% 58.82% 54.14%© Germanwatch 2012*energy-related emissions and emissions from deforestation
Table 2: Key Data for the 10 Largest CO2 Emitters
Climate Change Performance Index 2013 • Largest CO2 Emitters CLIMATE CHANGE PERFORMANCE
index2013

Climate Change Performance Index 2013 • by Country Group – A
© Germanwatch 2012
Rank Country Score 4 Denmark 72.61
5 Sweden 69.37
6 Portugal 67.81
8 Germany 67.54
9 Ireland 67.48
10 United Kingdom 67.33
11 Malta 67.07
12 Hungary 66.41
13 Belgium 65.20
Rank Country Score 15 France 64.74
16 Slovak Republic 64.64
18 Romania 62.67
21 Italy 61.26
22 Slovenia 60.98
23 Cyprus 60.94
25 Lithuania 60.23
26 Luxembourg 59.56
27 Spain 59.18
Rank Country Score 28 Czech Republic 59.13
30 Latvia 58.63
34 Austria 58.09
38 Finland 56.58
42 Bulgaria 54.27
44 Poland 52.47
45 Estonia 52.45
48 Greece 52.04
49 Netherlands 50.28
Table 5: Climate Change Performance Index for EU Member Countries
© Germanwatch 2012
Rank Country Score 4 Denmark 72.61
5 Sweden 69.37
6 Portugal 67.81
7 Switzerland 67.61
8 Germany 67.54
9 Ireland 67.48
10 United Kingdom 67.33
12 Hungary 66.41
13 Belgium 65.20
14 Mexico 64.91
Rank Country Score 15 France 64.74
16 Slovak Republic 64.64
17 Iceland 64.16
21 Italy 61.26
26 Luxembourg 59.56
27 Spain 59.18
28 Czech Republic 59.13
31 Norway 58.38
34 Austria 58.09
38 Finland 56.58
Rank Country Score 40 Australia 55.39
41 New Zealand 54.48
43 United States 53.51
44 Poland 52.47
47 Japan 52.10
48 Greece 52.04
49 Netherlands 50.28
51 Korea 49.93
57 Turkey 46.60
58 Canada 45.16
Table 4: Climate Change Performance Index for OECD Member Countries
CLIMATE CHANGE PERFORMANCE
index2013

Climate Change Performance Index 2013 • by Country Group – B
© Germanwatch 2012
Rank Country Score 12 Hungary 66.41
16 Slovak Republic 64.64
18 Romania 62.67
19 Ukraine 62.22
22 Slovenia 60.98
Rank Country Score 25 Lithuania 60.23
28 Czech Republic 59.13
30 Latvia 58.63
35 Belarus 57.98
39 Croatia 56.37
Rank Country Score 42 Bulgaria 54.27
44 Poland 52.47
45 Estonia 52.45
56 Russian Federation 46.65
59 Kazakhstan 39.96
Table 6: Climate Change Performance Index for Countries in Transition
© Germanwatch 2012
Rank Country Score 14 Mexico 64.91
20 Morocco 62.01
24 India 60.77
29 Egypt 59.04
32 Thailand 58.32
Rank Country Score
33 Brazil 58.20
36 Indonesia 57.07
37 South Africa 56.70
46 Algeria 52.34
50 Argentina 49.97
Rank Country Score 52 Chinese Taipei 49.40
53 Singapore 49.13
54 China 49.03
55 Malaysia 47.53
57 Turkey 46.60
Table 7: Climate Change Performance Index for Newly Industrialised Countries
© Germanwatch 2012
Rank Country Score 24 India 60.77
32 Thailand 58.32
36 Indonesia 57.07
Rank Country Score
47 Japan 52.10
51 Korea 49.93
52 Chinese Taipei 49.40
Rank Country Score
53 Singapore 49.13
54 China 49.03
55 Malaysia 47.53
Table 8: Climate Change Performance Index for ASEAN Member Countries plus India, China, Japan and Korean Republic
CLIMATE CHANGE PERFORMANCE
index2013
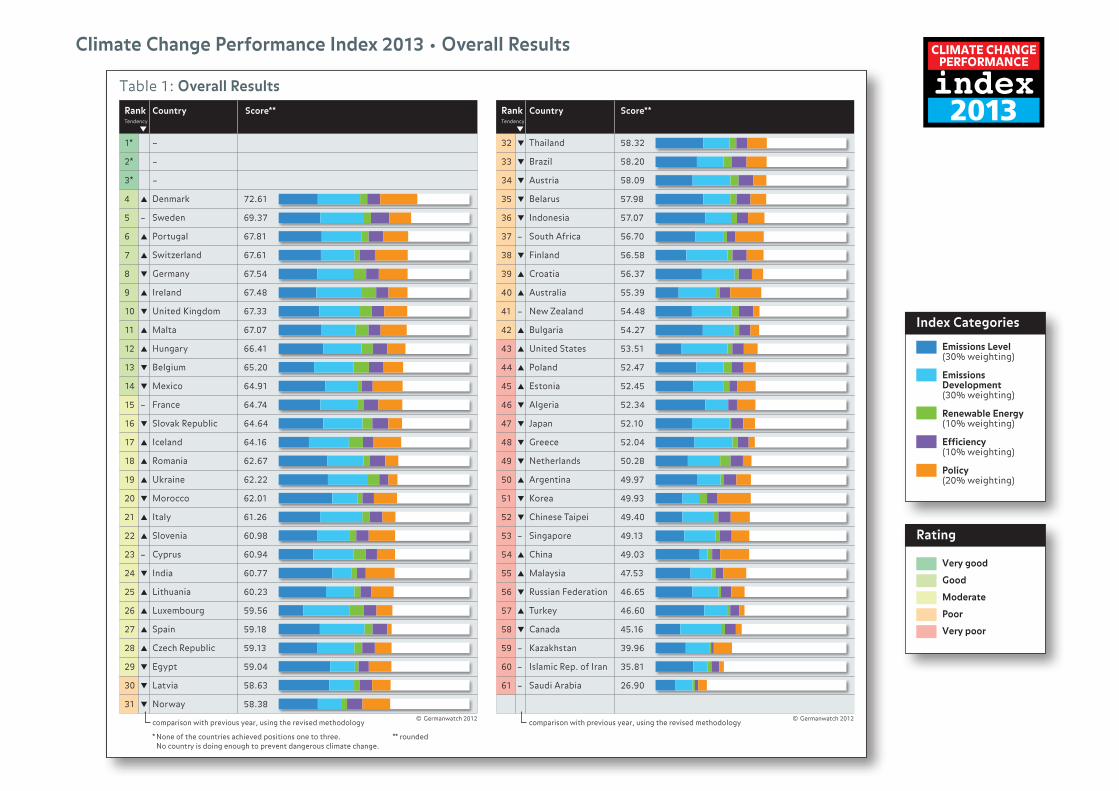
Overall Results • CCPI World Map
© Germanwatch 2012
Map 1a
Very good
Good
Moderate
Poor
Very poor
Not included in assessment
Performance
Map 1b
© Germanwatch 2012
CLIMATE CHANGE PERFORMANCE
index2013
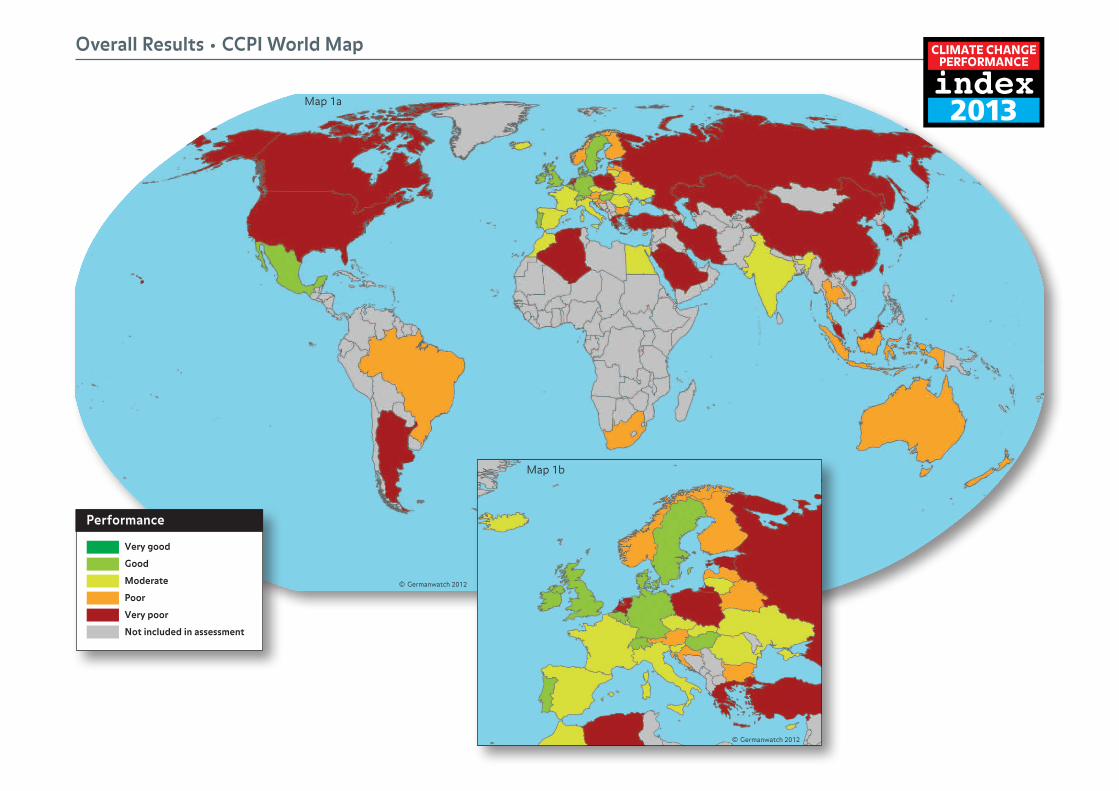
Partial Results • Emissions Level
© Germanwatch 2012
Map 2a
Very good
Good
Moderate
Poor
Very poor
Not included in assessment
Performance
Map 2b
© Germanwatch 2012
CLIMATE CHANGE PERFORMANCE
index2013
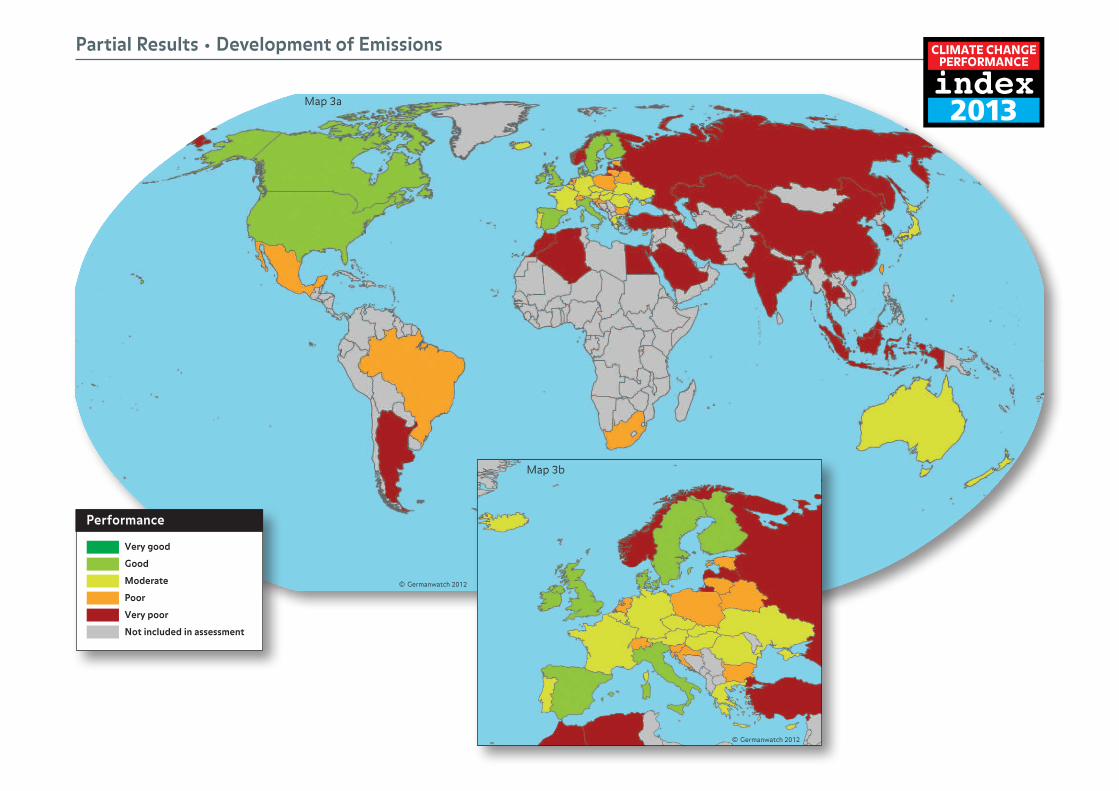
Partial Results • Development of Emissions
© Germanwatch 2012
Map 3a
Very good
Good
Moderate
Poor
Very poor
Not included in assessment
Performance
Map 3b
© Germanwatch 2012
CLIMATE CHANGE PERFORMANCE
index2013
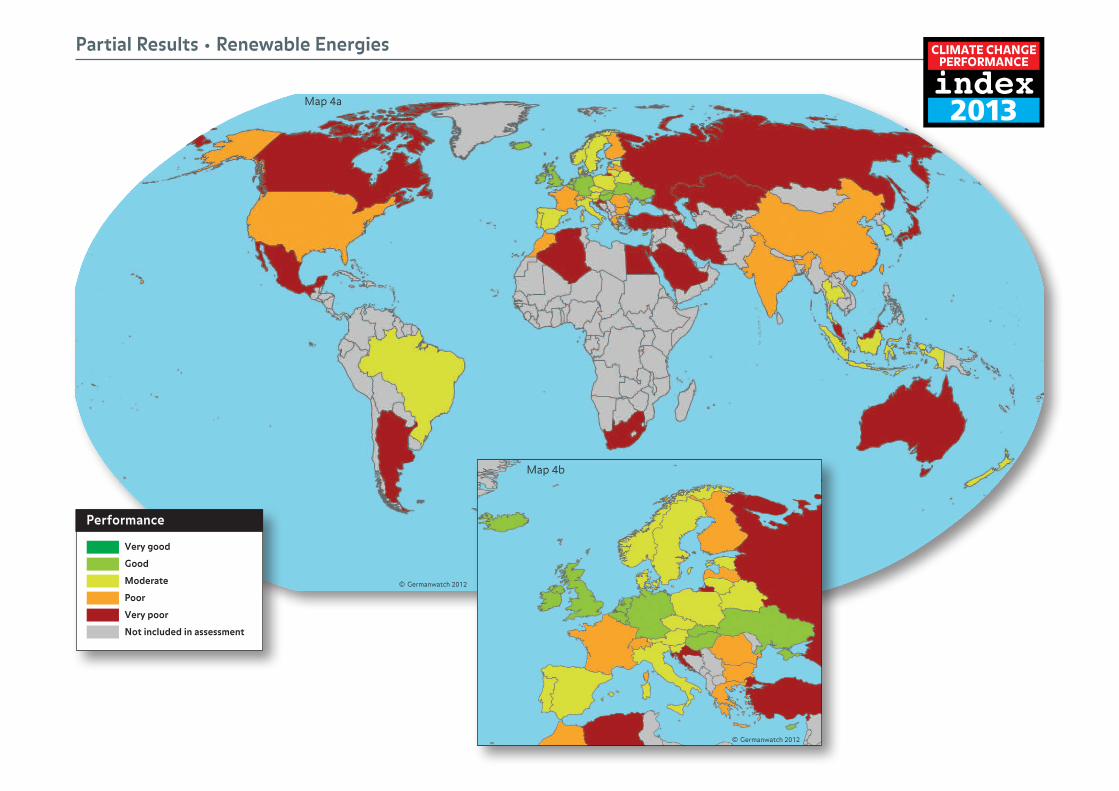
Partial Results • Renewable Energies
© Germanwatch 2012
Map 4a
Very good
Good
Moderate
Poor
Very poor
Not included in assessment
Performance
Map 4b
© Germanwatch 2012
CLIMATE CHANGE PERFORMANCE
index2013
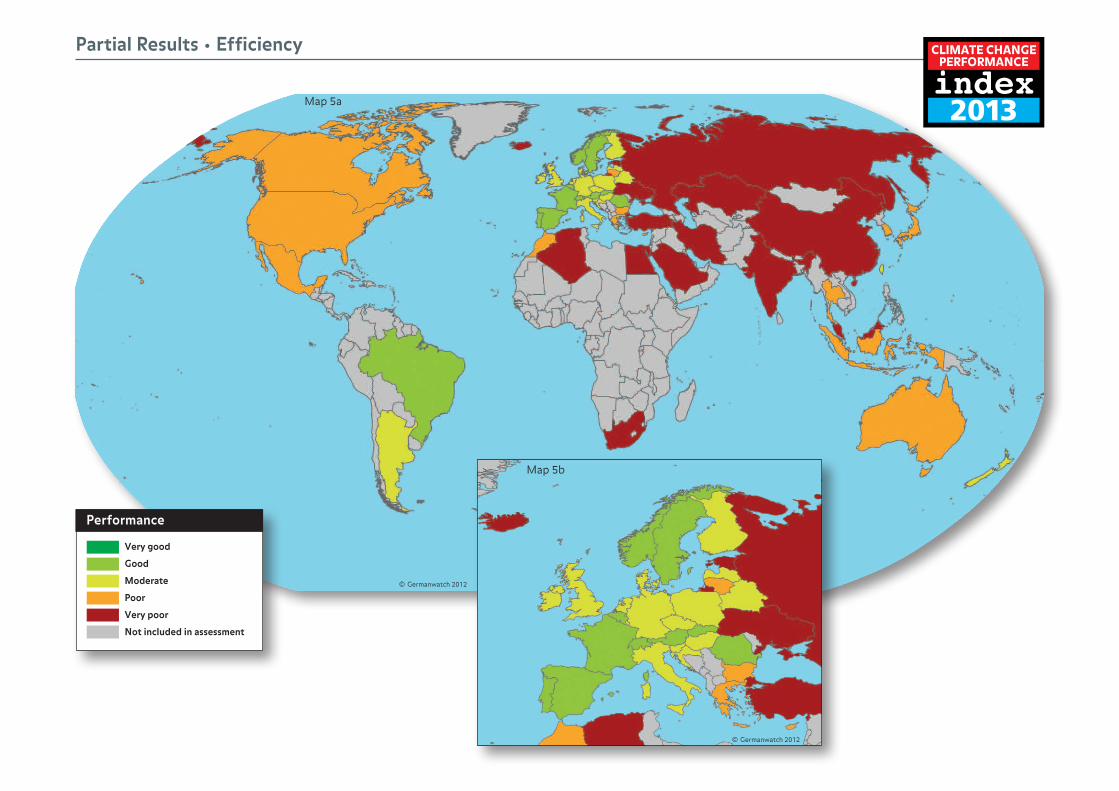
Partial Results • Efficiency
© Germanwatch 2012
Map 5a
Very good
Good
Moderate
Poor
Very poor
Not included in assessment
Performance
Map 5b
© Germanwatch 2012
CLIMATE CHANGE PERFORMANCE
index2013
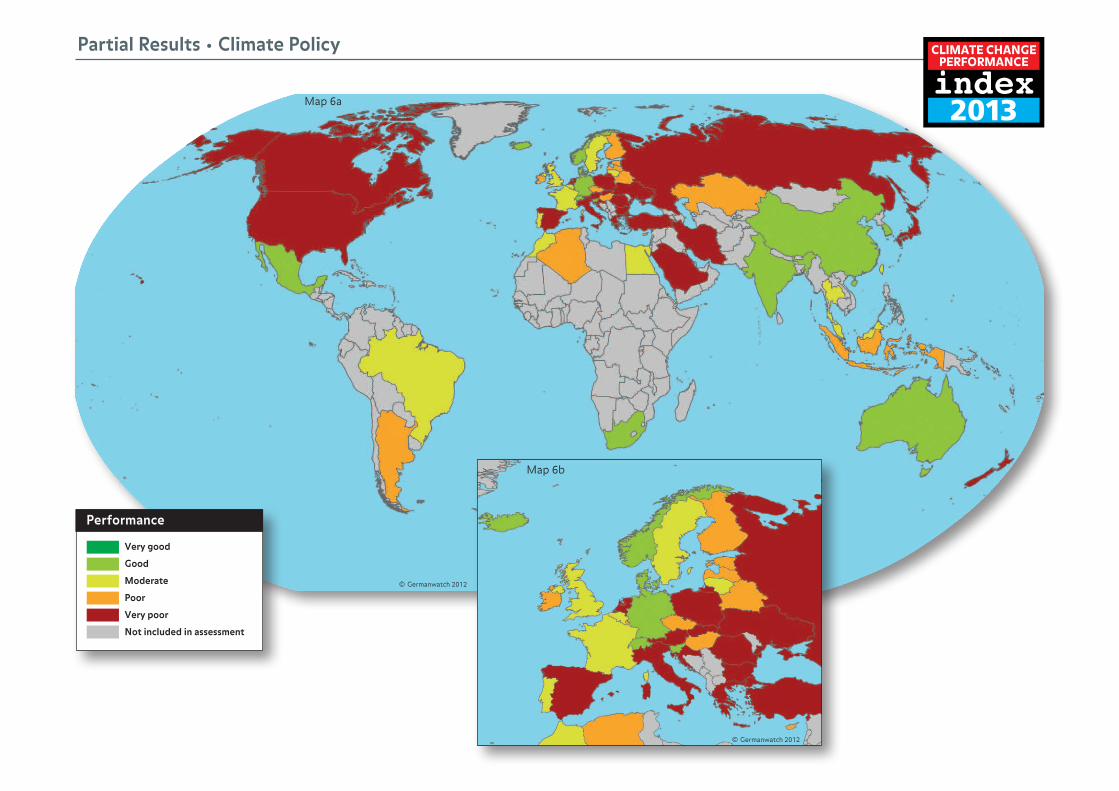
Partial Results • Climate Policy
© Germanwatch 2012
Map 6a
Very good
Good
Moderate
Poor
Very poor
Not included in assessment
Performance
Map 6b
© Germanwatch 2012
CLIMATE CHANGE PERFORMANCE
index2013