Embed Size (px)
Citation preview
Climate change impactson maize and dry bean yields of smallholder farmersin Honduras
Impacto del cambio climático sobre el rendimiento de maízy frijol de los pequeñosproductores de Honduras
Carlos G. H. DÍAZ-AMBRONAUniversidad Politécnica de Madrid, España
Corresponding [email protected]
Rubén GIGENAEscuela Agrícola Panamericana Zamorano,
Honduras
Carlos O. MENDOZAEscuela Agrícola Panamericana Zamorano,
Honduras
ResumenAbstract1. Introduction2. Material and Methods
2.1. Field experiments 2.2. Observed weather data2.3. Synthetic base climate2.4. Climate change scenarios2.5. Downscaling technique 2.6. Cropping system simulation model
3. Results3.1. Crop model performance3.2. Baseline climate3.3. Climate change scenarios and crop production
4. Discussion and conclusion5. Acknowledgments6. References7. Annex: List of acronyms

AbstractThe rotation maize and dry bean provides the main food supply of smallholder farmers in Honduras.
Crop model assessment of climate change impacts (2070–2099 compared to a 1961–1990 baseline) on a maize–dry bean rotation for several sites across a range of climatic zones and elevations in Honduras. Low productivity systems, together with an uncertain future climate, pose a high level of risk for food security. The cropping systems simulation dynamic model CropSyst was calibrated and validated upon field trail site at Zamorano, then run with baseline and future climate scenarios based upon general circulation models (GCM) and the ClimGen synthetic daily weather generator. Results indicate large uncertainty in crop production from various GCM simulations and future emissions scenarios, but generally reduced yields at low elevations by 0 % to 22 % in suitable areas for crop production and increased yield at the cooler, on the hillsides, where farming needs to reduce soil erosion with conservation techniques. Further studies are needed to investigate strategies to reduce impacts and to explore adaptation tactics.
Keywords: Central America, Crop Simulation model, CropSyst, Food security, Subsistence, Subtropical.
ResumenLa rotación maíz–frijol es la fuente de alimentos de los pequeños productores de Honduras. Se ha
determinado el impacto del cambio climático (comparado 2070–2099 con 1961–1990) mediante un mo-delo de simulación de la rotación en localidades de Honduras de distintas zonas climáticas y altitudes. La baja productividad, unida a las incertidumbres sobre el clima futuro, genera un elevado riesgo sobre la seguridad alimentaria. El modelo de simulación de sistemas de cultivo CropSyst se ha calibrado y validado con datos de campo del Zamorano, después se ha aplicado al clima base y a los escenarios futuros de varias simulaciones de GCMs y escenarios de emisión, aplicando el generador de datos diarios ClimGen. Los resultados indican una gran incertidumbre, pero, en general, una reducción del rendimiento del 0 % al 22 % en las zonas bajas, más adecuadas para el cultivo y un aumento en las zonas más frías, en zonas montañosas donde la agricultura debe evitar la erosión mediante la aplicación de técnicas de conservación del suelo. Futuros estudios son necesarios para investigar cómo reducir el impacto y buscar estrategias de adaptación en las prácticas agrícolas.
Palabras clave: América central, modelo de simulación de cultivo, CropSyst, seguridad alimentaria, subsistencia, subtropical.
_5
Climate change impactson maize and dry bean yields of smallholder farmersin Honduras
Impacto del cambio climático sobre el rendimiento de maízy frijol de los pequeñosproductores de Honduras
Carlos G. H. DÍAZ-AMBRONAUniversidad Politécnica de Madrid, España
Corresponding [email protected]
Rubén GIGENAEscuela Agrícola Panamericana Zamorano,
Honduras
Carlos O. MENDOZAEscuela Agrícola Panamericana Zamorano,
Honduras
Revista Iberoamericana de Estudios de Desarrollo / Iberoamerican Journal of Development StudiesVolumen/volume 2, número/issue 1 (2013), pp. 4-22. ISSN: 2254-2035Recepción/received: 23.04.2012 Aceptación/accepted: 12.12.2012

CLIMATE CHANGE IMPACTS ON MAIZE AND DRY BEAN YIELDS… Carlos G. H. Díaz-Ambrona, Rubén Gigena y Carlos O. MendozaRevista Iberoamericana de Estudios de Desarrollo / Iberoamerican Journal of Development StudiesVolumen/volume 2, número/issue 1 (2013), pp. 4-22. ISSN: 2254-20356_
1 Introduction
Smallholder farmers of Honduras use traditional agricultural management for the popular rotation maize (Zea mays L.) and dry or common bean (Phaseolus vulgaris L.). These grains are consumed every day in 98 % of the households (Hintze et al 2003). The main growing period of maize is from May to October as summer monocrop, and represents 75 % of annual maize production (Barreto and Hartkamp 1999). From 1993 to 2003, average maize yields range from 1 to 2 t ha–1, with a country average of 1.407±0.108 t ha–1, and dry bean was 0.640±0.076 t ha–1. Since 1970, food production per capita has decreased due to an increase in population by 300 %, maize yield increased less than 40 % in the last 35 years, yearly rate of 10 kg ha–1, while bean productivity increased only 15 %, yearly rate of 2 kg ha–1 (FAO 2011). Arable land is 3.1 million hectares, 28.2 % of the country. Hillsides cover the 80 % of the country and have lower agricultural potential (Jansen et al 2006).
Impacts of climate change need to be assessed at household level, so that small farmers who depend on agriculture for survival can be properly targeted in research and development activities for poverty alleviation (Jones and Thornton 2003). Low productivity systems, together with an uncertain future climate, pose a high level of risk for food security in this country. General circulation models (GCMs) are numerical models that provide scenarios of climate change in areas without nested regional circulations models (RCMs) (Mearns et al 2001; Mearns et al 2003). GCM outputs are extracted at a monthly time scale and differences between modelled present–day and future climate are added to observed weather data to obtain future monthly data. Synthetic daily climate series can then be produced for current and future climates using weather generators based on statistical descriptions (Barrow et al 1996; Semenov et al 1998).
The objective was to study the first order impact on traditional farming systems of grain maize and common bean rotation. Steps to achieve this objective were: (i) calibrate and validate the CropSyst model under dry subtropical environment for the traditional cropping systems, and (ii) explore the impact of climate change on the basic grain supply system.
2Material and Methods
Crop simulation model had been used as transfer function of climate variability to crop yield (Reilly 1996). The generic model CropSyst (Stöckle et al 2003) can be used where crop information is scarce. This model had been used successfully to assess impact of climate change and climate

_7
CLIMATE CHANGE IMPACTS ON MAIZE AND DRY BEAN YIELDS… Carlos G. H. Díaz-Ambrona, Rubén Gigena y Carlos O. MendozaRevista Iberoamericana de Estudios de Desarrollo / Iberoamerican Journal of Development Studies
Volumen/volume 2, número/issue 1 (2013), pp. 4-22. ISSN: 2254-2035
variability on the yield of various crops (Parry et al 1999; Iglesias et al 2000; Bellocchi et al 2002; Parry et al 2004; Scott et al 2004; Mínguez et al 2007).
2.1. Field experiments
Data from field experiments of maize and dry bean were used to calibrate and validate CropSyst. Field experiments were conducted from 1998–2002 at Zamorano in the Yegüare Valley, Central Honduras (Latitude 14º00’45”N, Longitude 87º00’79”W, Elevation 780 masl). We used five maize cultivars (Guayape, Cargill C–343, HB–104, DeKalb B–338, H–27), including hybrids and open pollinated types, to run the model. The 12 cultivars of common red bean included in the experiment were: RAB–50, RAB–20, RAB–205, Desarrural, Desarrural gene I, Cuarenteño Brillante, Zamorano, Danlí 46, UW22–34, Dorado, Honduras43–40 and Tío Canela 75.
2.2. Observed weather data
There are few reliable long time weather series for Honduras. Most of the accessible data are monthly precipitation and temperature. We evaluated original monthly data from 14 stations provided from Fundación Hondureña de Investigación Agrícola (Paz and Mata 1999) and from Zamorano and selected the most representative and complete ones (figure 1 and table 1). The locations selected were representative of
Figure 1Location and weather station in Honduras: 1, Zamorano; 2, Comayagua; 3, La Esperanza; 4, La Lima 5, Valle de Sula. Red points are weather stations with monthly data available at METART from FAO.

8_
CLIMATE CHANGE IMPACTS ON MAIZE AND DRY BEAN YIELDS… Carlos G. H. Díaz-Ambrona, Rubén Gigena y Carlos O. MendozaRevista Iberoamericana de Estudios de Desarrollo / Iberoamerican Journal of Development StudiesVolumen/volume 2, número/issue 1 (2013), pp. 4-22. ISSN: 2254-2035
Valle de Sula La Lima Comayagua Zamorano La Esperanza
Mean air temperature ºC
January 24.8 23.6 22.6 22.5 14.2
February 25.1 24.5 23.9 23.4 14.7
March 26.0 25.8 25.4 25.2 15.5
April 26.6 27.2 26.7 27.0 17.4
May 27.3 27.1 26.4 26.4 17.7
June 26.7 27.0 25.3 25.1 17.9
July 26.7 26.4 25.2 24.4 17.4
August 26.8 26.7 25.0 24.7 17.3
September 26.7 26.4 24.4 24.6 16.8
October 25.8 25.5 24.2 24.2 16.1
November 25.1 24.4 23.1 23.2 15.4
December 24.4 23.4 22.2 22.6 14.3
ANNUAL 26.1 25.0 20.8 24.4 16.2
Precipitation mm
January 163 59 8 8 7
February 110 38 1 7 5
March 120 46 5 12 12
April 60 35 24 42 76
May 61 59 75 150 140
June 90 135 112 150 286
July 162 99 84 129 129
August 201 113 103 160 184
September 194 150 154 202 252
October 303 108 54 120 46
November 419 164 38 43 46
December 222 94 135 17 18
ANNUAL 1991 987 541 1039 1297
Table 1Temperature and precipitation regimes: Monthly and annual mean values correspond to observed weather data (Honduras).
different elevation, temperatures and precipitation regimes. The five locations were Valle de Sula (Latitude N 15º 44’ 11”, longitude W 87º 49’ 15”, 10 masl, from 1986 to 1998), La Lima (Latitude 15º 25’ 36”, longitude W 87º 56’ 07”, 30 masl, from 1987 to 1998), Comayagua (Latitude 14º 24’ 18”, longitude W 87º 39’ 40”, 579 masl, from 1995 to 1998), Zamorano (Latitude 14º 00’ 45” N, longitude W 87º 00’ 79”, 780 masl, from 1945 to 2003) and La Esperanza (Latitude 14º 18’ 45”, longitude W 88º 18’ 17”, 1680 masl, from 1986 to 1998). Monthly average and standard deviation was calculated for rainfall, rain days, relative humidity, solar radiation, average, maximum and minimum temperatures.

CLIMATE CHANGE IMPACTS ON MAIZE AND DRY BEAN YIELDS… Carlos G. H. Díaz-Ambrona, Rubén Gigena y Carlos O. MendozaRevista Iberoamericana de Estudios de Desarrollo / Iberoamerican Journal of Development Studies
Volumen/volume 2, número/issue 1 (2013), pp. 4-22. ISSN: 2254-2035 _9
2.3. Synthetic base climate
ClimGen weather generator software version 4.1.05 (Stöckle et al 1999; 2001) was used to generate synthetic daily weather series from monthly data followed Donatelli et al (2002). ClimGen has been tested in many different locations (Villalobos et al 1999; Castellvi and Stöckle 2001; Jovanovic et al 2003). ClimGen uses the normal distribution to generate daily maximum and minimum temperature values. ClimGen generates precipitation, daily maximum and minimum temperature, solar radiation, air humidity, and wind speed. All generation parameters are calculated for each site of interest with enough information to parameterize the generator equations. ClimGen input were, average and standard deviation of monthly data for each location. Fraction of rainy days was calculated from observed rainy days (or data). Average and standard deviation of maximum and minimum temperatures were also introduced manually for each location. Obtained synthetic daily weather data was compared with monthly observed data.
2.4. Climate change scenarios
MAGICC software (Version 4.1, September 2003) was used to generate climate change data by the IPCC (Intergovernmental Panel on Climate Change) Third Assessment Report (Hulme et al 2000; Wigley et al 2002; Wigley 2003). Four global climate models were used to formulate the future climate projection and to reduce uncertainties through the use of an ensemble of projection (Ruiz–Ramos and Mínguez 2010). They differ on spatial resolution, in scenarios availability and ability to represent current climate. Models from GFDL (Geophysical Fluids Dynamics Lab), GISS (Goddard Institute for Space Studies) and UKMO (from Hadley Centre for Climate Prediction and Research at the United Kingdom Meteorological Office), in this last case the results of two versions HAD295 and HAD300 were used. Six Emissions Scenarios (SRES 2000) A2 and B2 were derived from GCM runs (IPCC–TGCIA 1999). The A2 family scenario is based on population projection of 15.1 billion by 2100 and to 635–856 ppm CO2 and the B2 family scenario is based on population projection of 10.4 billion by 2100 and corresponds to 500–600 ppm CO2 from 2070–2100 future greenhouse gas emissions (IPCC, 2000). For each family we choose three scenarios the «central», or «best–guess», the minimum and the maximum temperature. Four GCMs, two families and three scenarios give 24 combinations to assessment of impacts. Honduras is a small country covered by one grid in the CGM, the surrounding grids have more sea than land. Also, the scarcity of weather stations is another limitation for this study. Application like MarkSim (Jones and Thornton 2000) for observed weather interpolation does not work in Honduras.
From all climate models, extreme values were taken to cover all extreme possibilities (fig. 2). For the A2 family the highest value of temperature was the HAD300, and lowest the GFDL90. For the B2 family,

10_
CLIMATE CHANGE IMPACTS ON MAIZE AND DRY BEAN YIELDS… Carlos G. H. Díaz-Ambrona, Rubén Gigena y Carlos O. MendozaRevista Iberoamericana de Estudios de Desarrollo / Iberoamerican Journal of Development StudiesVolumen/volume 2, número/issue 1 (2013), pp. 4-22. ISSN: 2254-2035
the highest value of temperature was the HAD295 and the lowest value was provided by the GFDL90. In the case of the precipitation, the HAD300 for the case of greater change in the A2 family is used and the GISS95 for the level gives low change. In the same way, the HAD300 for the highest value of the B2 family and the HAD295 for the lowest value was used. The atmospheric CO2 concentrations were taken as the estimates used in the climate modelling experiments, which on average were 333 ppm for the 1961–1990 baseline, and 718 ppm and 566 ppm for 2071–2100 for the A2 and B2 scenarios respectively.
Figure 2Changes in average annual temperature and precipitation percentage for the 2070–2099 relative to 1961–1990 from 24 combinations of different Global Climate Models and scenarios SRES A2 and B2 for Honduras grid from MAGICC SCENGEN software. The average chosen scenarios low, medium and high changes for A2 (×) and B2 (+).
2.5. Downscaling technique
The downscaling technique was based on the application over the observed weather monthly data the average output of a combination of different global circulation model (GCM) and climate scenarios A2 and B2. This is the standard delta method, where the observed baseline data are adjusted for the mean monthly differences (for temperatures) or ratios (for precipitation) between climate model outputs for future and control climates. Relative changes in the outputs of the climate models were applied to meteorological observed monthly data (table 2). Then those data were introduced to ClimGen considering no change on standard deviation to obtained daily series for 2070–2099 that were used as inputs for crop model.

_11
CLIMATE CHANGE IMPACTS ON MAIZE AND DRY BEAN YIELDS… Carlos G. H. Díaz-Ambrona, Rubén Gigena y Carlos O. MendozaRevista Iberoamericana de Estudios de Desarrollo / Iberoamerican Journal of Development Studies
Volumen/volume 2, número/issue 1 (2013), pp. 4-22. ISSN: 2254-2035
Month
Scenario
A2 B2
High Medium Low High Medium Low
Projected increases in mean air temperature ºC
January 2.6 1.8 1.1 2.5 1.6 1.0
February 2.9 1.8 1.1 2.4 1.6 1.0
March 2.7 2.0 1.3 2.6 1.7 1.1
April 3.0 2.1 1.3 2.6 1.7 1.0
May 3.4 2.3 1.4 2.9 1.9 1.1
June 3.3 2.3 1.4 2.8 1.8 1.1
July 3.0 2.3 1.4 2.4 1.9 1.1
August 3.0 2.1 1.3 2.7 1.8 1.1
September 2.8 1.9 1.1 2.6 1.7 1.0
October 2.7 1.9 1.1 2.5 1.7 0.9
November 2.5 1.7 1.0 2.2 1.4 0.9
December 2.4 1.5 0.9 2.2 1.5 0.9
ANNUAL 2.9 2.0 1.2 2.5 1.7 1.0
Projected changes in mean cumulative precipitation %
January 47 47 39 10 9 7
February 34 35 30 14 14 12
March 27 25 20 6 4 3
April 6 13 7 13 14 12
May –6 0 3 –3 2 4
June –7 –4 –2 –1 5 5
July –20 –5 –9 –14 –8 –5
August –24 –15 –9 –19 –11 –6
September –20 –10 –3 –22 –6 –6
October –10 –9 –7 –8 –6 –5
November 30 24 17 8 21 14
December –15 –9 –4 –1 4 4
Table 2Climate change scenarios for Honduras as projected changes between baseline (1961-1990) and future climate (2070–2099) for differing trajectories SRES (Special Report on Emissions Scenarios) marker scenarios A2 and B2 projected a CO2 concentration of concentration of 718 ppmv and 566 ppmv at 2070–2099 period.
2.6. Cropping system simulation model
The cropping systems simulation model, acronym CropSyst (Stöckle and Nelson 2001; Stockle et al 2003) version 3.03.16 (Jan 20, 2003) was used. CropSyst includes modules dealing with plant phenology, growth, and yield, together with dynamics of nitrogen in crops and soils and soil water balance. Plant phenology development is driven by temperature and photoperiod. This model takes into account the effect of light, water, nitrogen, and CO2 on crop growth. The model uses the radiation and

12_
CLIMATE CHANGE IMPACTS ON MAIZE AND DRY BEAN YIELDS… Carlos G. H. Díaz-Ambrona, Rubén Gigena y Carlos O. MendozaRevista Iberoamericana de Estudios de Desarrollo / Iberoamerican Journal of Development StudiesVolumen/volume 2, número/issue 1 (2013), pp. 4-22. ISSN: 2254-2035
transpiration–use efficiency concepts to calculate daily biomass (Monteith 1977; Tanner and Sinclair 1983). Grain yield is calculated from total biomass accumulation during the crop season using the harvest index approach that is responsive to water stress. CropSyst does not simulate the effect of weeds, diseases nor pest. Crop response to elevated CO2 in CropSyst is considered a lineal positive effect (Tubiello et al 2000; Donatelli et al 2002).
For this study we used current cultivars and cultural practices for medium production technology. We used generic cultivars for maize (Batres 1988; Auhing 1989; Fuentes 1991; Villaseca 2001; Rubio 2002) and common bean (Guerrero 1988; Robleto 1988; Haro 1998) for CropSyst crop parameter (table 3). Root mean squared error (RMSE) and modeling efficiency were calculated (Loague and Green 1991).
Parameter Unit Maize Common bean
Base temperature ºC 10 3
Cut–off temperature ºC 30 22
Optimum mean daily temperature for growth ºC 20 20
Emergence ºC day 117 100
Leaf duration degree–days ºC day 600 700
Begin flowering ºC day 898 1000
Peak leaf area index (LAI) ºC day 800 1040
Begin grain filling ºC day 1211 1020
Physiological maturity ºC day 1669 1500
Maximum rooting depth m 0.80 1.50
Maximum water uptake mm/day 14 10
Maximum expected LAI m2/m2 5 5
Stem/leaf partition coefficient dimensionless 2.80 3.00
Evapotranspiration crop coefficient at full canopy dimensionless 1.10 1.00
Above ground biomass–transpiration coefficient kg kPa /m² m 7.50 5.75
Light to above ground biomass conversion g/MJ day 3.00 2.00
Actual to potential transpiration ratio that limits leaf area growth ratio 0.95 0.80
Actual to potential transpiration ratio that limits root growth ratio 0.50 0.50
Leaf water potential at the onset of stomatal closure J/kg –1200 –700
Wilting leaf water potential J/kg –1800 –1600
Extinction coefficient for solar radiation dimensionless 0.50 0.50
Unstressed harvest index ratio 0.43 0.50
Nitrogen uptake adjustment dimensionless 1 1
Nitrogen availability adjustment dimensionless 1 1
Maximum N concentration during early growth kgN/kg biomass 0.040 0.050
Minimum N concentration at maturity kgN/kg biomass 0.007 0.007
Maximum N concentration at maturity kgN/kg biomass 0.014 0.020
Ratio of growth at elevated reference ppm to baseline ppm atmospheric CO2 concentration
ratio 1.08 1.25
Elevated reference atmospheric CO2 concentration ppm 750 750
Baseline reference atmospheric CO2 concentration ppm 350 350
Table 3Calibrate parameters for cropping systems dynamic model CropSyst for a reference cultivar of maize and common bean for Honduras.

_13
CLIMATE CHANGE IMPACTS ON MAIZE AND DRY BEAN YIELDS… Carlos G. H. Díaz-Ambrona, Rubén Gigena y Carlos O. MendozaRevista Iberoamericana de Estudios de Desarrollo / Iberoamerican Journal of Development Studies
Volumen/volume 2, número/issue 1 (2013), pp. 4-22. ISSN: 2254-2035
Baseline and climate change scenarios were input into CropSyst. The model was run for each location with the same crop management and cultivar. As traditional farming did not change we considered to maintain this management in future scenarios. Simulation was made under rainfed conditions of the rotation maize–dry bean. Maize crop management comprised one tillage operations (field cultivator) before planting, sowing on May 2nd, and two nitrogen fertilizer applications for a total of 50 kg N/ha (30 kg N/ha at sowing and 25 days after sowing 20 kg N/ha). The maize stubble was burned, after tillage operations (field cultivator) for soil preparation, dry bean was sowed on September 16th. Dry bean was fertilized with two nitrogen applications for a total of 42 kg N/ha (12 kg N/ha at sowing and 30 days after sowing 30 kg N/ha). We chose the typical soils for each location (table 4) (FAO 1995; Castro 2003; Fernández 2003).
Location Elevation
masl
Soildepth
m
pH Hydrologiccondition
Texture Soil totalnitrogen
m
Soil organicmatter
%Sand %
Clay %
Silt %
Valle de Sula 10 1.20 7.35 Good 25 35 40 0.13 2.68
La Lima 30 1.20 6.97 Good 30 30 40 0.14 2.88
Comayagua 565 1.20 6.29 Fair 35 25 40 0.12 2.17
Zamorano 800 1.20 5.61 Fair 40 27 33 1.82 2.82
La Esperanza 1680 1.25 5.26 Fair 25 35 40 0.11 2.22
Table 4Representative soil type main properties entries for cropping systems dynamic model CropSyst simulation for different locations in Honduras.
3 Results
Results indicate large uncertainty in crop production from various GCM simulations and future emission scenarios, but generally reduced yields at low elevations by 0 % to 22 % and increased yields at the cooler, elevated sites. Low productivity systems, together with an uncertain future climate, pose a high level of risk for food security.
3.1. Crop model performance
Crop phenology is a good indicator of crop development and growth. Phenology depends on temperature and day length. Observed maize maturity ranged from 120 to 125 days after sowing. For all maize varieties the RMSE for emergence was 0.5 days and for flowering and maturity were 2.0 and 9.0 days respectively. All maize yields ranged from 0.6 to 6.5 t/ha, RMSE = 1.2 t/ha. Maize open lines measured average yield in Zamorano was 1.6 t/ha and standard deviation of 0.256 t/ha. Maize hybrid cultivar measured average yield in Zamorano was 3.4 t/ha and standard deviation of 1.17 t/ha. The simulation of maize grain yields ranged from 1.5 to 3.7 t/ha

14_
CLIMATE CHANGE IMPACTS ON MAIZE AND DRY BEAN YIELDS… Carlos G. H. Díaz-Ambrona, Rubén Gigena y Carlos O. MendozaRevista Iberoamericana de Estudios de Desarrollo / Iberoamerican Journal of Development StudiesVolumen/volume 2, número/issue 1 (2013), pp. 4-22. ISSN: 2254-2035
(RMSE = 0.786 t/ha, and modelling efficiency of –0.48). Regression relation of measured and simulated (line 1:1) of grain yield in maize and common bean (figure 3) showed a better model performance of common bean than maize. Observed common bean yield ranged from 0.86 to 2.2 t/ha. Observed crop maturity ranged from 70 (cultivar Desarrural) to 82 (cultivar UW 22–34) days after sowing common bean secondary season crop (growing period during the dry season) showed a 1.29 t/ha and standard deviation of 0.36 t/ha, and for sowing as main crop (during the wet season) yield increased to 1.73 t/ha and standard deviation of 0.34 t/ha (figure 3). Common bean yield simulation was better than maize. The CropSyst model provided good estimates of common bean (r2 = 0.81, root mean squared error of 0.342 t/ha and modelling efficiency of 0.59).
Figure 3Observed versus simulated yield with cropping systems dynamic model CropSyst in Honduras for maize and common bean.
3.2. Baseline climate
Climate in Valle de Sula and La Lima, in the northern coast, shows a wet tropical climate, warm temperatures (26.1 ºC and 25 ºC average annual temperature respectively) and high rainfall (1991 mm and 987 mm average annual precipitation respectively).
Comayagua has dry tropical weather with the lowest annual precipitation (541 mm) and high variabillity, annual mean temperature is 20.8 ºC. Zamorano is dry tropical, with a strong dry season and high precipitation variability during the rainy seasons, annual precipitation is 1039 mm and mean temperature is 24.4 ºC. Long series of data for monthly rainfall recorded at Zamorano showed short and constant cycles of dry and wet periods. The coldest site is La Esperanza (mean annual temperature of 16.2 ºC), it is the highest weather station located in the central mountains of the country, and it has a temperate climate with annual precipitation of 1297 mm.

_15
CLIMATE CHANGE IMPACTS ON MAIZE AND DRY BEAN YIELDS… Carlos G. H. Díaz-Ambrona, Rubén Gigena y Carlos O. MendozaRevista Iberoamericana de Estudios de Desarrollo / Iberoamerican Journal of Development Studies
Volumen/volume 2, número/issue 1 (2013), pp. 4-22. ISSN: 2254-2035
3.3. Climate change scenarios and crop production
For Zamorano annual mean temperatures change from observed data of 2.8 ºC in scenario A2 high to –0.1 ºC in B2 low by 2070-2100 period. For the other locations, changes were related with projections from 2.9 ºC to 1 ºC. The change on precipitation regimes was low among all locations. The higher decrease was 13.2 % of annual rainfall in La Esperanza and similarly in Comayagua. In these locations precipitation reduction occurs in all scenarios. In Valle de Sula, the wettest area, there was not variations in rainfall (from +6.7 % to –1.4 % of annual 2145 mm).
Temperature increase had a direct effect over crop phenology. In all scenarios and locations, crop growth period, from sowing to crop maturity, showed a reduction due to warmer temperatures. Earlier crop flowering and maturity reduced potential yield. Maize maturity was reached 17 days earlier in Zamorano and 11 days earlier in Comayagua and la Esperanza. For common bean current crop periods is 63 to 83 days after sowing, respectively, going from warmer to cooler locations. Future scenarios showed reduction of 3 to 20 days from sowing to crop maturity.
Our results showed a slight impact on maize yield similar to Jones and Thornton (2003). Future climate change increased yield variability (figure 4). In Zamorano crop simulation under current weather data series
Figure 4Simulated maize and common bean average yields for different location and scenarios for current and extremes SRES marker scenarios A2 and B2 projected a CO2 concentration of 718 ppmv and 566 ppmv at 2070-2099 period, respectively arrow shows yield range between scenarios.

16_
CLIMATE CHANGE IMPACTS ON MAIZE AND DRY BEAN YIELDS… Carlos G. H. Díaz-Ambrona, Rubén Gigena y Carlos O. MendozaRevista Iberoamericana de Estudios de Desarrollo / Iberoamerican Journal of Development StudiesVolumen/volume 2, número/issue 1 (2013), pp. 4-22. ISSN: 2254-2035
showed maize yield of 3.9 t/ha and common bean of 2.7 t/ha. Crop yield under future climate scenarios was variable showing high uncertainties. From the extreme scenario A2 high, maize yield dropped to 2.03 t/ha, that represents 48 % decrease of present yield, but increased to 4.17 t/ha under B2 high scenario, a 7 % increase over present yields. Common bean yield ranged from 1.83 t/ha, that represents 32 % decrease, to 3.44 t/ha (28 % increase) respectively to B2 high to A2 low. Taking into account the intensive rotation maize–common beans, simulations showed an inverse relation between maize and common bean yields. Higher yield of maize reduced the yield in the following common bean.
Comayagua is the driest location of this study and all scenarios reduced rainfall. Crop simulation under current climate showed an average yield of 1.32 t/ha and 0.88 t/ha for maize and common bean respectively. Future climate produced a slow increase in yield of maize (4 %) and common bean (6 %) obtained under B2 high scenario and strong decrease in maize (53 %), yield dropped to 0.7 t/ha, and in common bean (22 %) dropped to 0.69 t/ha, respectively for A2 medium and A2 high scenario.
The northern locations, Valle de Sula and La Lima, showed similar behaviour (figure 4). In the Valley of Sula current simulated maize yield was 2.09 t/ha. Maize yield increased only under B2 low scenario in which yield was 2.15 t/ha (3 % increase). The A2 high scenario maize yield was the lowest result with 0.83 t/ha (61 % decrease). The common bean yields in the Valley of Sula increased in all the cases, except in A2 high (0.99 t/ha, 44 % decrease), exceeding the present average of 1.76 t/ha. The greater production of yield was the A2 Low with 2.34 t/ha (33 % increase).
For La Lima there were not future scenarios better than the current maize yields. All future scenarios showed a yields reduction. The current climate had a yield of 1.58 t/ha, followed by the A2 Low scenario with 1.41 t/ha (11 % decrease) and the lowest yields were A2 and B2 high with 0.94 and 0.91 t/ha, respectively (41 % and 42 % decrease). Common bean yield in La Lima were similar behaviour than maize. The current yield was the highest with 1.88 t/ha. The highest yield of future scenarios (A2 low) was the 94 % of current yield (6 % decrease), it was 1.86 t/ha, and the smaller yield was the B2 high with 1.26 t/ha (33 % decrease).
La Esperanza is the coldest area in Honduras. We run two simulations to take into account different maize growth response to optimal temperature. One of them with a condition of 10 ºC crop optimum temperature required to cultivate and the second simulation was with the same cultivar used in the other locations; with a crop optimal growth temperature of 20 ºC (current cultivar). In the first case, the current climate showed a maize yield of 0.71 t/ha (production of biomass of 9.17 t/ha). In all future climate scenarios yield was increased from a range of 2.82 t/ha to 4.32 t/ha. Performance of simulated maize development was better in the warmer scenarios than with current low temperatures. In this case,

_17
CLIMATE CHANGE IMPACTS ON MAIZE AND DRY BEAN YIELDS… Carlos G. H. Díaz-Ambrona, Rubén Gigena y Carlos O. MendozaRevista Iberoamericana de Estudios de Desarrollo / Iberoamerican Journal of Development Studies
Volumen/volume 2, número/issue 1 (2013), pp. 4-22. ISSN: 2254-2035
the average of simulted yield for maize was 4.32 t/ha (increased 25 % in biomass of 11.45 t/ha) in the A2 high scenario and the B2 lower scenario had the smaller yield 1.78 t/ha. In the second case, there was no yield for the present climate since the condition optimal growth temperature of 20 ºC was too restrictive. Nevertheless, in the A2 low was the minimum yield of 2.51 t/ha and the one of highest yield was the B2 low with 3.59 t/ha. Again, two cases for this locality were formulated for common bean, like for maize, a 10 ºC optimal growth temperature and 20 ºC degrees in another one. For the case of 10 °C, all scenarios were over the present average of 1.14 t/ha. The maximum yield occurred in the A2 medium scenario with 2.53 t/ha (108 % increase) and the minimum 1.81 t/ha (46 % increase) on B2 high scenario. With the optimal growth temperature of 20 °C, the restriction was too severe in the present scenario, thus there was no emergence of the crop. The warmer scenarios showed better temperature conditions for maize development, the maximum maize yield was 3.37 t/ha in the A2 high scenario and the minimum yield was 2.72 t/ha on the B2 high scenario.
4Discussion and conclusion
The long term rainfall series from Zamorano in central Honduras showed a relatively constant subtropical dry–wet climate. We have extended the evaluation and application of CropSyst to a subtropical environment in maize smallholder production systems. The performance of the model in this region was comparable to obtained in other environments and other crop models in similar conditions. The accuracy of model predictions varied considerably with the maize variety examined and may need further development. Our study showed that the increases in temperature and low reduction in precipitation from different climate scenarios lead to reduce yields for both crops. Warmer temperatures reduce the length of the growing season. Maize and common bean yields decreased in all location under warmer scenario A2 high, except in mountain areas, where current yields are limited by cooler temperatures. Maize yield shows a higher impact, future yield range from 40 % to 110 % of current yields compared with common bean range from 60 % to 130 % in median and lower zones. In both cases future climate increased yield uncertainty and maximum and minimum records were diminished (figure 4). Impact of climate change is higher in maize than in common beans. We found better growing conditions under climate change in highlands, mountain areas were represented in our study by La Esperanza (1680 masl). Arable land availability in this mountain region is scarce and there is not possibility to increase crop production in a climate change scenario. This result is according with Jones and Thornton (2003) report in the Ethiopian highlands plateau.
18_
CLIMATE CHANGE IMPACTS ON MAIZE AND DRY BEAN YIELDS… Carlos G. H. Díaz-Ambrona, Rubén Gigena y Carlos O. MendozaRevista Iberoamericana de Estudios de Desarrollo / Iberoamerican Journal of Development StudiesVolumen/volume 2, número/issue 1 (2013), pp. 4-22. ISSN: 2254-2035
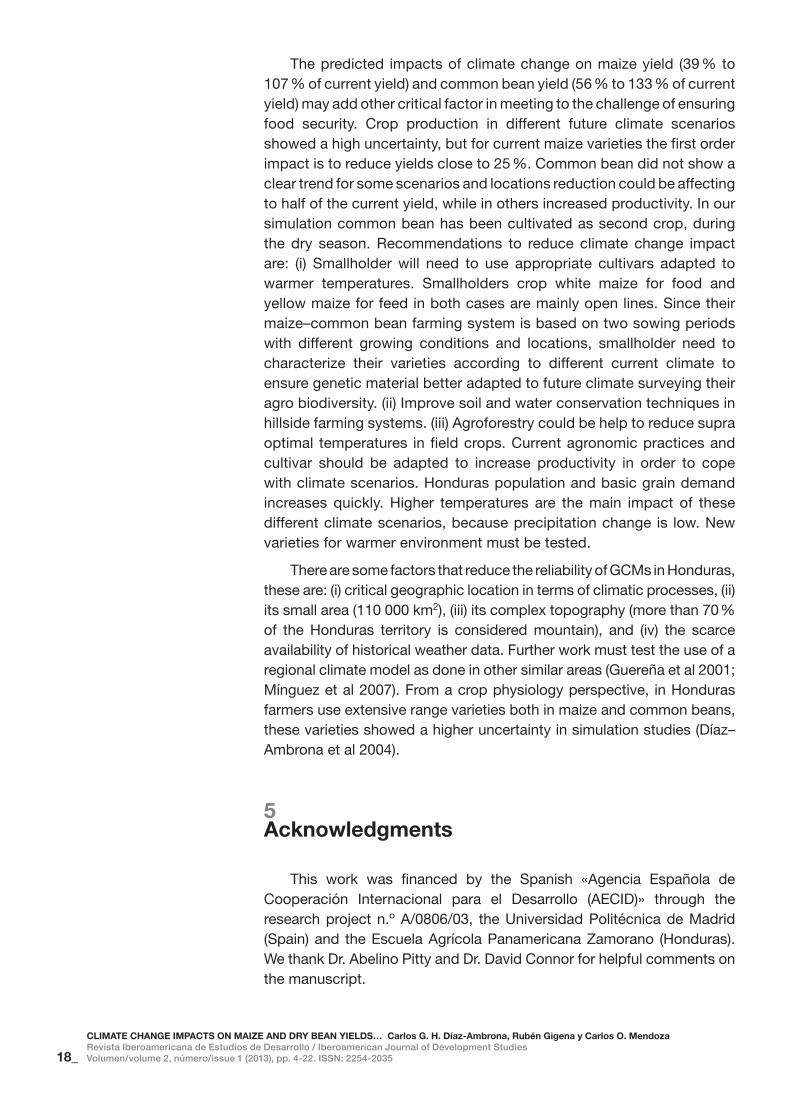
The predicted impacts of climate change on maize yield (39 % to 107 % of current yield) and common bean yield (56 % to 133 % of current yield) may add other critical factor in meeting to the challenge of ensuring food security. Crop production in different future climate scenarios showed a high uncertainty, but for current maize varieties the first order impact is to reduce yields close to 25 %. Common bean did not show a clear trend for some scenarios and locations reduction could be affecting to half of the current yield, while in others increased productivity. In our simulation common bean has been cultivated as second crop, during the dry season. Recommendations to reduce climate change impact are: (i) Smallholder will need to use appropriate cultivars adapted to warmer temperatures. Smallholders crop white maize for food and yellow maize for feed in both cases are mainly open lines. Since their maize–common bean farming system is based on two sowing periods with different growing conditions and locations, smallholder need to characterize their varieties according to different current climate to ensure genetic material better adapted to future climate surveying their agro biodiversity. (ii) Improve soil and water conservation techniques in hillside farming systems. (iii) Agroforestry could be help to reduce supra optimal temperatures in field crops. Current agronomic practices and cultivar should be adapted to increase productivity in order to cope with climate scenarios. Honduras population and basic grain demand increases quickly. Higher temperatures are the main impact of these different climate scenarios, because precipitation change is low. New varieties for warmer environment must be tested.
There are some factors that reduce the reliability of GCMs in Honduras, these are: (i) critical geographic location in terms of climatic processes, (ii) its small area (110 000 km2), (iii) its complex topography (more than 70 % of the Honduras territory is considered mountain), and (iv) the scarce availability of historical weather data. Further work must test the use of a regional climate model as done in other similar areas (Guereña et al 2001; Mínguez et al 2007). From a crop physiology perspective, in Honduras farmers use extensive range varieties both in maize and common beans, these varieties showed a higher uncertainty in simulation studies (Díaz–Ambrona et al 2004).
5Acknowledgments
This work was financed by the Spanish «Agencia Española de Cooperación Internacional para el Desarrollo (AECID)» through the research project n.º A/0806/03, the Universidad Politécnica de Madrid (Spain) and the Escuela Agrícola Panamericana Zamorano (Honduras). We thank Dr. Abelino Pitty and Dr. David Connor for helpful comments on the manuscript.

_19
CLIMATE CHANGE IMPACTS ON MAIZE AND DRY BEAN YIELDS… Carlos G. H. Díaz-Ambrona, Rubén Gigena y Carlos O. MendozaRevista Iberoamericana de Estudios de Desarrollo / Iberoamerican Journal of Development Studies
Volumen/volume 2, número/issue 1 (2013), pp. 4-22. ISSN: 2254-2035
6References
AUHING JI (1989). Evaluation of different doses and times from application of nitrogen, and methods of positioning of phosphorus on the yield of the maize in Zamorano (Honduras). Escuela Agrícola Panamericana Zamorano, Tegucigalpa, Honduras (in Spanish, with abstract in English)
BARRETO HJ, HARTKAMP AD (1999). Analysis of Maize Production in Honduras: Linking Census Data to Environment Variables through Geographic Information Systems. NRG–GIS Series 99–02. Mexico DF, Mexico
BARROW E, HULME M, SEMENOV MA (1996). Effect of using different methods in the construction of climate change scenarios: examples from Europe. Climate Research 7:195–211
BATRES J (1988). Evaluation of the effect of dose of nitrogen using urea and ammonium sulphate on the yield of the maize in Zamorano. Escuela Agrícola Panamericana Zamorano, Tegucigalpa, Honduras (in Spanish, with abstract in English)
BELLOCCHI G, MAESTRINI C, FILA G, FONTANA F (2002). Assessment of the effects of climate change a case study in northern Italy. In: proceeding s of the VII ESA Congress, Cordoba, Spain
CASTELLVI F, STÖCKLE CO (2001). Comparing the performance of WGEN and ClimGen in the generation of temperature and solar radiation. Transactions of the ASAE 446:1683–1687
CASTRO RE (2003). Detailed characterization of soil in Zamorano. Escuela Agrícola Panamericana Zamorano, Tegucigalpa, Honduras (in Spanish, with abstract in English)
DÍAZ–AMBRONA CH, GIGENA R, MENDOZA CO (2004). Global Climate Change and Food Security for Small Farmers in Honduras. In: New directions for a diverse planet. Proceedings of the 4th International Crop Science Congress, Brisbane, Australia 941–942
DONATELLI M, TUBIELLO FN, PERUCH U, ROSENZWEIG C (2002). Impacts of climate change and elevated CO2 on sugar beet production in Northern and Central Italy. Italian Journal of Agronomy 6:133–142
FERNÁNDEZ JV (2003). Detailed characterization of soil in Zamorano for pasture management. Honduras. Escuela Agrícola Panamericana Zamorano, Tegucigalpa, Honduras (in Spanish, with abstract in English)
FAO (1995). Digital Soil Map of the World and Derived Soil Properties; Version 3.5. Landand Water Digital Media Series 1; Food and Agriculture Organization of the United Nations [FAO], Rome, Italy
FAO (2011). FAOSTAT: FAO Statistical Databases. Food and Agriculture Organization of the United Nations [FAO], Rome, Italy. http://www.fao.org, accessed 27 September 2011
FUENTES PA (1991). Determination of economic and technical optimal levels of density and fertilization within Hybrid Maize B–833 under the climatic conditions of the valley of Yeguare. Escuela Agrícola Panamericana Zamorano, Tegucigalpa, Honduras (in Spanish, with abstract in English)
GUEREÑA A, RUIZ–RAMOS M, DÍAZ–AMBRONA CH, CONDE JR, MÍNGUEZ MI (2001). Assessment of climate change and agriculture in Spain using climate models. Agronomy Journal 93:237–249
GUERRERO JH (1988). Study the yield potential of common bean (Phaseolus vulgaris L.) in Honduras. Escuela Agrícola Panamericana Zamorano, Tegucigalpa, Honduras (in Spanish, with abstract in English)
HARO MA (1998). Lime and nitrogen fertilization effect on yield and profit of common bean. Escuela Agrícola Panamericana Zamorano, Tegucigalpa, Honduras (in Spanish, with abstract in English)
HINTZE LH, RENKOWB M, SAIN G (2003). Variety characteristics and maize adoption in Honduras. Agricultural Economics 29:307–317

20_
CLIMATE CHANGE IMPACTS ON MAIZE AND DRY BEAN YIELDS… Carlos G. H. Díaz-Ambrona, Rubén Gigena y Carlos O. MendozaRevista Iberoamericana de Estudios de Desarrollo / Iberoamerican Journal of Development StudiesVolumen/volume 2, número/issue 1 (2013), pp. 4-22. ISSN: 2254-2035
HULME M, WIGLEY TML, BARROW EM, RAPER SCB, CENTELLA A, SMITH S, CHIPANSHI A (2000). Using a climate scenario generator in vulnerability and adaptation assessments: MAGICC and SCENGEN Workbook. Climatic Research Unit, University of East Anglia, Norwich, UK
IGLESIAS A, ROSENZWEIG C, PEREIRA D (2000). Agricultural impacts of climate change in Spain: developing tools for a spatial analysis. Global Environmental Change–Human and Policy Dimensions 10:69–80
IPCC (2000). Emissions Scenarios. Prepared by N Nakicenovic and R Swart, Cambridge University Press, UK, 570. Available from Cambridge University Press, The Edinburgh Building Shaftesbury Road, Cambridge CB2 2RU, England http://www.ipcc.ch/ipccreports/sres/emission accessed 22 October 2012
IPCC–TGCIA (1999). Guidelines on the Use of Scenario Data for Climate Impact and Adaptation Assessment. Version 1. Prepared by Carter; TR; M. Hulme; and M. Lal; Intergovernmental Panel on Climate Change; Task Group on Scenarios for Climate Impact Assessment, Bern, Switzerland
JANSEN HGP, PENDER J, DAMON A, SCHIPPER R (2006). Rural Development Policies and Sustainable Land Use in the Hillside Areas of Honduras: A Quantitative Livelihoods Approach. Research report 147, International Food Policy Research Institute, Washington, USA http://www.ifpri.org/sites/default/files/publications/rr147.pdf accessed 22 October 2012
JONES PG, THORNTON PK (2000). MarkSim: Software to generate daily weather data for Latin America and Africa. Agronomy Journal 93:445–453
JONES PG, THORNTON PK (2003). The potential impacts of climate change on maize production in Africa and Latin America in 2055. Global Environmental Change 13:51–59
JOVANOVIC NZ, ANNANDALE JG, BENADE N, CAMPBELL GS 2003. CLIMGEN–UP: A user–friendly weather data generator. South African Journal of Plant and Soil 20:203–205
LOAGUE K, GREEN RE (1991). Statistical and graphical methods for evaluating solute transport models: overview and application. Journal of Contamination Hydrology 7:51–73
MEARNS LO, EASTERLING W, HAYS C (2001). Comparison of agricultural impacts of climate change calculated from high and low resolution climate model scenarios. Part I: The uncertainty due to spatial scale. Climate Change 51:131–172
MEARNS LO, GIORGI F, MCDANIEL L, SHIELDS C (2003). Climate scenarios for the southeast U.S. based on GCM and regional model simulations. Climate Change 60:7–35
MÍNGUEZ MI, RUIZ–RAMOS M, DÍAZ–AMBRONA CH, QUEMADA M, SAU F (2007). First–order impacts on winter and summer crops assessed with various high–resolution climate models in the Iberian Peninsula. Climate Change 81:343–355
MONTEITH JL (1977). Climate and crop efficiency of crop production in Britain. Philosophical Transactions of the Royal Society B 281:277–329
PARRY ML, ROSENZWEIG C, IGLESIAS A, FISCHER G, LIVERMORE M (1999). Climate change and world food security: A new assessment. Global Environmental Change 9:51–67
PARRY ML, ROSENZWEIG C, IGLESIAS A, FISCHER G, LIVERMORE M (2004). Effects of climate change on global food production under SRES emissions and socio–economic scenarios. Global Environmental Change 14:53–67
PAZ F, MATA JH (1999). Weather data from FHIA 1986–1998. Fundación Hondureña de Investigación Agrícola, La Lima, Honduras (in Spanish)
REILLY J (1996). Climate Change; global agriculture and regional vulberability, 237–266. In: Bazzaz F, Sombrock W. Eds. Global Climate Change and Agricultural Production. Wiley, Chichester, UK
ROBLETO EA (1988). Effect of the fertilization with calcium, phosphorus and molybdenum in the nitrogen fixation and yield common bean. Escuela Agrícola Panamericana Zamorano, Tegucigalpa, Honduras (in Spanish, with abstract in English)
RUBIO R (2002). The effect of nitrogen leaf fertilization on maize. Escuela Agrícola Panamericana Zamorano, Tegucigalpa, Honduras (in Spanish, with abstract in English)

_21
CLIMATE CHANGE IMPACTS ON MAIZE AND DRY BEAN YIELDS… Carlos G. H. Díaz-Ambrona, Rubén Gigena y Carlos O. MendozaRevista Iberoamericana de Estudios de Desarrollo / Iberoamerican Journal of Development Studies
Volumen/volume 2, número/issue 1 (2013), pp. 4-22. ISSN: 2254-2035
RUIZ–RAMOS M, MÍNGUEZ M (2010). Evaluating uncertainty in climate change impacts on crop productivity in the Iberian Peninsula. Climate Research 44: 69–82
SCOTT MJ, VAIL LW, JAKSCH JA, STÖCKLE CO, KEMANIAN AR (2004). Water exchanges: tools to beat El Niño climate variability in irrigated agriculture. Journal of the American Water Management Association 40(1):15–31
SEMENOV MA, BROOKS RJ, BARROW EM, RICHARDSON CW (1998). Comparison of the WGEN and LARS–WG stochastic weather generators for diverse climates. Climate research 10:95–107
SRES (2000). Special Report on Emissions Scenarios: A special report of Working Group III of the Intergovernmental Panel on Climate Change, Cambridge University
STÖCKLE CO, NELSON R (2001). Cropping Systems Simulation Model User’s Manual. Biological Systems Engineering Department; Washington State University. http://www.bsyse.wsu.edu/CS_Suite, accessed 27 September 2011
STÖCKLE CO, CAMPBELL GS, NELSON R (1999). ClimGen manual. Biological Systems Engineering Department; Washington State University, Pullman, WA, USA
STÖCKLE CO, DONATELLI M, NELSON R (2003). CropSyst; a cropping systems simulation model. European Journal of Agronomy 18:289–307
STÖCKLE CO, NELSON R, DONATELLI M, CASTELLVI F (2001). ClimGen: a flexible weather generation program. In: Donatelli M (ed.). Proceedings of the 2nd International Symposium Modelling Cropping Systems, European Society of Agronomy, Florence, Italy 34–41
TANNER CB, SINCLAIR TR (1983). Efficient water use in crop production: research or re–search? In: Taylor H, Jordan WR, Sinclair TR (eds.). Limitations to efficient water use in crop production. American Society for Agronomy, Madison, WI, USA 1–27
TUBIELLO FN, DONATELLI M, ROSENZWEIG C, STÖCKLE CO (2000). Effects of climate change and elevated CO2 on cropping systems: model predictions at two Italian locations. European Journal of Agronomy 13:179–189
VILLALOBOS F, ORGAZ F, TESTI L, FERERES E (1999). The use of synthetic weather data for strategy analysis in cropping system modelling. In: M. Donatelli (ed.). Proceedings of the International Symposium Modelling Cropping Systems. European Society for Agronomy, Lérida, Spain 269–270
VILLASECA I (2001). The effect of sowing density and nitrogen on maize yield in Zamora-no (Honduras). Escuela Agrícola Panamericana Zamorano, Tegucigalpa, Honduras (in Spanish, with abstract in English)
WIGLEY TML (2003). MAGICC/SCENGEN 4.1: Technical Manual. UCAR–Climate and Global Dynamics Division, Boulder, Colorado. http://www.cgd.ucar.edu/cas/wigley/magicc/index.html, accessed 27 September 2011
WIGLEY TML, SMITH SJ, PRATHER MJ (2002). Radiative forcing due to reactive gas emissions. Journal of Climate 15:2690–2696
7Annex: List of acromyms
A2: SRES scenario family A2
B2: SRES scenario family B2
ClimGen: Climate weather generator software
CropSyst: Cropping systems simulation dynamic model software
GCM: General circulation model
GFDL: Geophysical Fluids Dynamics Lab
GISS: Goddard Institute for Space Studies
HAD295: A general circulation model for the Hadley Centre Coupled Model version 2
HAD300: A general circulation model for the Hadley Centre Coupled Model version 3
IPCC: Intergovernmental Panel on Climate Change
MAGICC: Model for the Assessment of Greenhouse–gas Induced Climate Change

22_
CLIMATE CHANGE IMPACTS ON MAIZE AND DRY BEAN YIELDS… Carlos G. H. Díaz-Ambrona, Rubén Gigena y Carlos O. MendozaRevista Iberoamericana de Estudios de Desarrollo / Iberoamerican Journal of Development StudiesVolumen/volume 2, número/issue 1 (2013), pp. 4-22. ISSN: 2254-2035
METART: Meteorological data and derived products from FAO
masl: Meters above sea level
ppmv: Parts per million by volume (106)
RCM: Regional circulation model
RMSE: Root mena square error
SCENGEN: Scenario Generator model
SRES: Special Report on Emissions Scenarios
UKMO: United Kingdom Meteorological Office