Embed Size (px)
Citation preview

REPORTFOOD POLICY
CLIMATE CHANGEGerald C. Nelson, Mark W. Rosegrant, Jawoo Koo, Richard Robertson, Timothy Sulser, Tingju Zhu, Claudia Ringler, Siwa Msangi, Amanda Palazzo, Miroslav Batka, Marilia Magalhaes, Rowena Valmonte-Santos, Mandy Ewing, and David Lee
Impact on Agriculture and Costs of Adaptation

Climate ChangeImpact on Agriculture and Costs of Adaptation
International Food Policy Research InstituteWashington, D.C.
Updated October 2009
Gerald C. Nelson, Mark W. Rosegrant, Jawoo Koo, Richard Robertson, Timothy Sulser, Tingju Zhu, Claudia Ringler, Siwa Msangi, Amanda Palazzo, Miroslav Batka, Marilia Magalhaes,
Rowena Valmonte-Santos, Mandy Ewing, and David Lee

Cover illustration adapted from photography by © Sven Torfinn/PANOS and © 2009 Klaus von Grebmer/IFPRI.
DOI: 10.2499/0896295354
Copyright © 2009 International Food Policy Research Institute. All rights reserved. Sections of this report may be reproduced for noncommercial and not-for-profit purposes without the express written permission of but with acknowledgment to the International Food Policy Research Institute. For permission to republish, contact [email protected].
ISBN 10-digit: 0-89629-535-4 ISBN 13-digit: 978-0-89629-535-3
ABOUT IFPRI
The International Food Policy Research Institute (IFPRI) was established in 1975. IFPRI is one of 15 agricultural research centers that
receives its principal funding from governments, private foundations, and international and regional organizations, most of which are
members of the Consultative Group on International Agricultural Research.
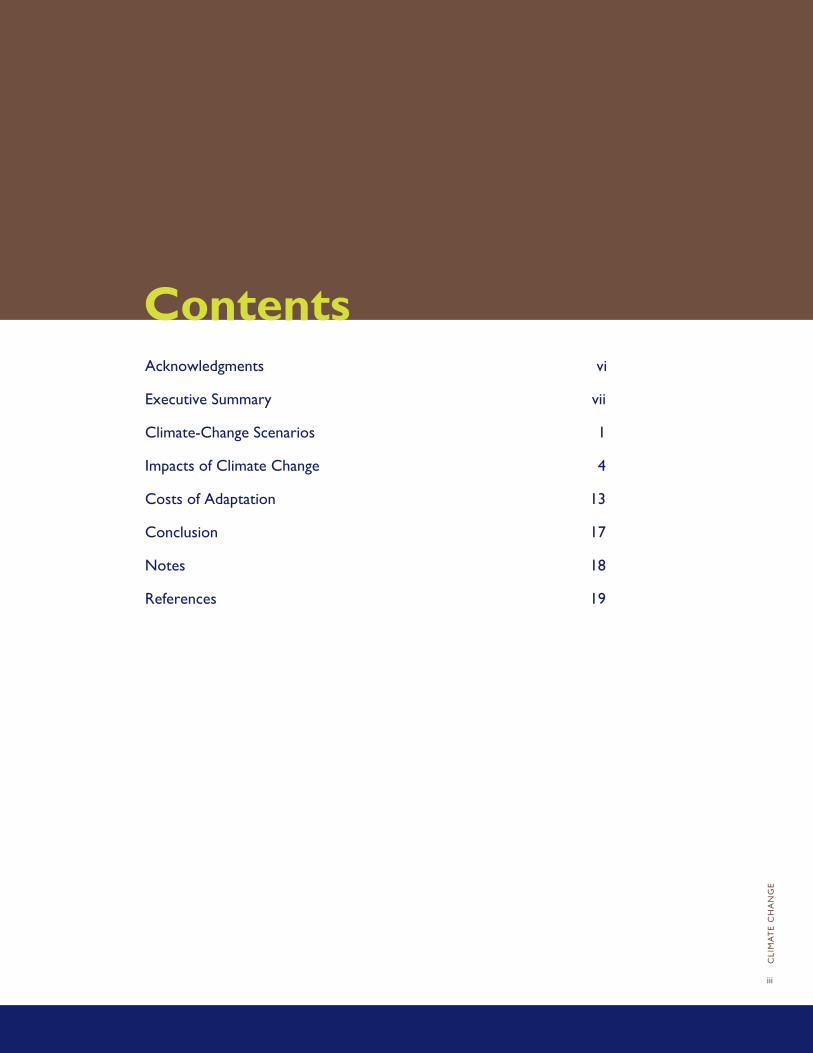
ContentsAcknowledgments vi
Executive Summary vii
Climate-Change Scenarios 1
Impacts of Climate Change 4
Costs of Adaptation 13
Conclusion 17
Notes 18
References 19
CLI
MA
TE
CH
AN
GE
iii
CLI
MA
TE
CH
AN
GE
iv
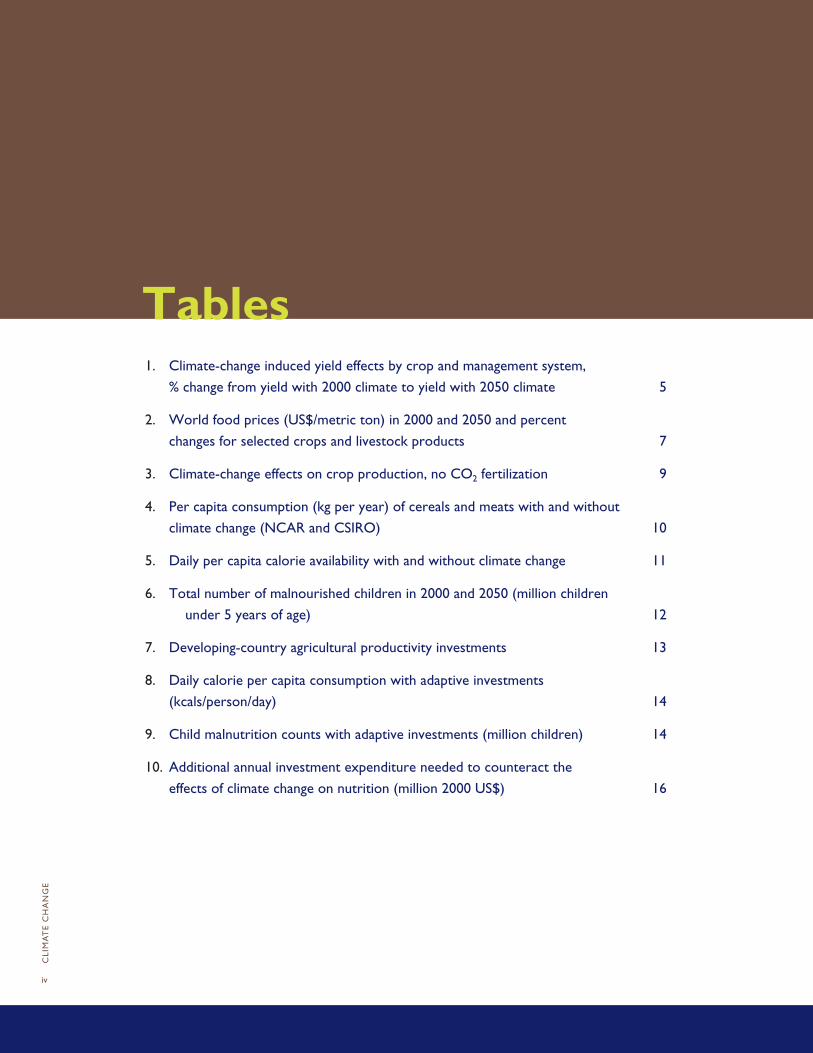
Tables1. Climate-change induced yield effects by crop and management system,
% change from yield with 2000 climate to yield with 2050 climate 5
2. World food prices (US$/metric ton) in 2000 and 2050 and percent
changes for selected crops and livestock products 7
3. Climate-change effects on crop production, no CO2 fertilization 9
4. Per capita consumption (kg per year) of cereals and meats with and without
climate change (NCAR and CSIRO) 10
5. Daily per capita calorie availability with and without climate change 11
6. Total number of malnourished children in 2000 and 2050 (million children
under 5 years of age) 12
7. Developing-country agricultural productivity investments 13
8. Daily calorie per capita consumption with adaptive investments
(kcals/person/day) 14
9. Child malnutrition counts with adaptive investments (million children) 14
10. Additional annual investment expenditure needed to counteract the
effects of climate change on nutrition (million 2000 US$) 16
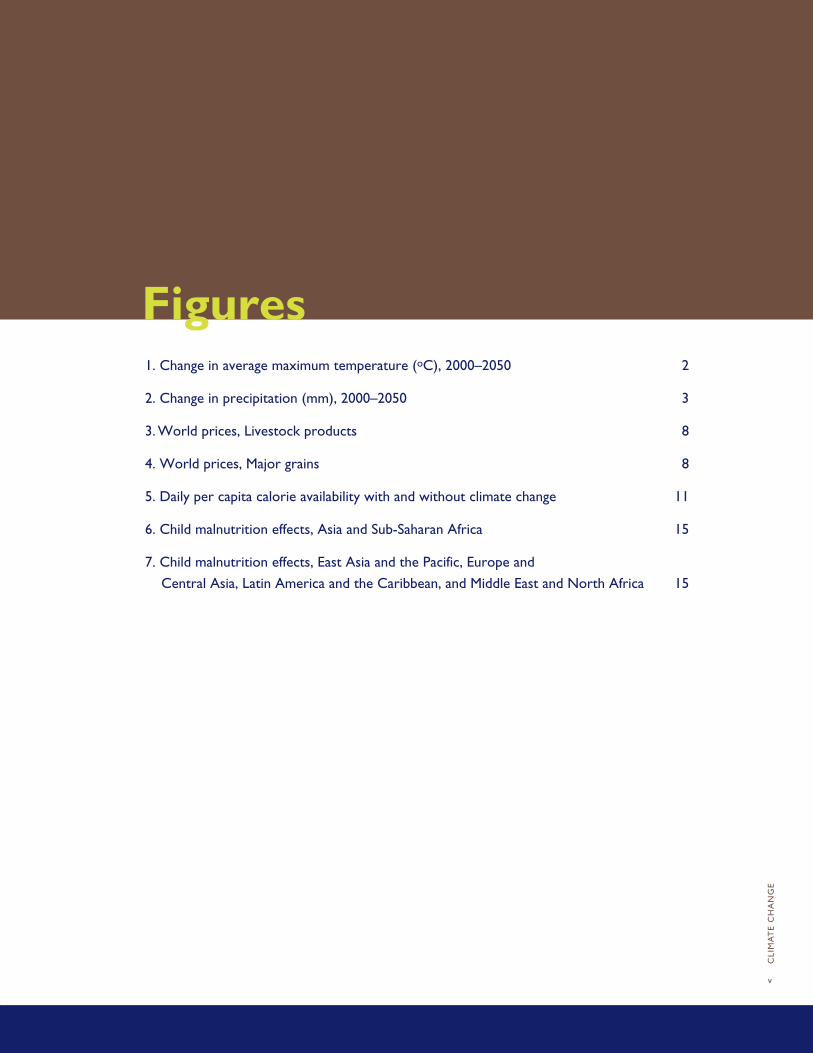
Figures1. Change in average maximum temperature (oC), 2000–2050 2
2. Change in precipitation (mm), 2000–2050 3
3. World prices, Livestock products 8
4. World prices, Major grains 8
5. Daily per capita calorie availability with and without climate change 11
6. Child malnutrition effects, Asia and Sub-Saharan Africa 15
7. Child malnutrition effects, East Asia and the Pacific, Europe and
Central Asia, Latin America and the Caribbean, and Middle East and North Africa 15
CLI
MA
TE
CH
AN
GE
v
CLI
MA
TE
CH
AN
GE
vi
Acknowledgments
The authors would like to acknowledge the financial support of the Asian Development Bank and the World
Bank (under the Economics of Adaptation to Climate Change Study) and the many useful comments and
suggestions from reviewers of earlier versions. Any errors remain the responsibility of the authors.
Financial Contributors and Partners
IFPRI’s research, capacity-strengthening, and communications work is made possible by its financial contributors and partners. IFPRI receives its principal funding from governments, private foundations, and international and regional organizations, most of which are members of the Consultative Group on International Agricultural Re-search (CGIAR). IFPRI gratefully acknowledges the generous unrestricted funding from Australia, Canada, China, Denmark, Finland, France, Germany, India, Ireland, Italy, Japan, the Netherlands, Norway, South Africa, Sweden, Switzerland, the United Kingdom, the United States, and the World Bank.

CLI
MA
TE
CH
AN
GE
vii
The Challenge
The unimpeded growth of greenhouse gas emissions is raising the earth’s temperature. The consequences
include melting glaciers, more precipitation, more and more extreme weather events, and shifting seasons. The accelerating pace of climate change, combined with global population and income growth, threatens food security everywhere.
Agriculture is extremely vulnerable to climate change. Higher temperatures eventually reduce yields of desirable crops while encouraging weed and pest proliferation. Changes in precipitation patterns in-crease the likelihood of short-run crop failures and long-run production declines. Although there will be gains in some crops in some regions of the world, the overall impacts of climate change on agriculture are expected to be negative, threatening global food security.
Populations in the developing world, which are already vulnerable and food insecure, are likely to be the most seriously affected. In 2005, nearly half of the economically active population in developing countries—2.5 billion people—relied on agriculture for its livelihood. Today, 75 percent of the world’s poor live in rural areas.1
This Food Policy Report presents research results that quantify the climate-change impacts mentioned above, assesses the consequences for food security, and estimates the investments that would offset the negative consequences for human well-being.
This analysis brings together, for the first time, detailed modeling of crop growth under climate change with insights from an extremely detailed global
agriculture model, using two climate scenarios to simulate future climate. The results of the analysis suggest that agriculture and human well-being will be negatively affected by climate change:
• In developing countries, climate change will cause yield declines for the most important crops. South Asia will be particularly hard hit.
• Climate change will have varying effects on irrigated yields across regions, but irrigated yields for all crops in South Asia will experience large declines.
• Climate change will result in additional price increases for the most important agricultural crops–rice, wheat, maize, and soybeans. Higher feed prices will result in higher meat prices. As a result, climate change will reduce the growth in meat consumption slightly and cause a more substantial fall in cereals consumption.
• Calorie availability in 2050 will not only be lower than in the no–climate-change scenario—it will actually decline relative to 2000 levels throughout the developing world.
• By 2050, the decline in calorie availability will increase child malnutrition by 20 percent relative to a world with no climate change. Climate change will eliminate much of the improvement in child malnourishment levels that would occur with no climate change.
• Thus, aggressive agricultural productivity investments of US$7.1–7.3 billion2 are needed to raise calorie consumption enough to offset the negative impacts of climate change on the health and well-being of children.
Executive Summary
CLI
MA
TE
CH
AN
GE
viii
RecommendationsThe results of this analysis suggest the following policy and program recommendations. 1. Design and implement good overall
development policies and programs. Given the current uncertainty about location-specific effects of climate change, good development policies and programs are also the best climate-change adaptation investments. A pro-growth, pro-poor development agenda that supports agricultural sustainability also contributes to food security and climate-change adaptation in the developing world. Adaptation to climate change is easier when individuals have more resources and operate in an economic environment that is flexible and responsive.
2. Increase investments in agricultural productivity. Even without climate change, greater investments in agricultural science and technology are needed to meet the demands of a world population expected to reach 9 billion by 2050. Many of these people will live in the developing world, have higher incomes, and desire a more diverse diet. Agricultural science- and technology-based solutions are essential to meet those demands. Climate change places new and more challenging demands on agricultural productivity. Crop and livestock productivity-enhancing research, including biotechnol-ogy, will be essential to help overcome stresses due to climate change. Crops and livestock are needed that are doing reasonably well in a range of production environ-ments rather than extremely well in a narrow set of climate conditions. Research on dietary changes in food animals and changes in irrigation-management practices is needed to reduce methane emissions. One of the key lessons of the Green Revolution is that improved agricultural productivity, even if not
targeted to the poorest of the poor, can be a powerful mechanism for alleviating poverty indirectly by creating jobs and lowering food prices. Productivity enhancements that increase farmers’ resilience in the face of climate-change pressures will likely have similar poverty-reducing effects. Rural infrastructure is essential if farmers are to take advantage of improved crop varieties and management techniques. Higher yields and more cropped area require maintaining and increasing the density of rural road networks to increase access to markets and reduce transaction costs. Investments in irrigation infrastructure are also needed, especially to improve the efficiency of water use, but care must be taken to avoid investments in places where water availability is likely to decline.
3. Reinvigorate national research and extension programs. Investment in laboratory scientists and the infrastructure they require is needed. Partnerships with other national systems and international centers are part of the solution. Collaboration with local farmers, input suppliers, traders, and consumer groups is also essential for effective development and dissemination of locally appropriate, cost-effective techniques and cultivars to help revitalize communications among farmers, scientists, and other stakeholders to meet the challenges of climate change. Within countries, extension programs can play a key role in information sharing by transferring technology, facilitating interaction, building capacity among farmers, and encouraging farmers to form their own networks. Extension services that specifically address climate-change adaptation include disseminating local cultivars of drought-resistant crop varieties, teaching improved management systems, and gathering information to facilitate

CLI
MA
TE
CH
AN
GE
ix
national research work. Farmer organizations can be an effective information-sharing mechanism and have the potential to provide cost-effective links between government efforts and farmer activities.
4. Improve global data collection, dissemination, and analysis. Climate change will have dramatic consequences for agriculture. However, substantial uncertainty remains about where the effects will be greatest. These uncertainties make it challenging to move forward on policies to combat the effects of climate change. Global efforts to collect and disseminate data on the spatial nature of agriculture need to be strengthened. Regular, repeated observations of the surface of the earth via remote sensing are critical. Funding for national statistical programs should be increased so that they can fulfill the task of monitoring global change. Understanding agriculture–climate interactions well enough to support adaptation and mitigation activities based on land use requires major improvements in data collection, dissemination, and analysis.
5. Make agricultural adaptation a key agenda point within the international climate negotiation process. International climate negotiations provide a window of opportunity for governments and civil-society organizations to advance proposals for practical actions on adaptation in agriculture.
6. Recognize that enhanced food security and climate-change adaptation go hand in hand. Climate change will pose huge challenges to food- security efforts. Hence, any activity that supports agricultural adaptation also enhances food security.
Conversely, anything that results in increased food security will provide the poor, especially the rural poor, with the resources that will help them adapt to climate change.
7. Support community-based adaptation strategies. Crop and livestock productivity, market access, and the effects of climate all are extremely location specific. International development agencies and national governments should work to ensure that technical, financial, and capacity-building support reaches local communities. They should also encour-age community participation in national adaptation planning processes. Community-based adaptation strategies can help rural communities strengthen their capacity to cope with disasters, improve their land-management skills, and diversify their livelihoods. While national adaptation policies and strategies are important, the implementation of these strategies at the local level will be the ultimate test of the effec-tiveness of adaptation.
8. Increase funding for adaptation programs by at least an additional $7 billion per year. At least $7 billion per year in additional funding is required to finance the research, rural infrastructure, and irrigation investments needed to offset the negative effects of climate change on human well-being. The mix of investments differs by region: Sub-Saharan Africa requires the greatest overall investment and a greater share of investments in roads, Latin America in agricultural research, and Asia in irrigation efficiency.
CLI
MA
TE
CH
AN
GE
1
CLI
MA
TE
CH
AN
GE
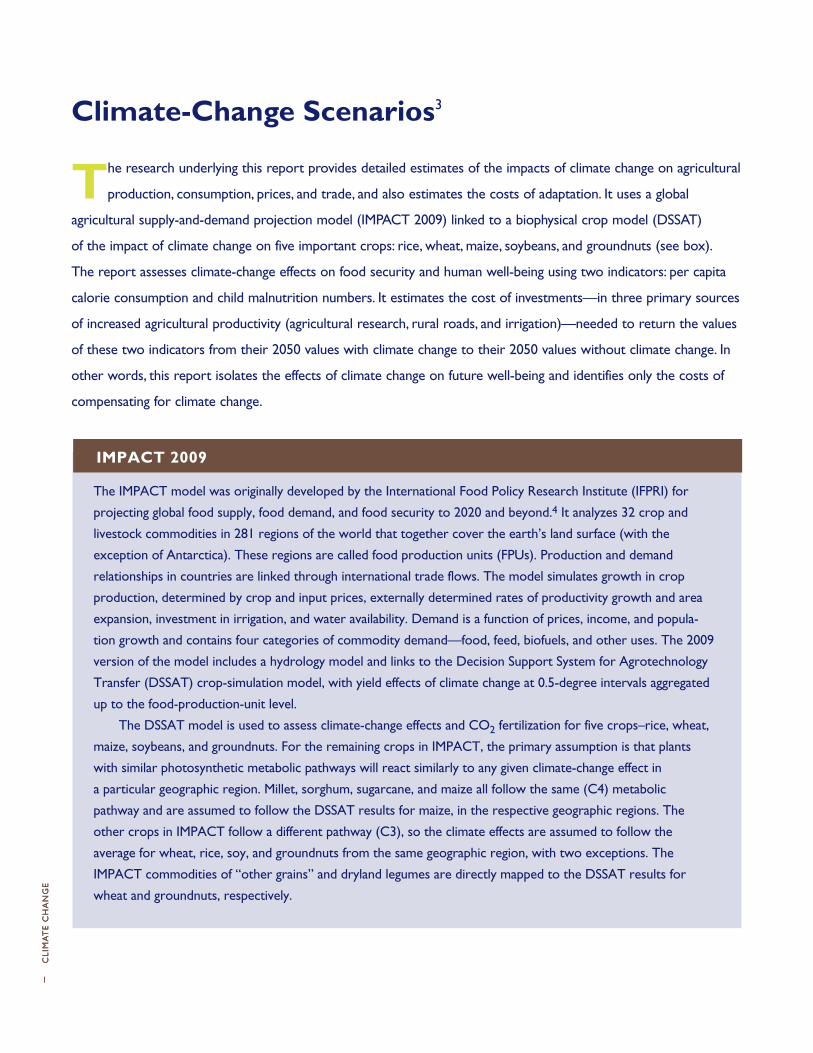
The research underlying this report provides detailed estimates of the impacts of climate change on agricultural
production, consumption, prices, and trade, and also estimates the costs of adaptation. It uses a global
agricultural supply-and-demand projection model (IMPACT 2009) linked to a biophysical crop model (DSSAT)
of the impact of climate change on five important crops: rice, wheat, maize, soybeans, and groundnuts (see box).
The report assesses climate-change effects on food security and human well-being using two indicators: per capita
calorie consumption and child malnutrition numbers. It estimates the cost of investments—in three primary sources
of increased agricultural productivity (agricultural research, rural roads, and irrigation)—needed to return the values
of these two indicators from their 2050 values with climate change to their 2050 values without climate change. In
other words, this report isolates the effects of climate change on future well-being and identifies only the costs of
compensating for climate change.
Climate-Change Scenarios3
IMPACT 2009
The IMPACT model was originally developed by the International Food Policy Research Institute (IFPRI) for
projecting global food supply, food demand, and food security to 2020 and beyond.4 It analyzes 32 crop and
livestock commodities in 281 regions of the world that together cover the earth’s land surface (with the
exception of Antarctica). These regions are called food production units (FPUs). Production and demand
relationships in countries are linked through international trade flows. The model simulates growth in crop
production, determined by crop and input prices, externally determined rates of productivity growth and area
expansion, investment in irrigation, and water availability. Demand is a function of prices, income, and popula-
tion growth and contains four categories of commodity demand—food, feed, biofuels, and other uses. The 2009
version of the model includes a hydrology model and links to the Decision Support System for Agrotechnology
Transfer (DSSAT) crop-simulation model, with yield effects of climate change at 0.5-degree intervals aggregated
up to the food-production-unit level.
The DSSAT model is used to assess climate-change effects and CO2 fertilization for five crops–rice, wheat,
maize, soybeans, and groundnuts. For the remaining crops in IMPACT, the primary assumption is that plants
with similar photosynthetic metabolic pathways will react similarly to any given climate-change effect in
a particular geographic region. Millet, sorghum, sugarcane, and maize all follow the same (C4) metabolic
pathway and are assumed to follow the DSSAT results for maize, in the respective geographic regions. The
other crops in IMPACT follow a different pathway (C3), so the climate effects are assumed to follow the
average for wheat, rice, soy, and groundnuts from the same geographic region, with two exceptions. The
IMPACT commodities of “other grains” and dryland legumes are directly mapped to the DSSAT results for
wheat and groundnuts, respectively.
CLI
MA
TE
CH
AN
GE
2
CLI
MA
TE
CH
AN
GE
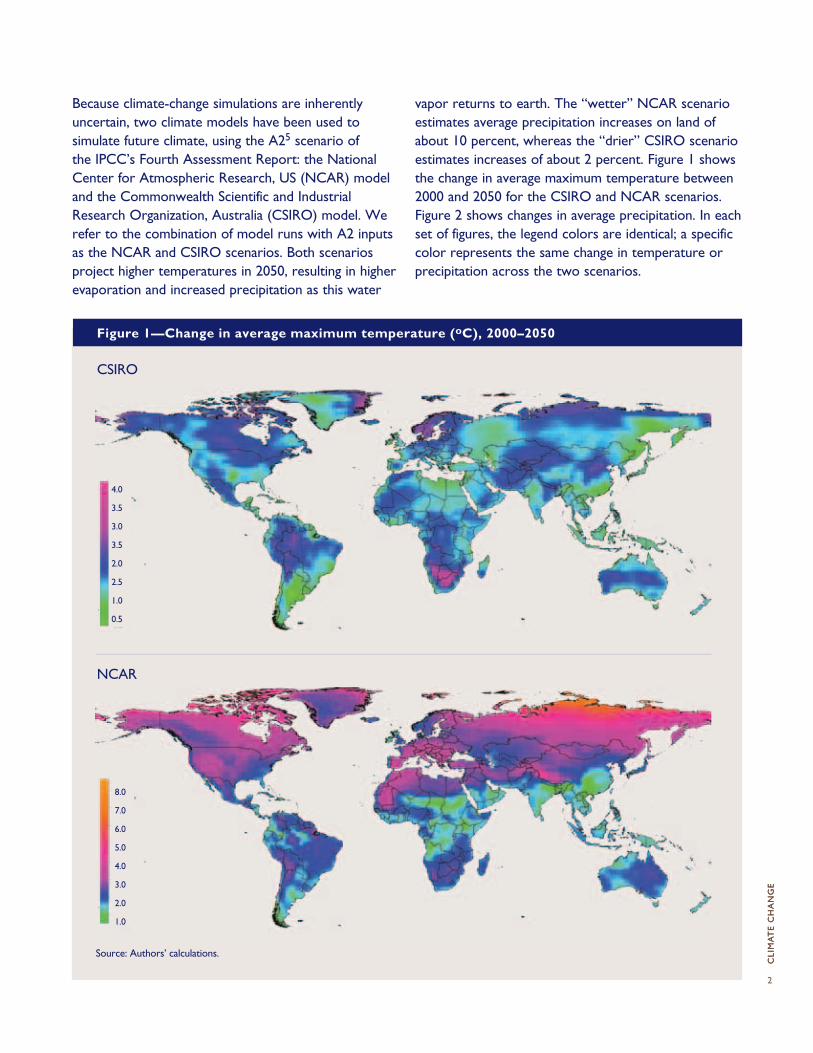
Figure 1—Change in average maximum temperature (oC), 2000–2050
Because climate-change simulations are inherently uncertain, two climate models have been used to simulate future climate, using the A25 scenario of the IPCC’s Fourth Assessment Report: the National Center for Atmospheric Research, US (NCAR) model and the Commonwealth Scientific and Industrial Research Organization, Australia (CSIRO) model. We refer to the combination of model runs with A2 inputs as the NCAR and CSIRO scenarios. Both scenarios project higher temperatures in 2050, resulting in higher evaporation and increased precipitation as this water
vapor returns to earth. The “wetter” NCAR scenario estimates average precipitation increases on land of about 10 percent, whereas the “drier” CSIRO scenario estimates increases of about 2 percent. Figure 1 shows the change in average maximum temperature between 2000 and 2050 for the CSIRO and NCAR scenarios. Figure 2 shows changes in average precipitation. In each set of figures, the legend colors are identical; a specific color represents the same change in temperature or precipitation across the two scenarios.
Source: Authors’ calculations.
NCAR
CSIRO
4.0
3.5
3.0
3.5
2.0
2.5
1.0
0.5
8.0
7.0
6.0
5.0
4.0
3.0
2.0
1.0

CLI
MA
TE
CH
AN
GE
3
A quick glance at these figures shows that substantial differences exist across the two scenarios. For example, the NCAR scenario has substantially higher average maximum temperatures than does CSIRO. The CSIRO scenario has substantial precipitation declines in the western Amazon while NCAR shows declines in the eastern Amazon. The NCAR scenario
has higher precipitation in Sub-Saharan Africa than does CSIRO. Northern China has both higher temperature and more precipitation under NCAR than under CSIRO. These figures qualitatively illustrate the range of potential climate outcomes using current modeling capabilities and provide an indication of the uncertainty in climate-change impacts.
Figure 2—Change in precipitation (mm), 2000–2050
Source: Authors’ calculations.
CSIRO
NCAR
400
300
200
100
0
–100
–200
–300
600
400
200
0
–200
–400
–600
–800
CLI
MA
TE
CH
AN
GE
4
The impacts of climate change on agriculture and human well-being include: 1) the biological effects on
crop yields; 2) the resulting impacts on outcomes including prices, production, and consumption; and 3)
the impacts on per capita calorie consumption and child malnutrition. The biophysical effects of climate change
on agriculture induce changes in production and prices, which play out through the economic system as farmers
and other market participants adjust autonomously, altering crop mix, input use, production, food demand, food
consumption, and trade.
Impacts of Climate Change
1. The Biological Effects of Climate Change on Yields
Rising temperatures and changes in rainfall patterns have direct effects on crop yields, as well as indirect effects through changes in irrigation water availability.
Direct effects on yields: rainfed and irrigated crops
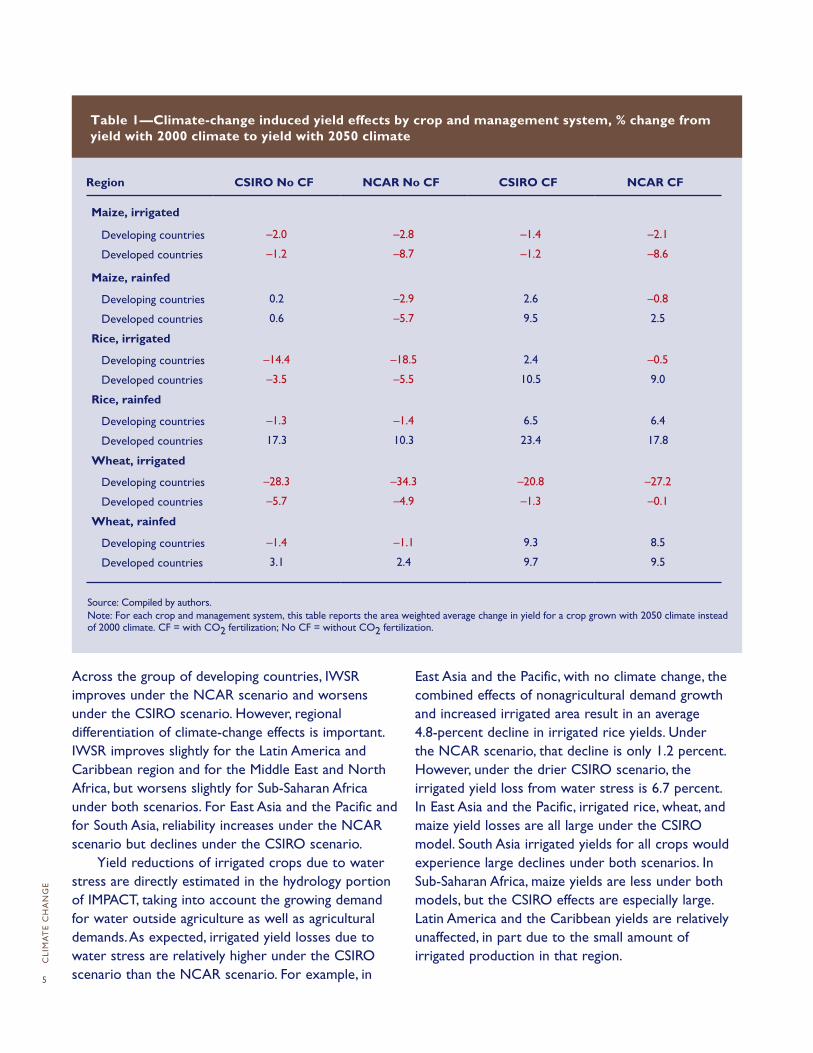
Table 1 reports the direct biological effects of the two climate-change scenarios on crop yields modeled directly with DSSAT for rainfed and irrigated crops in developing and developed countries,6 with and without CO2 fertilization (CF and No CF).7 These results are created by “growing” each crop around the world at 0.5-degree intervals with 2000 climate, growing them again with a 2050 scenario value, and then calculating the ratio. In other words, no economic adjustments are included. The rainfed yield changes are driven by both precipitation and temperature changes; the irrigated yield effects are from temperature changes alone.
In developing countries, yield declines predominate for most crops without CO2 fertilization. Irrigated wheat and irrigated rice are especially hard hit. On average, yields in developed countries are affected less than those in developing countries. For a few crops, climate change actually increases developed-country yields. In calculating these projections, the East Asia and Pacific region combines China, which is temperate for the most part, and Southeast Asia, which is tropical. The differential effects of climate change in these two climate zones are concealed. In China, some crops fare reasonably well because higher future temperatures are favorable in locations where current temperatures
are at the low end of the crop’s optimal temperature. Yields of important crops in Southeast Asia fall substantially in both scenarios unless CO2 fertilization is effective in farmers’ fields.
South Asia is particularly hard hit by climate change. For almost all crops, it is the region with the greatest yield decline. With CO2 fertilization, the yield declines are lower; in many locations, some yield increases occur relative to 2000. However, rainfed maize and irrigated and rainfed wheat still see substantial areas of reduced yields. Sub-Saharan Africa sees mixed results, with small declines or increases in maize yields and large negative effects on rainfed wheat. The Latin America and Caribbean region also has mixed yield effects, with some crops up slightly and some down.
Indirect effects: Irrigated crops
Climate change will have a direct impact on water availability for irrigated crops. Internal renewable water (IRW) is the water available from precipitation. Both climate scenarios result in more precipitation over land than would occur with no climate change. Under the NCAR scenario, all regions experience increased IRW. Under the CSIRO scenario, the average IRW increase is less than occurs with NCAR, and the Middle East and North Africa and Sub-Saharan Africa regions both experience reductions of about 4 percent.
In addition to precipitation changes, climate change-induced higher temperatures increase the water requirements of crops. The ratio of water consumption to requirements is called irrigation water supply reliability (IWSR). The smaller the ratio, the greater the water stress on irrigated crop yields.
CLI
MA
TE
CH
AN
GE
5
Table 1—Climate-change induced yield effects by crop and management system, % change from yield with 2000 climate to yield with 2050 climate
Region CSIRO No CF NCAR No CF CSIRO CF NCAR CF
Maize, irrigated
Developing countries –2.0 –2.8 –1.4 –2.1
Developed countries –1.2 –8.7 –1.2 –8.6
Maize, rainfed
Developing countries 0.2 –2.9 2.6 –0.8
Developed countries 0.6 –5.7 9.5 2.5
Rice, irrigated
Developing countries –14.4 –18.5 2.4 –0.5
Developed countries –3.5 –5.5 10.5 9.0
Rice, rainfed
Developing countries –1.3 –1.4 6.5 6.4
Developed countries 17.3 10.3 23.4 17.8
Wheat, irrigated
Developing countries –28.3 –34.3 –20.8 –27.2
Developed countries –5.7 –4.9 –1.3 –0.1
Wheat, rainfed
Developing countries –1.4 –1.1 9.3 8.5
Developed countries 3.1 2.4 9.7 9.5
Across the group of developing countries, IWSR improves under the NCAR scenario and worsens under the CSIRO scenario. However, regional differentiation of climate-change effects is important. IWSR improves slightly for the Latin America and Caribbean region and for the Middle East and North Africa, but worsens slightly for Sub-Saharan Africa under both scenarios. For East Asia and the Pacific and for South Asia, reliability increases under the NCAR scenario but declines under the CSIRO scenario.
Yield reductions of irrigated crops due to water stress are directly estimated in the hydrology portion of IMPACT, taking into account the growing demand for water outside agriculture as well as agricultural demands. As expected, irrigated yield losses due to water stress are relatively higher under the CSIRO scenario than the NCAR scenario. For example, in
East Asia and the Pacific, with no climate change, the combined effects of nonagricultural demand growth and increased irrigated area result in an average 4.8-percent decline in irrigated rice yields. Under the NCAR scenario, that decline is only 1.2 percent. However, under the drier CSIRO scenario, the irrigated yield loss from water stress is 6.7 percent. In East Asia and the Pacific, irrigated rice, wheat, and maize yield losses are all large under the CSIRO model. South Asia irrigated yields for all crops would experience large declines under both scenarios. In Sub-Saharan Africa, maize yields are less under both models, but the CSIRO effects are especially large. Latin America and the Caribbean yields are relatively unaffected, in part due to the small amount of irrigated production in that region.
Source: Compiled by authors.Note: For each crop and management system, this table reports the area weighted average change in yield for a crop grown with 2050 climate instead of 2000 climate. CF = with CO2 fertilization; No CF = without CO2 fertilization.
CLI
MA
TE
CH
AN
GE
6
2. Prices, Production, and Food Consumption
Prices
World prices are a useful single indicator of the effects of climate change on agriculture. Table 2 reports the effects of the two climate-change scenarios on world food prices, with and without CO2 fertilization. It also reports the effects with no climate change. Figures 3 and 4 demonstrate world price effects for livestock production and major grains, respectively, assuming no CO2 fertilization.
With no climate change, world prices for the most important agricultural crops—rice, wheat, maize, and soybeans will increase between 2000 and 2050, driven by population and income growth and biofuels demand. Even with no climate change, the price of rice would rise by 62 percent, maize by 63 percent, soybeans by 72 percent, and wheat by 39 percent. Climate change results in additional price increases— a total of 32 to 37 percent for rice, 52 to 55 percent for maize, 94 to 111 percent for wheat, and 11 to 14 percent for soybeans. If CO2 fertilization is effective in farmers’ fields, these 2050 prices are 10 percent smaller.
Livestock are not directly affected by climate change in the IMPACT model, but the effects of higher feed prices caused by climate change pass through to livestock, resulting in higher meat prices. For example, beef prices are 33 percent higher by 2050 with no climate change and 60 percent higher with climate change and no CO2 fertilization of crops. With CO2 fertilization, crop-price increases are less, so the beef-price increase is about 1.5 percent less than with no CO2 fertilization.
Production
Table 3 reports the effects of climate change on crop production in 2050 compared to production without climate change, based on the NCAR and CSIRO scenarios, accounting for both the direct changes in yield and area caused by climate change and autonomous adaptation as farmers respond to changing prices with changes in crop mix and input use. The negative effects of climate change on crop production are especially pronounced in Sub-Saharan Africa and South Asia. In South Asia, the climate scenario results in a 14-percent decline in rice production relative to
the no–climate-change scenario, a 44- to 49-percent decline in wheat production, and a 9- to 19-percent fall in maize production. In Sub-Saharan Africa, the rice, wheat, and maize yield declines with climate change are 15 percent, 34 percent, and 10 percent, respectively. For East Asia and the Pacific, the results are mixed and depend on both the crop and the model used. Rice production declines by around 10 percent, wheat production increases slightly, and maize production declines with the drier CSIRO scenario but increases with the NCAR scenario. Comparing average production changes, developing countries fare worse for all crops under both the CSIRO and NCAR scenarios than do developed countries.
Food Consumption
Agricultural output used for human consumption is determined by the interaction of supply, demand, and the resulting prices with individual preferences and income. Table 4 shows average per capita consumption of cereals and meat products in 2000 and in 2050 under the CSIRO and NCAR models, with and without CO2 fertilization. It also reports consumption with no climate change.
Without climate change, rising per capita income results in reduced declines in per capita consumption of cereals in developing countries between 2000 and 2050 and increased meat consumption increases, with the meat increases more than offsetting the decline in cereals. Climate change reduces the growth in meat consumption slightly and causes a more substantial fall in the consumption of cereals. These results are the first indication of the negative welfare effects due to climate change. Both models have similar effects.
3. Per Capita Calorie Consumption and Child Malnutrition
The primary measures used for the effects of climate change on human welfare are the change in calorie availability and the change in the number of malnourished children between 2000 and 2050 without climate change, and in 2050 using the two climate-change scenarios.
The declining consumption of cereals translates into similarly large declines in calorie availability as the result of climate change (see Figure 5 and Tables 5 and 6). Without climate change, calorie availability increases

CLI
MA
TE
CH
AN
GE
7
Table 2—World food prices (US$/metric ton) in 2000 and 2050 and percent changes for selected crops and livestock products
Agricultural product
2050
2000No climate
change NCAR no CF CSIRO no CF
NCAR CFeffect
(% change from no CF)
CSIRO CF effect
(% change from no CF)
Rice (US$/mt) 190 307 421 406 –17.0 –15.1
% change from 2000 61.6 121.2 113.4
% change from 2050,
no climate change 36.8 32.0
Wheat (US$/mt) 113 158 334 307 –11.4 –12.5
% change from 2000 39.3 194.4 170.6
% change from 2050,
no climate change 111.3 94.2
Maize (US$/mt) 95 155 235 240 –11.2 –12.6
% change from 2000 63.3 148.0 153.3
% change from 2050,
no climate change 51.9 55.1
Soybeans (US$/mt) 206 354 394 404 –60.6 –62.2
% change from 2000 72.1 91.6 96.4
% change from 2050,
no climate change 11.4 14.2
Beef (US$/mt) 1,925 2,556 3,078 3,073 –1.3 –1.5
% change from 2000 32.8 59.8 59.6
% change from 2050,
no climate change 20.4 20.2
Pork (US$/mt) 911 1,240 1,457 1,458 –1.3 –1.5
% change from 2000 36.1 60.0 60.1
% change from 2050,
no climate change 17.5 17.6
Lamb (US$/mt) 2,713 3,102 3,462 3,461 –0.7 –0.8
% change from 2000 14.4 27.6 27.6
% change from 2050,
no climate change 11.6 11.6
Poultry (US$/mt) 1,203 1,621 1,968 1,969 –1.9 –2.1
% change from 2000 34.7 63.6 63.6
% change from 2050,
no climate change 21.4 21.5
Source: Compiled by authors. Note: Prices are in 2000 US$.

CLI
MA
TE
CH
AN
GE
8
Source: Compiled by authors.Note: Prices are in 2000 US$.
US$
/met
ric
ton
0
500
1,000
1,500
2,000
2,500
3,000
3,500
4,000
Beef Pork Lamb Poultry Eggs
2000 2050 No Climate Change
2050 CSIRO NoCF 2050 NCAR NoCF
Figure 3—World prices, Livestock products
Source: Compiled by authors.Note: Prices are in 2000 US$.
Rice Wheat Maize Soybeans Other grains
2000 2050 No Climate Change
2050 CSIRO NoCF 2050 NCAR NoCF
US$
/met
ric
ton
0
50100
150
200
250
300
350
400
450
Figure 4—World prices, Major grains

Table 3—Climate-change effects on crop production, no CO2 fertilization
Agricultural product South Asia
East Asia and the Pacific
Europe and Central
Asia
Latin America and the
Caribbean
Middle East and North
AfricaSub-Saharan
AfricaDeveloped countries
Developing countries World
Rice
2000 (mmt) 119.8 221.7 1.1 14.8 5.5 7.4 20.4 370.3 390.7
2050 No CC (mmt) 168.9 217.0 2.6 17.8 10.3 18.3 20.3 434.9 455.2
2050 No CC (% change) 41.0 –2.1 144.4 19.8 87.4 146.0 –0.3 17.4 16.5
CSIRO (% change) –14.3 –8.1 –0.2 –21.7 –32.9 –14.5 –11.8 –11.9 –11.9
NCAR (% change) –14.5 –11.3 –0.8 –19.2 –39.7 –15.2 –10.6 –13.6 –13.5
Wheat
2000 (mmt) 96.7 102.1 127.5 23.5 23.6 4.5 205.2 377.9 583.1
2050 No CC (mmt) 191.3 104.3 252.6 42.1 62.0 11.4 253.7 663.6 917.4
2050 No CC (% change) 97.9 2.1 98.1 78.7 162.3 154.4 23.6 75.6 57.3
CSIRO (% change) –43.7 1.8 –43.4 11.4 –5.1 –33.5 –7.6 –29.2 –23.2
NCAR (% change) –48.8 1.8 –51.0 17.4 –8.7 –35.8 –11.2 –33.5 –27.4
Maize
2000 (mmt) 16.2 141.8 38.0 80.1 8.2 37.1 297.9 321.3 619.2
2050 No CC (mmt) 18.7 264.7 62.7 143.1 13.1 53.9 505.1 556.2 1.061.3
2050 No CC (% change) 15.7 86.6 65.1 78.8 59.4 45.3 69.6 73.1 71.4
CSIRO (% change) –18.5 –12.7 –19.0 –0.3 –6.8 –9.6 11.5 –10.0 0.2
NCAR (% change) –8.9 8.9 –38.3 –4.0 –9.8 –7.1 1.8 –2.3 –0.4
Millet
2000 (mmt) 10.5 2.3 1.2 0.0 0.0 13.1 0.5 27.3 27.8
2050 No CC (mmt) 12.3 3.5 2.1 0.1 0.1 48.1 0.8 66.2 67.0
2050 No CC (% change) 16.5 50.1 77.2 113.0 128.0 267.2 60.5 142.5 141.0
CSIRO (% change) –19.0 4.2 –4.3 8.8 –5.5 –6.9 –3.0 –8.5 –8.4
NCAR (% change) –9.5 8.3 –5.2 7.2 –2.7 –7.6 –5.6 –7.0 –7.0
Sorghum
2000 (mmt) 8.4 3.1 0.1 11.4 1.0 19.0 16.9 43.0 59.9
2050 No CC (mmt) 9.6 3.4 0.4 28.0 1.1 60.1 20.9 102.6 123.5
2050 No CC (% change) 13.9 11.6 180.9 145.3 12.2 216.9 23.6 138.7 106.2
CSIRO (% change) –19.6 1.4 –2.7 2.3 0.3 –2.3 –3.1 –2.5 –2.6
NCAR (% change) –12.2 6.7 –10.4 4.3 0.7 –3.0 –7.3 –1.5 –2.5
Source: Compiled by authors.Note: The rows labeled “2050 No CC (% change)” indicate the percent change between production in 2000 and 2050 with no climate change. The rows labeled “CSIRO (% change)” and “NCAR (% change)” indicate the additional percent change in production in 2050 due to climate change relative to 2050 with no climate change. For example, South Asia sorghum production was 8.4 mmt in 2000. With no climate change, South Asia sorghum production is predicted to increase to 9.6 mmt in 2050, an increase of 13.9 percent. With the CSIRO scenario, South Asia sorghum production in 2050 is 19.6 percent lower than with no climate change in 2050 (7.72 mmt instead of 9.6 mmt); mmt = million metric tons.
9

CLI
MA
TE
CH
AN
GE
10
throughout the world between 2000 and 2050. The largest increase, of 13.8 percent, is in East Asia and the Pacific, but there are gains for the average consumer in all countries—by 3.7 percent in Latin America, 5.9 percent in Sub-Saharan Africa, and 9.7 percent in South Asia.
With climate change, however, calorie availability in 2050 is not only lower than the no-climate-change scenario in 2050—it actually declines relative to
2000 levels throughout the world. For the average consumer in a developing country, the decline is 10 percent relative to 2000. With CO2 fertilization, the declines are 3 percent to 7 percent less severe, but are still large relative to the no–climate-change scenario. There is almost no difference in calorie outcome between the two climate scenarios.
Table 4—Per capita consumption (kg per year) of cereals and meats with and without climate change (NCAR and CSIRO)
2050
Region 2000No climate
changeCSIRO no CF
NCARno CF
CSIROCF effect (% change relative to
CSIRO no CF in 2050)
NCAR CFeffect
(% change relative to
NCAR no CF in 2050)
Meat
South Asia 6 16 14 14 0.9 0.8
East Asia and the Pacific 40 71 66 66 0.7 0.6
Europe and Central Asia 42 56 51 51 0.8 0.7
Latin America and the Caribbean 57 71 64 64 1.0 0.9
Middle East and North Africa 23 39 36 36 0.7 0.6
Sub-Saharan Africa 11 18 16 16 1.0 0.8
Developed countries 88 100 92 92 0.8 0.7
Developing countries 28 41 37 37 0.8 0.7
Cereals
South Asia 164 157 124 121 7.0 7.1
East Asia and the Pacific 184 158 124 120 8.1 8.3
Europe and Central Asia 162 169 132 128 5.3 4.9
Latin America and the Caribbean 123 109 89 87 6.1 5.9
Middle East and North Africa 216 217 172 167 5.5 5.1
Sub-Saharan Africa 117 115 89 89 7.4 7.1
Developed countries 118 130 97 94 6.8 6.3
Developing countries 164 148 116 114 7.1 7.1
Source: Compiled by authors.

CLI
MA
TE
CH
AN
GE
11
Source: Compiled by authors.
4,000
Cal
orie
s pe
r ca
pita
South Asia East Asia and the Pacific
Europe and Central Asia
Latin America and the
Caribbean
Middle Eastand North
Africa
Sub-Saharan Africa
Developingcountries
3,5003,0002,5002,0001,5001,000
5000
2000 No Climate Change NCAR CSIRO
Figure 5—Daily per capita calorie availability with and without climate change
Table 5—Daily per capita calorie availability with and without climate change
2050
Region 2000
No climate changekcal/day
NCAR no CF
kcal/day
CSIROno CF
kcal/day
NCAR CFeffects
(% change relative to
NCAR no CF in 2050)
CSIRO CFeffects
(% change relative to
CSIRO no CF in 2050)
South Asia 2,424 2,660 2,226 2,255 4.3 4.3
East Asia and the Pacific 2,879 3,277 2,789 2,814 4.3 4.3
Europe and Central Asia 3,017 3,382 2,852 2,885 2.7 2.9
Latin America and the Caribbean 2,879 2,985 2,615 2,628 2.7 2.8
Middle East and North Africa 2,846 3,119 2,561 2,596 3.6 3.7
Sub-Saharan Africa 2,316 2,452 1,924 1,931 6.5 6.9
Developed countries 3,450 3,645 3,190 3,215 2.3 2.5
Developing countries 2,696 2,886 2,410 2,432 4.4 4.4
Source: Compiled by authors.

CLI
MA
TE
CH
AN
GE
12
Table 6—Total number of malnourished children in 2000 and 2050 (million children under 5 years of age)
2050
2000No climate
changeNCAR no CF
CSIROno CF
NCAR CFeffects
(% change relative to NCAR
no CF in 2050)
CSIRO CFeffects
(% change relative to CSIRO
no CF in 2050)Region
South Asia 76 52 59 59 –3 –3
East Asia and the Pacific 24 10 15 14 –9 –9
Europe and Central Asia 4 3 4 4 –4 –5
Latin America and and the Caribbean
8
5
6
6
–5
–5
Middle East and North Africa 3 1 2 2 –10 –11
Sub-Saharan Africa 33 42 52 52 –5 –6
All developing countries 148 113 139 137 –5 –5
Source: Compiled by authors.Note: The last two columns in this table report the percentage difference between the number of malnourished children in 2050 with and without CO2 fertilization. For example, under the NCAR model, assuming CO2 fertilization is effective in the field, there would be a 3-percent decline in the number of malnourished children in South Asia relative to the climate change outcome without CO2 fertilization.
CLI
MA
TE
CH
AN
GE
13
Costs of Adaptation
Climate-change adaptation is increasingly on the agenda of researchers, policymakers, and program
developers who are aware that climate change is real and threatens to undermine social and ecological
sustainability. In agriculture, adaptation efforts focus on implementing measures that help build rural livelihoods
that are more resilient to climate variability and disaster. This section provides an assessment of the costs of
productivity-enhancing investments in agricultural research, rural roads, and irrigation infrastructure and efficiency
that can help farmers adapt to climate change. First, regardless of climate-change scenario, agriculture will be
negatively affected by climate change.
Climate change increases child malnutrition and reduces calorie consumption dramatically. Thus, aggressive agricultural productivity investments are needed to raise calorie consumption enough to offset the negative impacts of climate-change on the health and well-being of children.
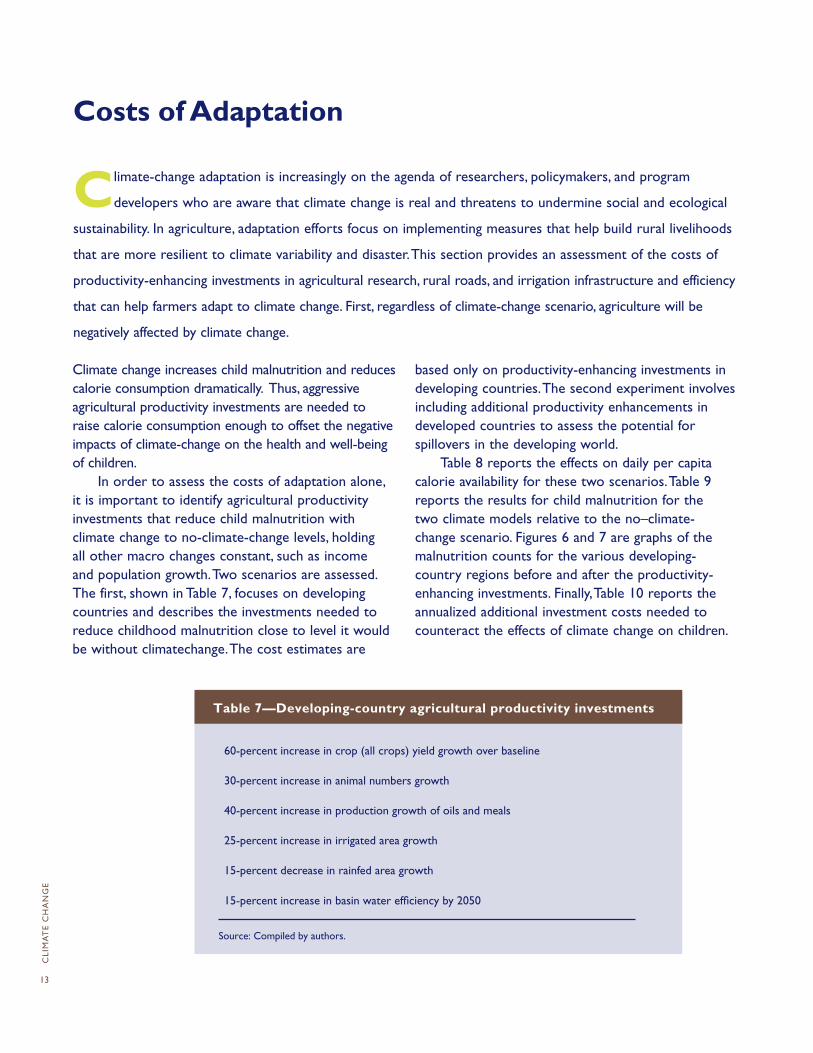
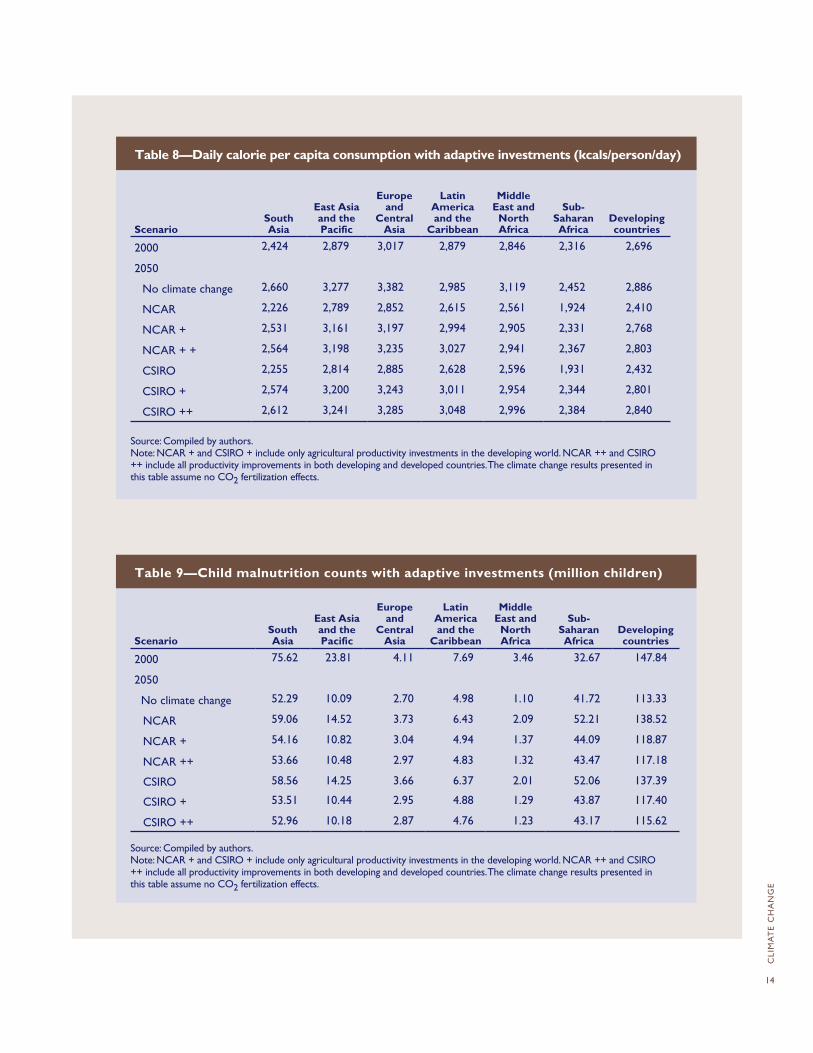
In order to assess the costs of adaptation alone, it is important to identify agricultural productivity investments that reduce child malnutrition with climate change to no-climate-change levels, holding all other macro changes constant, such as income and population growth. Two scenarios are assessed. The first, shown in Table 7, focuses on developing countries and describes the investments needed to reduce childhood malnutrition close to level it would be without climatechange. The cost estimates are
based only on productivity-enhancing investments in developing countries. The second experiment involves including additional productivity enhancements in developed countries to assess the potential for spillovers in the developing world.
Table 8 reports the effects on daily per capita calorie availability for these two scenarios. Table 9 reports the results for child malnutrition for the two climate models relative to the no–climate-change scenario. Figures 6 and 7 are graphs of the malnutrition counts for the various developing-country regions before and after the productivity-enhancing investments. Finally, Table 10 reports the annualized additional investment costs needed to counteract the effects of climate change on children.
Table 7—Developing-country agricultural productivity investments
Source: Compiled by authors.
60-percent increase in crop (all crops) yield growth over baseline
30-percent increase in animal numbers growth
40-percent increase in production growth of oils and meals
25-percent increase in irrigated area growth
15-percent decrease in rainfed area growth
15-percent increase in basin water efficiency by 2050
CLI
MA
TE
CH
AN
GE
14
Table 8—Daily calorie per capita consumption with adaptive investments (kcals/person/day)
ScenarioSouth Asia
East Asia and the Pacific
Europe and
Central Asia
Latin America and the
Caribbean
Middle East and North Africa
Sub-Saharan Africa
Developing countries
2000 2,424 2,879 3,017 2,879 2,846 2,316 2,696
2050
No climate change 2,660 3,277 3,382 2,985 3,119 2,452 2,886
NCAR 2,226 2,789 2,852 2,615 2,561 1,924 2,410
NCAR + 2,531 3,161 3,197 2,994 2,905 2,331 2,768
NCAR + + 2,564 3,198 3,235 3,027 2,941 2,367 2,803
CSIRO 2,255 2,814 2,885 2,628 2,596 1,931 2,432
CSIRO + 2,574 3,200 3,243 3,011 2,954 2,344 2,801
CSIRO ++ 2,612 3,241 3,285 3,048 2,996 2,384 2,840
Source: Compiled by authors.Note: NCAR + and CSIRO + include only agricultural productivity investments in the developing world. NCAR ++ and CSIRO ++ include all productivity improvements in both developing and developed countries. The climate change results presented in this table assume no CO2 fertilization effects.
Table 9—Child malnutrition counts with adaptive investments (million children)
ScenarioSouth Asia
East Asia and the Pacific
Europe and
Central Asia
Latin America and the
Caribbean
Middle East and North Africa
Sub-Saharan Africa
Developing countries
2000 75.62 23.81 4.11 7.69 3.46 32.67 147.84
2050
No climate change 52.29 10.09 2.70 4.98 1.10 41.72 113.33
NCAR 59.06 14.52 3.73 6.43 2.09 52.21 138.52
NCAR + 54.16 10.82 3.04 4.94 1.37 44.09 118.87
NCAR ++ 53.66 10.48 2.97 4.83 1.32 43.47 117.18
CSIRO 58.56 14.25 3.66 6.37 2.01 52.06 137.39
CSIRO + 53.51 10.44 2.95 4.88 1.29 43.87 117.40
CSIRO ++ 52.96 10.18 2.87 4.76 1.23 43.17 115.62
Source: Compiled by authors.Note: NCAR + and CSIRO + include only agricultural productivity investments in the developing world. NCAR ++ and CSIRO ++ include all productivity improvements in both developing and developed countries. The climate change results presented in this table assume no CO2 fertilization effects.

CLI
MA
TE
CH
AN
GE
15
0
10
20
30
40
50
60
70
80
South Asia Sub-Saharan Africa
Mill
ions
of c
hild
ren
2000 No Climate Change NCAR
NCAR+ CSIRO CSIRO+
Source: Compiled by authors.
Figure 7—Child malnutrition effects, East Asia and the Pacific, Europe and Central Asia, Latin America and the Caribbean, and Middle East and North Africa
0
5
10
15
20
25
30
Mill
ions
of c
hild
ren
East Asia andthe Pacific
Europe and CentralAsia
Latin America andthe Caribbean
Middle East andNorth Africa
2000 No Climate Change NCAR
NCAR+ CSIRO CSIRO+
Source: Compiled by authors.
Figure 6—Child malnutrition effects, South Asia and Sub-Saharan Africa
CLI
MA
TE
CH
AN
GE
16
Table 10—Additional annual investment expenditure needed to counteract the effects of climate change on nutrition (million 2000 US$)
Source: Compiled by authors.Note: These results are based on crop model yield changes that do not include the CO2 fertilization effect.
ScenarioSouth Asia
East Asia and the Pacific
Europe and Central
Asia
Latin America and the
Caribbean
Middle East and North
Africa
Sub-SaharanAfrica
Developing countries
NCAR with developing-country investments
Agricultural research 172 151 84 426 169 314 1,316
Irrigation expansion 344 15 6 31 –26 537 907
Irrigation efficiency 999 686 99 129 59 187 2,158
Rural roads (area expansion)
8 73 0 573 37 1,980 2,671
Rural roads (yield increase)
9 9 10 3 1 35 66
Total 1,531 934 198 1,162 241 3,053 7,118
CSIRO with developing-country investments
Agricultural research 185 172 110 392 190 326 1,373
Irrigation expansion 344 1 1 30 –22 529 882
Irrigation efficiency 1,006 648 101 128 58 186 2,128
Rural Roads (area expansion)
16 147 0 763 44 1,911 2,881
Rural Roads (yield increase)
13 9 11 3 1 36 74
Total 1,565 977 222 1,315 271 2,987 7,338
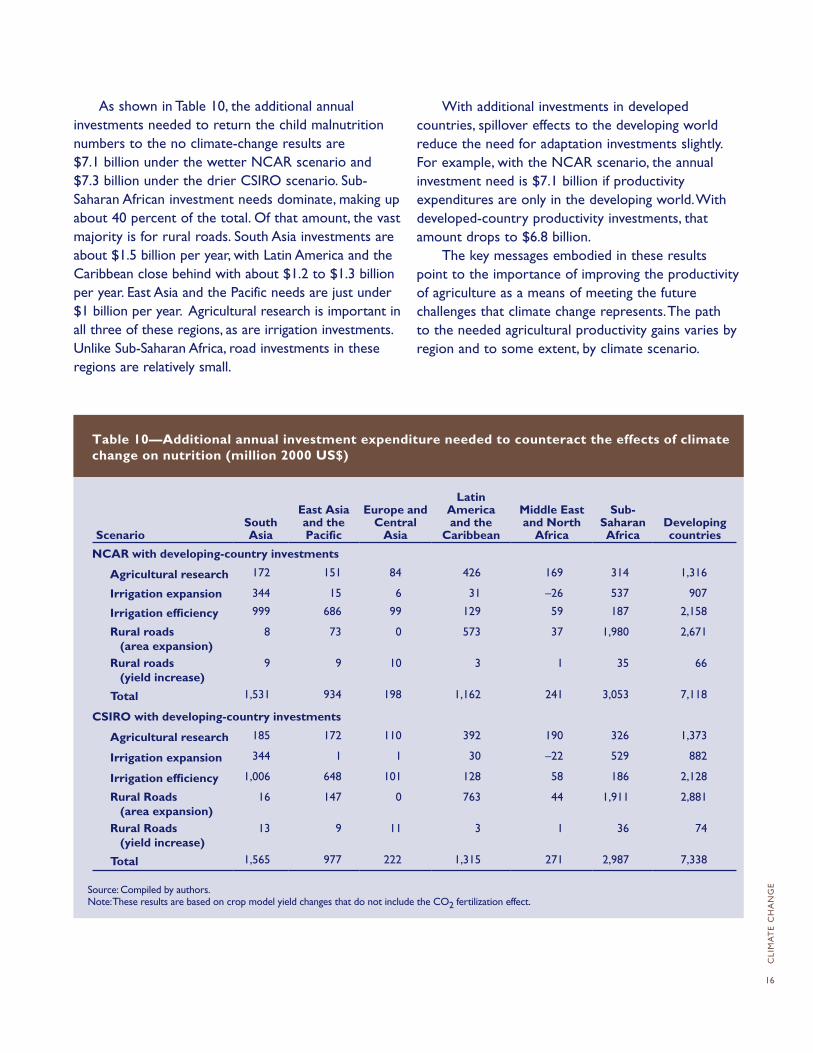
As shown in Table 10, the additional annual investments needed to return the child malnutrition numbers to the no climate-change results are $7.1 billion under the wetter NCAR scenario and $7.3 billion under the drier CSIRO scenario. Sub-Saharan African investment needs dominate, making up about 40 percent of the total. Of that amount, the vast majority is for rural roads. South Asia investments are about $1.5 billion per year, with Latin America and the Caribbean close behind with about $1.2 to $1.3 billion per year. East Asia and the Pacific needs are just under $1 billion per year. Agricultural research is important in all three of these regions, as are irrigation investments. Unlike Sub-Saharan Africa, road investments in these regions are relatively small.
With additional investments in developed countries, spillover effects to the developing world reduce the need for adaptation investments slightly. For example, with the NCAR scenario, the annual investment need is $7.1 billion if productivity expenditures are only in the developing world. With developed-country productivity investments, that amount drops to $6.8 billion.
The key messages embodied in these results point to the importance of improving the productivity of agriculture as a means of meeting the future challenges that climate change represents. The path to the needed agricultural productivity gains varies by region and to some extent, by climate scenario.

CLI
MA
TE
CH
AN
GE
17
This analysis brings together for the first time detailed modeling of crop growth under climate change with
insights from an extremely detailed global agriculture model. The results show that agriculture and human
well-being will be negatively affected by climate change. Crop yields will decline, production will be affected,
crop and meat prices will increase, and consumption of cereals will fall, leading to reduced calorie intake and
increased child malnutrition.
Conclusion
These stark results suggest the following policy and program recommendations:
• Design and implement good overall development policies and programs.
• Increase investments in agricultural productivity. • Reinvigorate national research and extension
programs. • Improve global data collection, dissemination,
and analysis.
• Make agricultural adaptation a key agenda point within the international climate negotiation process.
• Recognize that enhanced food security and climate-change adaptation go hand in hand.
• Support community-based adaptation strategies.• Increase funding for adaptation programs by at least
an additional $7 billion per year.
These investments may not guarantee that all the negative consequences of climate change can be overcome. But continuing with a “business-as-usual” approach will almost certainly guarantee disastrous consequences.
CLI
MA
TE
CH
AN
GE
18
Notes
1. World Bank 2008.
2. All dollars are 2000 US dollars unless otherwise indicated.
3. For a full description of the methodology, see Appendix 1 (www.ifpri.org/sites/default/files/publications/pr21app1.pdf).
4. Rosegrant et al. 2008.
5. See Appendix 1 (www.ifpri.org/sites/default/files/publications/pr21app1.pdf) for description of A2 scenario.
6. To see the results for the full World Bank regional grouping of countries, see Table A2.1 in Appendix 2 (www.ifpri.org/sites/default/files/publications/pr21app2.pdf).
7. Plants produce more vegetative matter as atmospheric concentrations of CO2 increase. The effect depends on the nature of the photosynthetic process used by the plant species. Because the effects of higher concentrations of CO2 on farmer’s fields are uncertain, we report results both with 369 parts per million of atmospheric CO2—the approximate concentration in 2000 (No CF results)—and 532 parts per million (CF results), the expected concentration in 2050 under the A2 scenario.

CLI
MA
TE
CH
AN
GE
19
References
Fan, S., P. Hazell, and S. Thorat. 1998. Government spend-ing, growth and poverty: An analysis of interlinkages in rural India. Environment and Production Technology Division Discussion Paper 33. Washington, D.C.: International Food Policy Research Institute.
Haie, N., and A. A. Keller. 2008. Effective efficiency as a tool for sustainable water resources management. Journal of the American Water Resources Association 10: 1752–1688.
IPCC et al. 2007. Climate change 2007: Impacts, adap-tation and vulnerability. Contribution of Working Group II to the Fourth Assessment Report of the Intergovernmental Panel on Climate Change. Cam-bridge, UK: Cambridge University Press.
Jones, J. W., G. Hoogenboom, C. H. Porter, K. J. Boote, W. D. Batchelor, L. A. Hunt, P. W. Wilkens, U. Singh, A. J. Gijsman, and J. T. Ritchie. The DSSAT cropping system model. 2003. European Journal of Agronomy 18(3-4): 235–265.
Keller, A., and J. Keller. 1995. Effective efficiency: A water use concept for allocating freshwater resources. Winrock International, Center for Economic Policy Studies, Discussion Paper 22. Arlington, Va., U.S.A.: Winrock International.
Long, S. P., E. A. Ainsworth, A. D. B. Leakey, J. Nosberger, and D. R. Ort. 2006. Food for thought: Lower-than-expected crop yield stimulation with rising CO2 concentrations. Science 312(5782): 1918–1921.
Parry, M. L., C. Rosenzweig, A. Iglesias, M. Livermore, and G. Fischer. 2004. Effects of climate change on global food production under SRES emissions and socio-economic scenarios. Global Environmental Change 14(1): 53–67.
Rosegrant, M. W., S. Msangi, C. Ringler, T. B. Sulser, T. Zhu, and S. A. Cline. 2008. International Model for Policy Analysis of Agricultural Commodities and Trade (IM-PACT): Model description. Washington, D.C.: Interna-tional Food Policy Research Institute.
Smith, L., and L. Haddad. 2000. Explaining child malnutri-tion in developing countries: A cross-country analysis. IFPRI Research Report. Washington, D.C.: Interna-tional Food Policy Research Institute.
World Bank. 2008. World Development Report 2008: Agriculture for Development. Washington, D.C.: The World Bank.
You, L., and S. Wood. 2006. An entropy approach to spatial disaggregation of agricultural production. Agricultural Systems 90(1-3): 329–347.
Zavala, J. A., C. L. Casteel, E. H. DeLucia, and M. R. Berenbaum. 2008. Anthropogenic increase in carbon dioxide compromises plant defense against invasive insects. Proceedings of the National Academy of Sciences 105(13): 5129–5133.
About the Authors
All authors are part of IFPRI’s Environment and Production Technology Division (EPTD). Gerald C. Nelson is senior research fellow, Mark W. Rosegrant is the division director, Jawoo Koo is a research fellow, Richard Robertson is a research fellow, Timothy Sulser is a scientist, Tingju Zhu is a senior scientist, Claudia Ringler is a senior research fellow, Siwa Msangi is a senior research fellow, Amanda Palazzo is a senior research assistant, Miroslav Batka is a research assistant, Marialia Magalhaes is a senior research assistant, Rowena Valmonte-Santos is a senior research analyst, Mandy Ewing is a research analyst, and David Lee is a consultant.

INTERNATIONAL FOOD POLICY RESEARCH INSTITUTE2033 K Street, NW
Washington, DC 20006-1002 USA
Telephone: +1-202-862-5600
Fax: +1-202-467-4439
Email: [email protected]
www.ifpri.org