Embed Size (px)
Citation preview

Climate Change and Food Security in India
Dr. N. ChattopadhyayDirector
India Meteorological Department
International Symposium on Climate Changeand Food Security in South Asia
August 25-30, 2008 Dhaka, Bangladesh
India Meteorological Department, Government of
India

Topics of the Presentation• Indian Agriculture & Its linkage to Weather• Signals of Climate change based on
historic data• Projection of climate change in India• Impact of Climate Change on Agriculture• Adaptation to Climate Change• Mitigation to Climate Change

Indian AgricultureIndian Agriculture&&
Its linkage to WeatherIts linkage to Weather

Indian Agriculture – Strengths and Challenges
Strong strides made in increasing the production in the past 50 years, mainly due to adoption of HYVs and other technological developmentsSubsistence agriculture with small land holdings and skewed distribution of landWide variation in regional productivitiesMajority still depend on rainfed agricultureFrequently affected by extreme weather events such as droughts and cyclones
o Stagnation/decline in yieldso Diversificationo Quality and quantity of water resourceso Increasing population leading to higher (and quality) demand of food o Increasing urbanizationo Increasing rural migration o New technologies

Factors influencing agriculture and food security
Increasing populationGrowing urbanization Decreasing crop landContinuing crop lossDeclining crop productionDeclining bio-diversity

Climate Induced vulnerability of Agriculture
• Plateau in Agriculture Productivity• Fluctuating Rabi Productivity• Kharif v/s Rabi (Rainfed v/s Irrigated)• Contribution of Agricultural Growth in GDP• FAO Assessment on Agricultural Productivity in India• IPCC assessment on Ag. Productivity in India
– 2020 (2.5 to 10%)– 2050 (5 to 30%)

Multi-decadal changes in Break days during Monsoon
PERIODPERIOD
NUMBER OF BREAK DAYS DURINGNUMBER OF BREAK DAYS DURING
JULYJULY AUGUSTAUGUST
0101--1010 1111--2020 2121--3131 11--1010 1111--2020 2121--3131
18881888--19171917 4646 4949 5353 4343 8484 2626
19181918--19471947 1414 3636 2121 5555 5454 2525
19481948--19771977 2222 4444 6464 2121 3333 4141
19781978--20032003 2323 3232 3939 66 1414 3737
Data of past 50 years show that number of Break days are more in July as compared to August

Press Report on DroughtRise in Extreme
Weather Events• Frequency of intense
rainfall events has increased over past 53 years. Extreme rainfall events also increased over the west coast of India (Analysis of 100 years of data; 1901-2000).
Observed impacts in South Asia
Droughts50% of droughts associated with El NiñoDroughts in Orissa (India) in 2000-2002: crop failures, mass starvation affecting 11 million people
Cyclones / TyphoonsIncreasing intensity of cyclones formation in Bay of Bengal and Arabian Sea since 1970Cyclone Nargis in Myanmar, 2008: 100, 000 deaths
Intense Rains and FloodsSerious and recurrent floods in Bangladesh, Nepal and N-E India in 2002, 2003 and 2004Rainfall in Mumbai (India), 2005: 1 million people lost their homes

Signals of Climate change Signals of Climate change based on historic databased on historic data

Climate Change Studies in India (1901-90)
Linear trend expressed as a percentage of normal per 100 years, 1971-84 for monsoon rainfall. Hatched areas indicates negative trend & stipped areas indicates significance at 5% level
Linear trend of mean annual temp. (oC/100years). Shaded areas indicates significance at 95% level
Annual temp. of India. Thick line-five year running mean

The temperatures are showing a decreasing trend in almost all the northern parts of the country (north of 23oN) and a rising trend in southern parts (south of 23oN).
Atmospheric pressure shows a fall between second and third decades but does not indicate any significant change after 1930.
Surface air temperature are found to be increasingly at the rate of 0.21oC per 100 years.
Maximum temperature - Trend in maximum termperature show warming by 0.4oC per 100 years based on all the 475 stations.
Minimum temperature - Trend in minimum temperature indicates an overall increase of 0.1oC/100 years

Linear trend(oC/decade) in mean temp. for 1940-90 for different seasons over India based on 27 stations (dots) Dot size is related to trend
Linear trend(oC/decade) in diurnal temp.range for 1940-90 for different seasons over India based on 27 stations (dots). Dot size is related to trend
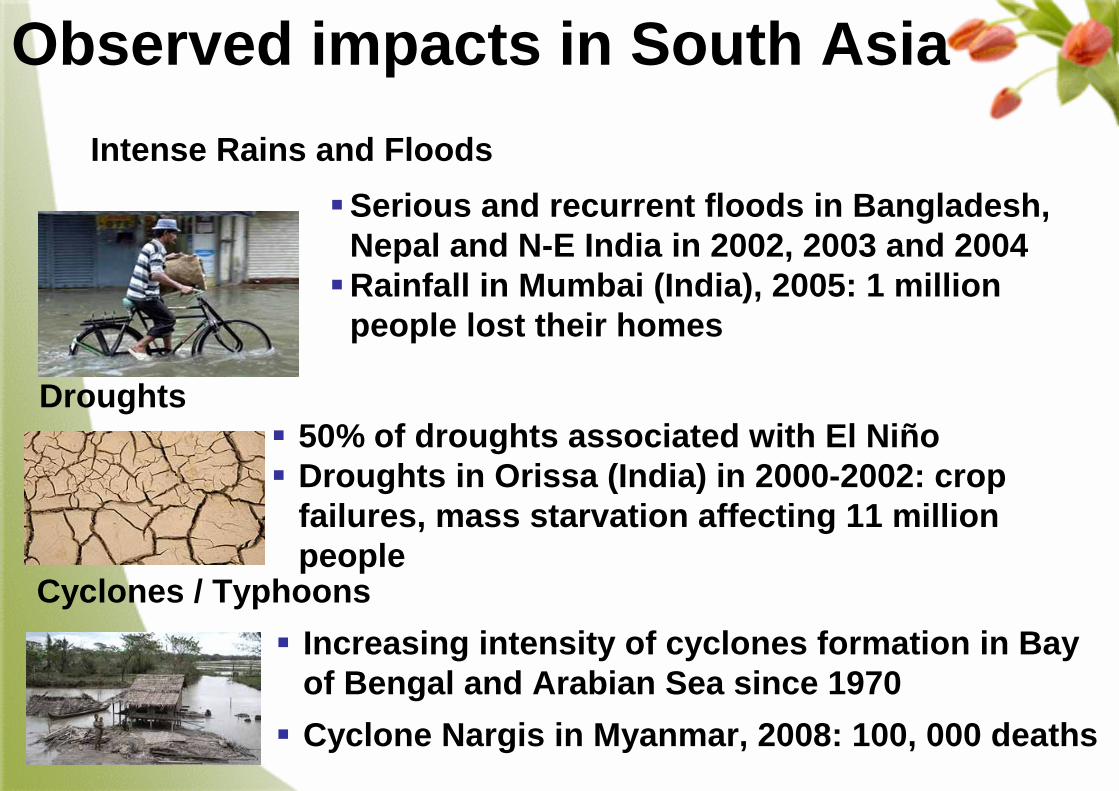
Annual Ep anomalies (mm/day) between 1961 & 1992 wrt to the 1961-92 mean for three stations & for four seasons. Dashed lines show best-fit linear trend
Regionally averaged annual Ep anomalies(mm/day) for the period 1961-92 wrt the 1976-90 mean for different seasons over India. Number of stations is ten between 1961-75 and 1991-92 and 19 between 1976 &1990 . Dashed lines show best-fit linear trend

Mean linear trend (mm /day/decade) in Ep for 1940-90 for different seasons over India based on 19 stations (dots). Dot size is related to trend
Mean linear trend(mm/day/decade) in PE for1976-90 for different seasons over India based on 10 stations (dots). Dot size is related to trend

Climate Change Studies in India (1901-2003)
Anomaliesof average land surface maximum and minimum air temp. (oC)relative to their respective mean (1901-2003) values in the two halves of the year over the whole of India. The smoothed curve is obtained using 21-point binomial filter

Anomaliesof average land surface maximum and minimum air temp. (oC) relative to their respective mean (1901-2003) values over northern parts of India. The smoothed curve is obtained using 21-point binomial filter

Time series of rainfall in India during monsoon months of June-September. The soild straight line indicates trend significant at 99% level

• Analysis of meteorological measurements in India indicates large difference in trends in the minimum temperature and cloud amounts between North and South India.
• There is also asymmetry in the increasing temperature trends between different seasons in a year.
• These observations along with the occurrence of extreme weather events leads to the importance of regional climate changes.
• The interplay between the aerosols, clouds and mesoscale flows around Indian mountains in global warming atmosphere may play a crucial role in the regional climate in future.

Projection of climate change in
India

Climate ProjectionsAv. Surface temperature : Increase by 2 - 4°C during 2050s
Monsoon Rainfall : Marginal changes in monsoon months (JJAS)
: Large changes during non-monsoon months
No. of rainy days : set to decrease by more than 15 days
Intensity of rains : to increase by 1-4 mm/day
Cyclonic storms : Increase in frequency and intensity of cyclonic
storms is projected

Calculated change (%) in mean seasonal PE for 1oC of global warming for the CCC experiment. Shaded boxes are those selected for analysis of the energy and aerodynamices components of Penman PE
Calculated change (%) in mean seasonal PE for 1oC of global warming for the GFDL experiment
Calculated change (%) in mean seasonal PE for 1oC of global warming for the UKTR experiment
Number of GCM experiments which yield an increase in P/PEratio for each season. Maximum number is six. Areas of agreement in the sign of the change between all six GCMsare shaded

Impact of Climate Change Impact of Climate Change on on
AgricultureAgriculture

Climate Change Impacts on Agriculture in
India
• Agriculture represents a core part of the Indian economy and provides food and livelihood activities to much of the Indian population.
• While the magnitude of impact varies greatly by region, climate change is expected to impact on agricultural productivity and shifting crop patterns.
• The policy implications are wide-reaching, as changes in agriculture could affect food security, trade policy, livelihood activities and water
• Conservation issues, impacting large portions of the population.
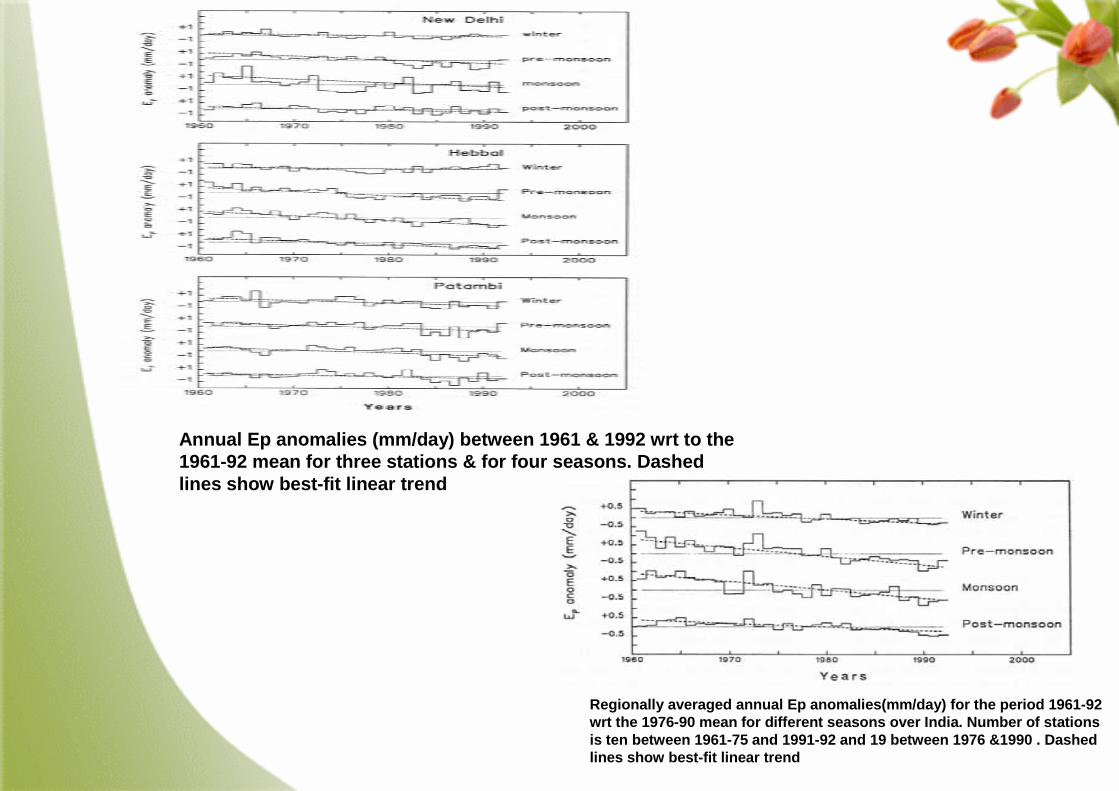
AR4 WG II - IMPACTSREGIONAL EFFECTS: Asia
Freshwater Availability:Decreased river flows after glaciers recede; will decrease.
Floods: Glacier melt in Himalayas; sea level rise in deltas
Crop yield:Increase up to 20% in E and SE; decrease up to 30% in S and
central Asia by 2050; hunger risk high

Impacts on Indian Agriculture –Literature
Sinha and Swaminathan (1991) – showed that an increase of 2oC in temperature could decrease the rice yield by about 0.75 ton/ha in the high yield areas; and a 0.5oC increase in winter temperature would reduce wheat yield by 0.45 ton/ha. Rao and Sinha (1994) – showed that wheat yields could
decrease between 28 to 68% without considering the CO2fertilization effects; and would range between +4 to -34% after considering CO2 fertilization effects. Aggarwal and Sinha (1993) – using WTGROWS model showed that a 2oC temperature rise would decrease wheat yields in most places.Saseendran et al. (2000) – showed that for every one
degree rise in temperature the decline in rice yield would be about 6%.

Decrease in yield of crops as temperature increases in different parts of India - For example a a 2°C increase in mean air temperature, rice yields could decrease by about 0.75 ton/hectare in the high yield areas and by about 0.06 ton/hectare in the low yield coastal regions.
Major impacts of climate change will be on rain fed crops (other than rice and wheat), which account for nearly 60% of cropland area. In India poorest farmers practice rain fed agriculture.
The loss in farm-level net revenue will range between 9 and 25% for a temperature rise of 2-3.5°C.
Continued

Potential Impact of Climate Change on Wheat Production in India
40
45
50
55
60
65
70
75
80
2000 2010 2020 2030 2040 2050 2060 2070Year
Prod
uctio
n , M
tons
Source: Aggarwal et al. (2002)

Climate Change Scenarios for India
Source: Lal et al., 2001
Year Season Increase inTemperature, oC
Change inRainfall, %
Lowest Highest Lowest Highest
Rabi 1.08 1.54 -1.95 4.362020s
Kharif 0.87 1.12 1.81 5.10
Rabi 2.54 3.18 -9.22 3.822050s
Kharif 1.81 2.37 7.18 10.52
Rabi 4.14 6.31 -24.83 -4.502080s
Kharif 2.91 4.62 10.10 15.18
Source: Aggarwal, IARI

Boundary changes for Productivity of
Irrigated Wheat

Predicted climate change impacts on agriculture
Wheat Production
The study found that increase in temperature (by about 20C) reduced potential grain yields in most places. Regions with higher potential productivity (such as northern India) were relatively less impacted by climate change than areas with lower potential productivity (the reduction in yields was much smaller).
Climate change is also predicted to lead to boundary changes in areas suitable for growing certain crops. Reduction in yields as a result of climate change are predicted to be more
pronounced for rain fed crops (as opposed to irrigated crops) and under limited water supply situations because there are no coping mechanisms for rainfall variability.
The difference in yield is influenced by baseline climate. In sub tropical environments the decrease in potential wheat.

Predicted climate change impacts on agriculture
Rice production
Overall, temperature increases are predicted to reduce riceyields. An increase of 2-40C is predicted to result in a reduction in yields.
Eastern regions are predicted to be most impacted by increased temperatures and decreased radiation, resulting inrelatively fewer grains and shorter grain filling durations.
By contrast, potential reduction in yields due to increasedtemperatures in Northern India are predicted to be offset byhigher radiation, lessening the impacts of climate change.
Although additional CO2 can benefit crops, this effect was nullified by an increase of temperature

The Study clearly indicates that the yield of wheat, mustard, barley and chickpea show sign of stagnation or decrease following rise in temperature at all the four northern states. However, the extent of decrease was different for crops as well as their locations. As a result of temperature rise

There is growing need to qualify the effects of rising temperature on yield of crops in different agroecologies and agri-production environments.
Similarly, various climate change scenarios need to be evaluated for these regions and the specific adoption strategies be evolved.
Simulation models may help a long way in linking other bio-physical and socio-economic drivers of agri-production with climate change.

Predicted climate change impact on waterThe hydrological cycle is predicted to be more intense, with higher annual average rainfall as well increased drought.There is a predicted increase in extreme rainfall and rainfall intensity in all three river basins towards the end of the 21st century . Number of rainy days decreases in the western parts of the Ganga basin, but with increases over most parts of the Godavari and Krishan basinsThus, surface water availability showed a general increase over all 3 basins (though future populations projections would need to be considered to project per capita water availability.

Crop yields could increase up to 20% in East and Southeast AsiaCrop yield decrease up to 30% in Central and South Asia by 2050.In India, wheat yields could decrease by 5-10% per 10C rise intemperature
Impacts on food production
Impacts on water resourcesGlacier melt projected to increase flooding, rock avalanches and toaffect water resources within the next two to three decades.
Salinity of groundwater especially along the coast, due to increases insea level and over-exploitation.In India, gross per capita water availability will decline from 1820m3/yr in 2001 to 1140 m3/yr in 2050

Coastal erosion and inundation of coastal lowland as sea levelcontinues to rise, flooding the homes of millions of peopleliving in low lying areas.
In India, potential impacts of 1 m sea-level rise includeinundation of 5,763 km2. Significant losses of coastal ecosystems, affecting the aquaculture industry, particularly inheavily-populated mega-deltas.
Simulation models show an increase in frequencies of tropical cyclones in the Bay of Bengal particularly intense events areprojected during the post-monsoon period.
Sea level rise is projected to displace populations in coastalzones, increase flooding in low-lying coastal areas, loss of cropyields from inundation and salinization.
Impacts on coastal areas

Forestry77% and 68% of the forested grids in India are likely to experience shift in forest types
Indications show a shift towards wetter foresttypes in the northeastern region and drierforest types in the northwestern region in theabsence of human influence.
Increasing atmospheric CO2 concentration andclimate warming could also result in a 50 to70% increase under the B2 scenario
Dry savannah
Xeric Shrub land
Xeric woodland
Tropical Seasonal Forest
Boreal Evergreen
Tundra
Simulated
Projected

Adaptation to Climate ChangeAdaptation to Climate Change

Adaptive capacity to multiple stressors in India
District-level vulnerabilityLowest
Low
Medium
High
Highest
Double exposed
Urban districts
Missing data

Response of Farming SystemCrops have to cope with increased variability of weather, extreme events, and changing climate patterns throughout the growing season.Agriculture may learn to adapt to climate change but climate variability needs to be combated. The frequency of occurrence of extreme climate conditions dictates the response of agriculture to climate variability/change.

Agriculture to Combat Increased Variability in Weather & Climate
• Heat / Cold Wave
• More variable R/F
• Increased Extremes Weather Events
• Erratic Onset, advance and retrieval of Monsoon
• Shift in Active/break cycles
• Intensity and frequency of Monsoon Systems

Combating climate change riskAdaption- a response to actual or expectedeffects, that will reduce risk posed to life andlivelihood
- Moderating the adverse impact- Promoting resilience among vulnerable people- Local to global
Mitigation-reducing emissions of GHGs andsequestering/ storing carbon(ST0)
- Making development choices to curb emissions (LT) - Creating more C sink- Taking into account CC damages, sustainability, cobenefit,
partnering, equity and attitudes to risk

AdaptationIntensity farm productionImprove land management practices-soil
&nutrientsIncrease water managementReduce inefficiency in water use
Preserve and enhance plant and animal genetic resourcesAdjust food consumption patternsMaintain dietary quality and diversityPromote eco-friendly energy use

Adaptation (contd.)Adopt ecosystem based approachs of risk management/
adaptation-
Shift to different cropping patterns
Adopt integrated farming system & Integrated agro forestry systems
Shift to different fishing practices
Promote small scale forestry based enterprises for local income diversification

Vigorous adaptation measuresImprove resilience of vulnerable communities inthe next few decades- implementation of adaptation through:
Vulnerability assessments;Finacial needs assessments;Capacity building and response strategies;Integration of aaadaptation actions into sectoral and nationalplanning;andThe development of risk management and riskreduction strategies, including insurance, and disaster reductionstrategies.

The broad areas where adaptation programme have been developed include:
Crop Improvement
Risk financing
Drought Proofing
Disaster Management

Adaptations to Climate Change
• New varieties: drought/heat resistant• New farm management practices• Change in land use• Watershed management• Agri-insurance

The Agromet services provide a very special kind of inputs to the farmer as advisories that can make a tremendous difference to the agriculture production by taking in time actions against extreme weather events.
This has a potential to change the face of India in terms of food security and poverty alleviation.
Agromet Advisory Services

TIER 1
Apex Policy Planning Apex Policy Planning BodyBody
TIER 2TIER 2National Agro Met National Agro Met
Service HQ (Execution)Service HQ (Execution)
TIER 3TIER 3State Agro Met Centres~28State Agro Met Centres~28
coordination/monitoringcoordination/monitoring
TIER 4TIER 4AMFUsAMFUs
Agro Climatic Zone Level ~ 127Agro Climatic Zone Level ~ 127
TIER 5TIER 5District Level Extension & TrainingDistrict Level Extension & Training
Input management as advisoryInput management as advisory
Plan For Integrated AAS
Drivers of Integration-Need for Crop specific District Level Advisory and Village Level Outreach.

Jodha (1989) using observations of adoption and technological response in post-independent Indian agriculture estimated response time of 5-15 years for items such as productive life of farm assets, crop rotation cycles, and recovery from major disasters.
Broad categories of responses - some of which could be beneficial regardless of how or whether climate changes - include:
Improved training and general education of populations dependenton agriculture.Identification of the present vulnerabilities of agricultural systems. Agricultural research to develop new crop varieties.Food programs and other social security programs to provide insurance against supply changes.Transportation, distribution, and market integration to provide the infrastructure to supply food during crop shortfalls.Removal of subsidies, which can, by limiting changes in prices, mask the climate change signal in the marketplace.

Immediate task in Preparation for Adaptation to Climate ChangeImprove existing climate scenario projections and the sectoral
impact assessments
Develop socio economic scenarios in conjunction with India’s developmental path
Carry out studies at identified climatically hotspot areas
Institute an integrated approach to understand the inter-sectorallinkages affecting the physical and socio economic vulnerabilities at local levels
Carry out analysis to formulate adaptation frameworks at these scales which can provide inputs for the development of a national adaptation plan for combating the adverse effects of climate change.

• Strengthen policies for food security, forests, manage disasters and infrastructure development
• Appropriate allocation of funds for National Development ProgrammeImplementation
• Step up observation systems & technology development and dissemination
• Strengthen Institutional mechanisms as instruments of adaptation at local level
• Arrangement of funds for adaptation
• Mainstream climate change concerns and hence adaptation in the planning process
• Consider Development as one of the pathways for adaptation
Steps Facilitating Adaptation at National and Local Level

Protection against risk of production loss due to drought, floods, etc.State sponsored so farCovers risk for the entire insured area
Adaptation Strategies: Agri-Insurance

Premium based on risk profile of the region and cropsObjective, independent assessment of loss using systems research tools such as GIS, remote sensing and modelsQuick settlement of claims: reconstructing past using models
Need for Designing Improved Agri-Insurance Scheme

Mitigation to Climate ChangeMitigation to Climate Change

MitigationReducing emissions of carbon
dioxideReducing emissions of methane and
nitrous oxideSequestering carbonClean development mechanism
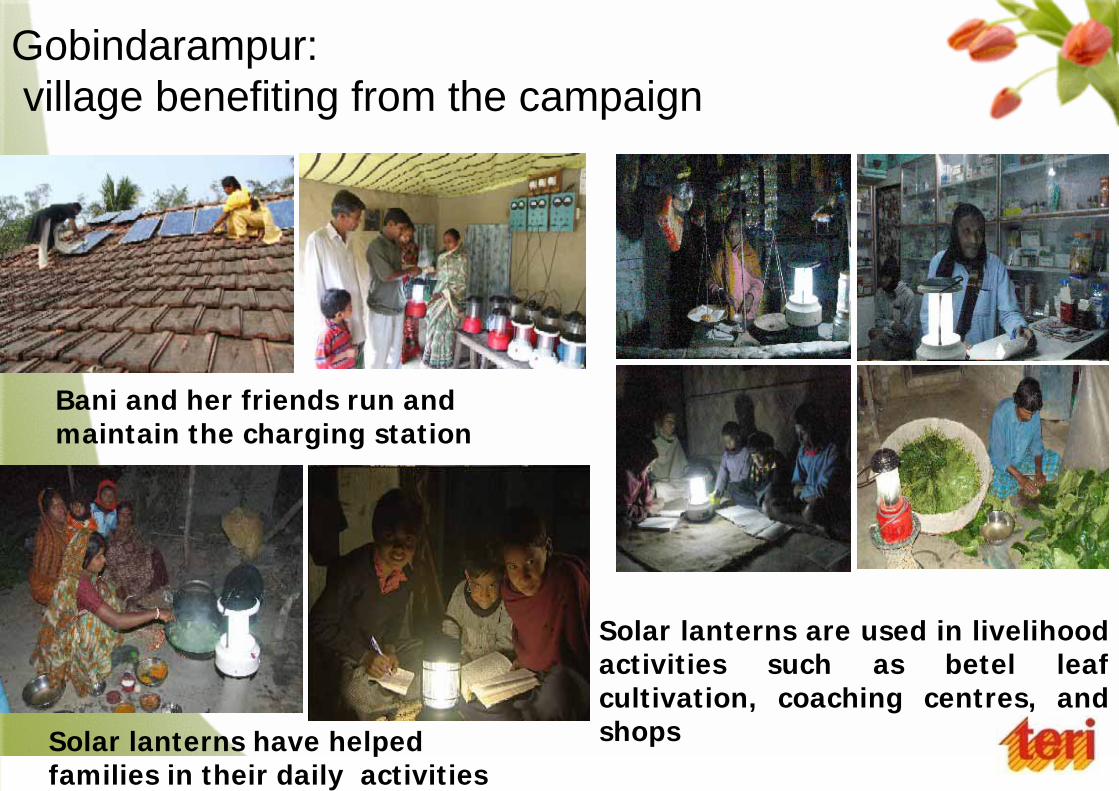
Gobindarampur: village benefiting from the campaign
Solar lanterns are used in livelihood activities such as betel leaf cultivation, coaching centres, and shops
Bani and her friends run and maintain the charging station
Solar lanterns have helped families in their daily activities

Mitigation of Climatic Change/ Feedbacks on Environment : Information Needs
Can alternate land use systems such as plantation crops and agroforestry increase carbon sequestration and yet meet food demand?How much area can be taken out from agriculture for forestry; where and what policy measures would be needed?How much carbon is conserved by limited tillage options? For how long and in which regions?What policies and technologies would encourage the farmers to enrich organic matter in the soil and thus improve soil health?

Mitigation of Climatic Change/ Feedbacks on Environment
Agro-forestry systemsResource conservation technologies Enriching soil organic matterBiofuels