Embed Size (px)
Citation preview

Climate Change: A Risk Business......
Photo: Rob Bieber

Credit Valley Conservation Jurisdiction
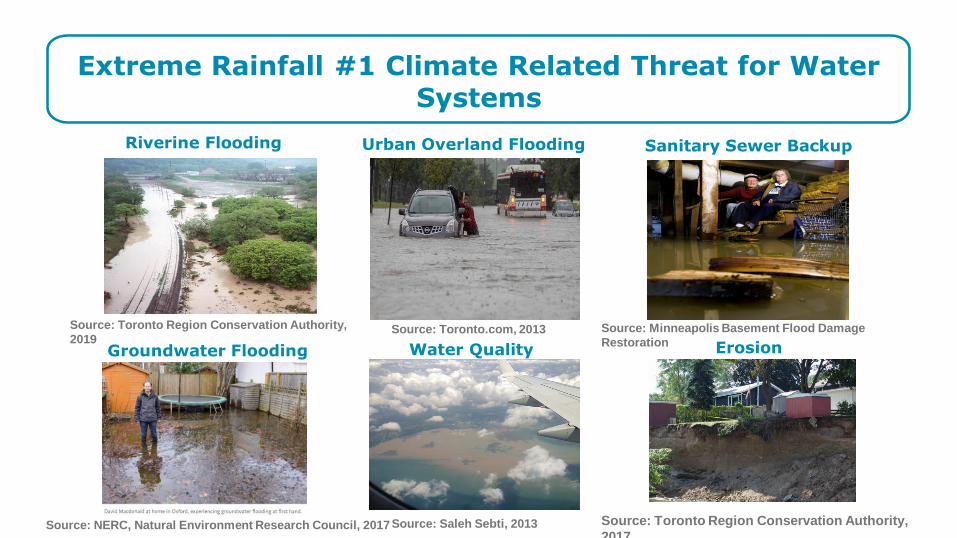
Extreme Rainfall #1 Climate Related Threat for Water Systems
Urban Overland Flooding Sanitary Sewer BackupRiverine Flooding
Water QualityGroundwater Flooding Erosion
Source: NERC, Natural Environment Research Council, 2017
Source: Toronto Region Conservation Authority,
2019Source: Toronto.com, 2013 Source: Minneapolis Basement Flood Damage
Restoration
Source: Toronto Region Conservation Authority,
2017Source: Saleh Sebti, 2013

Other Municipal and Community Impacts
Evacuation Plans do not consider flooding
Critical Infrastructure failure poses potential threat to public
Community and municipal service needs

Other Municipal and Community Impacts
Economic Impacts Drinking Water Threats Public Health Risks


What Level of Risk are we willing to accept?
What Level of Service can we feasibly achieve in older areas?
What will Climate Change bring?

Assessing Exposure to Liability
9
Are we doing less than what
other municipalities are doing?
Are we making clear,
justifiable and well-
documented “policy”
decisions around
stormwater?
Are we prepared for
reasonably foreseeable
risks?

Federal and Provincial Requirements
Growth Plan for GGH/ PPS (2019)
• Stormwater master planning informed by the relevant
watershed/subwatershed plans
Ontario Reg 588/17 3(1) 5
• Asset management address Climate Change vulnerabilities
Federal Infrastructure Funding
• Requires climate change risk assessment, ROI for best management
practices including economic, social and critical infrastructure impacts

Integrating Watershed Levels of Service into Asset Plans
Example only
Maintain existing Average
Annualized Flood Damages under
2050 Climate
Add 10 SWM ponds and require LID for
infill/redevelopment

What are taxpayers willing to pay?
What areas do we prioritize?
What options have the greatest return on investment?

Risk and Return on Investment Tool

PARTNERS: Risk and Return on Investment Tool
14
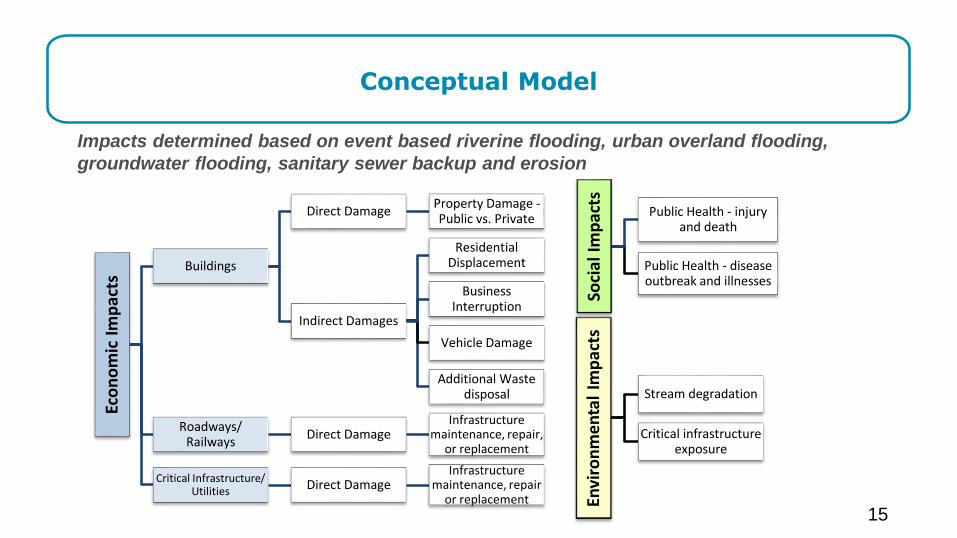
Conceptual Model
15
Eco
no
mic
Im
pac
ts
Buildings
Direct DamageProperty Damage -Public vs. Private
Indirect Damages
Residential Displacement
Business Interruption
Vehicle Damage
Additional Waste disposal
Roadways/ Railways
Direct DamageInfrastructure
maintenance, repair, or replacement
Critical Infrastructure/ Utilities Direct Damage
Infrastructure maintenance, repair
or replacement
Soci
al I
mp
acts
Public Health - injury and death
Public Health - disease outbreak and illnesses
Envi
ron
men
tal
Imp
acts
Stream degradation
Critical infrastructure exposure
Impacts determined based on event based riverine flooding, urban overland flooding,
groundwater flooding, sanitary sewer backup and erosion

Assessment Can be done at different Scales
Community-wide
Urban flood risk
Watershed-wide
Erosion assessment Other Assessments:
• Riverine Flooding• Sanitary Sewer
backup• Groundwater
flooding• Health impacts
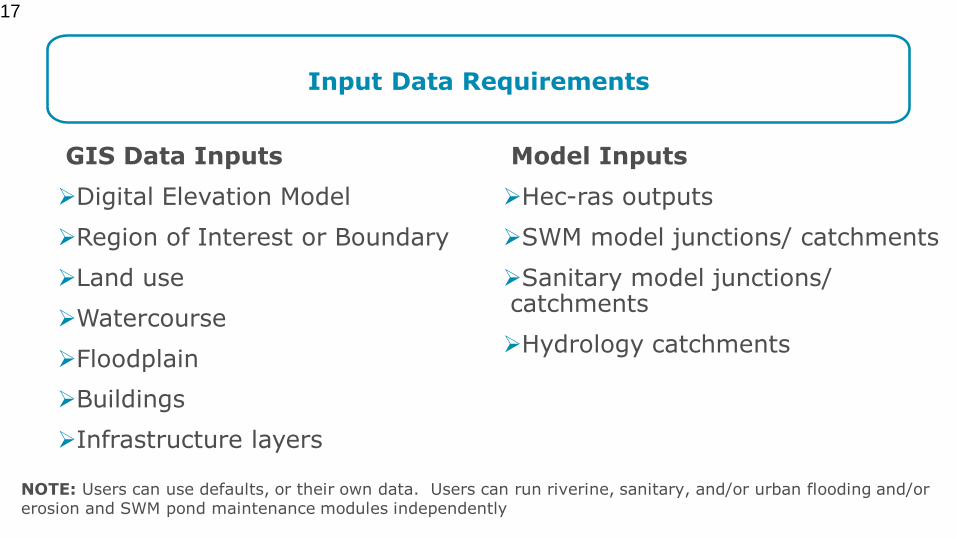
Input Data Requirements
17
GIS Data Inputs
Digital Elevation Model
Region of Interest or Boundary
Land use
Watercourse
Floodplain
Buildings
Infrastructure layers
Model Inputs
Hec-ras outputs
SWM model junctions/ catchments
Sanitary model junctions/ catchments
Hydrology catchments
NOTE: Users can use defaults, or their own data. Users can run riverine, sanitary, and/or urban flooding and/or erosion and SWM pond maintenance modules independently

Built In Source Data
• National Water and Wastewater Benchmarking – Infrastructure Cost
• IBI Group – Building Depth-Damage Cost Curves, Spatial Index, Life Cycle Cost of Management Options
• Sustainable Technologies Evaluation Program (STEP) – Stormwater Management Ponds, and Low Impact Development Life Cycle Costing
• Life Cycle Costing for Natural Assets
• US Federal Emergency Management Agency/ Intact Standard – Damage Relationships
• Statistics Canada - Demographics
• Province of Ontario – Provincial Digital Elevation Model, Surficial Geology
• Social Vulnerability Index Mapping
18

Economic Impact (Flood Damages, 100-year storm)
19
Case Study 1 Case Study 2
Flood Type Flooded
Buildings
(100- yr)
Total
Damages
($)
Riverine
flooding
150 $21M
Urban
flooding
2400 $400M
Flood Type Flooded
Buildings
(100- yr)
Total
Damages
($)
Groundwater
flooding
20 $1.2M
Urban
flooding
7 $0.7M

Event- based Damage Quantification (Public and Private)
20
$-
$50,000,000
$100,000,000
$150,000,000
$200,000,000
$250,000,000
$300,000,000
$350,000,000
$400,000,000
$450,000,000
100 yr 50 yr 25 yr 10 yr 5 yr 2 yr
Tota
l D
irect D
am
ages (
$)
Storm Profiles
Flooded Buildings - Riverine
Flooded Buildings - Urban Overland Flooding and Storm SewerBackup
Flooded Roads (Riverine & Urban)
Flooded Railways (Riverine and Urban)
Case Study 1
$-
$200,000
$400,000
$600,000
$800,000
$1,000,000
$1,200,000
$1,400,000
100 yr 50 yr 10 yr 2 yr
Tota
l D
irect D
am
ages (
$)
Storm ProfilesGroundwater FloodingUrban Overland Flooding and Storm Sewer BackupRoads
Case Study 2

Erosion Damage to Critical Infrastructure
21

Striking the Right Balance
22

Groundwater Considerations for Low Impact Development
LEGEND

Tool allows Municipalities to Compare Solutions
24
Sample output: comparing various solutions for their return on investment (in terms of damage reduction/avoidance)
71
108
129
0
20
40
60
80
100
120
140
Existing 2050 2080
Ave
rag
e A
nn
ua
l D
am
ag
e (
Mil
lio
ns
, $
)
Climate Scenario
Average Annual Damages under Baseline compared with Management Scenarios
Baseline
71
108
129
69
104
123
0
20
40
60
80
100
120
140
Existing 2050 2080
Ave
rag
e A
nn
ua
l D
am
ag
e (
Mil
lio
ns
, $
)
Climate Scenario
Average Annual Damages under Baseline compared with Management Scenarios
Baseline SWMPs (without bypass)
71
108
129
69
104
123
67
103
124
0
20
40
60
80
100
120
140
Existing 2050 2080
Ave
rag
e A
nn
ua
l D
am
ag
e (
Mil
lio
ns
, $
)
Climate Scenario
Average Annual Damages under Baseline compared with Management Scenarios
Baseline SWMPs (without bypass) Green Development Standards

Natural Assets Life Cycle Costing Database
25

Return on Investment (Net Present Value, NPV)
26
$71
$88 $96
$(45)
$(6)
$18
-$60
-$40
-$20
$0
$20
$40
$60
$80
$100
$120
Existing 2050 2080
Net P
resent
Valu
e , N
PV
(M
illions, $)
Climate Scenarios
Green Development Standards
SWMPs (without bypass)
These are sample outputs only
$3,116
$4,713 $5,240
$8,815
$10,105 $10,397
$0
$2,000
$4,000
$6,000
$8,000
$10,000
$12,000
Current 2050 2080Net P
resent
Valu
e , N
PV
(T
housands,
$)
Climate Scenarios
LID Retrofit - 25mm
Millpond Rehabilitation
Case Study 1 Case Study 2

Return on Investment (Internal Rate of Return)
27
-1.6%
2.5%
4.4%
-2.00%
-1.00%
0.00%
1.00%
2.00%
3.00%
4.00%
5.00%
Existing 2050 2080
Inte
rnal R
ate
of
Retu
rn, IR
R (
%)
Climate Scenarios
SWMPs (without bypass)
48.6%
71.4%
79.0%
0.0%
10.0%
20.0%
30.0%
40.0%
50.0%
60.0%
70.0%
80.0%
90.0%
Current 2050 2080
Inte
rnal R
ate
of
Retu
rn (
IRR
), %
Climate Scenarios
LID Retrofit - 25mm
Case Study 1 Case Study 2

How are municipalities using the Tool results?

Priority Assets for Infrastructure Upgrades
29
Riverine UrbanTotal

Prioritizing Action to Address Social Vulnerability and Pollutant Hot Spots
30
These are sample outputs only
Health
Legend
‘Hot Spots’ for health impacts
(injury, illness)
High Maintenance BMPs

Risk and Return on Investment Tool’s Erosion Mapping can help identify win-
win opportunities for municipal infrastructure, aquatic and natural heritage
system restoration
Source: Chris Halliday, Orangeville Banner. Orangeville
reroutes trail near area suspected of aggravating flood waters

Risk and Return on Investment Tool can help identify and make the case for win-win opportunities for park land acquisition,
flood mitigation and our Natural Heritage System

Legend
‘Hot Spots’ for health impacts (injury, illness)
Risk and Return on Investment Tool identifies communities that maybe vulnerable to health and safety
risks associated with flooding

Description
New
Development
Lands
Existing Development Lands
Greenfield/Infill
lands
Retrofit of existing
IC
Retrofit of existing
residential roads
ROWs
Objective –
test targeted
LID strategy
to reduce
urban
overland
flooding
15mm over all
lands per current
practices
15mm over the ICI
lands within the
targeted high-risk
catchments (i.e., per
CVC slides, 25% of
the 33%)
15mm within ROW
in residential HRAs
LID Scenario 1 –
Urban Flooding

Description
New Development
LandsExisting Development Lands
Greenfield/Infill
lands
Retrofit of
existing
ind/comm
Retrofit of existing
roads ROWs
Objective –
test targeted
LID strategy
to reduce
TSS and
improve water
quality
15mm over all lands
per current
practices
15mm over the
ICI lands within
the targeted high
loading
catchments (i.e.,
per CVC slides,
10% of the 31%)
15mm within ROW
draining ICI lands
LID Scenario 2 – Water
Quality

Other Functions
Other assessments currently in RROIT (2020)
• Sanitary sewer backup
• Groundwater flooding (river-connected alluvial flooding, high groundwater table areas)
• Indirect Damages (Residential Displacement, Business Interruption)
Future RROIT Development (2021+)
• Social Vulnerability Index Mapping
• Greenhouse Gas Emissions calculator to support Infrastructure Canada’s Climate Lens
funding requirements
• Water quality (TSS/TP annual loading and reduction with BMPs)

Closing Remarks
• In 2021-2022 pending funding would like to add water quality and
GHG emissions into the tool
• CVC and partners are working on releasing the Tool more broadly
including training on the Tool
• If you are interested in the Tool or participating in the Watershed
Level of Service Project, please contact Christine Zimmer
[email protected] and Amna Tariq [email protected]