Embed Size (px)
Citation preview
USVI Hurricane Recovery and Resilience Task Force 1
HU
RR
ICAN
ES I
RM
A AN
D M
ARIA
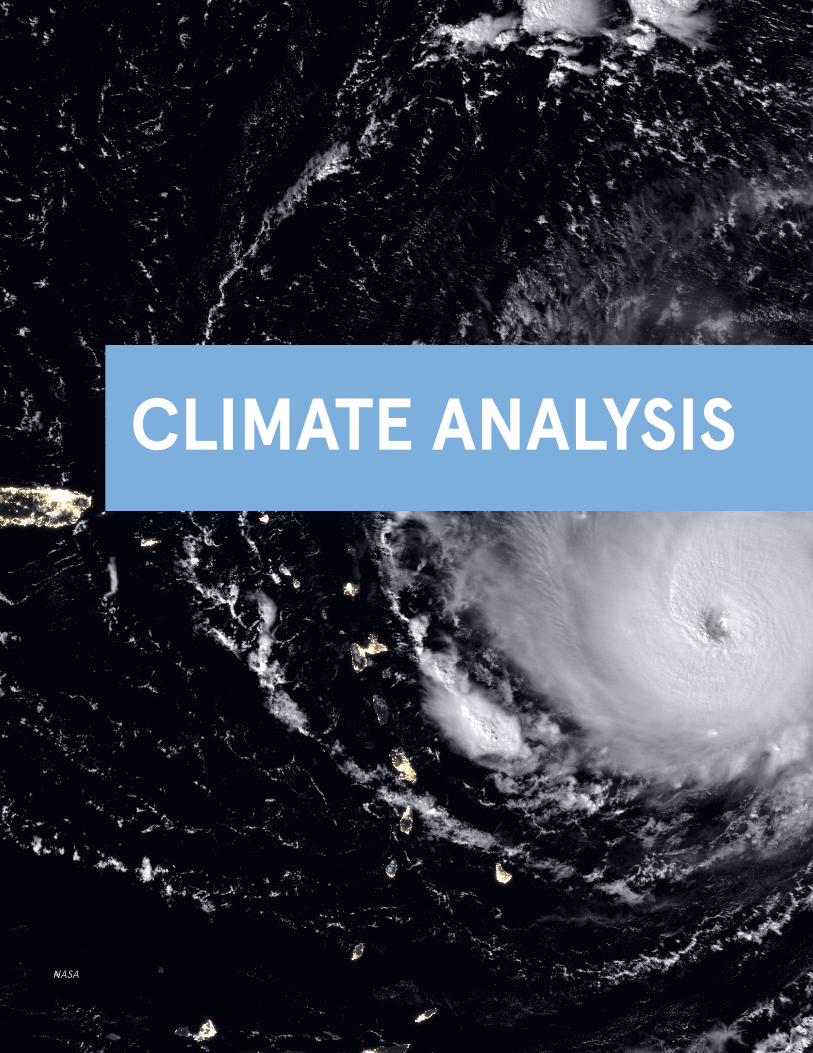
CLIMATE ANALYSIS
NASA

USVI Hurricane Recovery and Resilience Task Force 31
CLI
MAT
E AN
ALYS
IS
The US Virgin Islands (USVI) climate is changing and will continue to change, and the impacts of natural hazards will become more intense. First, temperatures are rising. Rainfall patterns are, and will continue to be, highly variable. The Territory will get drier by the end of the century. Seas are rising, and they will submerge—intermittently at first, but eventually permanently—economically and culturally important coastal areas such as beaches, buildings, critical infrastructure, and roads. Last, it is expected that hurricanes and swells will become more powerful—not necessarily more frequent—causing more wind damage, longer and more intense rainstorms, greater inundation, and more severe coastal erosion.
WHAT IS CLIMATE CHANGE?Weather patterns are driven by differences in temperature of the Earth’s surface, leading to changes in pressure, wind, humidity, and, ultimately, rainfall patterns. Climate refers to the long-term regional or even global average of temperature, humidity, and rainfall patterns over seasons, years, or decades.1 The Earth’s climate is affected by solar cycles, changes in ecosystems, or volcanic eruptions. Due to the global increase of temperatures, climate in different parts of the world has been changing for at least the past 100 years. Indeed, in the course of well over a century, humans have been emitting vast amount of greenhouse gases to the atmosphere. These gases, which are common gases (e.g., carbon dioxide, methane, water vapor, etc.) and lesser-known gases (e.g., fluorinated gases), usually trap heat in the atmosphere and help maintain livable temperatures on earth.2 However, excess emissions by humans, mostly carbon dioxide through the burning of fossil fuels, have caused more heat to be trapped and global temperatures to slowly increase (see chart: Observed global temperature and carbon dioxide increases).
The steady increase in global temperature, known as global warming, is leading to disturbances around the world that change weather patterns, and thus also change climate. As a result, many places in the world have experienced long-term changes in the frequency, intensity, and duration of weather events—meaning that their climate has changed.
These changes, and the impacts of these events, have been exacerbated by a global rise in sea level caused by the melting of glaciers; these land-based reserves of water are melting due to increased global temperatures.
CLIMATE OF THE USVI
RainfallRainfall in the USVI averages around 39 inches per year, with significant variations within the geography of each island and on the different islands. Nevertheless, the typical dry season lasts from January to April, with a smaller dry season in June and July. The wettest months are September to November. However, rainfall patterns vary significantly from year to year: USVI can experience above average precipitation and flooding one year and drought or near-drought conditions the following year. The causes of this annual variability are still unclear, as some already known factors and several obscurely known processes drive both rainfall patterns.
TemperaturesThe USVI has a tropical climate, characterized by warm temperatures and rainy and dry seasons. Temperatures in the USVI vary with location and altitude, but they average around 88°F during the day, cooling to around 76 degrees Fahrenheit at night, with some variations within and among the different islands in the Territory (see figure: Average temperature distribution on St. Thomas, St. Croix, and St. John). The warmer period lasts from May to November, with highs around 89 degrees Fahrenheit; the cooler period lasts from December to April, with average highs around 83 degrees Fahrenheit. Temperatures can sometimes reach above 95 degrees Fahrenheit, but the heat is often tempered by the nearly constant sea breeze. Minimum temperatures can reach below 70 degrees Fahrenheit, but such occurrences are rare.
These patterns feel somewhat predictable, but, since 1901, average annual temperatures have increased by approximately four degrees Fahrenheit. This rate
1 “What’s in a Name? Weather, Global Warming and Climate Change.” NASA, January 20, 2016, Accessed June 2018. https://climate.nasa.gov/resources/global-warming/.
2 “Greenhouse Gas (GHG) Emissions,” EPA, June 4, 2018, accessed June 2018. https://www.epa.gov/ghgemissions.

USVI Hurricane Recovery and Resilience Task Force 32
CLI
MAT
E AN
ALYS
IS
of increase has been consistent and similar for both maximum and minimum average temperatures. As a consequence, there are more warm days and, most notably, more warm nights.
Climate-induced natural hazards in the USVIThe USVI and its history, like other places in the Caribbean, have been shaped and formed by natural disasters. The Territory is susceptible to the impacts of nearly six out of 10 of climate-induced natural hazards that can occur. The most recurrent and devastating events are hurricanes, which induce coastal flooding; riverine (rain-driven) flooding, and destructive winds; rain storms, which induce coastal flooding; and droughts. Heat waves are not common occurrences in the USVI. Of all the hazards that can affect the USVI, several have the potential to be changed by the unfolding consequences of climate change: days that feel extraordinarily hot, rainfall patterns, hurricanes, large swells from distant ocean storms, and wildfires.
The USVI regularly experiences flooding during rainstorms, or riverine flooding. Between 1997 and 2016, the National Oceanic and Atmospheric Administration (NOAA)3 recorded nearly 37 riverine flooding events in the Territory, nearly two events per year. Major rainstorms also caused severe damage prior to these NOAA measurements, such as the extreme rainstorms of 1983 and 1974.4 On the other side of the spectrum, droughts are also common occurrences in the Territory and—similar to flooding—can cause a fair amount of economic damage. A severe drought in 1733 all but wiped out the ability of St. John to produce food; the droughts of 1967-1968,5 and 1994-1995 severely impacted the agriculture sector and people’s ability to secure freshwater for their daily needs. Finally, since 1997, NOAA6 has recorded two droughts (2002, 2005), but this is likely an under-estimation, as it does not, for example, include the 2015 drought.
Hurricanes are also common occurrences in the Territory. The Great Hurricanes of the 1780s were some of the most devastating and consequential hurricanes in the recorded history of the Caribbean.7 Since then, at least 110 hurricanes have travelled within 120 miles of the USVI—winds will often still have tropical storm strength at this distance away from the hurricane’s eye.8, 9 On
Observed global temperature and carbon dioxide increases (1881-1910 baseline)
Mean temperatures at Henry E. Rohlsen Airport (STX) on St. Croix
Average temperature distribution on St. Croix (left), St. Thomas (top right), and St. John (bottom right)
HighLow
3 “Storm Events Database,” National Climatic Data Center, accessed June 2018, https://www.ncdc.noaa.gov/stormevents/.4 Richard W. Paulson, Edith B. Chase, Robert S. Roberts, and David W. Moody, National Water Summary 1988-89: Hydrologic Events and Floods and Droughts
(Washington, D.C.: US Government Printing Office, 1991).5 Paulson, Chase, Roberts, and Moody. National Water Summary 1988-89.6 “Storm Events Database.” National Climatic Data Center, accessed June 2018, https://www.ncdc.noaa.gov/stormevents. 7 Stuart B. Schwartz, Sea of Storms: A History of Hurricanes in the Greater Caribbean from Columbus to Katrina. (Princeton, NY: Princeton University Press, 2015).8 “National Hurricane Center, Data Archives,” NOAA, accessed June 2018, https://www.nhc.noaa.gov/data.9 Schwartz, Sea of Storms.
Adapted from: http://www.climatecentral.org/gallery/graphics/co2-and-rising-global-temperatures
UVI and UWI, 2018
Eric Harmsen
75
76
77
78
79
80
81
82
83
84
85
Jan Feb Mar Apr May Jun Jul Aug Sep Oct Nov Dec
Aver
age
Tem
pera
ture
(⁰F)
Tem
pera
ture
Ano
mal
y (°
C)
CO
2 C
once
nter
atio
n (p
pm)
0.70
0.60
0.50
0.40
0.30
0.20
0.10
0.00
-0.10
-0.20
400
390
380
370
360
350
340
330
320
310
3001960 1970 1980 1990 2000 2010

USVI Hurricane Recovery and Resilience Task Force 33
CLI
MAT
E AN
ALYS
IS
average, the USVI has been within the zone of influence of approximately two hurricanes per year and has experienced damaging hurricanes approximately every six years. Since 1950, when the modern era of naming and tracking hurricanes more precisely began, the USVI has been in the zone of influence of an average of three hurricanes per year and has suffered from nearly half of the hurricanes that were within 120 miles.10, 11 Most of these storms were Category 3 or 4 until 2017, meaning their maximum sustained wind speeds were 155 MPH or below (see table: Saffir-Simpson hurricane wind scale).
Hurricanes Irma and Maria were the only two Category 5 hurricanes of the modern era. However, it is too early to tell whether these events are the result of climate change. Indeed, the impact of climate change on hurricane genesis and paths is still an active subject of research. According to NOAA12 “it is premature to conclude that human activities […] have already had a detectable impact on Atlantic hurricane […] activity. That said, human activities may have already caused changes that are not yet detectable […], or are not yet confidently modeled.” Also, it is worth noting that since hurricanes have only been tracked and recorded accurately for slightly more than 60 years, there isn’t enough data to discern trends.
Aside from hurricanes, riverine flooding, and droughts, the USVI experiences high surf and swells, large powerful waves generated by distant storms in the Atlantic, that can cause significant coastal erosion. NOAA has recorded 11 such incidents since 1997.13 The USVI, and St. Croix specifically, can also experience wildfires (19 since 1997, most of them on St. Croix).14 It is likely these fires were triggered by droughts, although this has not been confirmed. It is important to remember that these extreme events are independent events, and there can be many events within the same year. For example, in 2017, heavy rains caused heavy flooding in July, and subsequently two hurricanes struck the Territory in September. In 1994-1995, the USVI experienced damaging droughts before suffering from the impacts of Hurricanes Luis and—even more destructive—Marilyn in 1995. In 1867, a tsunami followed a hurricane that had devastated the islands less than three weeks earlier.15 Last, in 1733, a severe drought was followed by a devastating hurricane.16, 17
10 Ibid. 11 Paulson, Chase, Roberts, and Moody, National Water Summary 1988-89.12 “Global Warming and Hurricanes” National Oceanic and Atmospheric Administration, accessed June 2018, https://www.gfdl.noaa.gov/global-warming-and-
hurricanes.13 Ibid.14 “Storm Events Database.”15 R.A. Watlington, E. Lewis, and D. Drost “Coordinated Management of Coastal Hazard Awareness and Preparedness in the
USVI,” PLOS Biology, April 30, 2014, Accessed June 2018, https://doi.org/10.5194/adgeo-38-31-2014.16 D Knight, “A Documentary History of the Cinnamon Bay Plantation 1718-1917” (St. Thomas: Virgin Islands Historical and Genealogical Resource Center, 1999).17 Holly Kathryn Norton, “Estate by Estate: The Landscape of the 1733 St. John Slave Rebellion” (PhD. Dissertation, Syracuse University, 2013).
Annual minimum, average and maximum temperatures in the USVI
Deviation of rainfall total from average values
Average rainfall patterns at the Cyril E. King Airport (STT) on St. Thomas
UVI and UWI, 2018
Stuart Weiss
UVI and UWI, 2018
Dev
iati
on fr
om A
vera
ge (i
n)Av
erag
e Pr
ecip
itat
ion
(in)
Aver
age
Tem
pera
ture
(°F)
40
30
20
10
0
-10
-20
-30
6
5
4
3
2
1
0
1987
1988
1989
1990
1991
1992
1993
1994
1995
1996
1997
1998
1999
2000
2001
2002
2003
2004
2005
2006
2007
2008
2009
2010
2011
90
85
80
75
70
65
601880 1900 1920 1960 2000
MinimumMaximumFahrenheit Mean1940 1980 2020 2040
Jan DecSepApr NovOctAugJulFeb Mar May Jun
USVI Hurricane Recovery and Resilience Task Force 34
CLI
MAT
E AN
ALYS
IS
FUTURE OF CLIMATE IN THE USVI
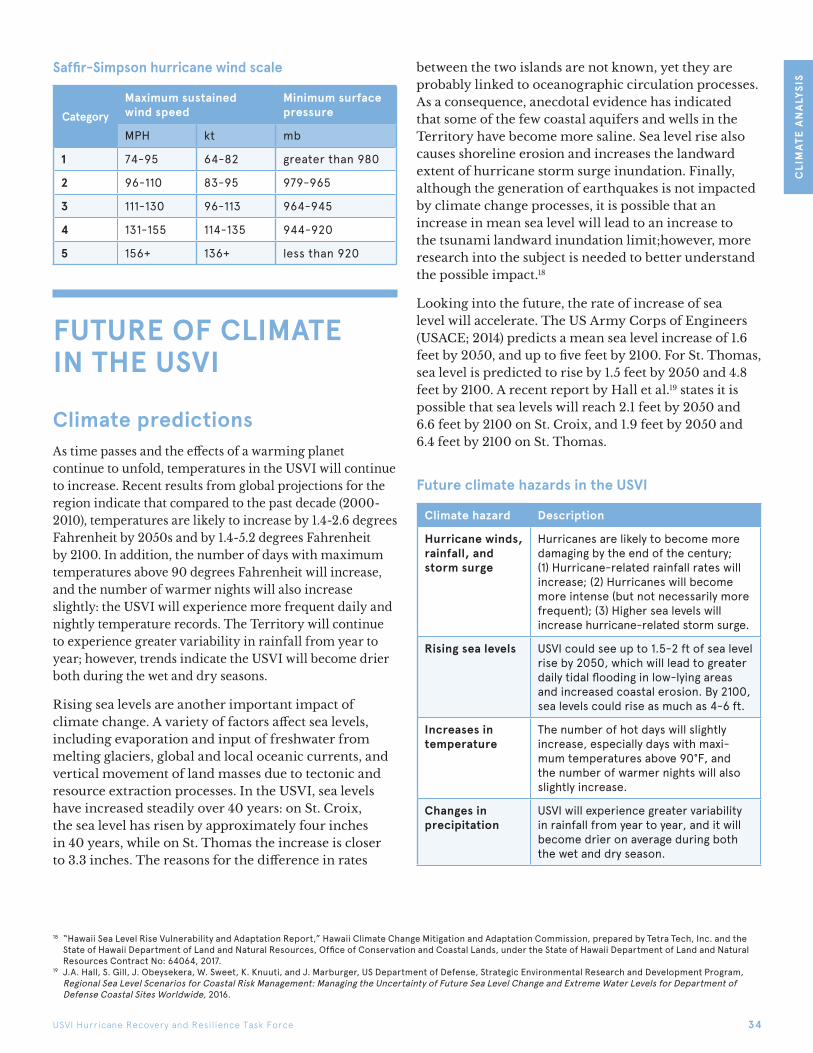
Climate predictionsAs time passes and the effects of a warming planet continue to unfold, temperatures in the USVI will continue to increase. Recent results from global projections for the region indicate that compared to the past decade (2000-2010), temperatures are likely to increase by 1.4-2.6 degrees Fahrenheit by 2050s and by 1.4-5.2 degrees Fahrenheit by 2100. In addition, the number of days with maximum temperatures above 90 degrees Fahrenheit will increase, and the number of warmer nights will also increase slightly: the USVI will experience more frequent daily and nightly temperature records. The Territory will continue to experience greater variability in rainfall from year to year; however, trends indicate the USVI will become drier both during the wet and dry seasons.
Rising sea levels are another important impact of climate change. A variety of factors affect sea levels, including evaporation and input of freshwater from melting glaciers, global and local oceanic currents, and vertical movement of land masses due to tectonic and resource extraction processes. In the USVI, sea levels have increased steadily over 40 years: on St. Croix, the sea level has risen by approximately four inches in 40 years, while on St. Thomas the increase is closer to 3.3 inches. The reasons for the difference in rates
between the two islands are not known, yet they are probably linked to oceanographic circulation processes. As a consequence, anecdotal evidence has indicated that some of the few coastal aquifers and wells in the Territory have become more saline. Sea level rise also causes shoreline erosion and increases the landward extent of hurricane storm surge inundation. Finally, although the generation of earthquakes is not impacted by climate change processes, it is possible that an increase in mean sea level will lead to an increase to the tsunami landward inundation limit;however, more research into the subject is needed to better understand the possible impact.18
Looking into the future, the rate of increase of sea level will accelerate. The US Army Corps of Engineers (USACE; 2014) predicts a mean sea level increase of 1.6 feet by 2050, and up to five feet by 2100. For St. Thomas, sea level is predicted to rise by 1.5 feet by 2050 and 4.8 feet by 2100. A recent report by Hall et al.19 states it is possible that sea levels will reach 2.1 feet by 2050 and 6.6 feet by 2100 on St. Croix, and 1.9 feet by 2050 and 6.4 feet by 2100 on St. Thomas.
18 “Hawaii Sea Level Rise Vulnerability and Adaptation Report,” Hawaii Climate Change Mitigation and Adaptation Commission, prepared by Tetra Tech, Inc. and the State of Hawaii Department of Land and Natural Resources, Office of Conservation and Coastal Lands, under the State of Hawaii Department of Land and Natural Resources Contract No: 64064, 2017.
19 J.A. Hall, S. Gill, J. Obeysekera, W. Sweet, K. Knuuti, and J. Marburger, US Department of Defense, Strategic Environmental Research and Development Program, Regional Sea Level Scenarios for Coastal Risk Management: Managing the Uncertainty of Future Sea Level Change and Extreme Water Levels for Department of Defense Coastal Sites Worldwide, 2016.
Saffir-Simpson hurricane wind scale
CategoryMaximum sustained wind speed
Minimum surface pressure
MPH kt mb
1 74-95 64-82 greater than 980
2 96-110 83-95 979-965
3 111-130 96-113 964-945
4 131-155 114-135 944-920
5 156+ 136+ less than 920
Future climate hazards in the USVI
Climate hazard Description
Hurricane winds, rainfall, and storm surge
Hurricanes are likely to become more damaging by the end of the century; (1) Hurricane-related rainfall rates will increase; (2) Hurricanes will become more intense (but not necessarily more frequent); (3) Higher sea levels will increase hurricane-related storm surge.
Rising sea levels USVI could see up to 1.5-2 ft of sea level rise by 2050, which will lead to greater daily tidal flooding in low-lying areas and increased coastal erosion. By 2100, sea levels could rise as much as 4-6 ft.
Increases in temperature
The number of hot days will slightly increase, especially days with maxi-mum temperatures above 90°F, and the number of warmer nights will also slightly increase.
Changes in precipitation
USVI will experience greater variability in rainfall from year to year, and it will become drier on average during both the wet and dry season.
USVI Hurricane Recovery and Resilience Task Force 35
CLI
MAT
E AN
ALYS
IS
Impacts of climate change on hazardsThe previous section discussed the role of natural hazards in USVI history, how climate change is already affecting the Territory as a consequence, and some of the hazards that may impact the USVI. As the century progresses, climate change will continue to affect natural processes, thus changing the nature of the hazards the USVI will face.
Temperatures and rainfallAlthough the USVI has not experienced heat waves, increases in temperatures will lead to warmer days and warmer nights, and increase air quality problems. These effects will exacerbate health problems in vulnerable populations.20
An overall drier climate means that drought might be more severe or last longer. This, in turn, might increase the risk for wildfires, especially on St. Croix. Changes in rainfall patterns will also impact water supplies for people, as well as different sectors that depend on it such as agriculture.
Impact on ecosystemsClimate change will greatly affect the health, conditions, and footprint of ecosystems and the benefits they provide: mangroves and wetland footprints might shrink, reducing their ability to reduce storm surge or store storm water; coral reefs will continue to degrade and might not be able to recover from disturbances, thus reducing their ability to protect against wave action and serve as habitat for fish; the composition of forests and their species might change, leading to a changed landscape, altering cultural traditions and potentially creating health hazards. These changes might also impact other sectors that rely on natural ecosystems, such as tourism.21, 22, 23
20 Diarmid Campbell-Lendruma, Carlos Corvalána, and Maria Neiraa. “Global Climate Change: Implications for International Public Health Policy,” Bulletin of the World Health Organization 85 (2007).
21 Greg Guannel, Katie Arkema, Peter Ruggiero, Gregory Verutes, S. Temmersman, P. Meire, and TJ Bouma. “The Power of Three: Coral Reefs, Seagrasses and Mangroves Protect Coastal Regions and Increase Their Resilience,” ed. Carlo Nike Bianchi, Plos One 11, no. 7 (2016). https://doi.org/10.1371/journal.pone.0158094.
22 Erik J. Nelson, Peter Kareiva, Mary Ruckelshaus, Katie Arkema, Gary Geller, Evan Girvetz, Dave Goodrich, Virginia Matzek, Malin Pinsky, Walt Reid, Martin Saunders, Darius Semmens, Heather Tallis, and Evan Girvetz, “Climate Change’s Impact on Key Ecosystem Services and the Human Well-being They Support in the US,” Frontiers in Ecology and the Environment 11, no. 9 (2013): 483-893. https://doi.org/10.1890/120312.
23 Katie Arkema, Greg Guannel, Gregory Verutes, Spencer A. Wood, Anne Guerry, Mary Ruckelshaus, Peter Kareiva, Martin Lacayo, and Jessica M. Silver, “Coastal Habitats Shield People and Property from Sea Level Rise and Storms,” Nature Climate Change 3, no. 7 (2013): 1.
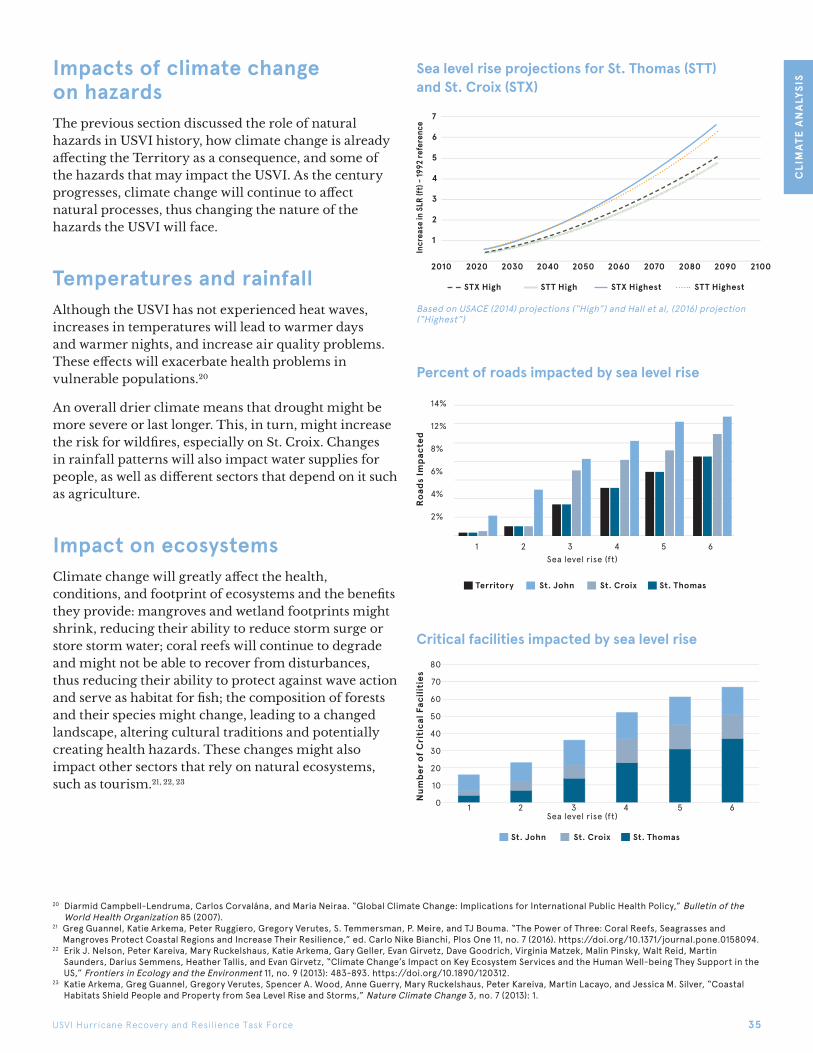
Sea level rise projections for St. Thomas (STT) and St. Croix (STX)
Percent of roads impacted by sea level rise
Critical facilities impacted by sea level rise
14%
12%
8%
6%
4%
2%
80
70
60
50
40
30
20
10
0
7
6
5
4
3
2
1
1
1 2 3 4 5 6
20202010 2100
2 3 4 5 6
Road
s Im
pact
edN
umbe
r of
Cri
tica
l Fac
iliti
esIn
crea
se in
SLR
(ft)
- 199
2 re
fere
nce
Territory
STX High STT High STX Highest STT Highest
St. ThomasSt. CroixSt. John
St. ThomasSt. CroixSt. John
2030 2040 2050 2060
Sea level rise (ft)
Sea level rise (ft)
2070 2080 2090
Based on USACE (2014) projections (“High”) and Hall et al, (2016) projection (“Highest”)
USVI Hurricane Recovery and Resilience Task Force 36
CLI
MAT
E AN
ALYS
IS
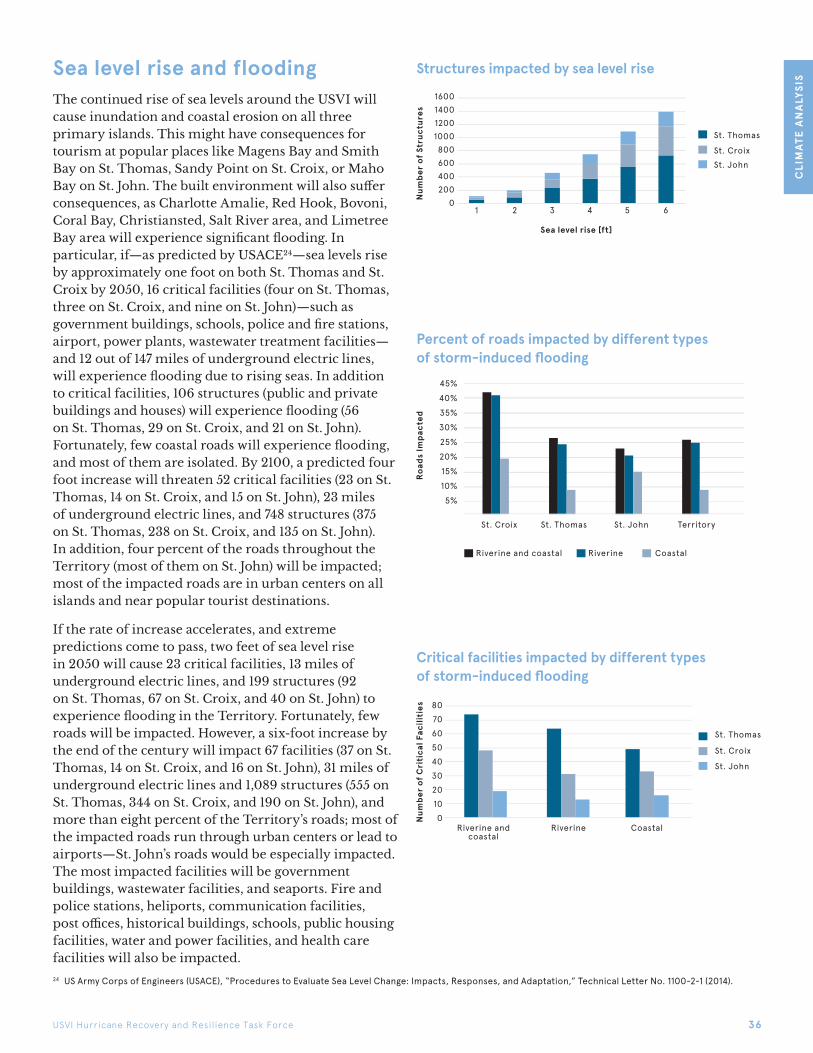
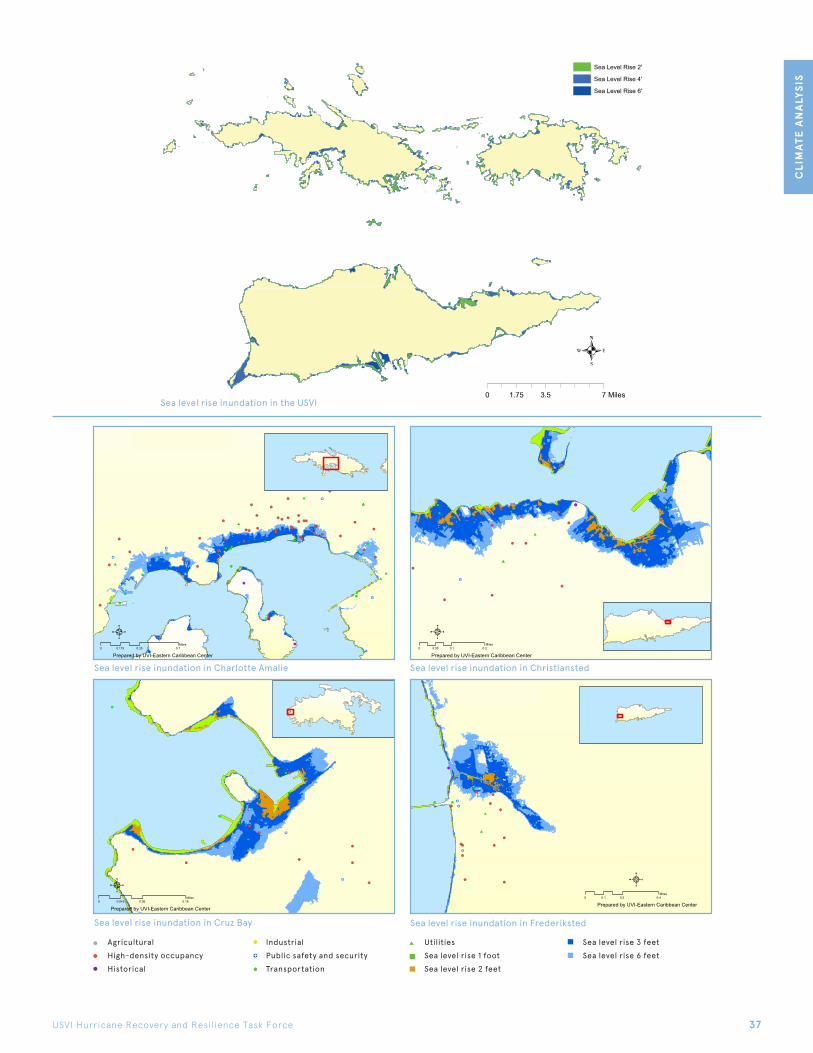
Sea level rise and floodingThe continued rise of sea levels around the USVI will cause inundation and coastal erosion on all three primary islands. This might have consequences for tourism at popular places like Magens Bay and Smith Bay on St. Thomas, Sandy Point on St. Croix, or Maho Bay on St. John. The built environment will also suffer consequences, as Charlotte Amalie, Red Hook, Bovoni, Coral Bay, Christiansted, Salt River area, and Limetree Bay area will experience significant flooding. In particular, if—as predicted by USACE24—sea levels rise by approximately one foot on both St. Thomas and St. Croix by 2050, 16 critical facilities (four on St. Thomas, three on St. Croix, and nine on St. John)—such as government buildings, schools, police and fire stations, airport, power plants, wastewater treatment facilities—and 12 out of 147 miles of underground electric lines, will experience flooding due to rising seas. In addition to critical facilities, 106 structures (public and private buildings and houses) will experience flooding (56 on St. Thomas, 29 on St. Croix, and 21 on St. John). Fortunately, few coastal roads will experience flooding, and most of them are isolated. By 2100, a predicted four foot increase will threaten 52 critical facilities (23 on St. Thomas, 14 on St. Croix, and 15 on St. John), 23 miles of underground electric lines, and 748 structures (375 on St. Thomas, 238 on St. Croix, and 135 on St. John). In addition, four percent of the roads throughout the Territory (most of them on St. John) will be impacted; most of the impacted roads are in urban centers on all islands and near popular tourist destinations.
If the rate of increase accelerates, and extreme predictions come to pass, two feet of sea level rise in 2050 will cause 23 critical facilities, 13 miles of underground electric lines, and 199 structures (92 on St. Thomas, 67 on St. Croix, and 40 on St. John) to experience flooding in the Territory. Fortunately, few roads will be impacted. However, a six-foot increase by the end of the century will impact 67 facilities (37 on St. Thomas, 14 on St. Croix, and 16 on St. John), 31 miles of underground electric lines and 1,089 structures (555 on St. Thomas, 344 on St. Croix, and 190 on St. John), and more than eight percent of the Territory’s roads; most of the impacted roads run through urban centers or lead to airports—St. John’s roads would be especially impacted. The most impacted facilities will be government buildings, wastewater facilities, and seaports. Fire and police stations, heliports, communication facilities, post offices, historical buildings, schools, public housing facilities, water and power facilities, and health care facilities will also be impacted.
24 US Army Corps of Engineers (USACE), “Procedures to Evaluate Sea Level Change: Impacts, Responses, and Adaptation,” Technical Letter No. 1100-2-1 (2014).
Percent of roads impacted by different types of storm-induced flooding
Road
s Im
pact
edN
umbe
r of
Cri
tica
l Fac
iliti
esN
umbe
r of
Str
uctu
res
Sea level rise [ft]
Riverine and coastal Riverine Coastal
St. Croix St. Thomas St. John
St. John
St. John
St. Croix
St. Croix
1 2 3 4 5 6
St. Thomas
St. Thomas
Territory
45%40%35%30%25%20%15%10%5%
1600140012001000800600400200
0
Structures impacted by sea level rise
Critical facilities impacted by different types of storm-induced flooding
Riverine and coastal
Riverine Coastal
80706050403020100
USVI Hurricane Recovery and Resilience Task Force 37
CLI
MAT
E AN
ALYS
IS
Sea level rise inundation in Charlotte Amalie Sea level rise inundation in Christiansted
Sea level rise inundation in FrederikstedSea level rise inundation in Cruz Bay
#*
#*
#*
!(
!(!(
!(
!(
!(
!C
#*
#*
!C!(
!(
!(
!(
!C
!(
!(
!(
$+$+
!(
!(!(
Prepared by UVI-Eastern Caribbean Center0 0.2 0.40.1
Miles
4
Sea Level Rise
Sea level rise inundation in the USVI
Sea Level Rise 2'
Sea Level Rise 4'
Sea Level Rise 6'
0 3.5 71.75 Miles
.
Agricultural High-density occupancyHistorical
IndustrialPublic safety and securityTransportation
UtilitiesSea level rise 1 footSea level rise 2 feet
Sea level rise 3 feetSea level rise 6 feet
#*#*
#*
!(
!(
!(!(
#*
#*
!C
!(
!(
!(
!(
!(
!C
!(
!(
$+$+
$+
!(
!(
!(
!(
!(
!(
$+
Prepared by UVI-Eastern Caribbean Center0 0.1 0.20.05
Miles
4
Sea Level Rise
#*
#*
#*
#*
#*
#*
#*
#*
#*
#*
#*
#*
#*
!C
!C
!(
!(!(
!(!(
!(
!(
!(
!(
!(
!(
!(
!(
!(
!(
!(
!(
!C
!C
#*#*
#*
!C
!C
!C
!C!C
!C
!(!(
!(
!(
!(
!(
!(
!(
!(!(
!(!C
!C
!(
!(
!(
!(
!(
!(
!(!(
!(
!(!(!(
!(
!(
!(
!(
$+
$+
$+
$+
$+
$+
$+
$+
$+
$+
$+ $+
$+
#*
#*
#*#*
!(
!(
!(
!(
!(
!(
!(
!(!(
!C
#*
$+
$+
$+
Prepared by UVI-Eastern Caribbean Center0 0.35 0.70.175
Miles
4
Sea Level Rise
!C
!(!(
!(
!(
!C
#*
#*
!C
!(
!(
!(
!C
!(
!(
$+
$+
$+
$+
$+
$+
!(
!(
!(
#*
#*
$+
Prepared by UVI-Eastern Caribbean Center0 0.09 0.180.045
Miles
4
Sea Level Rise
USVI Hurricane Recovery and Resilience Task Force 38
CLI
MAT
E AN
ALYS
IS
In addition to impacts on tourist attractions and the built environment, sea level rise might cause potential problems for drainage as outfalls could become submerged. And, as mentioned previously, the rise in sea level will also likely increase the inland extent of inundation of other coastal hazards, such as storm surge, swell-induced inundation, or even tsunami inundation.
Hurricanes and rain stormsEven though the exact imprints of climate change are difficult to detect in the past hurricane season(s), NOAA predicts that hurricanes are likely to become more damaging by the end of the century: hurricane-related rainfall rates will increase, leading to more riverine flooding conditions; and it is likely that hurricanes will become more intense albeit not necessarily more frequent. In other words, the USVI might not experience more frequent hurricanes, but those that do hit the Territory are expected to be more destructive: winds will be stronger, storm surges will be higher, and rainfall rates will intensify and lead to more severe and longer-lasting flooding. If the strength of hurricanes and Atlantic storms is likely to intensify, it is likely that the power of swells will also increase, which will lead to more erosion and flooding.
This potential increase in storm intensity, and accompanying flooding, will cause significant impacts on critical infrastructure and structures in the USVI. Under current conditions, 141 critical facilities and 48 out of 147 miles of underground electric lines are located in flood zones. Aside from the docks and port facilities, the most impacted facilities are wastewater treatment plants and supporting infrastructure, government buildings, and schools. Of the critical infrastructure impacted, 113 structures (64 on St. Thomas, 33 on St. Croix, and 16 on St. John) and 46 miles of underground electric lines are vulnerable to riverine flooding (caused by storms rain), and 98 structures (49 on St. Thomas, 33 on St. Croix, and 16 on St. John) and 33 miles of underground electric lines are vulnerable to coastal flooding (storm surge and swells). Similarly, 6,999 structures are located in flood zones (4,178 on St. Croix, 2,534 on St. Thomas, and 287 on St. John), 6,696 of which are vulnerable to riverine flooding (4,018 on St. Croix, 2,447 on St. Thomas, and 231 on St. John), and 2,188 are vulnerable to coastal flooding (1,142 on St. Croix, 800 on St. Thomas, and 246 on
St. John). Finally, storms can inundate a significant amount of roads, complicating rescue operations and evacuations. Most of these roads are located in urban centers and often lead to critical facilities, such as the landfills on St. Thomas and St. Croix. The majority of the vulnerable roads are on St. Croix, where nearly 40 percent are prone to riverine flooding and 20 percent to coastal flooding. On St. Thomas and St. John, around 25 percent of the roads are vulnerable to riverine flooding and less than 15 percent to coastal flooding. These numbers demonstrate the need for robust drainage infrastructure in the Territory (discussed in the Transportation chapter).
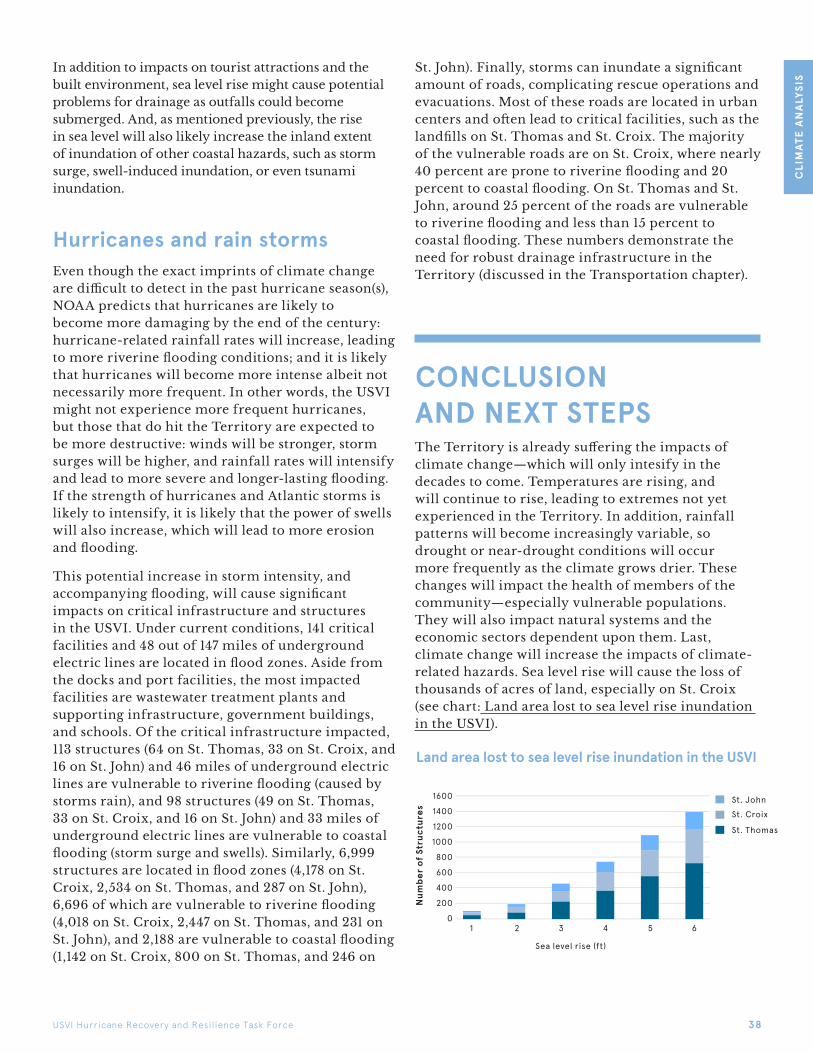
CONCLUSION AND NEXT STEPSThe Territory is already suffering the impacts of climate change—which will only intesify in the decades to come. Temperatures are rising, and will continue to rise, leading to extremes not yet experienced in the Territory. In addition, rainfall patterns will become increasingly variable, so drought or near-drought conditions will occur more frequently as the climate grows drier. These changes will impact the health of members of the community—especially vulnerable populations. They will also impact natural systems and the economic sectors dependent upon them. Last, climate change will increase the impacts of climate-related hazards. Sea level rise will cause the loss of thousands of acres of land, especially on St. Croix (see chart: Land area lost to sea level rise inundation in the USVI).
Land area lost to sea level rise inundation in the USVI
1600
1400
1200
1000
800
600
400
200
0
Num
ber
of S
truc
ture
s
Sea level rise (ft)
1 2 3 4 5 6
St. CroixSt. John
St. Thomas
USVI Hurricane Recovery and Resilience Task Force 39
CLI
MAT
E AN
ALYS
IS
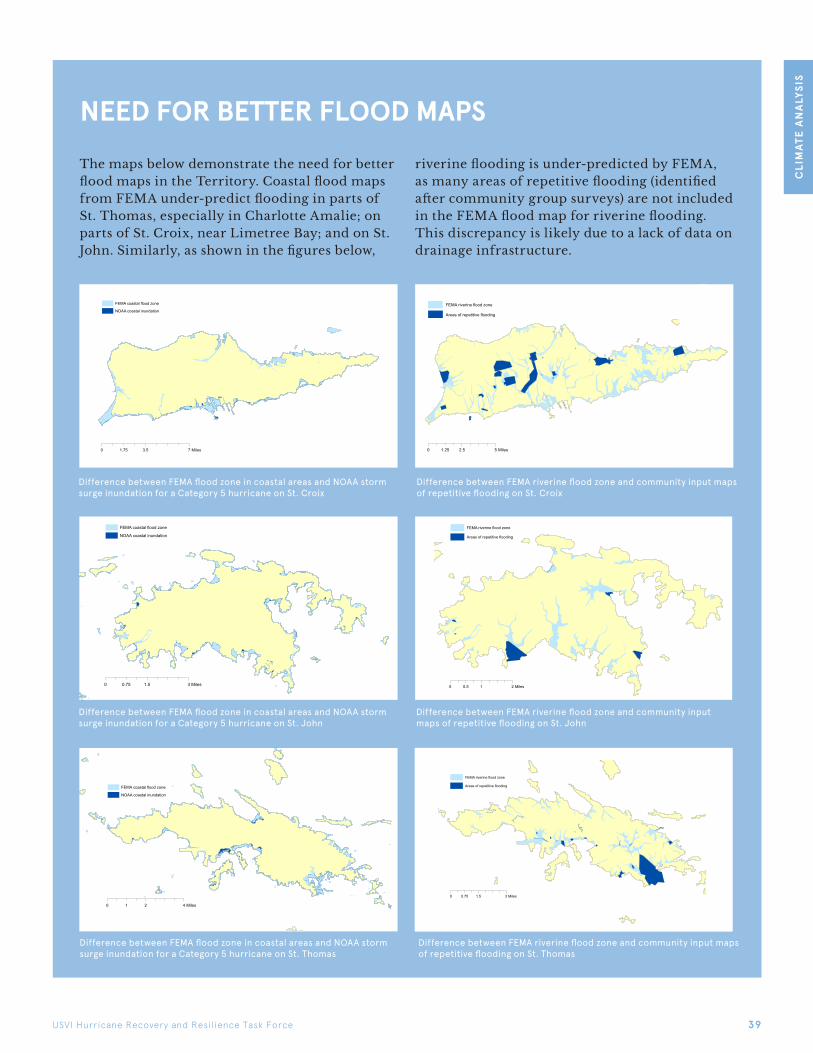
NEED FOR BETTER FLOOD MAPSThe maps below demonstrate the need for better flood maps in the Territory. Coastal flood maps from FEMA under-predict flooding in parts of St. Thomas, especially in Charlotte Amalie; on parts of St. Croix, near Limetree Bay; and on St. John. Similarly, as shown in the figures below,
riverine flooding is under-predicted by FEMA, as many areas of repetitive flooding (identified after community group surveys) are not included in the FEMA flood map for riverine flooding. This discrepancy is likely due to a lack of data on drainage infrastructure.
Difference between FEMA riverine flood zone and community input maps of repetitive flooding on St. Croix
Difference between FEMA flood zone in coastal areas and NOAA storm surge inundation for a Category 5 hurricane on St. Croix
FEMA coastal flood zone
NOAA coastal inundation
0 3.5 71.75 Miles
FEMA riverine flood zone
Areas of repetitive flooding
0 2.5 51.25 Miles
Difference between FEMA riverine flood zone and community input maps of repetitive flooding on St. Thomas
Difference between FEMA flood zone in coastal areas and NOAA storm surge inundation for a Category 5 hurricane on St. Thomas
FEMA coastal flood zone
NOAA coastal inundation
0 2 41 Miles
FEMA riverine flood zone
Areas of repetitive flooding
0 1.5 30.75 Miles
Difference between FEMA riverine flood zone and community input maps of repetitive flooding on St. John
FEMA riverine flood zone
Areas of repetitive flooding
0 1 20.5 Miles
Difference between FEMA flood zone in coastal areas and NOAA storm surge inundation for a Category 5 hurricane on St. John
FEMA coastal flood zone
NOAA coastal inundation
0 1.5 30.75 Miles

USVI Hurricane Recovery and Resilience Task Force 40
CLI
MAT
E AN
ALYS
IS
Sea level rise will also cause many structures—including critical facilities and buried electric lines—to flood, most of them on St. Thomas. At the same time, it is likely hurricanes will become wetter and stronger, causing widespread riverine and coastal flooding. This will put many critical facilities, including buried electric lines and structures at risk, since so many are already in flood zones.
Despite this bleak outlook on the future, the Governor’s Office will work to address and mitigate as much as possible some of the impacts of climate change. First, in order to prevent the worst impacts of climate change, the Governor’s Office will work with its agencies and the University of the Virgin Islands (UVI) to help educate the general population, agency staff, and members of the various economic sectors about the impacts of climate change and associated hazards on the Territory, and on best practices to adopt in order to counter the impacts of climate change. Importantly, the Governor’s Office will work with UVI to continue, update, improve, and/or augment the collection and curation of climate data in the Territory, starting with temperature, rainfall, and groundwater measurements. The Governor’s
Office will also work with UVI to cater to its science, data gathering, and data management needs. Special attention will be paid to the regular update of climate projections, as more data and more sophisticated models will improve the quality of future predictions. These efforts will create better flood maps for variations in rainfall intensity—storms and sea level rise scenarios—especially in urban areas.
The Governor’s Office will also work with USVI agencies and UVI on the creation, continual update and maintenance of asset management tools to better track the conditions, repairs, and upgrades made or needed for critical infrastructure, including for building and drainage infrastructure. The Governor’s Office will also work with territorial agencies and UVI to monitor the impact of climate change on ecosystems. This work will help scientists better understand how natural systems respond to various climate stressors and help predict their impact on natural resources, as well as the consequent economic (fisheries, agriculture, etc.) and cultural (Agriculture Fair, Mango Melee, etc.) impacts on the people of the USVI.