Embed Size (px)
DESCRIPTION
climate
Citation preview
Climate 2014, 2, 28-46; doi:10.3390/cli2020028
climate ISSN 2225-1154
www.mdpi.com/journal/climate
Article
Spatial and Temporal Variability of Rainfall over the
South-West Coast of Bangladesh
Md. Sarwar Hossain 1,*, Kushal Roy
2 and Dilip Kumar Datta
2
1 Department of Geography and Environment, University of Southampton, SO17 1BJ, UK
2 Environmental Science Discipline, School of Life Science, Khulna University, Khulna 9208,
Bangladesh: E-Mails: [email protected] (K.R.); [email protected] (D.K.D.)
* Author to whom correspondence should be addressed; E-Mails: [email protected] or
Received: 6 January 2014; in revised form: 27 February 2014 / Accepted: 26 March 2014 /
Published: 22 April 2014
Abstract: This study examined the spatial and temporal rainfall variability from the 1940s
to 2007 in the south west coastal region of Bangladesh. Time series statistical tests were
applied to examine the spatial and temporal trends in three time segments (1948–1970,
1971–1990 and 1991–2007) and four seasons (Pre-monsoon; Monsoon; Post-Monsoon and
Winter), during the period 1948–2007. Eight weather stations were divided into two zones:
exposed (exposed to sea) and interior (distant to sea). Overall, rainfall increased during the
period 1948–2007, while the trends intensified during post-1990s. Post-monsoon and
winter rainfall was observed to follow significant positive trends at most weather stations
during the time period 1948–2007. The rate of change was found in exposed zone and
interior zone are +12.51 and +4.86 mm/year, respectively, over post monsoon and +0.9 and
+1.86 mm/year, respectively, over winter. These trends intensified both in the exposed
zone (+45.81 mm/year) and the interior zone (+27.09 mm/year) 1990 onwards. Winter
rainfall does not exhibit significant change (p > 0.1) over the exterior or interior zone,
though individual stations like Jessore, Satkhira and Bhola show significant negative trends
after 1990s. Although the trends were observed to weaken in the monsoon and
pre-monsoon seasons, they are not significant. Moreover, an 11-year cyclicity was found
within these two seasons, whilst no cyclicity was observed in the post-monsoon and winter
seasons. Sequential Mann Kendal test reveals that the changes in two zones rainfall trends
are started around mid-80s, where step change found only for fours season in Khulna
stations and also for winter seasons in all weather stations. These changes may
have a detrimental effect on rain-fed agriculture in Bangladesh. The application of
OPEN ACCESS
Climate 2014, 2 29
palaeo-environmental techniques, threshold determination and rainfall analysis across the
whole country could be useful to support adaptation planning of the rain-fed agro-economy
in Bangladesh.
Keywords: rainfall trends; step change; rain-fed agriculture
1. Introduction
The rainfall dominated climate of Bangladesh receives the heaviest rainfall in the world [1] and
differs from other tropical regions because of the strong influence of the Indian Ocean and the
Himalayas. High temperatures, heavy rainfall and seasonal variation are the unique characteristics that
distinguish the climate of Bangladesh from that of other tropical regions. However, the locations of
rainfall origination including the characteristics remain unclear in different rainy periods [2]. The
Bangladeshi climate is comprised of four seasons: pre-monsoon (March–May), monsoon
(June–August), post-monsoon (September–November) and winter (December–February). The
pre-monsoon, monsoon and post-monsoon seasons are basically the rainy seasons [3]. Monsoon
rainfall accounts for approximately 85% of the total rainfall while occurrences of wet days are rare in
the dry season. This monsoon rainfall is caused by monsoon depressions in the Bay of Bengal [4]. This
makes Bangladesh a highly humid zone with a mean annual rainfall of 2488 mm. The pre-monsoon
period is characterized by warm temperatures (27 °C on average) and the occurrence of thunderstorms
with rainfall ranging from 15 mm/year in the western central region to more than 80 mm/year in the
northeast region. This pre-monsoonal rainfall and thunderstorms are dominated by the moist air from
the Bay of Bengal. The effect of the Bay of Bengal coupled with that of the Himalayas creates
extremely high rainfall levels during the monsoon season [5–7]. Annual rainfall varies significantly
throughout the country with a range of 1270–5000 mm. Shahid and Khairulmain [8] showed that
inter-annual rainfall is highly variable (coefficient of variation 16–24 %) across the entire country,
which they classified into 6 zones based on rainfall variability. High rainfall variability together with
low rainfall in the northern part made it “drought prone”, whereas the south western coastal region is a
comparatively “humid area” with low variability and high rainfall.
Rainfall is one of the substantial weather indicators of climate change [9]. Rising temperatures
across the globe likely result in changes in precipitation and atmospheric moisture through a more
active hydrological cycle, leading to increases in water holding capacity throughout the atmosphere at
a rate of about 7% per °C [10]. Climate change is acting as a trigger for changing rainfall patterns
which can have significant impacts on the sowing and harvesting times of crops [5,11]. The main rice
varsities such as Aus and Aman are sown and harvested between the pre-monsoon and post-monsoon
periods, which account for more than 95% of total annual rainfall. Although the harvesting and sowing
periods of the crops vary spatially depending on the agro-climatic conditions of the area [5], the
farming system is strongly dependent on the timely arrival of monsoon rain and its distribution [12].
Rising temperatures in combination with rainfall anomalies due to climate change strongly
influence soil moisture. This may have a negative impact on the major crops of the country by
inducing drought [13]. Recently, in 2010, low rainfall (30% below average levels) during the monsoon

Climate 2014, 2 30
and excessive rainfall in the post-monsoon caused extensive damage in the agricultural sector. The
lack of rainfall created agricultural drought in the country while excessive rainfall at the beginning of
the post-monsoon period provoked flash floods. In 2007, more than 9 million people were affected by
severe flooding caused by heavy rainfall [14]. Rice and wheat production decreased by approximately
3.5 × 10⁶ metric tonnes because of low rainfall during the 1994–2005 period [4]. Traditional crop
cultivation methods changed and production costs increased because of increased temperatures and
rainfall changes during the harvesting and sowing periods of crops. These changes in climate are
leading to crop failure and greater demands for capital (labor, money, fertilizer, etc.) to produce food
for the large population in some coastal areas of the country [15].
Therefore, knowledge of the spatial and temporal variability of rainfall patterns are crucial in
adaptation planning for Bangladesh, as rain-fed agriculture not only accounts for around 23% of the
Gross Domestic Product (GDP) but also constitutes 68% of the total employment of Bangladesh [3,16].
A deeper understanding of the characteristics and distribution of rainfall patterns will support water
management, agricultural development and disaster management and planning in Bangladesh in the
context of global climate change [4,17,18].
Numerous efforts (e.g., [12,17,18]) have been undertaken to investigate the characteristics of
rainfall patterns in Bangladesh. These studies have largely focused on either monsoon or pre-monsoon
rainfall characteristics and trends. Spatial and temporal rainfall patterns have also been analyzed by
other [1,8,19–21]. There studies concentrated on specific locations and few of them like Shahid and
Khairulmaini [8] concentrated on the rainfall variability of the country from 1969–2003.
Shahid [6] focused on the dry and wet periods of Bangladesh over the period 1958–2007 and the
climatic characteristics of rainfall were analyzed by Islam and Uyeda [20]. However, the remainder of
the studies [3,20,22] focused on the projection of rainfall in Bangladesh. No study has thus far been
conducted to evaluate the spatial and temporal rainfall variability in the south-west coastal area, which
is the most vulnerable area of Bangladesh due to climate change, and where the Bangladesh
Government is planning and implementing climate change adaptation strategies. Moreover, previous
studies in Bangladesh have not analyzed any change point, or investigated the sequential trends to
identify the starting point in rainfall trajectories. A more in-depth knowledge of the rainfall variability
focusing on the seasonal, decadal and spatial aspects in this south-west area is essential for effective
regional (e.g., [23]) and national climate change adaptation planning. Therefore, the objective of this
study is to analyze the temporal and spatial variability of seasonal and annual rainfall trends over the
south-west coast of Bangladesh from 1947 to 2007 through answering the following research questions:
Is the seasonal rainfall trends decreasing or increasing?
Is there any variability within the different time segments of seasonal rainfall?
Is there any spatial variability of rainfall over the southwest coast of Bangladesh?
Is there any cyclicity in the trajectories of rainfall?
Is there any change point in the rainfall trajectories?
What are the implications of rainfall variability in adaptation to climatic variability?
The objective of this study has been achieved by analyzing time series data from eight weather
stations (1947–2007) using statistical tests including the homogeneity test, Sen’s slope estimation,
linear regression, the Mann-Kendal test and autocorrelation. Annual, decadal and seasonal rainfall
Climate 2014, 2 31
trends are evaluated to understand their spatial and temporal variability. Moreover, the sequential
Mann Kendal test is applied to identify the starting point of trends, and also change point has been
analyzed using the Lepage test.
1.1. Study Area
South west coastal Bangladesh has been selected for this study. This area accounts around 10% of
the national population and around 16% total land area, which is about 25,000 km2. Beside the
demographic characteristics, environmental settings are one the major reasons in selecting this area,
within which are:
This area acts as a passage to pass one of the major river systems in the world:
Ganges-Bhrahmputra-Meghna, where rainfall plays an important role [20]. This river flow and
rainfall plays important role in maintaining the fresh water and sea water mixing which
underpin to mangrove forest growth.
World largest mangrove forest Sundarban located in this area, where people are mostly
dependent on agriculture, fishery and resources extraction from mangrove forest.
This area is highly vulnerable to storm surges and river flooding [24] and most importantly,
this area is one of the most vulnerable regions to global climate change.
Moreover, regional problem like salinity usually increases in absence of rainfall events and
river flow, which also influences by rainfall runoff.
Therefore, concerning the regional level adaptations planning to environmental changes, we select
this area for this study, which can further be extend for the whole country.
1.2. Dataset Arrangement
Long-term daily rainfall records (1948–2007) from 8 meteorological stations were collected from
the Bangladesh Meteorological Department (BMD). Each station represents one district (mid-level
administrative unit in Bangladesh), covering 8 Districts of the south-west coastal region of Bangladesh.
According to the definition of coastal region delineated by the Integrated Coastal Zone Management
Programme (ICZMP) initiated by the Government of Bangladesh, three fall within the exterior coastal
zone (exposed to the sea) and the remaining five lie within the interior coastal zone (distant from the
sea) [25]. The ICZMP [25] of Bangladesh defines the exposed zone as that which has an intense
relationship with the marine environment and is characterized by a high risk of cyclone, tidal
movement and salinity. The exposed zone is defined as a humid zone as it receives an annual rainfall
of 2000–3000 mm whereas the interior zone (moist sub-humid) receives 1500–1900 mm of rainfall
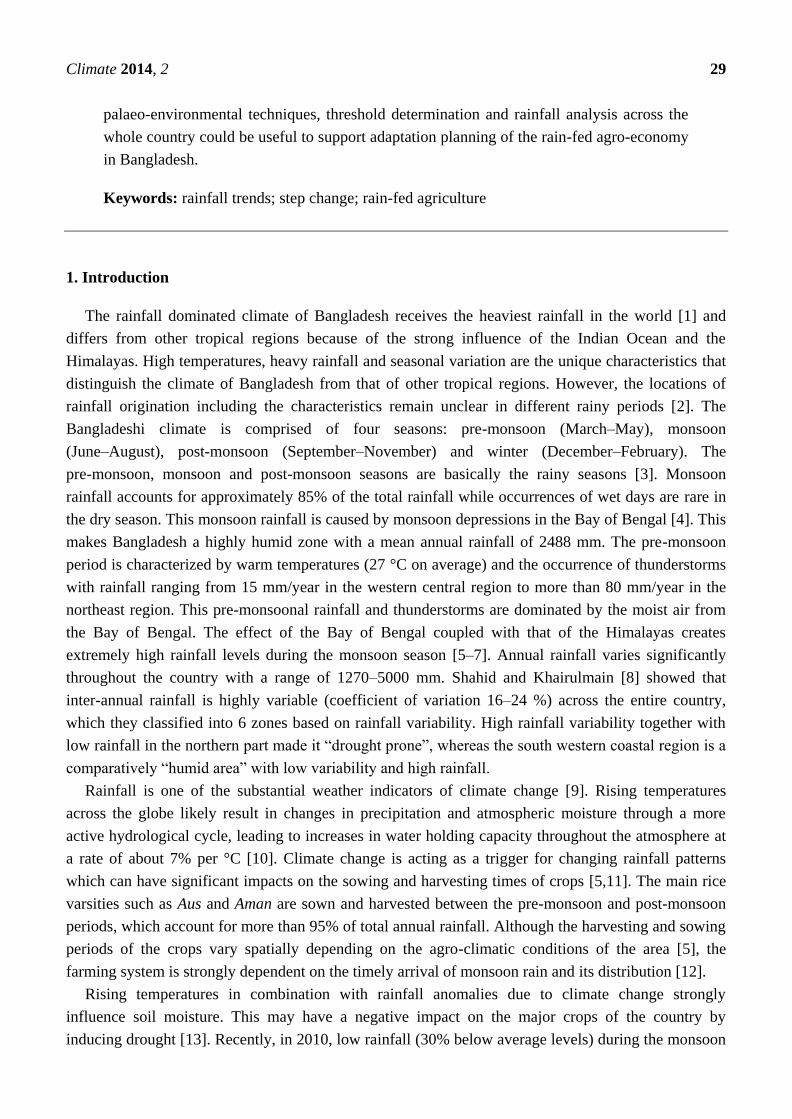
annually [8]. More details regarding the methodology of this classification and Figure 1 can be found
in the 2003 ICZMP report. The locations of the meteorological stations and the characteristics of the
rainfall weather stations are shown in Figure 1 and Table 1 respectively.
Climate 2014, 2 32
Figure 1. Weather Stations in the south-west coastal Bangladesh.
Table 1. Characteristics of the rainfall datasets used in this study.
Station Lat./Long. Altitude (m) Group Period of Record Record Length
Barishal 22.70N 90.36E 4 ICZ 1948–2007 60 years
Khulna 22.80N 89.58E 4 ICZ 1948–2007 60 years
Faridpur 23.61N 89.84E 9 NCZ 1948–2007 60 years
Jessore 23.17N 89.22E 7 ICZ 1948–2007 60 years
Satkhira 22.68N 89.07E 6 ICZ 1948–2007 60 years
Bhola 22.70N 90.66E 5 ECZ 1973–2007 35 years
Patuakhali 22.36N 90.34E 3 ECZ 1973–2007 35 years
Khepupara 21.98N 90.22E 3 ECZ 1973–2007 35 years
Note: IC: Interior Coastal Zone; ECZ: Exterior Coastal Zone; NICZ: Non-Coastal Zone
(included within the interior zone).
Monthly mean rainfall was calculated from the daily rainfall data. The rate of missing data was less
than 1%. The dataset of the interior coastal zone was more complete than that of the exterior coastal
zone. If the data for any day of a year is missing for a particular station, a simple average method was
applied. Table 1 illustrates the characteristics of the dataset used for this study.
The rainfall records, however, cover a much more extensive period (1948–2007) in the
meteorological stations of interior coastal zone than in those of the exterior zone (1973–2007), due to
their date of establishment. The yearly time scale was classified into four seasons: monsoon
(June–July–August: hereafter written as JJA), post-monsoon (September–October–November: SON),
winter (December–January–February: DJF) and pre-monsoon (March–April–May: MAM) (adapted
from [20,23,26]). Seasonal and zonal trends are considered in this study in order to increase the
validity and reliability of the analysis, as the annual rainfall pattern varies significantly across the four
seasons of Bangladesh [5].
For the analysis and observation of trends, the datasets were divided into three time segments:

Climate 2014, 2 33
1947–1970, 1971–1990 and 1991–2007 for the interior zone and 1973–1990 and 1991–2007 for the
exposed zone. The classification of the time segments was conceptualized according to the IPCC [27],
as it has been reported that climate warming was observed principally after the 1990s, where 1998 was
the warmest year on record. Annual rainfall in Bangladesh decreased from 1971 to 1980 and increased
over the 1981–1990 period [20]. However, Ahsan et al., 2010 [12] showed that the decades from 1991
to 2010 were very dry compared to those between 1961 and 1990. Moreover, similar patterns were
observed in previous research which examined annual rainfall trends [6]. This country-level result also
coincides with regional-level trends such as those in the south-west coastal area of Bangladesh, where
annual rainfall increased by around 6% in the period 1991–2002 compared to 1954–1990 [22]. Hossain
and Roy [19], and Hossain [28] also used a similar classification to observe the rainfall and
temperature trends in their studies. Furthermore, community perceived knowledge reported changing
rainfall patterns mostly after 1990 [15,29]. Therefore, we classified the time scale into three time
segments to observe the trends in different time segments.
Before statistical analysis of the dataset was carried out, a homogeneity test was performed on the
seasonally averaged dataset grouped according to interior and exterior coastal zone to detect any
non-homogeneity. In this study, both Levene’s Test (1960) and Brown and Forsythe’s Test (1974)
were applied to detect any non-homogeneity among the time series dataset. Results reveal that
significant non-homogeneity exists in the seasonal time series data
2. Methodology
We applied number of time series statistics both parametric and non-parametric to analyze the
temporal and spatial rainfall variability. The non-parametric Mann–Kendall trend test was applied to
detect trends in the time series data. The Mann-Kendall test was formulated by Mann (1945) [30] as a
non-parametric test for trend detection and the test statistic distribution was explained by
Kendall (1975) [31] for testing non-linear trends and turning points. The test assumes a monotonic
trend and thus rejects the presence of any seasonal or other cycles in the data. The Mann-Kendall test
is preferred when various stations are tested in a single study [32]. In the present study, confidence
levels of 99%, 95% and 90% signify the positive or negative trends determined by the test statistic. At
the 99% significance level, the null hypothesis of no trend is rejected if |Z| > 2.575; at the 95%
significance level, the null hypothesis of no trend is rejected if |Z| > 1.96; and at the 90% significance
level, the null hypothesis of no trend is rejected if |Z| > 1.645. More details of the Mann-Kendall test
and its statistical ability are documented in Yue et al. [33].
Moreover, sequential Mann Kendal test using 20 years of moving window was applied to
investigate how the trend sequentially changes over the time particularly the identification of the
starting point of trend. We also used 30 years of moving window to see whether the selection of the
moving window influences the result of the test, and we found (Figure 2) similar trends while using
20 years and 30 years of moving window. This sequential Mann Kendal test has already been applied
by other studies [34]. Though this method identifies the starting point of regional trends, we also have
used Lepage test [35] to identify change point (i.e., step change) in both station wise and region wise
rainfall data. The nonparametric Lepage test is a two sample test for location and dispersion assumes
that the studied series size is equal to or greater than ten and this test follows the Chi-squares (χ2)

Climate 2014, 2 34
distribution with two degrees of freedom. The Lepage test has been used to detect change point or step
wise change for rainfall [36], and climate change [26,37].
Figure 2. Sequential Mann Kendal test results for 20 years and 30 years moving window.
Another non-parametric test known as Sen’s slope estimator [38] was used to determine the
magnitude of change in the rainfall records while the Mann-Kendall test reveals the direction of
change or trend. Sen’s method is used to find the true slope of an existing trend, if there is any. The
present study computes the confidence interval for the true slope at both the 95% and 99% confidence
levels. All of the methods used are discussed below. To estimate the true slope of an existing trend,
Sen's non-parametric method is used. Sen’s method can be used in cases where the trend can be
assumed to be linear. The present study computes the confidence interval at two different confidence
levels: p = 0.01 and p = 0.05, resulting in two different confidence intervals. The details of the
procedure can be found in [39].
The autocorrelation test is useful in identifying cyclicity or seasonality in time series data.
Any positive or negative autocorrelation in the time series data put a large effect on trend detection
(e.g., [40–42]). When a positive autocorrelation is present in the series, there is the possibility of an
upward trend, although this is not always the case. In this study, the autocorrelation test was performed
on the seasonally averaged time series data to detect any cyclicity. As the threshold level of
significance, the 95% confidence limit was used. The Mann-Kendall test is based on the null
hypothesis that the time series data are independent and randomly ordered, i.e., there is no seasonality
or cyclicity (serial correlation) among the observations [43]. While the Mann-Kendall tests were
performed on the seasonal time series data in this study, an autocorrelation test was performed to
identify any cyclicity in the dataset. In this study, the confidence level of 95% is used as the
significance level.
Along with the non-parametric tests—the Mann-Kendall test and Sen’s slope estimator—a linear
regression method was also applied for detecting and analyzing the trends in the time series. The main

Climate 2014, 2 35
statistical parameter, the slope, resulting from the regression analysis indicates the mean temporal
change of rainfall. The rate of change, either positive or negative, was calculated as mm/day. In this
study, the trends were considered to be statistically significant using the threshold levels p < 0.1,
p < 0.05 and p < 0.01.
Rainfall is a very dynamic component of weather and varies significantly over spatial and temporal
scales, even across a small region. Therefore, we plotted annual and other four seasonal Mann Kendal
test statistics results (Z value) for the two time scale: 1948–2007 and 1991–2007, to show the spatial
variability of rainfall over the regions. The last time segment (1991–2007) is plotted to compare the
overall trends with the recent trends. Moreover, though, the rainfall graphs and results in the tables are
presented in mm/day/year unit as our raw data unit is mm/day, we have used mm/year unit to show the
magnitude and to explain the results. The detailed results obtained from time series analysis
(Mann Kendal test, Sen slop, Linear regression and Lepage test) as well the graph plotted using raw
data are presented in the supplementary file.
3. Results
3.1. Rainfall Time Series Characteristics
The results reveal that mean annual rainfall is higher in the exterior zone 4854 ± 750 mm than the
interior zone (3526 ± 591) mm. There was no marked difference in variance between the two time
series. The mean average seasonal rainfall of the periods of record was also found to be higher in the
exterior coastal zone than the interior zone. While the exterior zone has seasonal averages of
pre-monsoon, monsoon, post-monsoon and winter rainfall as 838 ± 279, 2575 ± 455, 1265 ± 485 and
109 ± 70 mm respectively, the interior zone’s average values were found to be 677 ± 228, 1826 ± 339,
882 ± 283 and 100 ± 72 mm respectively.
The linear trends of daily rainfall changes in the south-west are shown in Table 2. Results show that
during the post-monsoon both the interior and exterior coasts exhibit positive linear trends within the
95% confidence limit. The rate of change in the exterior zone is quite high (+17.28 mm/year). Rainfall
trends during the winter period in the interior zone are also increasing (+1.44 mm/year), even within
the 99% confidence limit, in contrast, exterior zone winter rainfall shows non-significant decreasing trend.
Table 2. Linear regression trends (b) of seasonal rainfall changes over the south-western
coastal region of Bangladesh.
Zone
(Period of Record) Pre-Monsoon Monsoon
Rate of Change b (mm/day/year)
Post-Monsoon Winter Annual
Interior (1948–2007) +0.023 −0.005 +0.049 ** +0.016 *** +0.021 *
Exterior (1973–2007) −0.066 +0.113 +0.192 ** +0.008 +0.062 *
Note: * significant at the 90% confidence level; ** significant at the 95% confidence level; *** significant at
the 99% confidence level.
3.2. Trends in Annual Rainfall
Annual rainfall trends over the southwest coastal region of Bangladesh and their magnitudes were
obtained using the Mann-Kendall test, Sen’s slope estimator and linear regression analysis (See
Climate 2014, 2 36
Table S1). The annual trends resulting from the three tests showed similar trends. Predominantly
positive trends were found over the southwest region with the exception of 2 stations, Faridpur and
Khepupara, although the trends found in these two stations were not significant. In half of the stations
studied (4 out of 8), annual rainfall trends were positive and statistically significant. Both the exterior
and interior zones showed positive trends, which were statistically significant at the 90% confidence
level. The Mann-Kendall test, however, confirms that only trends in the interior zone were significant
at p < 0.1 while Sen’s slope estimator calculates the rate of change as 8.39 mm/year.
In the interior coastal zone, trends at the Khulna, Jessore and Satkhira stations were positive and
significant following regression analysis, although the Mann-Kendall test confirms the significant
positive trend for Khulna and Stakhira stations only. The rate of change of rainfall is higher in Khulna
(+19.71 mm/year by Sen’s estimate) than the other 4 stations of the interior coastal zone, and only
Faridpur showed a negative trend, which is very low (−2.55 mm/year by Sen’s estimate) and
insignificant (p > 0.1). The meteorological stations in the exterior zone also revealed similar trends, as
Patuakhali and Khepupara showed a positive trend while Bhola showed a negative trend. However, the
annual rainfall trend was found to be very high at Khepupara (+78.84 mm/year by Sen’s estimate) and
statistically significant at the 99% confidence level. The Mann-Kendall test for the station also
revealed a high positive trend at p < 0.01.
3.3. Trends of Seasonal Rainfall
The results of the Mann-Kendall test and Sen’s slope estimator for the seasonal trends are given in
Table S2. As shown, significant or not, most of the values were positive. Both the exterior and interior
coastal zones showed significant positive trends in the post-monsoon period, of which the exterior
zone exhibited a very high rate of change in seasonal rainfall (+12.64 mm/year). The winter rainfall in
the interior coast also showed a positive trend at p < 0.01 where the rate of change was +1.26 mm/year.
Station-specific seasonal trends suggest monsoon rainfall experiences no significant changes at the
majority of the stations except Khepupara. In fact, the rate of change in monsoon,
post-monsoon and winter rainfall is particularly high at Khepupara, with a statistically significant trend.
The rates of rainfall change at Khepupara in the monsoon, post-monsoon and winter are +27.42,
+26.30 and +1.8 mm/year respectively.
Winter rainfall was found to be increasing at the majority of stations, with statistically significant
trends. Trends of post-monsoon rainfall were almost similar to those of winter rainfall, although out of
8 stations only 3 showed significant changes. Patuakhali and Khepupara, 2 stations from the exterior
coast, exhibited high rates of increase in rainfall, +12.74 and +26.30 mm/year, respectively. Khulna
showed the most significant (p < 0.001) rate of increase in seasonal rainfall (+16.29 mm/year).
Although post-monsoon rainfall trends were found to be significant for only 3 out of 8 stations, these
trends are positive (Mann-Kendal test) and increasing (Sen’s slope estimation) across the regions.
Rainfall in the pre-monsoon season does not reveal any significant trend either in the exterior or
interior zone. The most significant trend in the interior zone was found at Satkhira station, which is
positive and increasing at a rate of 4.14 mm/year. Barishal station also showed a positive trend within
the 90% confidence limit. The only significant negative trend among all stations and all seasons was
found in the pre-monsoon period at Bhola station. The rate was also quite high (−15.46 mm/year).
Climate 2014, 2 37
3.4. Temporal Variation of Annual Trends
The rainfall data period of record 1948–2007 (60 years) is divided into 3 sub-sets for temporal
analysis: 1948–1970 (23 years), 1971–1990 (20 years) and 1991–2007 (18 years). The statistics reveal
that, despite not showing a significant trend over the full period of record (1973–2007), the annual
rainfall rate accelerated in the period 1991–2007 (Z = +1.85, p < 0.1) with quite a high rate of
151.48 mm/year in the exterior zone. The interior zone, in contrast, despite showing a significant
positive trend over the full period of record (1948–2007), did not show any significant trends in the 3
sub-sets. Khulna and Khepupara are the two stations where higher significant trends (in this case both
are positive) were present over the full record length, for Khulna 1948-2007 and for Khepupara
1973–2007. Both stations show significant positive trends in the period 1971–1990 (Z = +1.98,
p <0.05 and Z = +1.71, p < 0.1). Satkhira, the other station displaying a significant positive trend over
the period 1948-2007, showed a positive trend between 1991 and 2007 only (Z = +1.94, p < 0.1) at a
rate of 34.31 mm/year. Jessore and Bhola are the other two stations along with Satkhira, which
revealed a similar character (Table S3). Bhola, however, shows a very high rate of increasing annual
rainfall from 1991 to 2007 of 173.38 mm/year (Z = +1.69, p < 0.1). The only negative and significant
trend is found in Faridpur station over the 1948–1970 period (Z = −2.22, p < 0.01). The rate of change
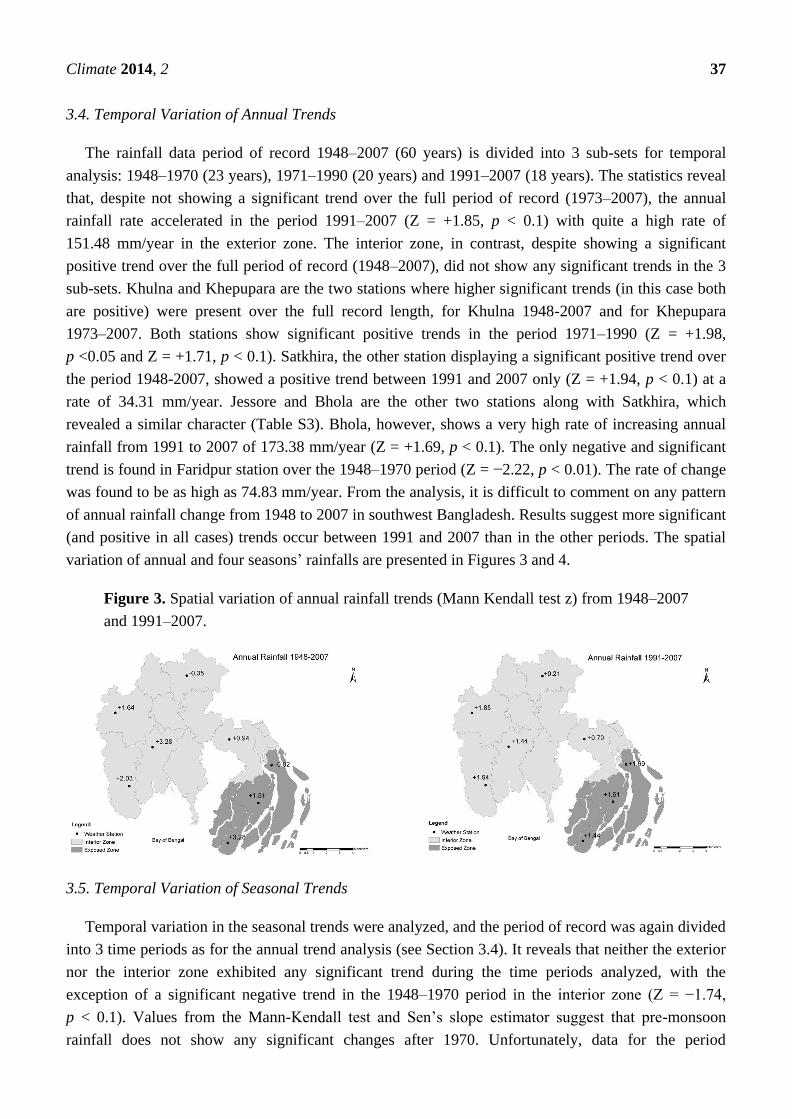
was found to be as high as 74.83 mm/year. From the analysis, it is difficult to comment on any pattern
of annual rainfall change from 1948 to 2007 in southwest Bangladesh. Results suggest more significant
(and positive in all cases) trends occur between 1991 and 2007 than in the other periods. The spatial
variation of annual and four seasons’ rainfalls are presented in Figures 3 and 4.
Figure 3. Spatial variation of annual rainfall trends (Mann Kendall test z) from 1948–2007
and 1991–2007.
3.5. Temporal Variation of Seasonal Trends
Temporal variation in the seasonal trends were analyzed, and the period of record was again divided
into 3 time periods as for the annual trend analysis (see Section 3.4). It reveals that neither the exterior
nor the interior zone exhibited any significant trend during the time periods analyzed, with the
exception of a significant negative trend in the 1948–1970 period in the interior zone (Z = −1.74,
p < 0.1). Values from the Mann-Kendall test and Sen’s slope estimator suggest that pre-monsoon
rainfall does not show any significant changes after 1970. Unfortunately, data for the period
Climate 2014, 2 38
1948–1970 is not available for the exterior coastal zone. However, the statistics suggest that the
majority of stations in the interior zone show significant negative trends over the period 1948–1970.
Data sets are available for both the interior and exterior coastal zones from 1973 onwards. However,
over the time spans 1971–1990 and 1991–2007, the majority of stations show insignificant trends,
except Satkhira station where a significant positive trend was evident between 1971 and 1990.
Although pre-monsoon trends are found to be non-significant, rainfall rates at most of the stations
(except Jessore, Satkhira and Bhola) have followed a decreasing trend since the 1990s. Moreover, the
interior and exterior zone rainfall patterns have also followed decreasing trends since the 1990s.
Temporal variation of monsoon rainfall, somewhat like the pre-monsoon season, suggests fewer
significant trends post-1970 (Table S5). The only significant trend (Z = +2.24, p < 0.01) found during
the 1971–1990 period was a positive trend at the Khulna station. The rate of increase in rainfall was
also found to be very high at 52.16 mm/year. Two significant negative trends were found in the period
1948–1970. One of these is in Faridpur (Z = −1.85, p < 0.1), which might have affected the trend
(Z = −1.74, p < 0.1) of the interior zone.
Unlike the pre-monsoon and monsoon periods, post-monsoon and winter rainfall shows significant
trends over time (Tables S6 and S7). Post-monsoon rainfall exhibits significant and positive trends at
the majority of stations, including the exterior zone, over the 1991–2007 periods. In fact, except for
Khulna station between 1948 and 1970, all of the significant trends are concentrated in the
post-1970 period.
The rates of change in seasonal rainfall were very high over this time span, ranging from 33.58 to
52.07 mm/year. Post-monsoon rainfall trends were not consistent between 1948 and 1970, and 1971
and 1990 but were, however, observed to increase at all weather stations post-1990 (Table S6).
In contrast to the post-monsoon rainfall trends, winter rainfall patterns show contrasting variation of
significant trends over the time spans (Table S7). Interestingly, significant positive trends are
concentrated in the 1971–1990 periods while significant negative trends are concentrated in the post
1991. None of the stations were found to be consistent with respect to trends, either significant or not,
over the time spans examined.
3.6. Cyclicity in Annual Rainfall Patterns
An autocorrelation test was performed to investigate the presence of any periodicity in the rainfall
records. Since the data record of the interior coastal zone is larger than that of the exterior coastal zone
(60 years compared to 35 years), the interior coastal zone is expected to show a more reliable and
significant estimate of autocorrelation. No significant autocorrelation was found in the annual datasets
of the interior and exterior zones. The seasonal datasets, however, show that the rainfall record series
in the interior coastal zone is auto correlated. The pre-monsoon and monsoon rainfall records in the
interior zone are correlated with an 11-year cycle (r = −0.33 and −0.41, respectively, p < 0.05) while
the post-monsoon and winter records show either weak or insignificant (p > 0.05) autocorrelation.

Climate 2014, 2 39
Figure 4. Spatial variation of four seasonal rainfall trends (Mann Kendall test) in the time
period 1948–2007 and 1991–2007. Exterior zone rainfall trends are limited to the time
period 1973 to 2007 due to data unavailability.

Climate 2014, 2 40
4. Discussion
Detailed analysis of the observed data clearly indicates that rainfall increased between the late
1940s and 2007 across all regions of the south west coast of Bangladesh. The changes are not
seasonally and temporally homogenous over this time period.
In our analysis, the annual rainfall series showed a significant positive trend in the interior coastal
zone, where rainfall is increasing at a rate of 8.4 mm/year over the period 1948–2007. About 38% of
the meteorological stations showed significant trends, all of which are positive. The highest significant
rate of +78.84 mm/year was found at Khepupara. Rainfall rates decreased during the monsoon seasons
of the interior coast, whereas rainfall trends in the exposed zone exhibited an upward trajectory during
the 1948–2007 and 1973–2007 periods. Temporal variation of monsoon rainfall showed non-significant
but increasing trends across the regions post-1970, with the exception of Faridpur and Bhola, whilst
rates of change were increasing and positive for all stations in the post-1990s. Rahman et al. [4] also
reported this non-significant monsoon trend while Ahsan et al. [12] observed an increasing trend
(3–4 mm/year) in monsoon rainfalls between 1960 and 2010 in the southwest coastal regions.
The post-monsoon season is receiving higher compared to pre-90s rainfall, as evident from both
linear and non-linear statistical tests, and also from both station-wise and zone-wise rainfall analyses.
Seasonal trend analysis over the 1948–2007 period showed a marked increase in post-monsoon rainfall,
where approximately 63% of the meteorological data showed significant and positive trends (no
negative trends were found). However, these increasing rainfall trends have accelerated significantly
(95% to 90% confidence level) since the 1990s. Furthermore, rainfall is increasing at a higher rate than
in the monsoon season. Ahsan et al. [12] also reported that post-monsoon rainfall increased by 0.65
mm/day over the period 1960–2010, while Roy et al. [22] reported an approximately 8% rainfall
increase in the south-west region of Bangladesh. The upward rainfall trend in the monsoon and
accelerated trend in the post-monsoon indicate the possibility of wet season extension since the 1990s.
Moreover, Shahid [6] also reported non-significant but increasing trends in post-monsoon rainfall.
The dry seasons (pre-monsoon and winter) are becoming dryer as they experienced downward
trends in rainfall between 1948 and 2007. These trends are significant and have been intensifying since
the 1990s. Pre-monsoon trends have decreased by −24.3 mm/year and −4.5 mm/year in the exterior
and interior zones respectively since the 1990s. Zone-wise rainfall patterns also reflect the
station-specific rainfall trends with the exception of Jessore and Satkhira stations. Rainfall trends in the
pre-monsoon are not homogenous over the time period, where negative trends were observed between
the periods 1948–2007 and 1991–2007, whilst positive trends were observed from 1971 to 2007.
In winter, on the other hand, about 36% of stations showed significant and negative trends between
1991 and 2007. Interestingly, the same percentage of stations, but not the same stations, showed
significant positive trends from 1971 to 1990.
However, the annual pre-monsoon trend in Bangladesh increased over the period 1958–2007,
although only some of the areas in south-west coastal Bangladesh experienced a decreasing trend in
the same period [8,39]. Our study concentrated on the south-west regions of Bangladesh, where we
found decreasing trends in pre-monsoon rainfall except in the Jessore and Satkhira regions. Moreover,
annual trends were found to be positive in the period 1947–2007, whereas decreasing trends were
mostly observed post-1990s. Results from the analysis of winter rainfall trends comply with those of

Climate 2014, 2 41
other studies, e.g., [23] and Shahid and Khairulmaini [8] who reported a decreasing winter trend of
−0.47 mm/year in the period 1969–2010.
Though we have discussed the spatial variability of rainfall in our results and discussion, conclusion
can be drawn from the Figures 3 and 4, which shows the spatial rainfall variability for the time period
1948–2007 and 1991–2007. Annual and wet season (monsoon and post-monsoon) rainfalls have
increased in all weather stations except Barishal and Faridpur, where dry season (pre-monsoon and
winter) rainfalls have followed decreasing trends in all weather stations. Even though, Satkhira and
Jessore stations rainfall trends are found positive in the time period 1948–2007, the magnitude is lower
compared to the time period 1991–2007.
The 11-year cycle might be indicative of the influence of the solar cycle in the pre-monsoon and
monsoon seasons. Post-monsoon and winter rainfall rates show strong significant trends in most
stations with no significant cyclicity. This can be explained by the monsoon or bulk rainfall shifting
towards the post-monsoon period, indicating the late arrival of the monsoon wind. Furthermore, the
last two decades of rainfall trends indicate that winters are becoming drier. These results are consistent
with the projections of GCMs (e.g., [18,44]) under global temperature increases.
The sequential Mann Kendal test also shows (Figure 5) the declining trends for pre-monsoon and
winter season, whereas, increasing trend for post monsoon season. However, the monsoon rainfall is
also variable over the decades and is consistent with the results of cyclicity analysis and trends
observation. This also reveals that these trends are mostly following from mid 80s. Though the
sequential Mann Kendal test and trends statistics are shown the changes or starting point in trends
magnitude from mid 80s, any step change point was not identified through the Lepage test except in
Khulna station. However, the change point has been also observed in winter season in most of the
weather stations.
The observed declining trend of pre-monsoon rainfall and increasing trend of monsoon rainfall
trends could pose stress on local crops production (e.g., Aus, Til), which is already evident [45] in this
region. Moreover, the declining trend in pre-monsoon rainfall coupled with declining trend of water
availability [26] likely to increase irrigation demand, particularly for Boro rice production. The
increasing trend of pre-monsoon rainfall in Satkhira region could solve the water scarcity problem,
whereas, in Jessore, it could increase water logging problem.
Again, increasing rainfall in the post-monsoon is also a concern for crops such as Jute and Aman
paddy. In Addition, this increasing trend in post monsoon rainfall combined with floodwater from
outside of the territory suggesting the increasing risk of flood events. However, this increasing trend of
post monsoon rainfall could be advantages for implementing technologies (e.g., Rain Water Harvesting
(RWH) and Pond Sand Filter (PSF) systems), which could support to solve water scarcity in this
region. Moreover, fresh water flushing by heavy rainfall in the post-monsoon, washing away saline
water, may leave the land in a more suitable condition for the cultivation of vegetables and other crops.
There is a need to understand rainfall trends, our knowledge of which can be enhanced by further
research. The empirical research could include trend detection similar to that carried out in the present
study for weather stations across the entire country. Methodology of this study particularly change
point analysis and sequential trends could be useful for other trend detection studies (e.g., temperature,
water discharges). This could be furthered by the application of different non-parametric tests and,
more substantially, the application and detection of thresholds or tipping points which could increase

Climate 2014, 2 42
our knowledge in relation to agriculture, livelihood and rainfall. Moreover, palaeo-environmental
techniques could be useful to reconstruct historical data to fill long term data gaps and allow the
reconstruction of historical rainfall patterns and agriculture in this delta zone.
Figure 5. Sequential Mann Kendal test results for interior (Top) and exterior (Bottom)
zone using 20 years moving window.
5. Conclusions
The findings of this study can be summarized as follows: rainfall trends increased between 1948
and 2007 but these changes are not spatially and temporally homogenous. The annual rainfall series
showed a significant positive trend in the interior coastal zone, where rainfall is increasing at a rate of

Climate 2014, 2 43
8.4 mm/year over the period 1948–2007. About 38% of the meteorological stations exhibited
significant trends all of which are positive. The highest significant rate was found at Khepupara at
+78.84 mm/year. Monsoon rainfall followed a non-significant trend, whereas post-monsoon rainfall
increased significantly over the period 1948–2007. The winter and pre-monsoon seasons are becoming
dryer as they have experienced decreasing rainfall trends. The sequential Mann Kendal test reveals that
mid 80s is the starting point of rainfall trends, whereas, rainfall in Khulna station shown step change
point and also for winter seasons in all weather stations.
The increased amount of rainfall in the monsoon and particularly in the post-monsoon seasons
along with the decreasing winter trend could have negative impacts on agriculture and human
livelihood. The results of this study therefore have implications of the utmost importance in this sector.
Firstly, the indication of late rainfall arrival and heavy rainfall in the post-monsoon is a threat to the
cropping system in the southwest. Secondly, the decreasing trend in rainfall during the winter will
intensify the ground water resource crisis in the region. Therefore, research is needed on decadal and
season variability of rainfall over the entire country, palaeo-environmental reconstruction and
advanced statistical modeling in combination with future scenario analysis for micro and macro scale
climate change adaptation planning in Bangladesh.
Acknowledgements
Sarwar Hossain acknowledges financial support provided by a joint NERC/ESRC PhD studentship
award, and the University of Southampton. Authors would like to thank Sarah Pogue from the
University of Southampton and the three anonymous reviewers for their contribution to improve the
manuscript.
Author Contributions
Md Sarwar Hossain: Conceptualization, data collection and analysis, wrote the paper, revised, and
finalized the manuscript. Kushal Roy: Conceptualization, data analysis, revised the manuscript by
direct input of writing and comments. Dilip Kumar Datta: Conceptualization, overall supervision,
comments on the manuscript.
Conflicts of Interest
The authors declare no conflict of interest.
References
1. Mirza, M.Q.; Warrick, R.A.; Ericksen, N.J.; Kenny, G.J. Trends and persistence in precipitation in
the Ganges, Brahmaputra and Meghna river basins. Hydrol. Sci. 2008, 43, 845–858.
2. Partal, T.; Kahya, E. Trend analysis in Turkish precipitation data. Hydrol. Process. 2006, 20,
2011–2026.
3. Islam, M.N.; Rafiuddin, M.; Ahmed, A.U.; Kolli, R.K. Calibration of PRECIS in employing
future scenarios in Bangladesh. Int. J. Climatol. 2008, 28, 617–628.

Climate 2014, 2 44
4. Rahman, M.R.; Salehin, M.; Matsumoto, J. Trends of monsoon rainfall pattern in Bangladesh.
Bangladesh J. Water Resour.1997, 14, 121–138.
5. Mirza, M.M.Q.; Hossain, M.A. The Ganges Water Dispersion: Environmental Effects and
Implications. In Adverse Effects on Agriculture in the Ganges Basin in Bangladesh;
Mirza, M.M.Q. Ed.; Kluwer Academic Publishers: Dordrecht, The Netherlands, 2004;
pp. 177–196.
6. Shahid, S. Rainfall variability and the trends of wet and dry periods in Bangladesh. Int. J.
Climatol. 2009, doi:10.1002/joc.2053.
7. Sanderson, M.; Ahmed, R. Pre-monsoon rainfall and its variability in Bangladesh: A trend surface
analysis. Hydrol. Sci. Bull. 1979, 24, 277–287.
8. Shahid, S.; Khairulmaini, O.S. Spatio-temporal variability of rainfall over Bangladesh during the
time period 1969–2003. Asia Pac. J. Atmos. Sci. 2009, 45, 375–389.
9. Stringer, E.T. Foundation of Climatology—An Introduction to Physical, Dynamic, Synoptic and
Geophysical Climatology; Freeman: San Francisco, CA, USA, 1995.
10. IPCC. Climate Change 2007—The Physical science Basis; Fourth Assessment Report of the
Intergovernmental Panel on Climate Change; Cambridge University Press: Cambridge, UK, 2007.
11. Abrol, P.Y.; Gandhi, S.; Pant, B.G. Climate Variability and Agriculture; Narosha Publishing
House: New Delhi, India, 2003.
12. Ahasan, M.N.; Chowdhary, M.A.M.; Quadir, D.A. Variability and trends of summer monsoon
rainfall over Bangladesh. J. Hydrol. Meteorol. 2010, 7, 1–7.
13. Ahmed, A.U. Bangladesh: Climate Change Impacts and Vulnerability; Climate Change Cell,
Ministry of Environment and Forest: Dhaka, Bangladesh, 2006.
14. Changing Pattern of Rainfall is the Main Cause for Flood. Available online: http://www.prothom-
alo.com (accessed on 1 July 2011).
15. Hossain, M.S.; Roy, K.; Hauqe, M.; Khan, H.M. Climate Change and Development: A Research
on Mainstreaming of Climate Change in National Policy Development Using Environmental
Impact Assessment (EIA) in Water Resource Management at Narail, Bangladesh; Ulashi Sreejony
Sangha (USS) and NGO Forum on ADB: Jessore, Bangladesh, 2010.
16. MOA. Ministry of Agriculture. Dhaka Bangladesh, 2010. Available online:
http://www.moa.gov.bd/statistics/bag.htm (accessed on 14 August 2011).
17. Rafiuddin, M.; Uyeda, H.; Islam, M.N. Characteristics of monsoon precipitation systems in and
around Bangladesh. Int. J. Climatol. 2010, 30, 1042–1055.
18. Rafiuddin, M.; Uyeda, H.; Islam, M.N. Characteristics of Monsoon Precipitation Systems in
Bangladesh during 2000–2005. In Proceedings of the 6th International Conference on Mesoscale
Meteorology and Typhoon in East Asia (ICMCS-VI), 6–9 November, Taipei, Taiwan, 2007.
19. Hossain, M.S.; Roy, K. Rainfall Variability over the South Coast of Bangladesh. In Proceedings
of International Conference on Bangladesh Environment 2010 by BEN and BAPA, Dhaka,
Bangladesh, 3–4 January 2009.
20. Islam, M.N.; Uyeda, H. Use of TRMM in determining the climatic characteristics of rainfall over
Bangladesh. Remote Sens. Environ. 2007, 108, 264–276.
21. Kripalani, R.H.; Inamdar, S.; Sontakke, N.A. Rainfall variability over Bangladesh and Nepal:
Compariosn and connections with features over India. Int. J. Climatol. 1996, 16, 689–703.

Climate 2014, 2 45
22. Roy, K.; Rahman, M.; Kumar, U. Future Climate Change and Moisture Stress: Impact on Crop
Agriculture in South-Western Bangladesh; Scientific Briefing series of Unnayan Onneshan:
Dhaka, Bangladesh, 2009. Available online: http://unnayan.org/reports/climate080909.pdf
(accessed on 20 October 2011).
23. Hossain, M.S.; Hein, L.; Rip, F.I.; Dearing, J.A. Integrating ecosystem services and climate
change responses in coastal wetlands development plans for Bangladesh. Mitig. Adapt. Strateg.
Glob. Chang. 2013, doi:10.1007/s11027-013-9489-4.
24. Tingsanchali, T.; Karim, M.F. Flood hazard and risk analysis in the southwest region of
Bangladesh. Hydrol. Process 2005, 19, 2055–2069.
25. ICZMP. Delineation of the Coastal Zone; Working Paper 005, Water resources Planning
Organization: Dhaka, Bangladesh, 2003.
26. Hossain, M.S.; Dearing, J.A.; Munsur, R.; Salehin, M. The coevolution of ecosystem services and
human wellbeing in the Bangladesh delta. Reg. Environ. Change 2014, under review.
27. IPCC. Climate Change 2001—The scientific Basis; Third Assessment Report of the
Intergovernmental Panel on Climate Change; Working Group 1, Cambridge University Press:
Cambridge, UK, 2001.
28. Hossain, M.S. Exploring Evidences of Climate Change in the South-West Coastal Zone of
Bangladesh. Bachelor’s Thesis, Khulna University, Khulna, Bangladesh, 2009.
29. Hossain, M.S. Climate Error: Misconceiving the Development Issue. A Hardline View of
the Water Resource Management Project of ADB in Bangladesh. Available online:
http://www.forum-adb.org/docs/BW2010Q1-3.pdf (accessed on 14 August 2011).
30. Mann, H.B. Nonparametric tests against trend. Econometrics 1945, 13, 245–259.
31. Kendall, MG. Rank Correlation Methods; Griffin: London, UK, 1975.
32. Hirsch, R.M.; Alexander, R.B.; Smith, R.A. Selection of methods for the detection and estimation
of trends in water quality. Water Resour. Res. 1991, 27, 803–813.
33. Yue, S.; Pilon, P.; Cavadias, G. Power of the Mann-Kendall and Spearman’s rho tests for
detecting monotonic trends in hydrological series. J. Hydrol. 2002, 259, 254–271.
34. Peterson, T.C.; Easterling, D.R.; Karl, T.R.; Thomas, R.K.; Pavel, G.; Neville, N.; Neil, P.; Simon,
T.; Ingeborg, A.; Reinhard, B.; et al. Homogeneity adjustments of in situ atmospheric climate data:
A review. Int. J. Climatol. 1998, 18, 1493–1517
35. Lepage Y. A combination of Wilcoxon’s and Ansari-Bradley’s statistics. Biometrika 1971, 58,
213–217.
36. Benjamin, V.; Roger, N.J. Detection of Abrupt Changes in Australian Decadal Rainfall (1890–1989);
CSIRO Atmospheric Research Technical Paper No. 73. ; CSIRO Atmospheric Research: Victoria,
Australia, 2005; p. 73.
37. Inoue, T.; Matsumoto, J. Abrupt climate changes observed in late August over central Japan
between 1983 and 1984. J. Clim. 2007, 20, 4957–4967
38. Su, B.D.; Jiang, T.; Jin, W.B. Recent trends in observed temperature and precipitation extremes in
the Yangtze River basin, China. Theor. Appl. Climatol. 2006, 83, 139–151.
39. Serrano, A.; Mateos, V.L.; Garcia, J.A. Trend analysis of monthly precipitation over the Iberian
Peninsula for the period 1921–1995. Phys. Chem. Earth 1999, 24, 85–90.
Climate 2014, 2 46
40. National Adaptation Programme of Action. Bangladesh National Adaptation Programme of
Action (NAPA); Ministry of Environment and Forest (MOEF): Dhaka, Bangladesh, 2005.
41. Sen, P.K. Estimates of the regression coefficient based on Kendall’s Tau. J. Am. Stat. Assoc.1968,
63, 1379–1389.
42. Zhang, Q.; Xu, C-Y.; Zhang, Z.; Ren, G.; Chen, Y.D. Climate change or variability? The case of
Yellow river as indicated by extreme maximum and minimum air temperature during 1960–2004.
Theor. Appl. Climatol. 2008, 93, 35–43.
43. Hame, K.H.; Rao, A.R. A modified Mann-Kendall trend test for auto correlated data. J. Hydrol.
1998, 204, 182–196.
44. Agrawala, S.; Tomoka, O.; Ahmed, A.U.; Smith, J.; Aalst, M.A. Development and Climate
Change in Bangladesh: Focus on Coastal Flooding and the Sunderbans; Organisation for
Economic Co-operation and Development (OECD): Paris, France, 2003.
45. Moni, A.H.; Hossain, M.S. Responses of Environmental Changes (Climate) in Wetlands: Focus
on Climate change and Chenchuri Beel, 3rd ed.; Ulashi Sreejony Sangha (USS) and Action Aid
Bangladesh: Jessore, Bangladesh, 2009; pp. 167–173.
© 2014 by the authors; licensee MDPI, Basel, Switzerland. This article is an open access article
distributed under the terms and conditions of the Creative Commons Attribution license
(http://creativecommons.org/licenses/by/3.0/).


![Case 4:04-cv-00028-CVE-PJC Document 1 Filed in USDC …1] Complaint_0.pdfCase 4:04-cv-00028-CVE-PJC Document 1 Filed in USDC ND/OK on 01/14/2004 Page 2 of 65. Case 4:04-cv-00028-CVE-PJC](https://img.dokumen.tips/doc/110x75/5f14f1ff5310e4287f0f302b/case-404-cv-00028-cve-pjc-document-1-filed-in-usdc-1-complaint0pdf-case-404-cv-00028-cve-pjc.jpg)


![Weekly Tallahasseean. (Tallahassee, Florida) 1900-08-02 [p 4].ufdcimages.uflib.ufl.edu/UF/00/08/09/51/00004/00028.pdf · doctoring Myers Repub iff eminent extrava appetite-of tonhe](https://img.dokumen.tips/doc/110x75/5f0cf9c37e708231d4380f68/weekly-tallahasseean-tallahassee-florida-1900-08-02-p-4-doctoring-myers-repub.jpg)