Embed Size (px)
Citation preview

November 2O15
strategicCLIMATE ACTION PLAN

125
APPENDICES
KING COUNTY STRATEGIC CLIMATE ACTION PLAN
• APPENDIX A: Coordination with Other County Plans
• APPENDIX B: Response to King County Council Motion 14349
• APPENDIX C: Energy Strategy Details
• APPENDIX D: Green Building Reporting
• APPENDIX E: Climate Program Costs and Benefits

AP
PE
ND
IX A
: Coordination with O
ther Plans
127KING COUNTY STRATEGIC CLIMATE ACTION PLAN APPENDIX A: Coordination with Other County Plans
APPENDIX A:Coordination with Other County Plans
KING COUNTY STRATEGIC CLIMATE ACTION PLAN

AP
PE
ND
IX A
: Co
ordi
natio
n w
ith O
ther
Pla
ns
KING COUNTY STRATEGIC CLIMATE ACTION PLAN APPENDIX A: COORDINATION WITH OTHER COUNTY PLANS128
SEE THIS GOAL AREA /SECTION
Transp. & Land
Use
Energy Green Building
Consump. & Mater. Mgmt.
Forests & Ag.
Preparing for
ImpactsPLANS
King County Comprehensive Plan n n n n n n
King County Strategic Plan n n n n n n
King County Comprehensive Solid Waste Management Plan
n n
King County Consortium Consolidated Housing and Community Development Plan
n n n n
King County Equity and Social Justice Strategic Plan (in development)
n n n n n n
King County FARMS Report - Future of Agriculture Realizing Meaningful Solutions
n n n
King County Flood Hazard Management Plan n n n
King County International Airport – Airport Master Plan n n
King County Marine Division Strategic Plan n n
King County Metro Transit Long Range Plan (in development)
n n n
King County Metro Transit Strategic Plan for Public Transportation
n n n
King County Open Space Plan: Parks, Trails, and Natural Areas
n n
King County Parks and Recreation Division Forest Stewardship Plans
n n
King County Regional Hazard Mitigation Plan n
King County Regional Trails Inventory and Implementation Guidelines
n
King County Regional Wastewater Services Plan n n n
King County Stormwater Management Program Plan n n
King County Strategic Plan for Road Services n n
Public Health Seattle and King County Environmental Health Services Strategic Plan
n n n
PROGRAMS AND LEGISLATION
King County Critical Areas Ordinance n n n
King County Conservation Futures Program n n n
King County Current Use Taxation Program n
King County Environmentally Preferable Purchasing and Practices Ordinance
n n
King County Equity and Social Justice Ordinance n n n n n n
King County Farmland Preservation Program n n
King County Green Building and Sustainable Development Ordinance
n n
King County Local Food Initiative n n
King County Transfer of Development Rights Program n n
Resilient King County Initiative n
Appendix A: Coordination with Other County Plans

AP
PE
ND
IX B
: Response to King County Council Motion 14349
129
APPENDIX B:Response to King County Council Motion 14349
KING COUNTY STRATEGIC CLIMATE ACTION PLAN

AP
PE
ND
IX B
: Re
spon
se to
Kin
g Co
unty
Cou
ncil
Mot
ion
1434
9
KING COUNTY STRATEGIC CLIMATE ACTION PLAN APPENDIX B: Response to King County Council Motion 1434913O
2
Appendix B: Response to King County Council Motion 14349 King County Council Motion 14349, adopted in May 2015, provided the County Executive a list of selected climate-‐related activities and policies from other jurisdictions to consider in development of the 2015 SCAP. The table below presents that list organized by 2015 SCAP goal area or section. A green square in the “Status” column represents suggestions that are addressed in the 2015 SCAP and/or already exist as a County program or policy. A yellow square in the “Status” column represents suggestions that are not directly included in the 2015 SCAP. This could be due to factors such as local environmental conditions, the role and authority of King County government, cost effectiveness, existing programs or policies in other jurisdictions or organizations, or other reasons as described in the responses in the table.
Suggestion from Motion 14349
Status Response to Suggestion
SCAP Plan Development: Outreach and Engagement See the Outreach and Engagement section for more information. Public workshops and a website survey which provide a forum for public participation in climate action plan development. (City of Berkeley)
King County utilized multiple tools for reaching out to a variety of audiences:
• online forum using Mindmixer • in-‐person focus groups in multiple languages • individual and small group interviews • ongoing discussions with stakeholders and subject matter experts
This engagement was an important step in starting to cultivate relationships with community-‐based organization and others that will advance King County’s climate strategy moving forward.
Partner with an outside non-‐profit to create and develop the plan. (City of Berkeley)
During the creation and development of the 2015 SCAP, multiple non-‐profit organizations served as subject matter experts and provided technical assistance. Some examples include Climate Solutions, Environmental Coalition of South Seattle (ECOSS), International Living Futures Institute/Cascadia Green Building Council, and the Northwest Energy Efficiency Council.
Involve technical advisory groups (TAG) of sector experts to provide recommendations. (City of Seattle)
King County has been working on an ongoing basis with technical experts, who have advised different King County agencies about specific targets and strategies. The County also convened two focus groups involving subject matter experts to provide input about the 2015 SCAP.
Create a Green Ribbon Commission of community, environmental, and business leaders to consider draft of Strategic Climate Action Plan and refine it. (City of
In implementing the 2012 SCAP, King County has worked closely with a variety of technical experts on its climate strategy and this ongoing collaboration directly shaped the strategies, actions, and targets included in the 2015 SCAP. For example, the King County-‐Cities Climate Collaboration (K4C) and Regional Code Collaboration have both functioned as a de facto green ribbon commission, where participants have shared their expertise, insight and ideas and have forged partnerships for regional collaboration. As noted under Priority Actions by
Appendix B: Response to King County Council Motion 14349King County Council Motion 14349, adopted in May 2015, provided the County Executive a list of selected climate-related activities and policies from other jurisdictions to consider in development of the 2015 SCAP.
The table below presents that list organized by 2015 SCAP goal area or section. A green square in the “Status” column represents suggestions that are addressed in the 2015 SCAP and/or already exist as a County program or policy. A yellow square in the “Status” column represents suggestions that are not directly included in the 2015 SCAP. This could be due to factors such as local environmental conditions, the role and authority of King County government, cost effectiveness, existing programs or policies in other jurisdictions or organizations, or other reasons as described in the responses in the table.
AP
PE
ND
IX B
: Response to King County Council Motion 14349
131KING COUNTY STRATEGIC CLIMATE ACTION PLAN APPENDIX B: Response to King County Council Motion 14349
3
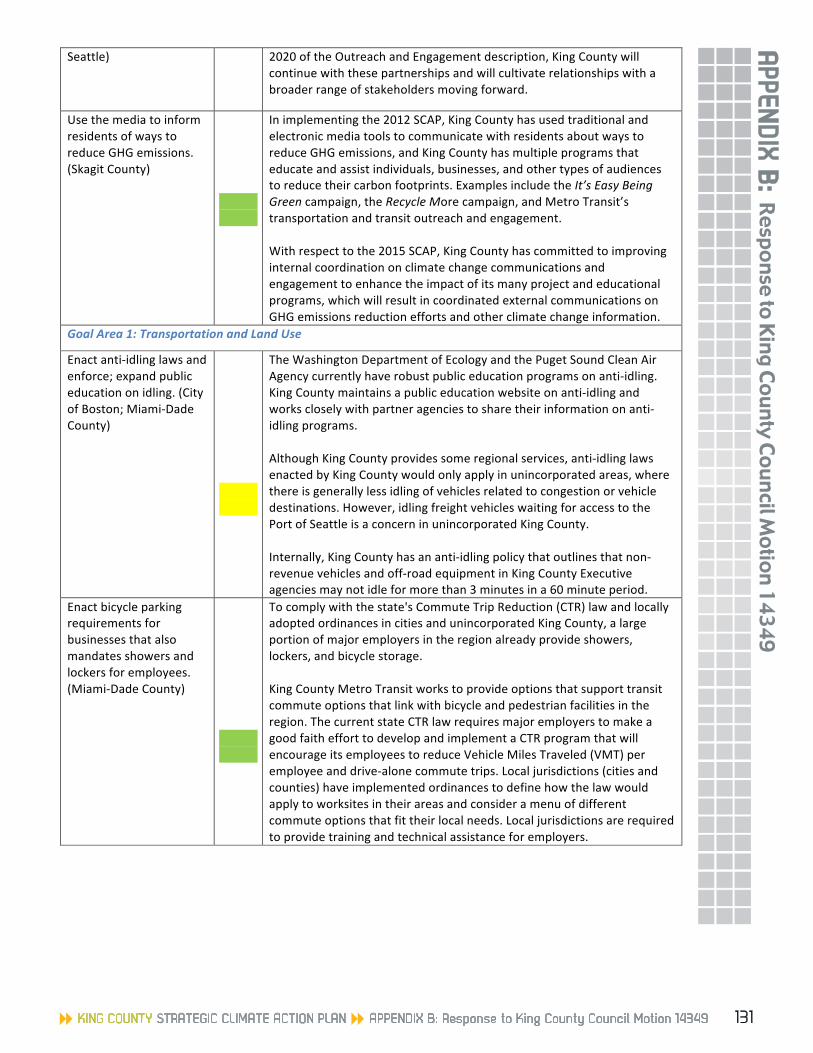
Seattle) 2020 of the Outreach and Engagement description, King County will continue with these partnerships and will cultivate relationships with a broader range of stakeholders moving forward.
Use the media to inform residents of ways to reduce GHG emissions. (Skagit County)
In implementing the 2012 SCAP, King County has used traditional and electronic media tools to communicate with residents about ways to reduce GHG emissions, and King County has multiple programs that educate and assist individuals, businesses, and other types of audiences to reduce their carbon footprints. Examples include the It’s Easy Being Green campaign, the Recycle More campaign, and Metro Transit’s transportation and transit outreach and engagement. With respect to the 2015 SCAP, King County has committed to improving internal coordination on climate change communications and engagement to enhance the impact of its many project and educational programs, which will result in coordinated external communications on GHG emissions reduction efforts and other climate change information.
Goal Area 1: Transportation and Land Use
Enact anti-‐idling laws and enforce; expand public education on idling. (City of Boston; Miami-‐Dade County)
The Washington Department of Ecology and the Puget Sound Clean Air Agency currently have robust public education programs on anti-‐idling. King County maintains a public education website on anti-‐idling and works closely with partner agencies to share their information on anti-‐idling programs. Although King County provides some regional services, anti-‐idling laws enacted by King County would only apply in unincorporated areas, where there is generally less idling of vehicles related to congestion or vehicle destinations. However, idling freight vehicles waiting for access to the Port of Seattle is a concern in unincorporated King County. . Internally, King County has an anti-‐idling policy that outlines that non-‐revenue vehicles and off-‐road equipment in King County Executive agencies may not idle for more than 3 minutes in a 60 minute period.
Enact bicycle parking requirements for businesses that also mandates showers and lockers for employees. (Miami-‐Dade County)
To comply with the state's Commute Trip Reduction (CTR) law and locally adopted ordinances in cities and unincorporated King County, a large portion of major employers in the region already provide showers, lockers, and bicycle storage. King County Metro Transit works to provide options that support transit commute options that link with bicycle and pedestrian facilities in the region. The current state CTR law requires major employers to make a good faith effort to develop and implement a CTR program that will encourage its employees to reduce Vehicle Miles Traveled (VMT) per employee and drive-‐alone commute trips. Local jurisdictions (cities and counties) have implemented ordinances to define how the law would apply to worksites in their areas and consider a menu of different commute options that fit their local needs. Local jurisdictions are required to provide training and technical assistance for employers.

AP
PE
ND
IX B
: Re
spon
se to
Kin
g Co
unty
Cou
ncil
Mot
ion
1434
9
KING COUNTY STRATEGIC CLIMATE ACTION PLAN APPENDIX B: Response to King County Council Motion 14349132
4
Explore tax-‐incentives for bicycle commuting. (Miami-‐Dade County)
King County's Employee Transportation Program has used gift cards as an incentive mechanism to increase bicycle use for commuting. Additionally, Employer Transportation Coordinators at large businesses are responsible for developing commuter incentives and may be able to coordinate employer-‐paid financial incentives for bike commuters. King County's Commute Trip Reduction program actively helps employers identify alternative commute options, including exploring incentives for increased bicycle commuting. King County currently does not have a legal mechanism to reduce County-‐collected taxes based on mode of travel.
Implement “Safe Routes to School” program so kids can bike or walk to school. (Portland-‐Multnomah County)
Under state law, every new urban development is evaluated for safe walking routes and considered in part of the approval process for development. This can include providing safe walking routes directly to the school, or to locations to get on a school bus, depending on the needs of the school. This is dictated in state law per RCW 58.17.110. Public Health – Seattle and King County is working with partners through coalitions, workgroups and advisory boards to improve access to Safe Routes to School programs and resources. For example, Public Health participated in the Seattle Department of Transportation’s efforts to develop the Seattle Pedestrian Master Plan. The Plan prioritizes pedestrian and safety improvements around schools. Public Health staff provides leadership to the Puget Sound Regional Council Bicycle Pedestrian Advisory Committee and participate on the Regional Staff Committee.
Goal Area 2: Buildings and Facilities Energy
Install solar panels on all county buildings. (Miami-‐Dade County)
The 2015 SCAP sets direction and ambitious targets to increase renewable energy production and usage for King County operations and includes targets for renewable energy production and consumption. After using state solar production incentives, in Washington State, solar energy has a long payback (often 20+ years). For this reason, the County is prioritizing enhanced energy efficiency as the most cost effective energy strategy. With the hope and assumption that the County will continue to push the limits of energy efficiency and that solar energy cost effectiveness will improve, Goal Area 2: Buildings and Facilities Energy addresses making facilities "solar ready" for future integration of lower cost solar, and staff will be researching the potential to develop an offsite County-‐owned large-‐scale solar array, with the assumption that the cost efficiencies of larger scale systems could demonstrate to be life-‐cycle cost effective as an energy supply strategy for an aggregated group of multiple county facilities. In the short term, the County will take advantage of grant opportunities to fund solar projects, such as the 104 kW photovoltaic systems on the roofs of the King County Aquatic Center and Regional Justice Center for which the County received $525,000 and $475,000 grants.
AP
PE
ND
IX B
: Response to King County Council Motion 14349
133KING COUNTY STRATEGIC CLIMATE ACTION PLAN APPENDIX B: Response to King County Council Motion 14349
5
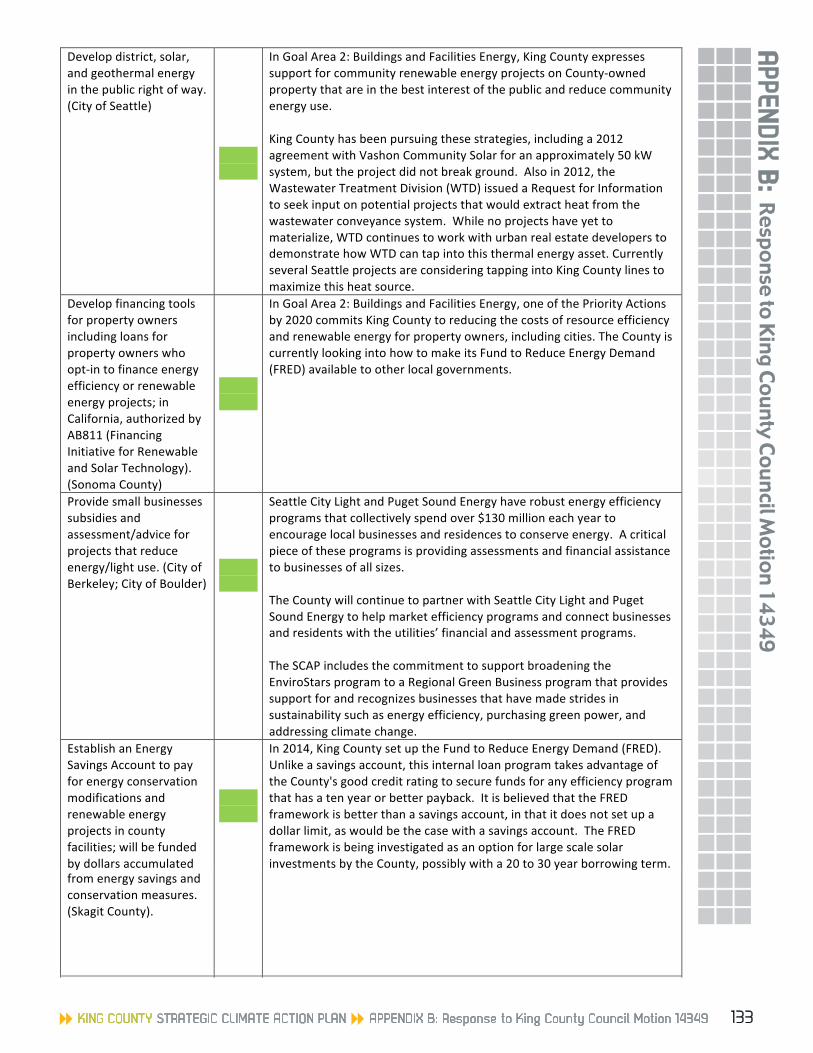
Develop district, solar, and geothermal energy in the public right of way. (City of Seattle)
In Goal Area 2: Buildings and Facilities Energy, King County expresses support for community renewable energy projects on County-‐owned property that are in the best interest of the public and reduce community energy use. King County has been pursuing these strategies, including a 2012 agreement with Vashon Community Solar for an approximately 50 kW system, but the project did not break ground. Also in 2012, the Wastewater Treatment Division (WTD) issued a Request for Information to seek input on potential projects that would extract heat from the wastewater conveyance system. While no projects have yet to materialize, WTD continues to work with urban real estate developers to demonstrate how WTD can tap into this thermal energy asset. Currently several Seattle projects are considering tapping into King County lines to maximize this heat source.
Develop financing tools for property owners including loans for property owners who opt-‐in to finance energy efficiency or renewable energy projects; in California, authorized by AB811 (Financing Initiative for Renewable and Solar Technology). (Sonoma County)
In Goal Area 2: Buildings and Facilities Energy, one of the Priority Actions by 2020 commits King County to reducing the costs of resource efficiency and renewable energy for property owners, including cities. The County is currently looking into how to make its Fund to Reduce Energy Demand (FRED) available to other local governments.
Provide small businesses subsidies and assessment/advice for projects that reduce energy/light use. (City of Berkeley; City of Boulder)
Seattle City Light and Puget Sound Energy have robust energy efficiency programs that collectively spend over $130 million each year to encourage local businesses and residences to conserve energy. A critical piece of these programs is providing assessments and financial assistance to businesses of all sizes. The County will continue to partner with Seattle City Light and Puget Sound Energy to help market efficiency programs and connect businesses and residents with the utilities’ financial and assessment programs. The SCAP includes the commitment to support broadening the EnviroStars program to a Regional Green Business program that provides support for and recognizes businesses that have made strides in sustainability such as energy efficiency, purchasing green power, and addressing climate change.
Establish an Energy Savings Account to pay for energy conservation modifications and renewable energy projects in county facilities; will be funded by dollars accumulated
In 2014, King County set up the Fund to Reduce Energy Demand (FRED). Unlike a savings account, this internal loan program takes advantage of the County's good credit rating to secure funds for any efficiency program that has a ten year or better payback. It is believed that the FRED framework is better than a savings account, in that it does not set up a dollar limit, as would be the case with a savings account. The FRED framework is being investigated as an option for large scale solar investments by the County, possibly with a 20 to 30 year borrowing term.
112
from energy savings and conservation measures. (Skagit County).
Include a goal and a proposed timeline in the 2015 Strategic Climate Action Plan for eliminating coal power from the County’s operational energy portfolio.
As noted in Goal Area 2: Buildings and Facilities Energy, King County has a priority action to ensure the electricity consumed by County operations is 100 percent GHG neutral by 2025. The County is also committed to partnering with utilities and other local partners on renewable energy resources, including meeting countywide electricity needs while phasing out fossil fuels.
Goal Area 3: Green Building
Require publicly accessible energy efficiency ratings for buildings. (City of Boston; City of Seattle)
In Goal Area 2: Buildings and Facilities Energy, King County commits by the end of 2016 to benchmark and publish energy performance and GHG emissions data for County-‐owned facilities over 20,000 square feet, using the Energy Star Portfolio Manager tool or a methodology appropriate to the facility (e.g. wastewater treatment facility). The County will also work with K4C cities to standardize a benchmarking framework.
Require “cool roofs,” light colored or vegetated roofs. (City of Boston)
The intent of cool roofs and the others mentioned is to reduce "heat islands" in urban areas from large commercial structures. This does not apply to the rural unincorporated areas where King County has jurisdiction, but the County will ensure this idea is discussed with the Regional Code Collaboration group for appropriate areas within the county.
Require “daylight harvesting” lighting controls which are tied into daylight coming in from outside a building. (Miami-‐Dade County)
While not in the 2015 SCAP, "daylighting control" is already in the Washington State Energy Code and implemented by DPER. For example, DPER's office building in Snoqualmie has daylight controlled lighting.
Goal Area 4: Consumption and Materials Management
Pilot and consider changing to every other week garbage collection from single family homes. (City of Seattle)
In collaboration with the City of Renton and other stakeholders, the Solid Waste Division successfully piloted every-‐other-‐week garbage collection in 2008, and Renton implemented it as a result. The 2013 draft Comprehensive Solid Waste Management Plan encourages this collection frequency as part of the curbside collection standards. This strategy is being pursued in the unincorporated area and included in current Comprehensive Plan discussions with the Metropolitan Solid Waste Management Advisory Committee and the King County Solid Waste Advisory Committee. See Goal Area 4: Consumption and Materials Management for more information.
Goal Area 5: Forests and Agriculture

AP
PE
ND
IX B
: Re
spon
se to
Kin
g Co
unty
Cou
ncil
Mot
ion
1434
9
KING COUNTY STRATEGIC CLIMATE ACTION PLAN APPENDIX B: Response to King County Council Motion 14349134
112
from energy savings and conservation measures. (Skagit County).
Include a goal and a proposed timeline in the 2015 Strategic Climate Action Plan for eliminating coal power from the County’s operational energy portfolio.
As noted in Goal Area 2: Buildings and Facilities Energy, King County has a priority action to ensure the electricity consumed by County operations is 100 percent GHG neutral by 2025. The County is also committed to partnering with utilities and other local partners on renewable energy resources, including meeting countywide electricity needs while phasing out fossil fuels.
Goal Area 3: Green Building
Require publicly accessible energy efficiency ratings for buildings. (City of Boston; City of Seattle)
In Goal Area 2: Buildings and Facilities Energy, King County commits by the end of 2016 to benchmark and publish energy performance and GHG emissions data for County-‐owned facilities over 20,000 square feet, using the Energy Star Portfolio Manager tool or a methodology appropriate to the facility (e.g. wastewater treatment facility). The County will also work with K4C cities to standardize a benchmarking framework.
Require “cool roofs,” light colored or vegetated roofs. (City of Boston)
The intent of cool roofs and the others mentioned is to reduce "heat islands" in urban areas from large commercial structures. This does not apply to the rural unincorporated areas where King County has jurisdiction, but the County will ensure this idea is discussed with the Regional Code Collaboration group for appropriate areas within the county.
Require “daylight harvesting” lighting controls which are tied into daylight coming in from outside a building. (Miami-‐Dade County)
While not in the 2015 SCAP, "daylighting control" is already in the Washington State Energy Code and implemented by DPER. For example, DPER's office building in Snoqualmie has daylight controlled lighting.
Goal Area 4: Consumption and Materials Management
Pilot and consider changing to every other week garbage collection from single family homes. (City of Seattle)
In collaboration with the City of Renton and other stakeholders, the Solid Waste Division successfully piloted every-‐other-‐week garbage collection in 2008, and Renton implemented it as a result. The 2013 draft Comprehensive Solid Waste Management Plan encourages this collection frequency as part of the curbside collection standards. This strategy is being pursued in the unincorporated area and included in current Comprehensive Plan discussions with the Metropolitan Solid Waste Management Advisory Committee and the King County Solid Waste Advisory Committee. See Goal Area 4: Consumption and Materials Management for more information.
Goal Area 5: Forests and Agriculture

AP
PE
ND
IX B
: Response to King County Council Motion 14349
135KING COUNTY STRATEGIC CLIMATE ACTION PLAN APPENDIX B: Response to King County Council Motion 14349
7
Goal Area 5: Forests and Agriculture
Include explicit statements about removing carbon from atmosphere, not just reducing GHG emissions. For example, assess opportunities for carbon sequestration projects on county property such as wetlands, salt ponds. (Alameda County)
The 2015 SCAP includes explicit statements about removing carbon from the atmosphere, specifically by enhancing soil carbon content in agricultural and forestry lands and by increasing carbon storage in trees on forest lands. King County supports strategies for carbon sequestration through the Loop Biosolids program and forest protection and restoration initiatives. See Goal Area 5: Forests and Agriculture for more information.
Section Two: Preparing for Climate Change Impacts
Identify “hot spots,” neighborhoods with especially elevated temperatures and risk of heat stroke; focus street tree planting efforts in those areas. (City of Chicago; City of Seattle)
Public Health has an effective outreach program for responding to heat waves, as addressed in Section Two: Preparing for Climate Change Impacts. While an increase in the number of urban trees may mitigate heat waves in specific neighborhoods, efforts to manage urban trees are managed by jurisdictions with local land use authority. In Goal Area 5: Forests and Agriculture, King County commits to working with public, non-‐profit and private partners throughout the county to collectively plant at least one million new trees by 2020. See Section Two: Preparing for Climate Change Impacts and Goal Area 5: Forests and Agriculture for more information.
Overall Policy Develop green workforce opportunities (City of Berkeley; City of Boston)
Although not addressed in the 2015 SCAP, the Department of Natural Resources and Parks has been active in promoting its green workforce opportunities by recruiting at a variety of job fairs and other venues throughout the county.
Send GHG reduction targets to voters for approval. (City of Berkeley)
The King County Growth Management Planning Council (GMPC) is a formal body that currently includes elected officials from King County, Seattle, Bellevue, other cities and towns in King County, special purpose districts, and the Port of Seattle. In July 2014, the GMPC unanimously adopted shared, countywide, near and long term GHG reduction targets. The Growth Management Planning Council, which includes elected leaders from cities and the Metropolitan King County Council, also created measurements and reporting commitments. See the Greenhouse Gas Emissions Reduction Targets Section for more detail about targets and measurement commitments.

AP
PE
ND
IX B
: Re
spon
se to
Kin
g Co
unty
Cou
ncil
Mot
ion
1434
9
KING COUNTY STRATEGIC CLIMATE ACTION PLAN APPENDIX B: Response to King County Council Motion 14349136
8
Ensure that the costs and benefits of climate action are shared fairly throughout community and do not exacerbate existing inequalities. (City of Boston)
As noted throughout the 2015 SCAP, there is a deep connection between climate change and equity and social justice. The Equity and Social Justice Strategic Plan is currently under development, and climate change considerations will be an integral part of the conversation. The County recognizes that the consequences of different climate actions it chooses to pursue may be experienced differently by different King County communities, and moving forward, the County is committing to cultivating a more inclusive, cross-‐sector approach to shared decision-‐making and leadership on countywide solutions. See the Outreach and Engagement Section for more information.

AP
PE
ND
IX C
: Energy Strategy Details
137
APPENDIX C:Energy Strategy Details
KING COUNTY STRATEGIC CLIMATE ACTION PLAN

AP
PE
ND
IX C
: En
ergy
Str
ateg
y De
tails
KING COUNTY STRATEGIC CLIMATE ACTION PLAN APPENDIX C: ENERGY STRATEGY DETAILS138
Appendix C: Energy Strategy DetailsGoal Area 2: Buildings and Facilities Energy supplants the County’s 2010 Energy Plan. The County’s 2010 plan and prior energy plans have been guiding documents for the County’s internal energy efforts. As such, the plans have served as references for specific actions the County will undertake to meet energy related goals.
Given the breadth of information in the 2015 SCAP, the detail of past county energy plans, and the need for specific directions to guide much of the county’s energy work, this Appendix has been developed to expand the goals included in the body of the SCAP. Where relevant to a specific topic, the specific actions and guidance provided in this appendix should be considered a roadmap of actions and work that guides County government agencies to advance their energy conservation efforts. This appendix focuses on energy work related to County facility energy use. Energy issues related to transportation fuels can be found in Goal Area 1: Transportation and Land Use.
Strategy A.1: Energy Plans
➤ All County agencies that consumed an average of 50,000 or greater MMBTU per year in buildings between 2012 and 2015 shall develop energy reduction plans by January 1, 2017. Such plans shall be no more than five years old and shall be updated at least every five years. As of 2015, this strategy impacts the Facilities Management, Transit and Wastewater Treatment Divisions. Energy Plans shall detail key actions, implementation strategies, barriers, and methods for how the agency will contribute to the County’s 2025 energy reduction goal. Among other details, the Energy Plans shall include sections addressing site facility assessments/audits, as well as facility recommissioning, generally following the guidance in Strategies A.2 and A.3.
Strategy A.2: Energy Site Assessments
This strategy concerns County agencies that use less than 50,000 MMBTU of energy per year.
• By December 31, 2017, and no longer than every seven years thereafter, conduct and/or update investment grade (level III) energy efficiency audits of all County buildings and facilities that consumed more than 5,000 MMBTU annually, on average, between 2012 and 2015.
• The energy site assessments are to be used to guide future energy investments at energy intensive facilities and shall detail cost-effectiveness information for all identified efficiency actions in impacted facilities.
• Per Ordinance 16927, conduct a level II energy audit for facilities at which capital projects valued over $250,000 are planned that impact any portion of the mechanical or lighting system, if such an audit has not been completed within the previous seven years.
Strategy A.3: Energy Recommissioning
This strategy concerns County agencies that use less than 50,000 MMBTU of energy per year.
Recommissioning is a process that seeks to improve how an existing building’s mechanical and electrical equipment and systems function together. The process can resolve problems that occurred during design or construction, or address problems that have developed throughout the building’s life due to changes in the use or occupancy of the facility. Recommissioning improves a building’s operations and maintenance (O&M) procedures to enhance overall building performance.
• Within two years after the completion of construction and no less frequent than every five years, King County will carry out an energy recommission of all facilities that use more than 5,000 MMBTU per year. Such recommissioning shall include comprehensive analysis of facility lighting, envelope, controls, heating/cooling equipment, operations and historical consumption data to ensure each impacted facility is operating efficiently.

AP
PE
ND
IX C
: Energy Strategy Details
139KING COUNTY STRATEGIC CLIMATE ACTION PLAN APPENDIX C: ENERGY STRATEGY DETAILS
• Facilities that use equal or less normalized energy than the previous comparison baseline (five years prior and previous year) and facilities with real-time energy monitoring are considered to have met this recommissioning requirement.
Strategy A.4: Source vs. Site Energy Use
Currently, King County monitors energy consumption of its facilities based upon a ‘site energy use’ approach. Such tracking does not take into consideration the full environmental impact of resource use, such as the inefficiencies of electricity generation at the source facility and through transmission system to the end use. For example, a ‘site energy use’ approach does not take into consideration the fuel needed to generate the electricity at a power plant (e.g. a coal or gas fired power plant), whereas a ‘source energy’ approach factors in generation energy input and transmission losses.
➤ Beginning in 2016, King County’s energy tracking shall be calculated using a source energy approach to align with measurements in the EPA Portfolio Manager tool and the DOE Better Buildings Challenge.
Strategy A.5: Energy Investment Cost Effectiveness
Reducing energy use and expanding the generation of renewable energy will require continued investments. While technology exists today to reduce the County’s energy use by 50 percent or more, it is essential to consider the cost-effectiveness of projects to ensure the County expends its limited financial resources wisely.
➤ By December 31, 2016, King County shall adopt cost effectiveness criteria for investments in resource-using and renewable energy generating equipment. The criteria shall provide guidance for when to make investments in replacement equipment for resource efficiency purposes, and when project managers and staff are expected to secure and expend additional dollars for capital projects, with a goal of minimizing resource-using equipment life cycle cost effectiveness to the County, using Ordinance 16927 as a guiding document.
Strategy A.6: Capital Project Energy Performance
In addition to meeting the County’s requirements for the internal Sustainable Infrastructure Scorecard, Leadership in Energy and Environmental Design (LEED) or other green building requirements, all capital and major maintenance projects that trigger energy code requirements shall meet the prescriptive or modeled energy code requirements of the most stringent city energy code within the county. As of 2015, the most stringent energy code is the City of Seattle’s code.
Strategy A.7: Prioritization of Energy Projects
Energy efficiency and renewable energy projects provide carbon reduction and other environmental benefits. While carbon reduction benefits are clear when electricity generation is carbon-based (e.g. coal or natural gas generation), there are also greenhouse benefits associated with reducing energy consumption from “greenhouse gas neutral utilities”, such as Seattle City Light . Reducing electricity use in Seattle City Light’s territory both “frees up” that resource to be sold to other utilities and/or reduces natural gas and coal power market purchases.
From the direct perspective of carbon attributed to County government operations, there is a distinct need to reduce the carbon intensity of the electricity consumed by King County government, in order to meet greenhouse gas reduction goals. Due to the carbon intensity of Puget Sound Energy’s electricity generation portfolio, King County will:
➤ Prioritize electrical renewable energy projects in the service territory of buildings served by Puget Sound Energy, unless financially advantageous opportunities arise in other areas.

AP
PE
ND
IX C
: En
ergy
Str
ateg
y De
tails
KING COUNTY STRATEGIC CLIMATE ACTION PLAN APPENDIX C: ENERGY STRATEGY DETAILS14O
➤ Prioritize electric energy efficiency projects to be completed first in Puget Sound Energy’s service territory, when a County agency does not have other prioritization for the completion of specific efficiency projects and has the need to prioritize projects.
Strategy A.8: Technologies to be avoided
Dictating the use of specific energy equipment technologies has the potential to limit creative design and potentially to create an unanticipated outcome of increased energy use, if newer technological advances do not fit the prescribed standards. However, advancing technological improvements are making some older or inefficient technologies obsolete or unattractive from a life-cycle perspective. As such, technologies to be avoided are listed, rather than technologies to be embraced. Construction and remodel projects shall:
• Not include any lighting with an efficacy of under 95 lumens per watt.
• Not include combustion heating systems with combustion efficiency of under 86 percent, as engineered for the reference project, or electric heating with a Coefficient of Performance of under 2.5, unless the total space to be heated with such equipment is under 400 square feet.
• Not waste available “waste energy” and shall have heat recovery of 50 percent or greater, for ventilated spaces with both over 5,000 cubic feet per minute (CFM) and 70 percent or greater outside air requirements, where allowed by code.
• Shall as appropriate integrate wording into construction and procurement documents to ensure these strategies are followed.
Strategy A.9: Energy Star Appliances
• All appliance purchases by King County government shall be Energy Star qualified appliances, if an Energy Star rating is available for the type of appliance.
• To ensure both safety and resource efficiency, employees are not allowed to bring, or accept for donation, heaters or other electrical appliances for use in County facilities, unless specifically approved by the county. When an energy-using device is deemed necessary for an employee’s comfort or to perform his/her work, appliances will be purchased by County agencies and shall be Energy Star qualified, if an Energy Star category exists. The Procurement and Payable Section of the Department of Executive Services and the Department of Natural Resources and Parks will work to ensure compliance with this strategy.
Strategy A.10: Greenhouse Gas Emissions and Purchased Energy Use Cap
Replacement and/or upgrades of existing facilities and construction of new County facilities are large drivers of total County GHG emissions and energy use, offsetting some of the significant County government energy reductions that have been made in recent years.
• Remodeled or replaced facilities shall consider the former (baseline) facility as the total energy budget for the new facility, on a total GHG and BTU basis.
• Additional GHG emissions can be consumed for the new facility operation, if the outcome of the completed facility results in equal or a net reduction in GHG emissions on a regional basis (e.g. a more energy intensive transfer station that increases recycling and results in a net GHG emissions reduction from the materials recycled).
• Additional energy use, on a BTU basis, can be consumed if the facility project meets one of the following criteria:
• Reduces total net County energy use on a BTU basis (e.g. a transfer station compactor that measurably reduces truck fuel consumption).

AP
PE
ND
IX C
: Energy Strategy Details
141KING COUNTY STRATEGIC CLIMATE ACTION PLAN APPENDIX C: ENERGY STRATEGY DETAILS
• Pays for energy efficiency work equal to the additional energy use in other County facilities in the same division, on a BTU basis.
• Does not purchase such additional power from an electricity provider and generates any additional power beyond the cap through onsite or through funding of other County-owned renewable energy generation.
• Meets regulatory requirements for odor control.
• If the energy per unit of work is equal to or less than the baseline (e.g. a wastewater pump station that has greater wastewater flow, but reduced energy per unit pumped).
• After the first year of operation, remodeled or replaced facilities that exceed the calculated GHG and/or energy use cap, after factoring in any efficiency work paid for by the project per the bullet above, shall either 1) pay for energy reduction projects that will provide an equal or greater reduction in energy use above the cap within that agency, or 2) purchase carbon neutral offsets for all GHG emissions above the cap.
Strategy A.11: Occupied Leased Facilities
• Beginning in 2017, when consistent with the operational needs of the function, King County shall seek to lease facilities, for leases of employee occupied space of longer than five years, which are certified through the LEED rating system level of silver or higher or are Energy Star Certified. Facilities that do not meet these standards can be leased by the County if plans and funding are in place at the time of signing that will enable a facility to meet this standard within 24 months of lease signing.
Strategy A.12: Renewable Energy Generation and Use
• King County will set renewable energy generation targets and track progress toward such targets at the Cedar Hills Regional Landfill and at the Wastewater Treatment Division’s Brightwater, South and West Point Treatment Plants. These targets are to help optimize use of available biogas for the most beneficial uses. Two targets should be tracked for each facility: Percent of total gas sent to beneficial end use vs. percent sent to flares, and percent utilization of the energy content of the biogas toward beneficial uses, as measured by available input BTU vs. BTU output.
Strategy A.13: Utility Partnerships
• Work with Puget Sound Energy, Seattle City Light and other utility companies to develop marketing and other partnerships that help connect county residents and businesses to utility education and inventive programs.
Strategy A.14: Community Partnerships
• Work with the non-profit sector and other regional stakeholders to develop energy retrofit programs that target comprehensive energy efficiency actions in the residential and commercial sectors.
Strategy A.15: Computer Energy Management
Staff from the Department of Natural Resources and Parks and the Department of Information Technology shall work together to ensure computer energy management tools are optimized for energy efficiency on all County computers.

KING COUNTY STRATEGIC CLIMATE ACTION PLAN APPENDIX C: ENERGY STRATEGY DETAILS142

AP
PE
ND
IX D
: Green Building Reporting
143KING COUNTY STRATEGIC CLIMATE ACTION PLAN APPENDIX D: GREEN BUILDING REPORTING
APPENDIX D:Green Building Reporting
KING COUNTY STRATEGIC CLIMATE ACTION PLAN

AP
PE
ND
IX D
: Gr
een
Build
ing
Repo
rtin
g
KING COUNTY STRATEGIC CLIMATE ACTION PLAN APPENDIX D: GREEN BUILDING REPORTING144
Appendix D: Green Building Reporting
County-Owned Capital Projects
The King County Green Building Ordinance 17709 (GBO) includes annual reporting on County-owned capital projects, including buildings and infrastructure. Reporting on green building efforts has improved consistently every year, even with a limited reporting system. Historically, reporting had been done with a paper-based system that did not have efficient capabilities to roll up countywide data for every reporting criteria. Hence, reporting results were limited to project compliance with utilizing the Leadership in Energy and Environment Design (LEED) Rating System or the Sustainable Infrastructure Scorecard, construction and demolition material diversion, and project profiles highlighting green building strategies, cost or resource savings.
As illustrated by the graphs below, countywide compliance in utilizing LEED or the Sustainable Infrastructure Scorecard have improved from 90 percent in 2011 to 98 percent in 2014.
0%
10%
20%
30%
40%
50%
60%
70%
80%
90%
100%
2011 2012 2013 2014
Project Compliance (Percentage of compliance Countywide)
-‐25
25
75
125
175
225
275
325
2011 2012 2013 2014
Num
ber o
f Projects
Total Number of Projects (By division)
Parks
WLRD
SWD
WTD
FMD
Transit
Airport
Roads

AP
PE
ND
IX D
: Green Building Reporting
145KING COUNTY STRATEGIC CLIMATE ACTION PLAN APPENDIX D: GREEN BUILDING REPORTING
The percentage of completed projects that achieved LEED Platinum in 2014 was 22 percent, however the majority of projects completed in 2014 were designed before King County’s new Platinum certification goal became a requirement in August 2014.
In preparation for the 2014 reporting cycle, annual reporting forms were improved to incorporate feedback from the Green Building Team and project managers to streamline reporting so it is less time consuming and more user friendly. Moving from a paper-based reporting form to an Excel/Access database enables for the rolling up countywide results for each reporting criteria referenced in the GBO. This is a significant accomplishment that allows for communicating quantitative data that was not available in previous years.
The matrix on the following page includes the 2014 Annual Green Building reporting results. Note that not all projects have water or energy related components, so it is understandable that some projects would not report on water or energy savings.
Refinements to the reporting system are ongoing. This is a temporary reporting system as efforts are underway to establish an institutional reporting system. With continued training and support to project managers, reporting data will steadily progress.
0%
10%
20%
30%
40%
50%
60%
70%
80%
90%
100%
2011 2012 2013 2014 2011 2012 2013 2014 2011 2012 2013 2014
DNRP DOT DES
Project Compliance (Percentage of compliance by department)
0
10
20
30
40
50
2014 2020
60
70
80
90
100
Green Building Platinum Certification
Target
% o
f com
plet
ed p
roje
cts
achi
evin
g LE
ED o
r Su
stai
nabl
e In
fras
truc
ture
Sc
orec
ard
Plat
inum
Cer
tific
atio
n

3
prefabricated elements, drought resistant native plants, heat island reduction, reused native soils,
equity and social justice efforts that address community and education.
O&M costs $14,400,000 53 out of 143 projects reported
Fiscal performance More data needed
Some projects reported narrative explanation, financial cost, financial
savings, so data reported could not be easily rolled up.
Projected and actual energy savings
measured
Projected from 30 percent Design projects: 3,100,000 MMBTU
45 out of 143 projects between 30 percent Design and Project
Completion Phases reported on projected energy savings.
Actual from completed projects: 1,800 MMBTU
25 out of 102 completed projects reporting on actual energy savings
Note: Projects reporting on projected savings are different from projects
reporting on actual savings, so “Projected” results are not expected
to be “Actual” results.
Projected and actual water savings
Projected from 30 percent Design projects: 3,005,000 gallons per year
32 out of 143 projects between 30 percent Design and Project
Completion reporting on actual water savings
Actual from completed projects: 10,000 gallons per year
48 out of 102 completed projects reporting on actual water savings
Note: Projects reporting on projected savings are different from projects
reporting on actual savings, so “Projected” results are not expected
to be “Actual” results.
C&D diversion percentage and
tonnage
For completed projects: 33,300 tons diverted. Average of 71 percent diversion rate.
Data is for completed projects only.
31 out of 102 completed projects reported on actual C&D diversion.
Actual EPP used Low/No VOC paints, Low/No sealants and
adhesives, high recycled content carpet, green cleaning products.
Strategies listed were included in one or multiple projects. Some projects
could have implemented each of the strategies, but not all strategies listed
were included in each project.
Project and actual GHG savings Actual from completed projects: 800 MTCO2e 26 out of 102 completed projects
reporting on actual emissions savings.
AP
PE
ND
IX D
: Gr
een
Build
ing
Repo
rtin
g
KING COUNTY STRATEGIC CLIMATE ACTION PLAN APPENDIX D: GREEN BUILDING REPORTING146
2
In preparation for the 2014 reporting cycle, annual reporting forms were improved to incorporate feedback from the Green Building Team and project managers to streamline reporting so it is less time consuming and more user friendly. Moving from a paper-‐based reporting form to an Excel/Access database enables for the rolling up countywide results for each reporting criteria referenced in the GBO. This is a significant accomplishment that allows for communicating quantitative data that was not available in previous years. The matrix below includes the 2014 Annual Green Building reporting results. Note that not all projects have water or energy related components, so it is understandable that some projects would not report on water or energy savings. Refinements to the reporting system are ongoing. This is a temporary reporting system as efforts are underway to establish an institutional reporting system. With continued training and support to project managers, reporting data will steadily progress.
2013 GBO Reporting Criteria 2014 Green Building Reporting Results Notes
Total number of capital projects 303
This is the total number of capital projects applicable to the Green
Building Ordinance.
Total number of LEED projects 9
Total number of Scorecard projects 294
Total number of alternative rating system projects
0
Alternative Rating Systems include Living Building Challenge, Built Green
4 Star or higher, Salmon Safe, Sustainable Sites, or Evergreen
Sustainable Development Standard.
Additional costs associated with achieving LEED
certification
$738,000
Data from the 2 completed LEED projects only
Total number of projects using IP 179 IP is Integrative Process
Green Building strategies
Commissioning, high efficiency VRF System, sub-‐metering and measurement, low flow plumbing
fixtures, LED lighting, C&D diversion, recycled content materials, regional materials, low
emitting materials, green specifications, reused furniture, plant salvage, habitat restoration,
integrative process, salvaged and reused building materials, alternative fuel use, LID,
Strategies listed were included in one or multiple projects. Some projects
could have implemented each of the strategies, but not all strategies listed
were included in each project.

AP
PE
ND
IX D
: Green Building Reporting
147147KING COUNTY STRATEGIC CLIMATE ACTION PLAN APPENDIX D: GREEN BUILDING REPORTING
3
prefabricated elements, drought resistant native plants, heat island reduction, reused native soils,
equity and social justice efforts that address community and education.
O&M costs $14,400,000 53 out of 143 projects reported
Fiscal performance More data needed
Some projects reported narrative explanation, financial cost, financial
savings, so data reported could not be easily rolled up.
Projected and actual energy savings
measured
Projected from 30 percent Design projects: 3,100,000 MMBTU
45 out of 143 projects between 30 percent Design and Project
Completion Phases reported on projected energy savings.
Actual from completed projects: 1,800 MMBTU
25 out of 102 completed projects reporting on actual energy savings
Note: Projects reporting on projected savings are different from projects
reporting on actual savings, so “Projected” results are not expected
to be “Actual” results.
Projected and actual water savings
Projected from 30 percent Design projects: 3,005,000 gallons per year
32 out of 143 projects between 30 percent Design and Project
Completion reporting on actual water savings
Actual from completed projects: 10,000 gallons per year
48 out of 102 completed projects reporting on actual water savings
Note: Projects reporting on projected savings are different from projects
reporting on actual savings, so “Projected” results are not expected
to be “Actual” results.
C&D diversion percentage and
tonnage
For completed projects: 33,300 tons diverted. Average of 71 percent diversion rate.
Data is for completed projects only.
31 out of 102 completed projects reported on actual C&D diversion.
Actual EPP used Low/No VOC paints, Low/No sealants and
adhesives, high recycled content carpet, green cleaning products.
Strategies listed were included in one or multiple projects. Some projects
could have implemented each of the strategies, but not all strategies listed
were included in each project.
Project and actual GHG savings Actual from completed projects: 800 MTCO2e 26 out of 102 completed projects
reporting on actual emissions savings.
In 2014, 296 out of 303 county-owned capital projects, resulting in 98 percent, are using the LEED Rating System or the Sustainable Infrastructure Scorecard. These projects include both buildings and infrastructure that vary from equipment replacement, road overlay programs, trails, habitat restoration, wastewater pump stations, new transfer stations, building renovations, bus shelters, to hanger demolitions and more.
The latest green building practices are being implemented, including diverting 33,267 tons and an average of 71 percent of construction and demolition materials from going to landfills from completed projects. This equates to 800 MTCO2e in GHG emission savings which is equivalent to 90,000 gallons of gasoline consumed. Incorporating green building and sustainable development in our county projects result in increased energy and water efficiency, improved indoor air quality and stormwater management, better selection of sustainable local materials, reduction of waste and lower GHG emissions.
Below is a small sample of projects illustrating the diversity in the County’s capital asset portfolio as well as environmental and community benefits.
Project Highlights
• The King County Metro South Kirkland Park and Ride (SKPR) Transit Oriented Development (TOD) project transformed an existing surface park and ride lot into a large mixed use residential and retail sustainable development community, innovatively using the King County Sustainable Infrastructure Scorecard, the Evergreen Sustainable Development Standards and the Built Green rating system to achieve green building efforts that reflect the diversity in building types. Multiple benefits include increased parking availability with a new

AP
PE
ND
IX D
: Gr
een
Build
ing
Repo
rtin
g
KING COUNTY STRATEGIC CLIMATE ACTION PLAN APPENDIX D: GREEN BUILDING REPORTING148
530 stall garage and a new transit facility; 58 affordable housing units, and 183 market rate housing units, open space areas, improved neighborhood pedestrian and bicycle connections, a 30 percent reduction of site lighting, and a 48 percent reduction in building lighting.
• The Medic One Administration Relocation Project is a tenant improvement of space for relocating Medic One Administration Offices in collaboration with Kent Fire Department Regional Fire Authority. The project used low or no VOC paints, high recycled content materials, environmentally preferable products, polished concrete slab, reused materials onsite, and diverted 98 percent Construction and Demolition materials. The NPV of this transaction, measured over ten years, was a positive $1,507,000.
• The Regional Trail System Surface Repair Program repairs deteriorating trail subgrade or asphalt as needed re-using crushed asphalt material on site and recycled asphalt pavement used in hot mix asphalt batches. The actual recycled waste diversion was 100 percent totaling 1,300 tons.
• The Water and Land Stormwater Capital Monitoring and Maintenance Program includes native revegetation, placement of large woody debris, monitoring and reporting as the key program elements. The sustainable strategies include use of hand crews with hand tools only instead of fuel based equipment to do maintenance of the monitoring sites; salvaged plants used on site; native plants used and maintained; no herbicides or pesticides used; whole crew carpooled in one vehicle to sites to reduce transportation impacts; and composting was done on site for onsite use. No irrigation systems were installed because no watering was needed for native drought tolerant plants, saving 10,000 gallons of water a year.
• The Sunset/Heathfield Pump Station Replacement and Forcemain Upgrade Project will help ensure that the Wastewater Treatment Division maintains the ability and capacity to convey South Lake Sammamish Planning Basin. Sustainability strategies include an equity and social justice plan, sustainable materials and waste management, energy efficiency in all systems, exemplary corrosion control for system longevity, potable water efficiency, green roof, habitat enhancement, interpretive signage, and climate change risk mitigation. This is the first of three projects to pilot using the Envision Rating System in combination with WTD Scorecard enhancing their green building efforts.
• The Bridge Priority Maintenance Program includes repair and maintenance of King County bridges, and certain city or other agency bridges under contract. The program includes cleaning, washing, replacement of superstructure and substructure elements, expansion joint repair, paving, overlay, and abutment and approach repairs. The sustainable strategies include implementing construction best management such as erosion and sediment control, recycling of construction materials, on-site re-use of materials, reduction of water use for dust control, use of sustainable materials, and applied water management.

AP
PE
ND
IX E
: Climate Program
Costs and Benefits
149149KING COUNTY STRATEGIC CLIMATE ACTION PLAN APPENDIX E: CLIMATE PROGRAM COSTS AND BENEFITS
APPENDIX E:Climate Program Costs and Benefits
KING COUNTY STRATEGIC CLIMATE ACTION PLAN
149
AP
PE
ND
IX E
: Cl
imat
e Pr
ogra
m C
osts
and
Ben
efits
KING COUNTY STRATEGIC CLIMATE ACTION PLAN APPENDIX E: CLIMATE PROGRAM COSTS AND BENEFITS15O
Appendix E: Climate Program Costs and BenefitsThe 2015 SCAP serves as and meets the requirements for King County’s 2014 consolidated environmental report. Per King County Code 18.50, and consistent with King County Ordinance 17270, this appendix includes information about all expenses associated with the climate change program and a cost-benefit analysis of the program. Additionally, Section One of the 2015 SCAP includes the Pilot Cost Effectiveness Assessment which assessed the cost effectiveness of a selection of SCAP GHG emissions reduction strategies.
Approach and Cost of Climate Change Program
The King County Comprehensive Plan includes policies directing King County to reduce greenhouse gas (GHG) emissions, prepare for climate change impacts, measure this work, and collaborate with others on solutions. King County’s Strategic Plan includes the objective to “reduce climate pollution and prepare for the impacts of climate change on the environment, human health, and economy.”
The 2015 SCAP synthesizes and focuses King County’s most critical goals, objectives, and strategies to reduce greenhouse gas emissions and prepare for the effects of climate change. The Comprehensive Plan, Strategic Plan, and SCAP guide King County’s efforts as they relate to climate change.
The County’s climate change efforts are led out of the Department of Natural Resources and Parks (DNRP). The 2014 expenditure for the two staff positions focused on climate change was approximately $220,000.
The actions needed to carry out climate-related Comprehensive Plan, Strategic Plan and SCAP goals and objectives intersect with the roles and work of multiple departments and divisions in King County. In order to integrate actions and pool technical resources across County agencies, the climate program staff works closely with several climate-focused teams supporting development and implementation of County directives related to climate change. These interdisciplinary teams bring together additional County staff focused on complementary tasks, such as those implementing the Energy Plan, the Green Building and Sustainable Development Program, the Waste Prevention and Recycling Program, the Environmental Purchasing Program, and those in Forestry and Agriculture programs.
The County also pools resources for climate-related technical assessments (e.g., GHG emissions inventories), public outreach, and program development with cities through the Sustainable Cities Roundtable, King County-Cities Climate Collaboration, and through professional associations such as Climate Communities and ICLEI-Local Governments for Sustainability. Membership in these types of organizations gives King County staff ready access to information on local government approaches to reducing climate pollution and preparing for climate changes, federal and state grant programs, and changing regulatory requirements. Dues for these organizations were approximately $25,000 in 2014.

AP
PE
ND
IX E
: Climate Program
Costs and Benefits
151151KING COUNTY STRATEGIC CLIMATE ACTION PLAN APPENDIX E: CLIMATE PROGRAM COSTS AND BENEFITS
Benefits of Climate Change Program
Supporting implementation of a climate change-related projects and programs, such as those highlighted in this report, have direct climate-related benefits, as well as other benefits, such as reducing water pollution, creating new local green jobs, and enhancing residents’ quality of life. Specific financial benefits include:
• Helping Secure Revenue to Support Related County Projects and Programs. For example, King County was awarded a $6.2 million Energy Efficiency and Conservation Block Grant from the U.S. Department of Energy (completed in 2012) which prioritized projects that reduce GHG emissions. King County used the grant to support 23 projects, such as energy efficiency retrofits of County facilities, electric vehicle infrastructure installations and planning efforts, and paying for energy efficiency components of affordable housing projects. Climate program-related employees were directly responsible for helping secure, administer and implement these and other revenue and grant sources.
• Increasing Efficiency of County Operations. Significant cost savings and new revenue sources have been achieved through climate related projects that reduce GHG emissions by minimizing energy, waste and resource expenditures and by creating new resources such as renewable energy. For example, King County has reduced energy use in government-owned facilities by more than 15 percent between 2010 and 2014, and in doing so has reduced operational resource costs by approximately $3 million annually through related projects.
• Mitigating Future Climate Change Impacts. A key benefit relates to minimizing and avoiding climate change risks by integrating climate change science into the planning and design of diverse projects and programs. For example, the Wastewater Treatment Division has been integrating data about sea level rise into wastewater infrastructure design and operations. While it is hard to quantify the financial value of making these forward-looking decisions, it is likely significant. For example, the Washington State Department of Ecology’s “Impacts of Climate Change on Washington’s Economy” concluded that if GHG emissions are not reduced and proactive steps to minimize impacts are not taken, the annual Washington state price tag of climate change impacts will be at least $3.8 billion by 2020.
There are other, less-quantifiable benefits related to climate solutions: County Council and Executive leadership on the issue, improving relations with King County cities through regional collaboration, improving the quality of life and health of our residents, helping residents and businesses save money on energy and resource costs, supporting community and business environmental and climate efforts, and achieving other environmental sustainability-related objectives.