Embed Size (px)
Citation preview
CLICC WEBINAR 3
EXPOSURE & TOXICITY, PREDICTIVE LIFE
CYCLE IMPACT ASSESSMENT,
UNCERTAINTY, AND APPLICATION OF
CLICC
10/7/2016
DINGSHENG LI, RUNSHENG SONG,
YUWEI QIN, JESSICA PERKINS, STEFANO CUCURACHI

CLiCC Webinar series
Webinar 1
9/14/2016
Life Cycle Inventory
Webinar 2
9/30/2016
QSAR, Release, Fate & Transport
Webinar 3
10/7/2016
Exposure & Toxicity, Predictive Life Cycle Impact Assessment, Uncertainty, application of CLiCC
All webinars are recorded and available for viewing on clicc.ucsb.edu

CLiCC project
U.S. EPA funded UCSB to develop a tool that can
rapidly estimate the environmental impacts of a
chemical life-cycle based on limited information

Exposure Module
Why do we need exposure models
Environmental
fate of chemicals
Human health
impact
assessment

Exposure Models
Far-field exposure models
Traditionally employed in life cycle impact assessment (LCIA)
Inhalation, ingestion
Near-field exposure models
Indoor exposure
Personal care products
Inhalation, dermal absorption
Internal organ specific exposure model
Use of physiologically based toxicokinetic (PBTK) model
Concentration of chemicals in various organs after exposure
Exposure Models
Input to exposure models
Concentration of chemicals in different media
Various parameters of physico-chemical properties
Output from exposure models
Total amount intake (kg/kgbodyweight)
Daily amount intake (kg/day, kg/kgbodyweight/day)
Intake fraction (kgintake/kgemitted)
Ready to assess health risk

Exposure Models
Far-field exposure models most suited for
Byproducts, pollutants, pesticides, etc.
No need to address indoor exposure/dermal exposure
Directly linked with CLiCC Fate & Transport module

Exposure Models
Near-field exposure models most suited for
VOCs that are released from products used indoors
Occupational setting
Directly applied to skins such as shampoo, lipsticks,
lotions, etc.
Linked with the CLiCC Release module

Exposure Models
1.00E-11
1.00E-10
1.00E-09
1.00E-08
1.00E-07
1.00E-06
1.00E-05
1.00E-04
1.00E-03
1.00E-02
1.00E-01
1.00E+00
Inta
ke f
ract
ions
(kg
inta
ke/k
gem
itte
d)
Exposure routes

Exposure Models
Internal organ specific models most suited for
Chemicals requires higher accuracy or dynamic of
exposure
Chemicals with richer physiological kinetic data

Exposure Models
TIME
Cw
etl
u
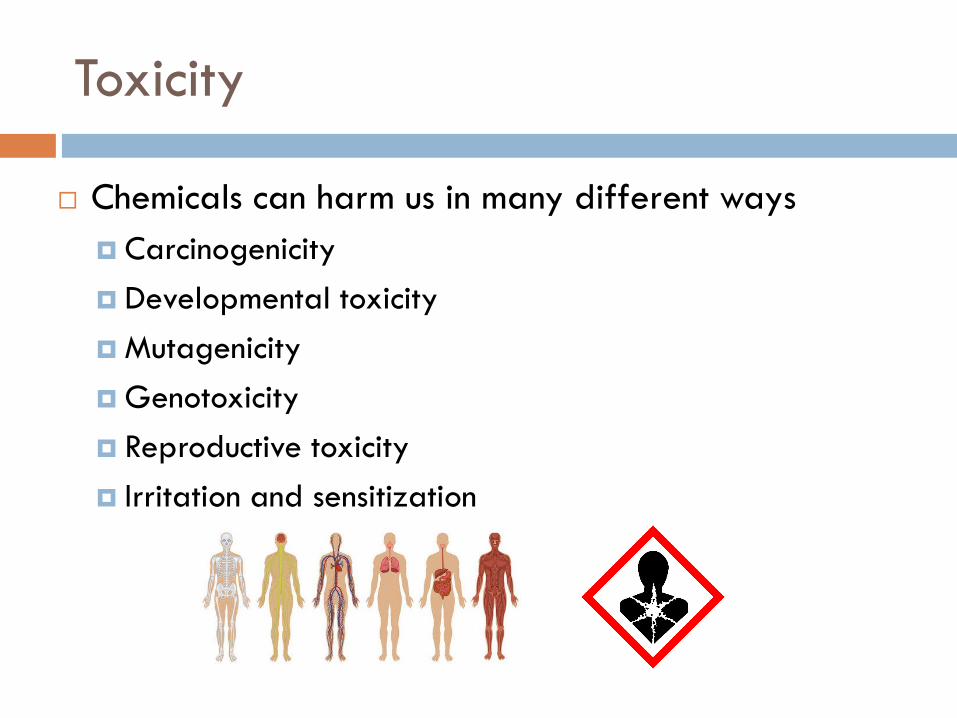
Toxicity
Chemicals can harm us in many different ways
Carcinogenicity
Developmental toxicity
Mutagenicity
Genotoxicity
Reproductive toxicity
Irritation and sensitization
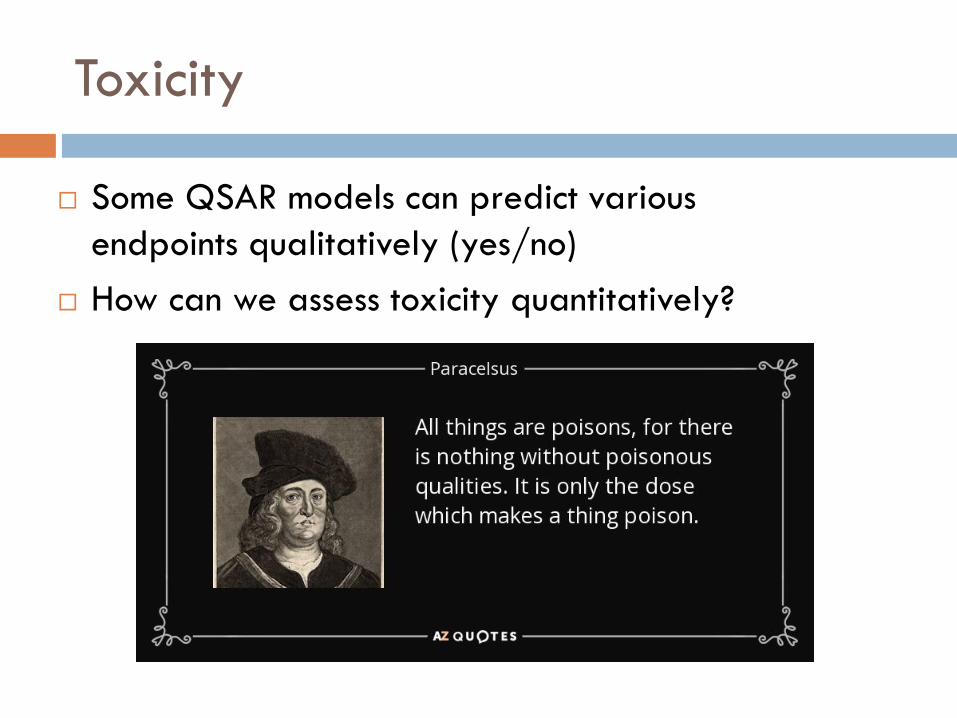
Toxicity
Some QSAR models can predict various
endpoints qualitatively (yes/no)
How can we assess toxicity quantitatively?

Toxicity
The dose-response relationship
NOAEL (no observed adverse effect level)
LOAEL (lowest observed adverse effect level)
ED50 (effective dose for 50% of population)
Toxicity
Effect factor, a metric to quantitatively describe
the toxicity of chemicals to human health. The
unit for EFhum is (cases/kgintake)
Based on the assumption of linear dose-
response relationship
EFhum = 0.5/ED50
Estimating ED50 is key

Toxicity
Epidemiology studies (tier 1)
Most ideal, but rare
Direct use of the slope factor observed in these
studies

Toxicity
Chronic animal studies (tier 2)
For carcinogenic effects
TD50 and EC50 based on animal tests, in mg/kg-day or mg/m3
BW, body weight (70 kg); LT, lifetime (70 years); N, days per year (365.25 days/year); Aft (correction factor for exposure duration, 2 for subchronic, 5 for acute)
6
,,50
,5010
ta
ingestionta
ingestionhAFAF
NLTBWTDED
6
,,50
,5010
ta
inhtainhh
AFAF
NLTINHECED
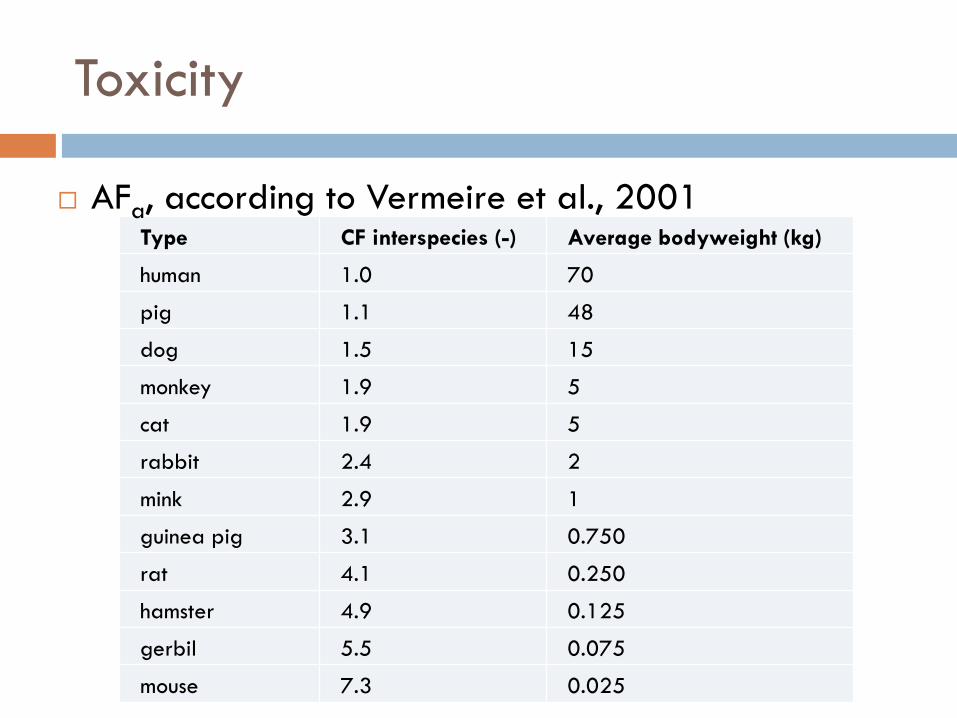
Toxicity
Type CF interspecies (-) Average bodyweight (kg)
human 1.0 70
pig 1.1 48
dog 1.5 15
monkey 1.9 5
cat 1.9 5
rabbit 2.4 2
mink 2.9 1
guinea pig 3.1 0.750
rat 4.1 0.250
hamster 4.9 0.125
gerbil 5.5 0.075
mouse 7.3 0.025
AFa, according to Vermeire et al., 2001

Toxicity
Chronic animal studies (tier 2)
For non-carcinogenic effects
6,5010
9
ta
ingestionhAFAF
NLTBWNOELED
6,5010
25.2
ta
ingestionhAFAF
NLTBWLOELED
6,5010
9
ta
inhhAFAF
NLTINHNOECED
6,5010
25.2
ta
inhhAFAF
NLTINHLOECED

Toxicity
Acute animal studies (tier 3)
More data available with LD50 (dose lethal to 50%
population)
Regression model to extrapolate from acute to
chronic
Cancer effect Non-cancer effect
Exposure & Toxicity
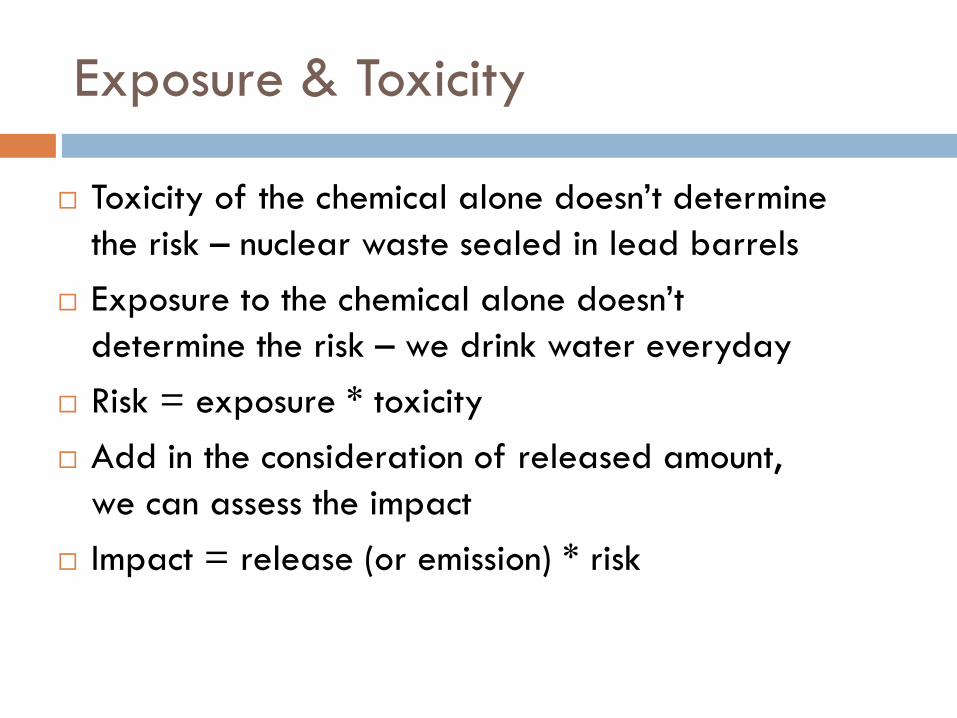
Toxicity of the chemical alone doesn’t determine
the risk – nuclear waste sealed in lead barrels
Exposure to the chemical alone doesn’t
determine the risk – we drink water everyday
Risk = exposure * toxicity
Add in the consideration of released amount,
we can assess the impact
Impact = release (or emission) * risk

Predictive Life Cycle Impact Assessment
LCIA

User might unable to provide key inputs for other
modules in CLiCC. Or they are confidential.
Alternative path to estimate mid-point characterized
results (GWP) and end-point characterized results
(human health) based on very simple inputs.
Predictive Life Cycle Impact Assessment

Learning from Molecular Structure
How do we know the life-cycle impacts with simple inputs?
Chemical structure is correlated with its properties and impacts.
Might consume more
energy
…than this
Higher global warming
impact…than this

Learning from Molecular Structure
Chemical structure can be presented by molecular
descriptors. (MW, Num. Carbon…) Build regression model to predict the characterized results.
Vapor
Pre
ssure
Molecular WeightMolecular Weight
Eco
-Toxic
ity
A Nonlinear regression model: Artificial Neural Network (ANN).
More complicate than liner regression, better predictive power.
25

Artificial Neural Networks

Model Development Procedure
LCI
Databases
Chemical
Databases
SMILEs
DRAGON
6
Chemical
DescriptorsCharacterized
results
Test Data
Training
Data
Trained ANN
Model
Model
Validation
Prediction
Results
New Chemicals
27
166 reported characterized results collected
from Ecoinvent 3.01; Chemical Identifier
(SMILEs) come from ChemSpider
Chemical Descriptors calculated by Dragon
6.0
Filter Feature Selection algorithm reduces
descriptors from 4,000 to 30
Cross-Validation to achieve the best ANN
structures
Available impact categories are: CED,
acidification, GWP, human health, ecotoxicity
and ecosystem quality.

Model Performance -- CED
Only testing
chemicals
All chemicals
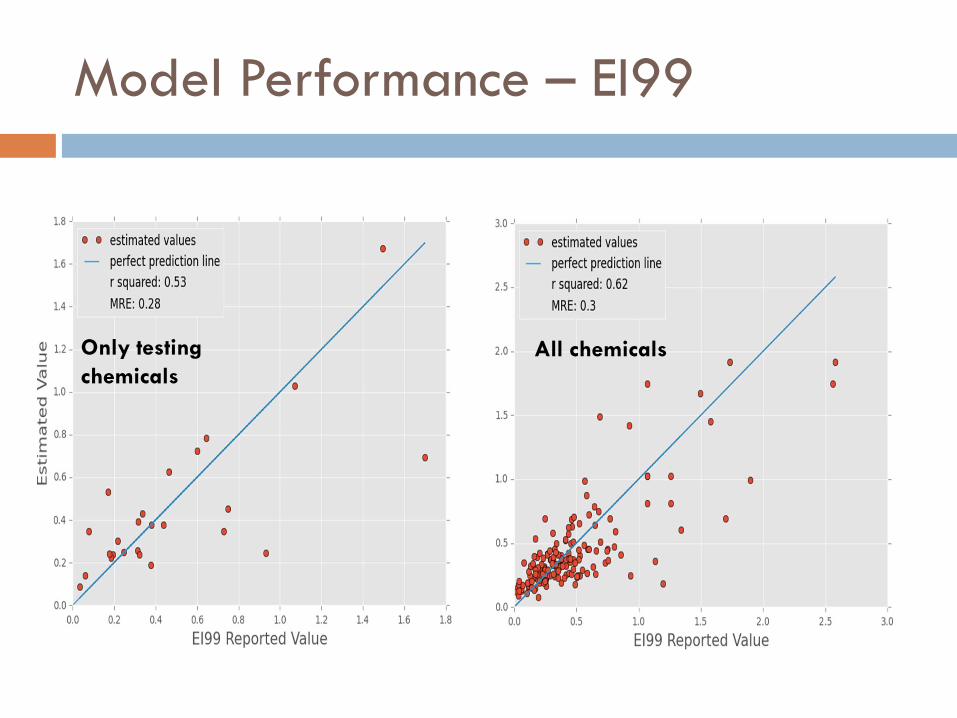
Model Performance – EI99
Only testing
chemicals
All chemicals
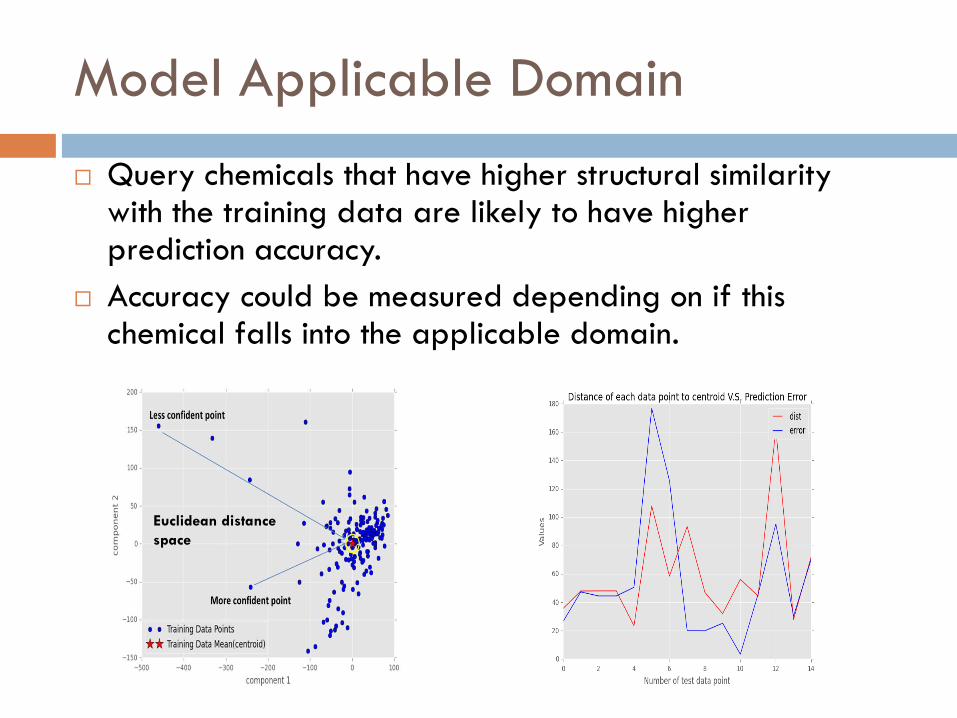
Model Applicable Domain
Query chemicals that have higher structural similarity with the training data are likely to have higher prediction accuracy.
Accuracy could be measured depending on if this chemical falls into the applicable domain.
Euclidean distance
space

Model Applicable Domain
ModelSelected Cut-off
Threshold
MRE inside
AD
MRE outside
AD
Sample Size
inside AD
Sample Size
outside AD
CED 100 14% 26% 23 2
Eco-Indicator 60 23% 35% 4 21
Acidification 110 21% 46% 21 4
GWP 100 48% 89% 19 6
Human Health 90 40% 60% 16 8
Ecosystem Quality 60 49% 82% 7 17

Conclusions & Future Outlooks
We developed a model to screening chemical life-
cycle impact using molecular structure information.
Three mid-points and three end-points impact
categories are available at this point.
Model applicable are characterized.
Increase the number of predictable impact
categories.
Collect more chemical LCI data as training dataset.

Uncertainty
Production
Module
Predicted
LCI
Release
Module
F&T
Module
Background
LCI DB
emissions
use & eol
emissions
PChem
DB & QSARs
Module
Toxicity Risk
Module
Toxicity
DB & QSARs
Module
Chem
Structure
conc. &
exposure
CFs
Geog.
DB
scenarios
LCIA
Calculation
Module
human &
eco tox CFs
tox
risk
F & T
param.
Energy, water, solvents
Visualization
Module
Indirect & external CFs
Chem
Structure
User
Info
reactions
kinetics
conditions
production
rates
(market size)
Uncertainties - How to treat them?
Collect data
Estimate a distribution or uncertainty range for each
input
Apply Monte Carlo method or similar tools to
simulate uncertainty
Alternative approach: analytical solutions

Uncertainty – Monte Carlo simulation
Probability Distribution of the output

Uncertainty – A conceptual model
Output

Uncertainty- A model with uncertain
parameters

Global Sensitivity Analysis
To understand the model structure and the input-
output relationships
To identify major contributors to output uncertainty
in the uncertain inputs space
We use a global approach, varying all inputs
simultaneously considering their full distribution

We perform them jointly

Joint uncertainty and sensitivity
analysis

Uncertainty – Applied to the Fate and
Transport model
Production
Module
Predicted
LCI
Release
Module
F&T
Module
Background
LCI DB
emissions
use & eol
emissions
PChem
DB & QSARs
Module
Toxicity Risk
Module
Toxicity
DB & QSARs
Module
Chem
Structure
conc. &
exposure
CFs
Geog.
DB
scenarios
LCIA
Calculation
Module
human &
eco tox CFs
tox
risk
F & T
param.
Energy, water, solvents
Visualization
Module
Indirect & external CFs
Chem
Structure
User
Info
reactions
kinetics
conditions
production
rates
(market size)

Uncertainty – Applied to the Fate and
Transport model

Uncertainty – Model inputs
Meteorological Data (e.g. precipitation,
temperature)
Water (e.g. pH, salinity)
Soil (e.g. soil type, land use)
Chemical Characteristics (e.g. half-life from QSARs)

Uncertainty – Model output

Uncertainty – Results for the
concentration in freshwater
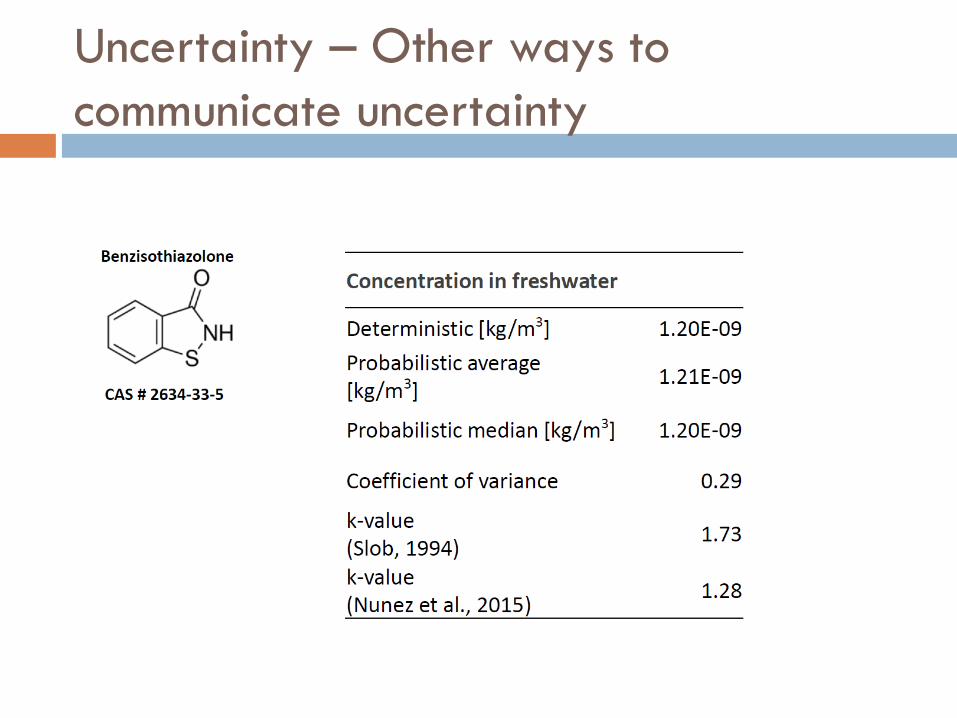
Uncertainty – Other ways to
communicate uncertainty

Uncertainty – Other ways to
communicate uncertainty
Low uncertainty
High uncertainty

Global Sensitivity analysis

Global Sensitivity analysis
>95%

We provide users with a complete set
of information together with the results
About the input-output relationships
About the output distribution
About the major contributors to the output
uncertainty
Default uncertainty values can be updated by the
user if better information is available

Application of CLiCC

Industry Partners
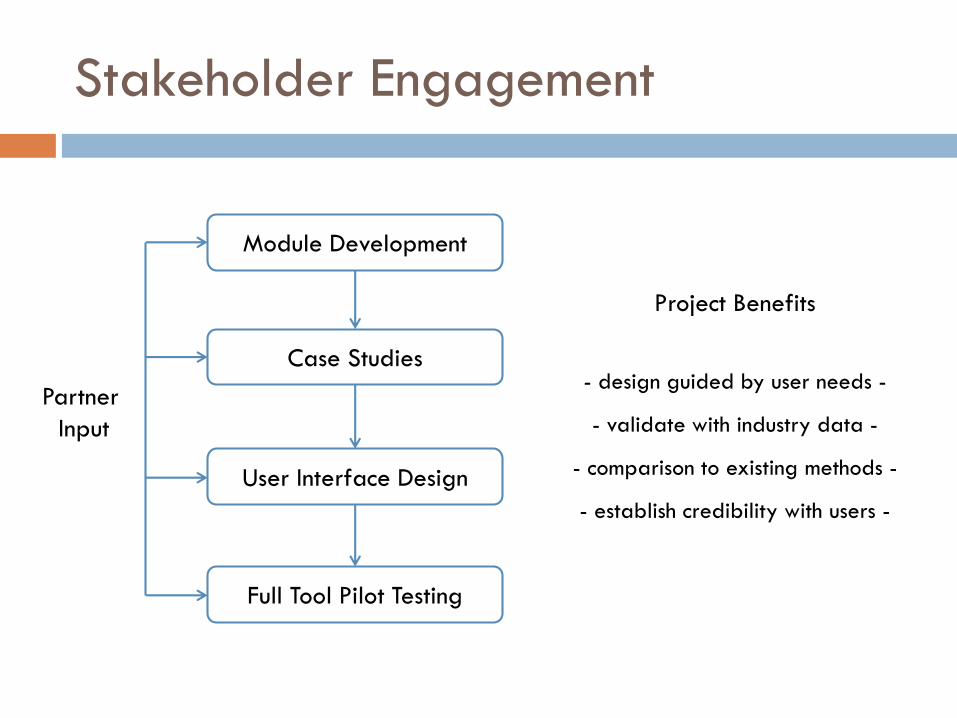
Stakeholder Engagement
Module Development
Case Studies
User Interface Design
Full Tool Pilot Testing
Partner
Input
Project Benefits
- design guided by user needs -
- validate with industry data -
- comparison to existing methods -
- establish credibility with users -

What is a case study?
A test case for the CLiCC tool using inputs/data
from an industry partner
Can include all the tool’s modules or an isolated
combination of several modules
Can analyze one chemical, a group of chemicals, or
an entire product with the chemical formulation
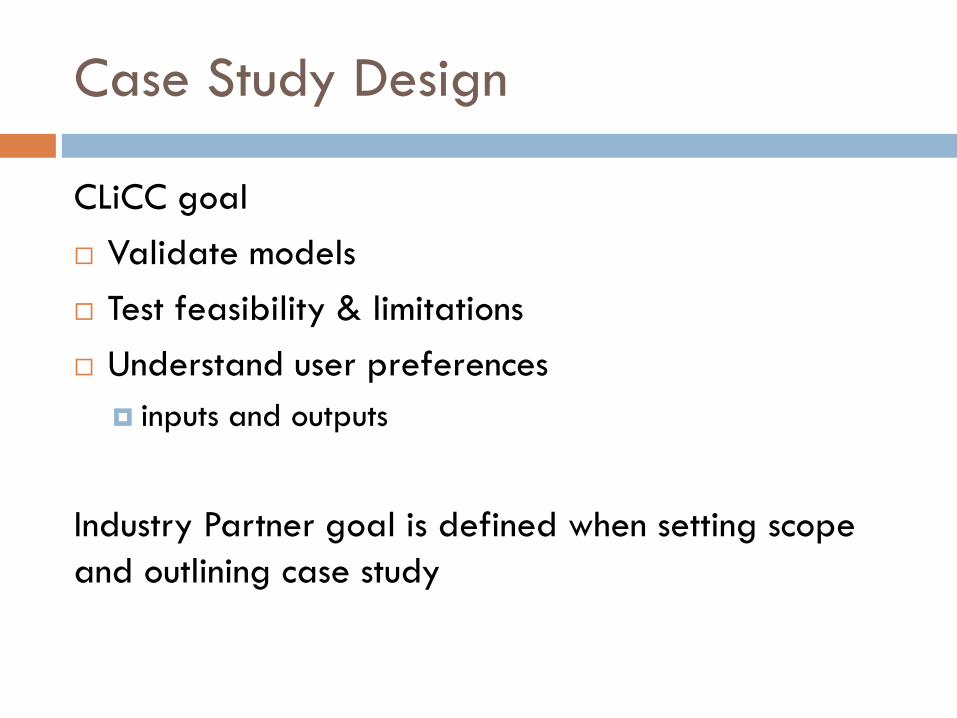
Case Study Design
CLiCC goal
Validate models
Test feasibility & limitations
Understand user preferences
inputs and outputs
Industry Partner goal is defined when setting scope
and outlining case study

Case Study Example
Industry Partner Sherwin-Williams
Product Type Interior Paint (coating)
Release
Assumptions
(1) To WWTP from brush washing
(2) To interior air after application

59
Sherwin-Williams Case Study Scope

Input/Output Module Flow60

Upstream Impacts
Cumulative Energy Demand
Water Demand
Ecotoxicity
Acidification Impact
Ecoindicator 99, total
ODE (impact 2002+, LCIA)
Uncertainty is presented as a “low” (within 30% of actual value) or “high” value
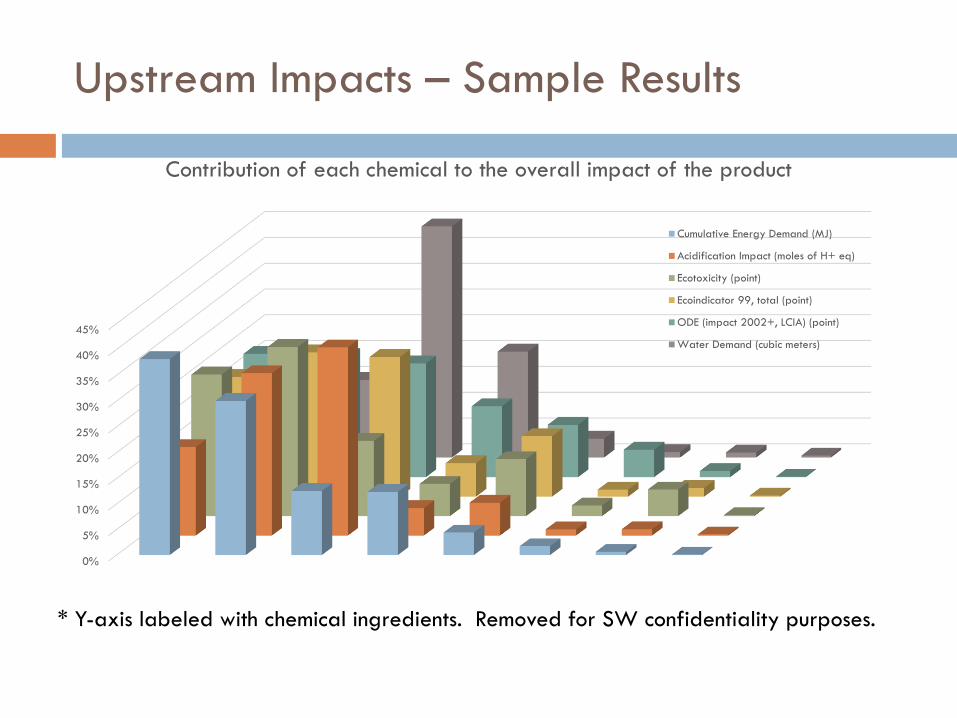
Upstream Impacts – Sample Results
0%
5%
10%
15%
20%
25%
30%
35%
40%
45%
Contribution of each chemical to the overall impact of the product
Cumulative Energy Demand (MJ)
Acidification Impact (moles of H+ eq)
Ecotoxicity (point)
Ecoindicator 99, total (point)
ODE (impact 2002+, LCIA) (point)
Water Demand (cubic meters)
* Y-axis labeled with chemical ingredients. Removed for SW confidentiality purposes.
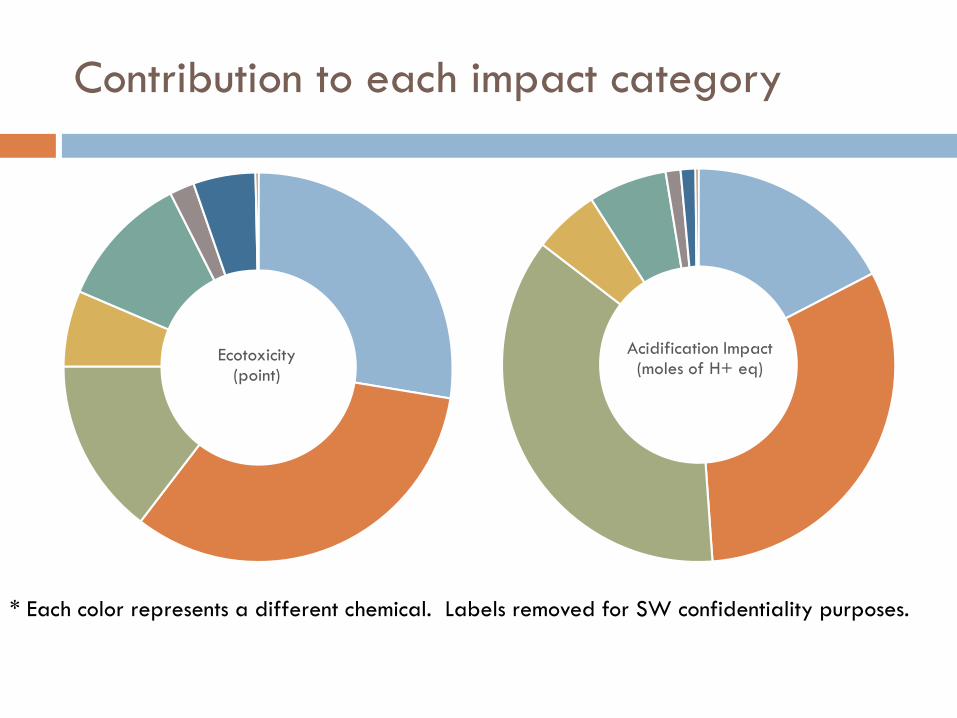
Contribution to each impact category
Ecotoxicity(point)
Acidification Impact(moles of H+ eq)
* Each color represents a different chemical. Labels removed for SW confidentiality purposes.

Downstream Impacts
Use Phase – Applying the Coating
Indoor Air Release
Fate & Transport in 6 Different US Environments
Human Exposure Assessment
Release to WWT
Human Health Impact Estimate
Ecotoxicity Evaluation

Fate & Transport Results
*labels removed for SW confidentiality

*labels removed for SW confidentiality
Fate & Transport Results

67
Daily concentration of Chemical “X” in New York City
Fate & Transport Results

Fate & Transport Uncertainty Results
*labels removed for SW confidentiality

Ecotoxicity Results
Freshwater Species Analysis
*labels removed for SW confidentiality
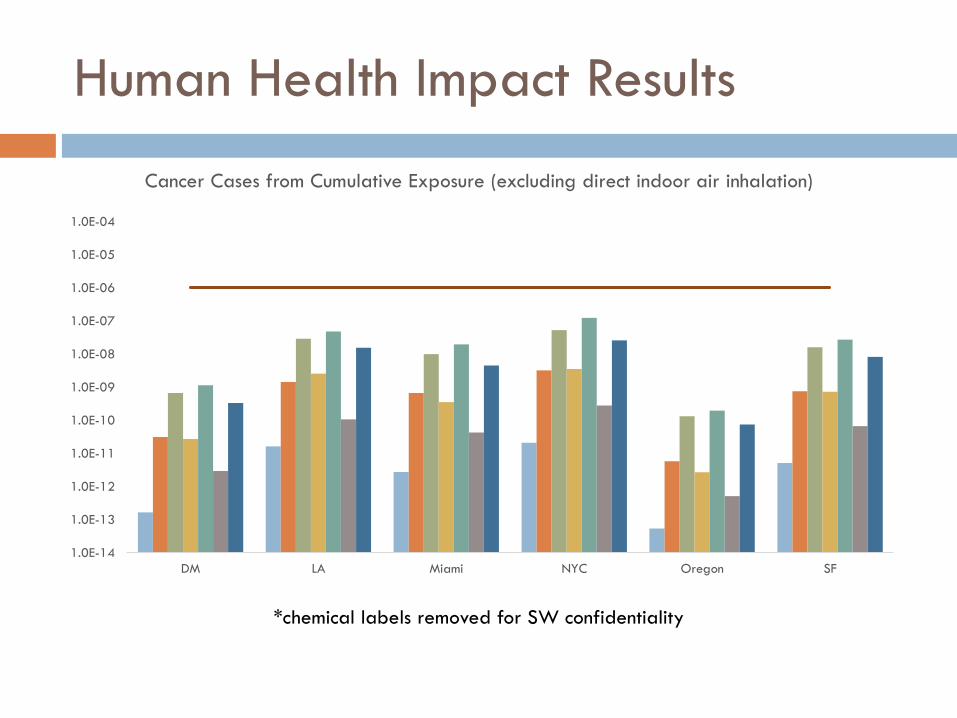
Human Health Impact Results
1.0E-14
1.0E-13
1.0E-12
1.0E-11
1.0E-10
1.0E-09
1.0E-08
1.0E-07
1.0E-06
1.0E-05
1.0E-04
DM LA Miami NYC Oregon SF
Cancer Cases from Cumulative Exposure (excluding direct indoor air inhalation)
*chemical labels removed for SW confidentiality

Review of Results
(1) Detailed report provided
(2) Conference call (at least 1hr) to go over the detailed results
and summarize:
• Largest upstream impacts
• Use & Release quantities/ratios
• Downstream impacts
Clarifying questions answered in this presentation, but substantial
questions are addressed in a follow up call after time for key
stakeholders to review the results.
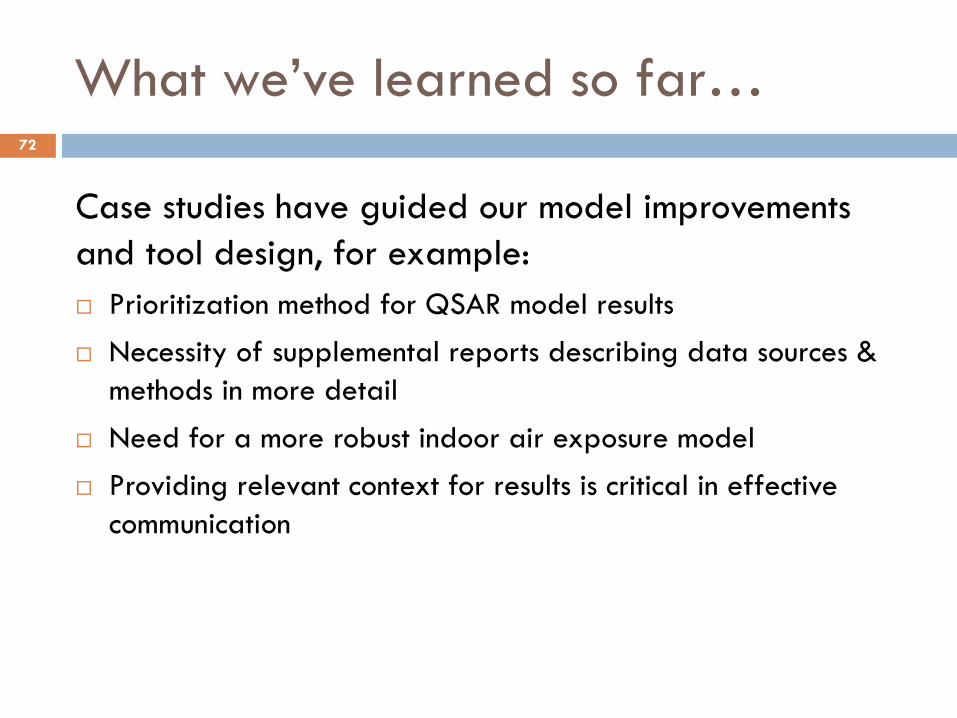
What we’ve learned so far…
Case studies have guided our model improvements
and tool design, for example:
Prioritization method for QSAR model results
Necessity of supplemental reports describing data sources &
methods in more detail
Need for a more robust indoor air exposure model
Providing relevant context for results is critical in effective
communication
72
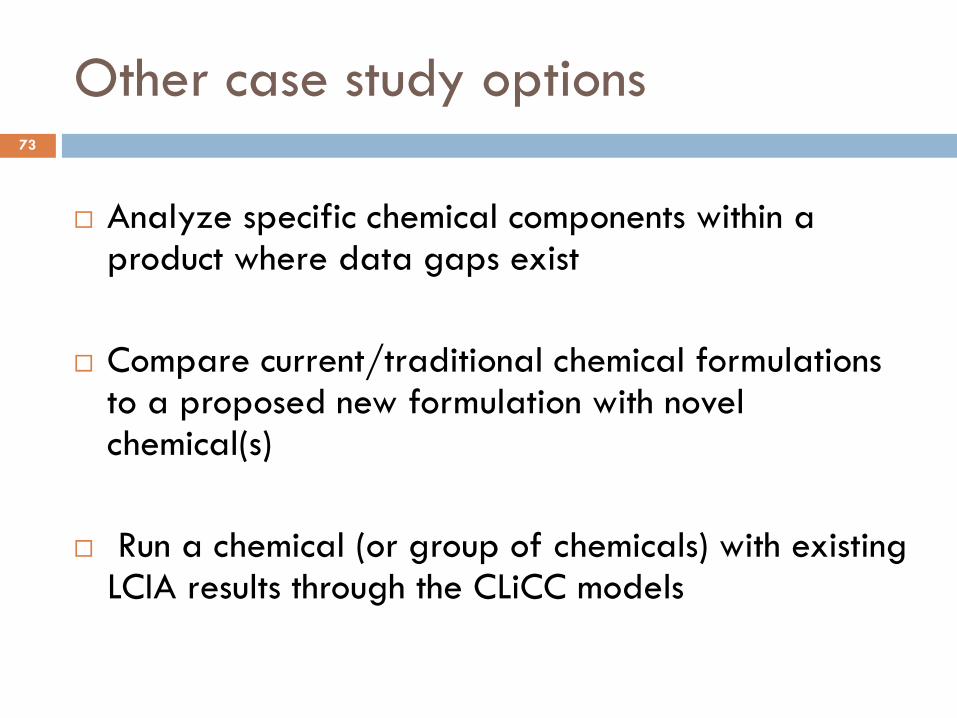
Other case study options
Analyze specific chemical components within a product where data gaps exist
Compare current/traditional chemical formulations to a proposed new formulation with novel chemical(s)
Run a chemical (or group of chemicals) with existing LCIA results through the CLiCC models
73

We want your help!
Want to participate in a case study?
Have an idea for a way to test the CLiCC tool?
Please contact Jess (PhD student researchers at the
Bren School): [email protected]
74

Final remarks
Thank you for your attention and participation in
this webinar
This concludes the 2016 CLiCC Webinar series
Any questions can be directed to presenters of this
webinar or [email protected]
Recordings of the webinar available at
clicc.ucsb.edu