Embed Size (px)
Citation preview

Book of Trends
Cle
vela
nd S
tate
Uni
vers
ity
Bo
ok
of
Tren
ds
201
3
Cleveland State University
2013

Office of Academic PlanningPhone (216) 687-5324www.csuohio.edu/offices/planning
Teresa LaGrange Vice Provost for Academic PlanningLaurine Owens Administrative Coordinator
Office of Institutional Research and AnalysisPhone (216) 687-4700www.csuohio.edu/iraa
Thomas Geaghan Director
Kimberly Barnes Senior Application DeveloperEric Brown Senior Report DeveloperDebbie Geil Data Analyst/System DeveloperHanjay Kim Data Analyst/System DeveloperMichael McGoun Research AssistantShanette Buford-Brazzell Student Office AssistantCarolyn Slade Administrative CoordinatorKaitlin Kerchenski Student Office Assistant
Book of Trends
2013

Cleveland State University / 2013 Book of Trends2

3Section 1 - Introduction
Sec
tio
n
1
Book of Trends
Cleveland State University
2013
Table of Contents
1

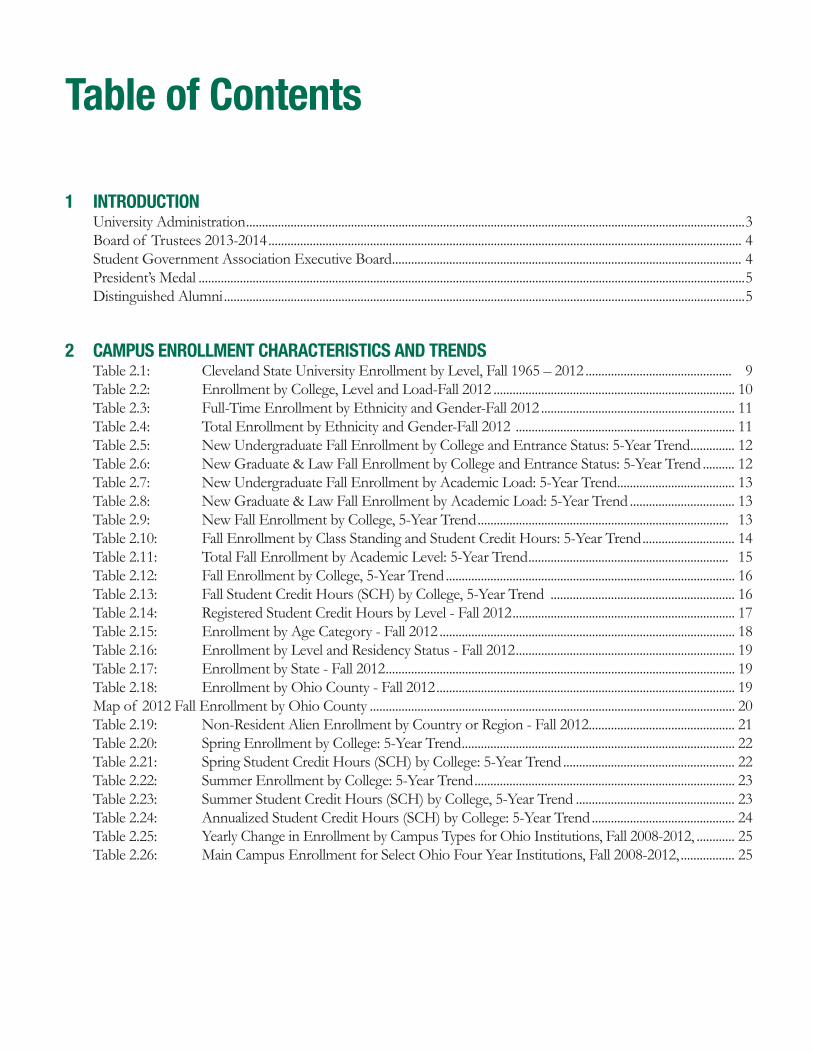
Table of Contents
1 INTRODUCTION University Administration .............................................................................................................................................................3 Board of Trustees 2013-2014 ..................................................................................................................................................... 4 Student Government Association Executive Board .............................................................................................................. 4 President’s Medal ............................................................................................................................................................................5 Distinguished Alumni ....................................................................................................................................................................5
2 CAMPUS ENROLLMENT CHARACTERISTICS AND TRENDS Table 2.1: Cleveland State University Enrollment by Level, Fall 1965 – 2012 .............................................. 9 Table 2.2: Enrollment by College, Level and Load-Fall 2012 ............................................................................ 10 Table 2.3: Full-Time Enrollment by Ethnicity and Gender-Fall 2012 ............................................................. 11 Table 2.4: Total Enrollment by Ethnicity and Gender-Fall 2012 ..................................................................... 11 Table 2.5: New Undergraduate Fall Enrollment by College and Entrance Status: 5-Year Trend.............. 12 Table 2.6: New Graduate & Law Fall Enrollment by College and Entrance Status: 5-Year Trend .......... 12 Table 2.7: New Undergraduate Fall Enrollment by Academic Load: 5-Year Trend ..................................... 13 Table 2.8: New Graduate & Law Fall Enrollment by Academic Load: 5-Year Trend ................................. 13 Table 2.9: New Fall Enrollment by College, 5-Year Trend ............................................................................... 13 Table 2.10: Fall Enrollment by Class Standing and Student Credit Hours: 5-Year Trend ............................. 14 Table 2.11: Total Fall Enrollment by Academic Level: 5-Year Trend ............................................................... 15 Table 2.12: Fall Enrollment by College, 5-Year Trend ........................................................................................... 16 Table 2.13: Fall Student Credit Hours (SCH) by College, 5-Year Trend .......................................................... 16 Table 2.14: Registered Student Credit Hours by Level - Fall 2012 ...................................................................... 17 Table 2.15: Enrollment by Age Category - Fall 2012 ............................................................................................. 18 Table 2.16: Enrollment by Level and Residency Status - Fall 2012 ..................................................................... 19 Table 2.17: Enrollment by State - Fall 2012 .............................................................................................................. 19 Table 2.18: Enrollment by Ohio County - Fall 2012 .............................................................................................. 19 Map of 2012 Fall Enrollment by Ohio County ................................................................................................................... 20 Table 2.19: Non-Resident Alien Enrollment by Country or Region - Fall 2012.............................................. 21 Table 2.20: Spring Enrollment by College: 5-Year Trend ...................................................................................... 22 Table 2.21: Spring Student Credit Hours (SCH) by College: 5-Year Trend ...................................................... 22 Table 2.22: Summer Enrollment by College: 5-Year Trend .................................................................................. 23 Table 2.23: Summer Student Credit Hours (SCH) by College, 5-Year Trend .................................................. 23 Table 2.24: Annualized Student Credit Hours (SCH) by College: 5-Year Trend ............................................. 24 Table 2.25: Yearly Change in Enrollment by Campus Types for Ohio Institutions, Fall 2008-2012, ............ 25 Table 2.26: Main Campus Enrollment for Select Ohio Four Year Institutions, Fall 2008-2012, ................. 25

3 ENROLLMENT CHARACTERISTICS OF STUDENTS IN CSU COLLEGES Tables 3.1-11: Fall Enrollment by Level and Major, 5-Year Trend ...................................................................... 29-48 Table 3.1: College of Business .................................................................................................................................... 29 Table 3.2: College of Liberal Arts and Social Sciences ......................................................................................... 31 Table 3.3: College of Education and Human Services ......................................................................................... 33 Table 3.4: School of Nursing ...................................................................................................................................... 35 Table 3.5: College of Engineering ............................................................................................................................. 36 Table 3.6: College of Sciences and Health Professions ........................................................................................ 37 Table 3.7: College of Urban Affairs .......................................................................................................................... 39 Table 3.8: College of Law ............................................................................................................................................ 40 Table 3.9: Undergraduate Studies .............................................................................................................................. 40 Table 3.10: Undergraduate Non-Degree .................................................................................................................... 41 Table 3.11: Graduate Studies ......................................................................................................................................... 41 Table 3.11a: Other ............................................................................................................................................................ 41 Tables 3.12-20: Fall Enrollment by Class Standing and Student Credit Hours by Course Level: 5-Year Trend .......................................................................................................... 42-50 Table 3.12: College of Business .................................................................................................................................... 42 Table 3.13: College of Liberal Arts and Social Sciences ......................................................................................... 43 Table 3.14: College of Education and Human Services ......................................................................................... 44 Table 3.15: School of Nursing ...................................................................................................................................... 45 Table 3.16: College of Engineering ..............................................................................................................................46 Table 3.17: College of Sciences and Health Professions ........................................................................................ 47 Table 3.18: College of Urban Affairs .......................................................................................................................... 48 Table 3.19: College of Law ............................................................................................................................................ 49 Table 3.20: Undergraduate Studies .............................................................................................................................. 50 Table 3.21: CSU Total Fall Enrollment by College and Ethnicity: 5-Year Trend ............................................. 51 Table 3.22: CSU Undergraduate Fall Enrollment by College and Ethnicity: 5-Year Trend ........................... 55 Table 3.23: CSU Graduate and Law Fall Enrollment by College and Ethnicity: 5-Year Trend .....................59 Table 3.24: Undergraduate Fall Enrollment by College and Load: 5-Year Trend............................................. 63 Table 3.25: Graduate & Law Fall Enrollment by College and Load: 5-Year Trend ......................................... 64 East and West Centers and Off-Campus Locations ............................................................................................................ 65 Table 3.26: West Center Student Credit Hours: Fall Semester .............................................................................. 65 Table 3.26a: Annual West Center Historical Enrollment and Student Credit Hours Trend ............................ 65 Table 3.27: East Center Student Credit Hours: Fall Semester ............................................................................... 66 Table 3.27a: Annual East Center Historical Enrollment and Student Credit Hours Trend ............................. 66 Table 3.28a: Annual Historical Enrollment and SCH Trends at Lorain County Community College .......... 67 Table 3.28b: Annual Historical Enrollment and SCH Trends at Lakeland Community College .................... 68 Table 3.28c: Annual Historical Enrollment and SCH Trends at Other Off-Campus Locations .................... 69
4 SPONSORED RESEARCH Table 4.1: Sponsored Program Awards and Expenditures, Fiscal Years 2007-2012 ...................................... 73 Table 4.2: Sponsored Program Awards by Source, Fiscal Years 2007-2012 .................................................... 74 Table 4.3: Sponsored Program Expenditures by Source, Fiscal Years 2006-2011 ......................................... 75 Table 4.4: National Science Foundation Ranking of Research and Development Expenditures, Fiscal Years 2005-2010 (Northern Ohio Comparison) ................ 76 Table 4.5a: National Science Foundation Ranking of Research and Development Expenditures, Fiscal Years 2009-2011 (National Ranking Peer Comparison) ....................................................... 77

Table 4.5: Indirect Cost (IDC) Recovery and Total Sponsored Program Expenditures by Year, Fiscal Years 2007-2012 ................................................................... 77 Table 4.6: Proposals Submitted and Awards Received by Source, Fiscal Years 2007-2012.......................... 78 Table 4.7: Proposals Submitted and Awards Received by College, Fiscal Years 2007-2012 ........................ 79 Table 4.7a: Fiscal Year 2011 Proposals Submitted by College .............................................................................. 79 Table 4.7b: Fiscal Year 2011 Awards Received by College ..................................................................................... 80 Table 4.8: Intellectual Property: Patents and Disclosures, Fiscal Years 2007-2012 ........................................ 81 Table 4.9: Cleveland State University Graduate Student Support from Externally Funded Research, Fiscal Years 2008-2012 ............................................................. 81 Table 4.10: Percentage of Total Student Credit Hours Taken by Graduate Level Students at Selected Ohio 4-Year Institutions-Main Campuses Only, Fall Terms 2008-2012................... 82 Table 4.11: Selected Research & Grant Highlights by College .............................................................................. 83 Table 4.12: Cleveland State University Research Centers and Institutes ............................................................. 96 Table 4.13: Past Recipients of Distinguished Faculty Awards by Award Type, 1995-2013 ............................ 97
5 RETENTION AND GRADUATION Table 5.1: Fall to Fall Retention Rates for IPEDS Cohort by Ethnicity and Gender Enrolled Fall 2007 – 2011 / Returned Fall 2008 – 2012 ......................................... 101 Table 5.2: Fall to Fall Retention Rates for IPEDS Cohort by College Enrolled Fall 2007 – 2011 / Returned Fall 2008 – 2012 ................................................. 102 Table 5.3: Attended, Graduated and Retained Fall to Fall Student Tracking (IPEDS Cohort) ............... 103 Table 5.4: Attended, Graduated and Retained Fall to Fall Student Tracking (Transfer Cohort) .............. 103 Table 5.5a: Undergraduate First-Year, Full-Time Degree-Seeking Cohort Graduation Rate ..................... 104 Table 5.5b: Undergraduate First-Year, Full-Time Degree-Seeking Cohort Retention Rate ........................ 105 Table 5.6: Annual Degrees Awarded by Academic Level and Gender - University Total ......................... 106 Tables 5.7-14: Annual Degrees Awarded by Major and Gender ..................................................................... 106-116 Table 5.7: College of Business ................................................................................................................................. 106 Table 5.8: College of Liberal Arts and Social Sciences ...................................................................................... 108 Table 5.9: College of Education and Human Services ...................................................................................... 110 Table 5.10: College of Engineering .......................................................................................................................... 112 Table 5.11: School of Nursing ................................................................................................................................... 113 Table 5.12: College of Sciences and Health Professions ..................................................................................... 114 Table 5.13: College of Urban Affairs ....................................................................................................................... 115 Table 5.14: College of Law ......................................................................................................................................... 116 Table 5.15: Annual Degrees Awarded by Ethnicity and Gender ....................................................................... 117 Table 5.16: University System of Ohio Accountability Measures Access Goal #4 - Associate and Bachelor’s Degrees Awarded to First Generation College Students ................. 120
6 SELECTED STRATEGIC INDICATORS: Academic and Administrative Programs Honors Program Table 6.1: Characteristics of New Honors Students Fall 2008-2012 ............................................................. 123 Table 6.2: Scholarship Aid for Honors Students by Financial Aid Year ........................................................ 123 Academic Characteristics Table 6.3: IPEDS Cohort Characteristics ............................................................................................................. 124 Table 6.3a: Average ACT Composite Scores by College for IPEDS Cohort Students ............................... 124 Table 6.3b: Fall IPEDS Cohort by Gender: 5 Year Trend .................................................................................. 125 Table 6.3c: Fall IPEDS Cohort by Ethnicity: 5 Year Trend ............................................................................... 125 Table 6.3d: Fall IPEDS Cohort by Age Group: 5 Year Trend ........................................................................... 125 Table 6.3e: Fall IPEDS Cohort by Selected Major: 5 Year Trend ..................................................................... 125 Table 6.3f: Fall IPEDS Cohort by Notable Student Groups: 5 Year Trend .................................................. 125 Table 6.4: Average High School GPA by College for IPEDS Cohort Students: 5 Year Trend ............... 126 Table 6.5: Undergraduate Cumulative GPA by College: 5-Year Trend .......................................................... 127 Table 6.6a: Fall 2012 Top 15 Majors by Academic Level .................................................................................... 128 Table 6.6b: Top 15 Departments by Academic Level .......................................................................................... 128 Table 6.7: Fall 2012 Top 15 Degree Seeking Programs with Highest Minority Student Enrollment by Level ............................................................................................... 129 Table 6.8: Fall 2012 Top 15 Degree Seeking Programs with Highest Female Student Enrollment by Level .................................................................................. 130 Table 6.9: Summer Class Section and Average Class Size by Time of Day and College: 5-Year Trend ........ 131 Table 6.10: Fall Class Section and Average Class Size by Time of Day and College: 5-Year Trend ......... 133 Table 6.11: Spring Class Section and Average Class Size by Time of Day and College: 5-Year Trend ......... 135 Table 6.12: Fall Undergraduate Student FTE by College and Class Time: 5-Year Trend, Fall 2008 – 2012 .............................................................................. 137 Table 6.13: Fall Graduate & Law Student FTE by College and Class Time: 5-Year Trend, Fall 2008 – 2012 .............................................................................. 137 Center for eLearning Table 6.14a: Annual Web Historical Enrollment and SCH Trends ................................................................... 138 Table 6.14b: 5-Year Trends in Web-Based Instructional Delivery Student Credit Hours Generated ......... 139 Trends in Interactive Video and Telecourse Instructional Delivery Table 6.15: 5-Year Trends in Interactive Video and Telecourse Delivery Student Credit Hours Generated ........................................................................................ 140 Table 6.16: Cleveland State University Michael Schwartz Library Collections and Instructional Media Services, FY 2012 ................................................................. 141 Table 6.17: Cleveland State University Michael Schwartz Library and Instructional Media Services Use Statistics ................................................................................ 142 Table 6.18: Cleveland State University Law Library Collections 2009-2012 ................................................... 142 Table 6.19: Cleveland State University Law Library Statistics 2009-2012 ........................................................ 142 Learning Communities Table 6.20: Learning Communities - Cleveland Transfer Connection ........................................................... 143

7 Faculty & Staff Table 7.1: Full-Time Employees by Change to Standard Occupational Classification (SOC), Fall 2012 ...... 147 Table 7.2: Full-Time Employees by Gender, Ethnicity, and SOC Category, Fall 2012 .............................. 148 Table 7.3: Full-Time Employees: Women and Minorities as a Percentage of Total by SOC Category, Fall 2012 ..................................................................... 150 Table 7.4: Total Employees by SOC Category, Fall 2012 .................................................................................. 152 Table 7.5: Full-Time Faculty by Rank and College, Fall 2012 .......................................................................... 153 Table 7.6: Full-Time Faculty by Gender and College, Fall 2012 ...................................................................... 153 Table 7.6a: Full-Time Faculty by College, Gender and Rank, Fall 2012 .......................................................... 154 Table 7.7: Full-Time Faculty by Highest Degree Attained, Fall 2012 ............................................................. 154 Table 7.8: Full-Time Tenured/Tenure-Track and Non-Tenure Track Faculty by College/Department: 5-Year Trend .................................................................... 155 Table 7.9: Percentage of Undergraduate Student Credit Hours (SCH) Generated by Part-Time Faculty, Fall 2012 ....................................................................................... 157 Table 7.10: Women and Minorities as a Percent of Full-Time Faculty, Selected Ohio 4-Year Institutions, Fall 2008–2012 .......................................................................... 160 Table 7.11: Full-Time Faculty as a Percentage of Total Full-Time Employees, Selected Ohio 4-Year Institutions, Fall 2008–2012 .......................................................................... 160 Table 7.12: Rate of Annual Student FTE to Number of Full-Time Faculty Selected Ohio 4-Year Institutions Fiscal Years 2008 - 2012 .......................................................... 161 Table 7.13: Student FTE to Full-Time Staff Ratio Selected Ohio 4-Year Institutions Main Campuses Only Fall 2008 - 2012 .............................................................................................. 161
8 SELECTED ADMINISTRATIVE CENTERS, DEPARTMENTS & OFFICES Application, Admission, and Yield Table 8.1: University Totals Application Trends Unduplicated for Degree-Seeking Students, Fall 2008–2012 .................................................................................. 165 Table 8.1a: New First Year Undergraduate Application Trends for Degree-Seeking Students, Fall 2008–2012 .................................................................................. 165 Table 8.1b: New Transfer Undergraduate Application Trends for Degree-Seeking Students, Fall 2008–2012 .................................................................................. 165 Table 8.1c: New Law Application Trends for Degree-Seeking Students, Fall 2008–2012 .......................... 165 Table 8.1d: New Graduate Application Trends for Degree-Seeking Students, Fall 2008–2012................. 165 Office of Advancement Table 8.2: CSU Foundation: 5 Year Endowment Growth by College/Division ......................................... 166 Table 8.3: CSU Foundation: Endowed Scholarship, Donors & Giving ........................................................ 167 Philanthropic Highlights: 2012-2013 .................................................................................................. 167 Athletics Department Table 8.4: Athletic Sports at Cleveland State University by Enrollment ........................................................ 168 Table 8.5 Athletic Sports at Cleveland State University 4, 5 and 6 Year Graduation Rate .......................................................................................................... 168

Finance Table 8.6: Statement of Revenues, Expenditures and Other Changes, Fiscal Years 2007–2011 ............. 169 Table 8.7: Public Service Expenditures as a Percentage of Total Expenditures, Selected Ohio 4-Year Institutions, Main Campuses Only, Fiscal Years 2007–2011 ................. 171 Table 8.8: Benefit Expenditures as a Percentage of Total Funding Unit Expenditures Selected Ohio 4-Year Institutions, Main Campuses Only, Fiscal Years 2007–2011 ................. 171 Table 8.9: Scholarship and Fellowship Expenditures as a Percentage of Total Expenditures Selected Ohio 4-Year Institutions, Main Campuses Only, Fiscal Years 2007–2011 ................. 172 Financial Aid Table 8.10: Financial Aid Awards to Undergraduate Students by Full-Time/Part-Time Status: Average Aid Package and Academic Year ............................. 172 Table 8.11: Financial Aid Awards Fall Cohort, Full-Time, First-Time, Degree-Seeking Undergraduate Students ......................................................................................................................... 173 Table 8.12: Financial Aid Awards to Fall Term Undergraduate Students........................................................ 173 Table 8.13: Graduate Student Financial Aid Awards by Full-Time/Part-Time Status & Average Aid Package .............................................................. 174 Table 8.14: Graduate Student Financial Aid Awards by Types of Financial Aid, Fall 2007–2011 ............ 174 Table 8.15: Law Student Financial Aid Awards by Full-Time/Part-Time Status and Average Aid Package .................................................................. 174 Table 8.16: Law Students Financial Aid Awards by Types of Financial Aid, Fall 2007–2011 .................... 174 Table 8.17: Undergraduate Cost of Attendance (COA) ...................................................................................... 175 Table 8.18: Annualized Full-Time Undergraduate Tuition and Fees for Selected Main Campuses of Ohio, 4 Year Institutions, 2011–2012* .......................................... 175 Table 8.19: Award of Financial Aid at Ohio’s Public Title IV Postsecondary Institutions ........................ 176 Financial Aid Notes .................................................................................................................................................................. 177 Center for International Services and Programs (CISP) Table 8.20: CSU Fulbright Scholar Awards, 1973–2012 ...................................................................................... 178 Table 8.21: Cleveland State University International Academic Initiatives ...................................................... 179 Table 8.22: Study Abroad Student Enrollment by Academic Year (Summer, Fall and Spring) and Program Type ................................................................................. 180 Table 8.23: Study Abroad Student Enrollment by Academic Year (Summer, Fall and Spring) and College .............................................................................................. 180 Table 8.24: Study Abroad Student Enrollment by Academic Year (Summer, Fall and Spring) and Course Level .................................................................................... 180 Table 8.25: Key International Links.......................................................................................................................... 181 Office of Space Management Table 8.26: Cleveland State University Fall 2012 Building Inventory ............................................................... 182 Accreditation ............................................................................................................................................... 183 List of College Acronyms & Abbreviations .............................................................................................. 184 Other Acronyms and Abbreviations .......................................................................................................... 184 Book of Trends 2013 .................................................................................................................................. 185

Diversity Index Continuing our commitment to recognize the diversity of our campus, this year we are providing a Diversity Index for readers of the Book of Trends. The Index gives page numbers for all tables and graphs relating to gender and ethnicity, so that readers can easily locate information about all aspects related to our campus’ diverse makeup.
2 CAMPUS ENROLLMENT CHARACTERISTICS AND TRENDS Table 2.3: Full-Time Enrollment by Ethnicity and Gender-Fall 2012 .............................................................. 11 Table 2.4: Total Enrollment by Ethnicity and Gender-Fall 2012 ....................................................................... 11
3 ENROLLMENT CHARACTERISTICS OF STUDENTS IN CSU COLLEGES Table 3.21: CSU Total Fall Enrollment by College and Ethnicity: 5-Year Trend .............................................. 51 Table 3.22: CSU Undergraduate Fall Enrollment by College and Ethnicity: 5-Year Trend ............................ 55 Table 3.23: CSU Graduate and Law Fall Enrollment by College and Ethnicity: 5-Year Trend ..................... 59
5 RETENTION AND GRADUATION Table 5.1: Fall to Fall Retention Rates for IPEDS Cohort by Ethnicity and Gender Enrolled Fall 2007–2011 / Returned Fall 2008–2012 ............................................... 103 Table 5.6: Annual Degrees Awarded by Academic Level and Gender - University Total ........................... 108 Tables 5.7-14: Annual Degrees Awarded by Major and Gender ...................................................................... 108-118 Table 5.15: Annual Degrees Awarded by Ethnicity and Gender ......................................................................... 119 Table 5.16: University System of Ohio Accountability Measures Access Goal #4 - Associate and Bachelor’s Degrees Awarded to First Generation College Students ................... 122
6 SELECTED STRATEGIC INDICATORS: Academic and Administrative Programs Table 6.3b: Fall IPEDS Cohort by Gender: 5 Year Trend .................................................................................... 127 Table 6.3c: Fall IPEDS Cohort by Ethnicity: 5 Year Trend ................................................................................. 127
7 Faculty & Staff Table 7.2: Full-Time Employees by Gender, Ethnicity, and SOC Category, Fall 2008–2012 .................... 150 Table 7.3: Full-Time Employees: Women and Minorities as a Percentage of Total by SOC Category, Fall 2008–2012 ........................................................................................................................................... 152 Table 7.6: Full-Time Faculty by Gender and College, Fall 2012 ........................................................................ 155 Table 7.6a: Full-Time Faculty by College, Gender and Rank, Fall 2012 ............................................................ 156 Table 7.10: Women and Minorities as a Percent of Full-Time Faculty, Selected Ohio 4-Year Institutions, Fall 2007–2011 ............................................................................ 162

Cleveland State University / 2013 Book of Trends12
13Section 1 - Introduction
Sec
tio
n
1S
ecti
on
1
Book of Trends
Cleveland State University
2013
Introduction
1

Cleveland State University / 2013 Book of Trends14
3Section 1 - Introduction
Sec
tio
n
1
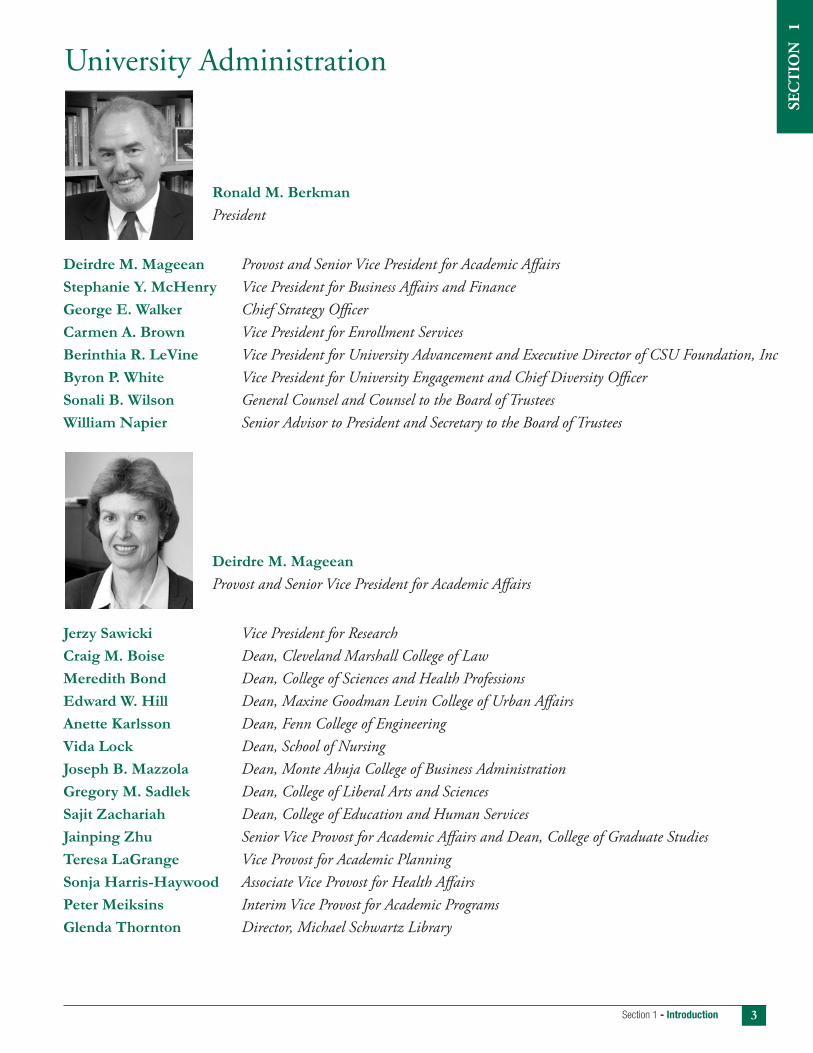
University Administration
Ronald M. Berkman President
Deirdre M. Mageean Provost and Senior Vice President for Academic AffairsStephanie Y. McHenry Vice President for Business Affairs and FinanceGeorge E. Walker Chief Strategy OfficerCarmen A. Brown Vice President for Enrollment ServicesBerinthia R. LeVine Vice President for University Advancement and Executive Director of CSU Foundation, IncByron P. White Vice President for University Engagement and Chief Diversity OfficerSonali B. Wilson General Counsel and Counsel to the Board of TrusteesWilliam Napier Senior Advisor to President and Secretary to the Board of Trustees
Deirdre M. Mageean Provost and Senior Vice President for Academic Affairs
Jerzy Sawicki Vice President for ResearchCraig M. Boise Dean, Cleveland Marshall College of LawMeredith Bond Dean, College of Sciences and Health ProfessionsEdward W. Hill Dean, Maxine Goodman Levin College of Urban AffairsAnette Karlsson Dean, Fenn College of EngineeringVida Lock Dean, School of NursingJoseph B. Mazzola Dean, Monte Ahuja College of Business AdministrationGregory M. Sadlek Dean, College of Liberal Arts and SciencesSajit Zachariah Dean, College of Education and Human ServicesJainping Zhu Senior Vice Provost for Academic Affairs and Dean, College of Graduate StudiesTeresa LaGrange Vice Provost for Academic PlanningSonja Harris-Haywood Associate Vice Provost for Health AffairsPeter Meiksins Interim Vice Provost for Academic ProgramsGlenda Thornton Director, Michael Schwartz Library

Cleveland State University / 2013 Book of Trends4
Trustee Term
Robert H. Rawson, Jr. June 2007-May 2016Chairperson
Bernardo “Bernie” F. Moreno May 2011-May 2020 Vice Chairperson
Morton Q. Levin August 2008-May 2017Treasurer
Thomas W. Adler May 2013-May 2022Development Officer
Richard L. Bowen June 2010-May 2019
David H. Gunning II, Esq. September 2012-May 2021
June E. Taylor January 2012-May 2015
Ronald E. Weinberg April 2005-May 2014
Dan T. Moore III May 2011-May 2020
Executive Member Position
Jon Fedor President
Allison Dumski Vice President
Emily Halasah Secretary
Board of Trustees 2013-2014
Student Government Association Executive Board 2013-2014
Trustee Term
Amber M. Alt September 2011-May 2014Student Trustee
Stephen F. Kirk June 2013-End of term asCommunity Board Member Chair of the CSU Foundation
Paul E. Dicorleto, Ph.D. July 2012-June 2014Community Board Member
Anand “Bill” Julka July 2012-June 2013Community Board Member
Stephen F. Duffy, Ph.D. July 2013-June 2014Faculty Representative
Joanne E. Goodell, Ph.D. September 2011-Faculty Representative September 2014
Executive Member Position
Jake Wehner Treasurer
Hazem Jadallah Speaker of the Senate
Robert Bergmann Advisor
William J. Napier, Ph.D., Secretary to the Board of Trustees

5Section 1 - Introduction
Sec
tio
n
1
Distinguished Alumni AwardAnnually, outstanding graduates of Cleveland State University are honored for their service, leadershipand career achievements with a Distinguished Alumni Award.
2009 Honorees
Gary S. Adams George B. Davis Award
Robert L. Norton Monte Ahuja College of Business
Father Kevin M. Conroy College of Education and Human Services
Craig A. Black Fenn College of Engineering
Carol G. Emerling Cleveland-Marshall College of Law
Andrew F. Puzder College of Liberal Arts and Social Sciences
Andrius Kazlauskas College of Sciences and Health Professions
Christopher S Ronayne Maxine Goodman Levin College of Urban Affairs
2010 Honorees
Irene A. Holyk Rennillo George B. Davis Award
Saji T. Daniel Monte Ahuja College of Business
Catherine S. Koppelman College of Education and Human Services
Terrence V. Zuk Fenn College of Engineering
Tanisha R. Briley College of Graduate Studies
David M. Paris Cleveland-Marshall College of Law
Miriam Solomon Plax College of Liberal Arts and Social Sciences
Dr. David G. Watterson Jr. College of Sciences and Health Professions
John J. Boyle, III Maxine Goodman Levin College of Urban Affairs
2011 Honorees
Richard P. Stovsky George B. Davis Award
Linda M. Kane Monte Ahuja College of Business
Dr. Aaron T. Ellington College of Education and Human Services
Joseph A. Williams Fenn College of Engineering
Ian N. Friedman Cleveland-Marshall College of Law
Maria Keckan College of Liberal Arts and Social Sciences
Dr. Beth Brandt Sersig College of Sciences and Health Professions
Madeline A. Cain Maxine Goodman Levin College of Urban Affairs
Dr. Nancy M. Albert School of Nursing
President’s MedalThe most prestigious non-academic recognition that Cleveland State University can confer, the President’s Medal, is awarded to individuals, groups or entities whose commitment and dedication to the University are beyond question. The medal is conferred only when the honoree has made continuing and/or extraordinary contributions, or has provided exemplary and ongoing services that have directly and tangibly advanced the best interests and mission of Cleveland State University. The first President’s Medal was presented in November 2004.
Recipients
2013 Jennie Jones Trevor Jones
2012 Donald E. Washkewicz
2011 Monte Ahuja Dr. Usha Ahuja Ronald E. Weinberg
2010 Anand “Bill” Julka Dr. Neeraj Julka
2009 Mrs. Jean L. Elsner
Recipients
2008 Natalie Epstein Lainie Hadden
2007 Art J. Falco
2006 James D. Ireland lll Dr. William Hiller Stanley Miller
2005 Dr. Julian M. Earls Maria Miller Babs Glickman
2004 Dr. Delos M. (Toby) CosgrovePresident’s Medal
2012 Honorees
Timothy F. Hagan George B. Davis Award
William J. Centa Monte Ahuja College of Business
Daniel J. Keenan College of Education and Human Services
George J. Palko Fenn College of Engineering
Larry H. James Cleveland-Marshall College of Law
Dr. Ruth D. Peterson College of Liberal Arts and Social Sciences
Thomas E. Hopkins College of Sciences and Health Professions
Erin Dee Huber Maxine Goodman Levin College of Urban Affairs
Sheila A. Niles School of Nursing

Cleveland State University / 2013 Book of Trends6
Sec
tio
n
2
Book of Trends
Cleveland State University
2013
Campus EnrollmentCharacteristics & Trends
2

Cleveland State University / 2013 Book of Trends8

9Section 2 - Cam
pus Enrollment Characteristics &
Trends
Section 2
5,000
10,000
15,000
20,000
25,000
1965
1966
1967
1968
1969
1970
1971
1972
1973
1974
1975
1976
1977
1978
1979
1980
1981
1982
1983
1984
1985
1986
1987
1988
1989
1990
1991
1992
1993
1994
1995
1996
1997
1998
1999
2000
2001
2002
2003
2004
2005
2006
2007
2008
2009
2010
Enro
llmen
t
2011
Year Undergraduate Graduate Law Total Year Undergraduate Graduate Law Total
1965 6,026 N/A N/A 6,026 1989 13,409 4,115 1,011 18,535 1966 7,853 N/A N/A 7,853 1990 13,825 4,331 1,064 19,220 1967 8,431 184 N/A 8,615 1991 13,531 4,500 1,060 19,091 1968 8,836 248 N/A 9,084 1992 12,716 4,504 979 18,199 1969 9,442 1,220 775 11,437 1993 11,966 4,240 931 17,137 1970 10,734 1,171 742 12,647 1994 11,341 4,251 912 16,504 1971 11,257 1,760 772 13,789 1995 10,698 4,065 908 15,671 1972 11,758 2,045 909 14,712 1996 10,728 3,905 889 15,522 1973 11,986 2,212 1,003 15,201 1997 10,675 4,154 906 15,735 1974 12,895 2,300 1,066 16,261 1998 11,215 4,244 867 16,326 1975 13,278 2,568 1,128 16,974 1999 10,453 4,480 749 15,682 1976 13,401 2,808 1,138 17,347 2000 10,260 4,658 762 15,680 1977 13,896 2,851 1,168 17,915 2001 10,507 4,774 834 16,115 1978 13,143 3,125 1,164 17,432 2002 10,405 4,941 817 16,163 1979 13,154 3,242 1,184 17,580 2003 10,300 5,262 815 16,377 1980 14,330 3,751 1,169 19,250 2004 9,870 5,259 752 15,881 1981 14,167 3,883 1,090 19,140 2005 9,605 5,197 748 15,550 1982 14,177 3,715 1,052 18,944 2006 9,525 4,905 712 15,142 1983 14,195 3,768 979 18,942 2007 9,798 4,873 712 15,383 1984 13,426 3,589 1,018 18,033 2008 9,825 4,942 672 15,439 1985 12,502 3,347 917 16,766 2009 10,708 5,153 645 16,506 1986 13,220 4,005 1,016 18,241 2010 11,496 5,280 610 17,386 1987 13,236 3,945 1,006 18,187 2011 11,722 5,162 563 17,447 1988 12,971 3,850 1,000 17,821 2012 12,039 4,985 501 17,525
Table 2.1: Cleveland State University Enrollment by Level - Fall 1965 - 2012
Figure 2.1: Cleveland State University Enrollment Trend - Fall 1965 - 2012
Note: CSU switched from quarter to semester terms in 1998. Note: Prior to 2000 enrollment figures represented opening census. Since 2000 enrollment figures represent closing census.
2012

Cleveland State U
niversity / 2013 Book of Trends10
Undergraduate Graduate Law Undergraduate Full-time Undergraduate Part-timeGraduate & Law Full-time Graduate & Law Part-time
Table 2.2: Enrollment by College, Level and Load - Fall 2012
Undergraduate Graduate & Law Total
Undergraduate Undergraduate Graduate & Graduate &College Full-Time Part-Time Total % of Total Full-Time Part-Time Law Total Law % of Total Full-Time Part-Time Total % of Total
Business 1,316 657 1,973 16% 457 939 1,396 25% 1,773 1,596 3,369 19%CLASS 2,457 678 3,135 26% 237 359 596 11% 2,694 1,037 3,731 21%Education 634 263 897 7% 241 1,128 1,369 25% 875 1,391 2,266 13%Nursing 469 65 534 4% 19 39 58 1% 488 104 592 3%Engineering 932 234 1,166 10% 74 329 403 7% 1,006 563 1,569 9%Science 2,219 657 2,876 24% 436 415 851 16% 2,655 1,072 3,727 21%Urban Affairs 197 130 327 3% 58 235 293 5% 255 365 620 4%Law - - - 0% 350 151 501 9% 350 151 501 3%Undergraduate Studies 353 427 780 6% - - - 0% 353 427 780 4%Undergraduate Non-Degree 24 221 245 2% - - - 0% 24 221 245 1%Graduate Studies - - - 0% 4 15 19 0% 4 15 19 0%Other1 - 106 106 1% - - - 0% - 106 106 1%Total 8,601 3,438 12,039 100% 1,876 3,610 5,486 100% 10,477 7,048 17,525 100%Note: Undergraduate full-time status: minimum of 12 hours; Graduate full-time status: minimum of 9 hours; Law full-time status: minimum of 13 hours. 1 Other includes students enrolled in Air Force, Career Services, English as a Second Language, Military Science, Special program and Study Abroad.
Figure 2.2a: Enrollment by Level Fall 2012
Figure 2.2b: Enrollment by Load and Level Fall 2012
69%
3%
28%
11%
20%
Highlights: Over 70% of undergraduates attend full-time. At the graduate level 66% of CSU students attend part-time. CLASS has the largest number of undergraduates and COEHS has the largest number of graduate students.
20%
49%
11Section 2 - Cam
pus Enrollment Characteristics &
Trends
Section 2
Note: Undergraduate full-time status: minimum of 12 hours Graduate full-time status: minimum of 9 hours Law full-time status: minimum of 13 hours
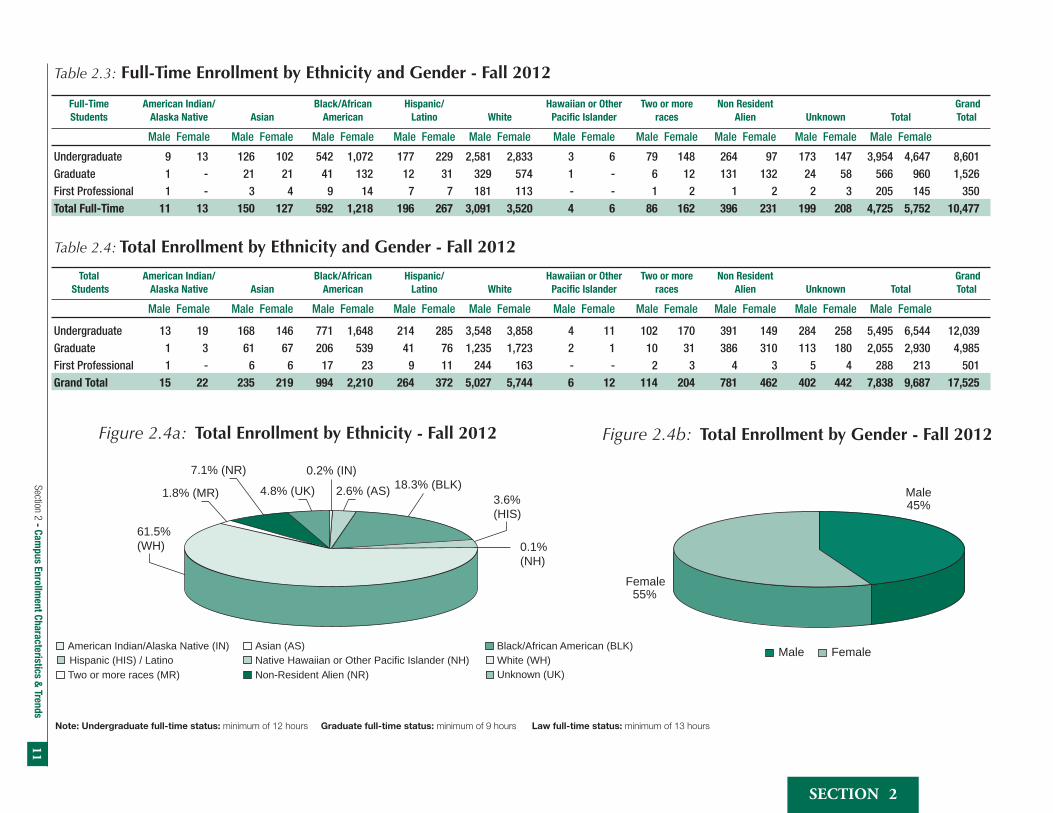
Table 2.3: Full-Time Enrollment by Ethnicity and Gender - Fall 2012
Undergraduate 9 13 126 102 542 1,072 177 229 2,581 2,833 3 6 79 148 264 97 173 147 3,954 4,647 8,601Graduate 1 - 21 21 41 132 12 31 329 574 1 - 6 12 131 132 24 58 566 960 1,526First Professional 1 - 3 4 9 14 7 7 181 113 - - 1 2 1 2 2 3 205 145 350Total Full-Time 11 13 150 127 592 1,218 196 267 3,091 3,520 4 6 86 162 396 231 199 208 4,725 5,752 10,477
Table 2.4: Total Enrollment by Ethnicity and Gender - Fall 2012
Undergraduate 13 19 168 146 771 1,648 214 285 3,548 3,858 4 11 102 170 391 149 284 258 5,495 6,544 12,039Graduate 1 3 61 67 206 539 41 76 1,235 1,723 2 1 10 31 386 310 113 180 2,055 2,930 4,985First Professional 1 - 6 6 17 23 9 11 244 163 - - 2 3 4 3 5 4 288 213 501Grand Total 15 22 235 219 994 2,210 264 372 5,027 5,744 6 12 114 204 781 462 402 442 7,838 9,687 17,525
Figure 2.4a: Total Enrollment by Ethnicity - Fall 2012 Figure 2.4b: Total Enrollment by Gender - Fall 2012
Full-Time Students
American Indian/Alaska Native Asian
Black/African American
Hispanic/Latino White
Hawaiian or Other Pacific Islander
Two or more races
Non Resident Alien Unknown
Total
Grand Total
Male Female Male Female Male Female Male Female Male Female Male Female Male Female Male Female Male Female Male Female
Total Students
American Indian/Alaska Native Asian
Black/African American
Hispanic/Latino White
Hawaiian or Other Pacific Islander
Two or more races
Non Resident Alien Unknown
Total
Grand Total
Male Female Male Female Male Female Male Female Male Female Male Female Male Female Male Female Male Female Male Female
American Indian/Alaska Native (IN)White (WH)Black/African American (BLK)
Hispanic (HIS) / Latino Two or more races (MR)
Asian (AS)Native Hawaiian or Other Pacific Islander (NH)Non-Resident Alien (NR) Unknown (UK)
Female55%
Male45%
Male Female
0.1%(NH)
61.5%(WH)
3.6%(HIS)
0.2% (IN)
1.8% (MR)
7.1% (NR)
4.8% (UK) 2.6% (AS) 18.3% (BLK)

Cleveland State U
niversity / 2013 Book of Trends12 Table 2.5: New Undergraduate Fall Enrollment by College and Entrance Status: 5-Year Trend
Freshmen Transfers Other Undergraduate New Undergraduate Total Total Percent Change
College 2008 2009 2010 2011 2012 2008 2009 2010 2011 2012 2008 2009 2010 2011 2012 2008 2009 2010 2011 2012 1 Year 5 Year
Business 164 170 151 159 196 309 371 373 318 324 16 19 17 16 24 489 560 541 493 544 10% 11%CLASS 281 330 379 488 464 389 389 442 417 466 16 27 27 23 37 686 746 848 928 967 4% 41%Education 70 81 90 90 70 115 146 120 111 113 32 45 40 26 21 217 272 250 227 204 -10% -6%Nursing 96 90 124 83 119 66 78 100 63 60 29 35 7 8 4 191 203 231 154 183 19% -4%Engineering 115 133 148 157 215 74 100 109 109 137 9 12 7 7 15 198 245 264 273 367 34% 85%Science 209 254 299 327 406 251 301 376 397 407 36 54 74 81 125 496 609 749 805 938 17% 89%Urban Affairs 4 6 9 13 9 52 61 74 68 65 1 - - - 2 57 67 83 81 76 -6% 33%Undergraduate Studies 112 117 42 76 110 53 42 28 52 74 154 197 169 176 234 319 356 239 304 418 38% 31%Undergraduate Non-Degree - - - - - - - - - - 154 185 174 121 129 154 185 174 121 129 7% -16%Other1 - 1 - - - - - - - - 25 35 52 87 83 25 36 52 87 83 -5% 232%UNIVERSITY 1,051 1,182 1,242 1,393 1,589 1,309 1,488 1,622 1,535 1,646 472 609 567 545 674 2,832 3,279 3,431 3,473 3,909 13% 38%
Table 2.6: New Graduate & Law Fall Enrollment by College and Entrance Status: 5-Year Trend
Master’s/Law Doctoral Other Graduate1 New Graduate/Law Total Total Percent Change
College 2008 2009 2010 2011 2012 2008 2009 2010 2011 2012 2008 2009 2010 2011 2012 2008 2009 2010 2011 2012 1 Year 5 Year
Business 240 355 320 306 337 - 26 - - - 90 112 99 105 99 330 493 419 411 436 6% 32%CLASS 132 151 176 145 158 - - - - - 46 47 39 51 37 178 198 215 196 195 -1% 10%Education 289 264 249 243 283 9 9 4 3 6 97 88 92 82 54 395 361 345 328 343 5% -13%Nursing 12 10 13 20 14 - - - - - - - - 2 5 12 10 13 22 19 -14% 58%Engineering 71 107 111 94 94 6 10 3 6 6 8 16 10 13 7 85 133 124 113 107 -5% 26%Science 155 159 160 190 187 20 19 14 16 17 38 41 34 40 36 213 219 208 246 240 -2% 13%Urban Affairs 56 50 52 44 47 2 - 2 7 2 39 44 42 31 17 97 94 96 82 66 -20% -32%Law 206 196 187 164 139 - - - - - 8 9 5 7 7 214 205 192 171 146 -15% -32%Graduate Studies* - - - - - - - - - - 17 14 24 10 6 17 14 24 10 6 -40% -65%UNIVERSITY 1,161 1,292 1,268 1,206 1,259 37 64 23 32 31 0 343 371 345 341 268 1,541 1,727 1,636 1,579 1,558 -1% 1%
Note: A new methodology has been used to determine New Master & Doctoral students beginning Fall 2010. These are now cohorts chosen by Graduate Studies. Beginning in Fall 2010 Graduate Licensure was moved from Masters/ Law to Other Graduate. 1 Other Graduate includes students enrolled in Non-Degree Courses and Transfers. Part-time new Masters and Doctoral students are also under Other Graduate now.
NOTE: In prior editions of the Book of Trends multiple methodologies were used to count new graduate students in the different years within the same table. This year, we have chosen one methodology and have applied to the entire table. Specifically, students are marked as “new” during their first year at the graduate level. New students pursuing a Master’s degree, a Law degree, or a Licensure degree are included in the first section of the table. First-time graduate students who are pursuing a Doctoral degree are included in the second section of the table. All other new graduate students, including non-degree and graduate transfer students, are included in the “other” category. This methodology mirrors the rules used by the Ohio Board of Regents. Specifically, the Regents require that a graduate student be reported as “new” only once and only in the first semester they are considered a graduate level student.

13Section 2 - Campus Enrollment Characteristics & Trends
Sec
tio
n
2
Table 2.7: New Undergraduate Fall Enrollment by Academic Load: 5-Year Trend % Change in % Change in Full-Time Full-Time Part-Time Part-Time
College 2008 2009 2010 2011 2012 1-Year 5-Year 2008 2009 2010 2011 2012 1-Year 5-Year
Business 378 431 416 390 408 5% 8% 111 129 125 103 136 32% 23%CLASS 608 644 723 804 823 2% 35% 78 102 125 124 144 16% 85%Education 224 286 204 188 179 -5% -20% 46 60 46 39 25 -36% -46%Nursing 113 107 197 134 166 24% 47% 25 22 34 20 17 -15% -32%Engineering 170 199 223 237 311 31% 83% 28 46 41 36 56 56% 100%Science 413 517 612 659 765 16% 85% 83 92 137 146 173 18% 108%Urban Affairs 39 41 59 57 57 0% 46% 18 26 24 24 19 -21% 6%Undergraduate Studies 170 195 99 155 207 34% 22% 149 161 140 149 211 42% 42%Undergraduate Non-Degree2 21 41 31 16 19 19% -10% 133 144 143 105 110 5% -17%Other1 - - - - - - - 25 36 52 87 83 -5% 232%Total New Undergraduate 2,136 2,461 2,564 2,640 2,935 11% 37% 696 818 867 833 974 17% 40%
Table 2.8: New Graduate & Law Fall Enrollment by Academic Load: 5-Year Trend % Change in % Change in Full-Time Full-Time Part-Time Part-Time
College 2008 2009 2010 2011 2012 1-Year 5-Year 2008 2009 2010 2011 2012 1-Year 5-Year
Business 146 240 180 178 209 17% 43% 184 253 239 233 227 -3% 23%CLASS 96 100 103 79 88 11% -8% 82 98 112 117 107 -9% 30%Education 144 102 93 95 102 7% -29% 251 259 252 233 241 3% -4%Nursing - 5 - 2 9 350% - 12 5 13 20 10 -50% -17%Engineering 20 50 39 30 29 -3% 45% 65 83 85 83 78 -6% 20%Science 133 124 140 142 137 -4% 3% 80 95 68 104 103 -1% 29%Urban Affairs 33 36 34 30 24 -20% -27% 64 58 62 52 42 -19% -34%Law 144 160 148 131 109 -17% -24% 70 45 44 40 37 -8% -47%Graduate Studies2 - - 1 - 1 - - 17 14 23 10 5 -50% -71%
Total New Graduate & Law 716 817 738 687 708 3% -1% 825 910 898 892 850 -5% 3%
Table 2.9: New Fall Enrollment by College: 5-Year Trend Percent Change
College 2008 2009 2010 2011 2012 1-Year 5-Year
Business 819 1,053 960 904 980 8% 20%CLASS 864 944 1,063 1,124 1,162 3% 34%Education 665 707 595 555 547 -1% -18%Nursing 150 139 244 176 202 15% 35%Engineering 283 378 388 386 474 23% 67%Science 709 828 957 1,051 1,178 12% 66%Urban Affairs 154 161 179 163 142 -13% -8%Law 214 205 192 171 146 -15% -32%Undergraduate Studies 319 356 239 304 418 38% 31%Undergraduate Non-Degree2 154 185 174 121 129 7% -16%Graduate Studies 17 14 24 10 6 -40% -65%Other1 25 36 52 87 83 -5% 232%Total New Students 4,373 5,006 5,067 5,052 5,467 8% 25%
Undergraduate full-time status: Any student registered for a minimum of 12 hours.Graduate full-time status: Any student registered for a minimum of 9 hours.Law full-time status: Any student registered for a minimum of 13 hours.
1 Other includes students enrolled in Air Force, Career Services, English as a Second Language, Military Science, Special Programs and Study Abroad.
2 Undergraduate Non-Degree and Graduate Studies fluctuations are due to the reclassification of academic plans.

Cleveland State U
niversity / 2013 Book of Trends14 Table 2.10: Fall Enrollment by Class Standing and Student Credit Hours: 5-Year Trend
Table 2.10a: ENROLLMENT BY CLASS STANDING
Percent Change
Class Standing 2008 % 2009 % 2010 % 2011 % 2012 % 1 Year 5 Year
Freshmen 2,574 17% 2,783 17% 2,944 17% 2,988 17% 3,175 18% 6% 23%Sophomores 1,490 10% 1,637 10% 1,636 9% 1,764 10% 1,830 10% 4% 23%Juniors 1,914 12% 2,076 13% 2,386 14% 2,198 13% 2,300 13% 5% 20%Seniors 3,847 25% 4,212 26% 4,530 26% 4,772 27% 4,734 27% -1% 23%Masters 4,571 30% 4,717 29% 4,810 28% 4,676 27% 4,501 26% -4% -2%Doctoral 371 2% 436 3% 470 3% 486 3% 484 3% 0% 30%Law 672 4% 645 4% 610 4% 563 3% 501 3% -11% -25%Total 15,439 100% 16,506 100% 17,386 100% 17,447 100% 17,525 100% 0% 14%
Table 2.10b: STUDENT CREDIT HOURS BY COURSE LEVEL
Percent Change
Class Standing 2008 % 2009 % 2010 % 2011 % 2012 % 1 Year 5 Year
Developmental 4,142 3% 4,019 2% 2,782 1% 2,986 2% 2,690 1% -10% -35%Lower (100-299) 64,659 40% 72,735 41% 79,303 42% 79,157 42% 83,554 43% 6% 29%Upper (300-499) 50,966 31% 53,156 30% 58,133 31% 61,316 32% 62,180 32% 1% 22%Masters (500-699) 32,291 20% 33,892 19% 35,373 19% 35,500 19% 34,180 18% -4% 6%Doctoral (700-899) 2,608 2% 3,183 2% 3,320 2% 3,238 2% 3,306 2% 2% 27%Law (500-900) 8,674 5% 8,496 5% 8,015 4% 7,425 4% 6,776 4% -9% -22%Total 163,340 100% 175,481 100% 186,926 100% 189,622 100% 192,686 100% 2% 18%
Study Abroad: Study Abroad (SAB) courses are included in the course level of Upper rather than following the standard numeric values associated with the catalog number of the course. Note: The lower number of units for Developmental courses reflects a recategorization of some English classes from Developmental to Lower.
Figure 2.10a: Enrollment by Class Standing Figure 2.10b: Student Credit Hours by Course Level

15Section 2 - Cam
pus Enrollment Characteristics &
Trends
Section 2
Table 2.11: Total Fall 2012 Enrollment by Academic Level: 5-Year Trend
Percent Change
Academic Level 2008 2009 2010 2011 2012 1 Year 5 Year
Undergraduates 9,825 10,708 11,496 11,722 12,039 3% 23%Masters 4,568 4,718 4,810 4,676 4,501 -4% -1%Doctoral 374 435 470 486 484 0% 29%Law 672 645 610 563 501 -11% -25%University Total 15,439 16,506 17,386 17,447 17,525 0% 14%

Cleveland State University / 2013 Book of Trends16
1 Other includes students enrolled in Air Force, Career Services, English as a Second Language, Military Science, Special Programs and Study Abroad.Note: Some SCH gain in CLASS and Science is attributed to the redistribution of developmental English & Math courses to these units from Undergraduate Studies. This tale uses units progress rather than units taken. Undergraduate Non-Degree and Graduate Studies fluctuations are due to procedural changes.
Table 2.12: Fall Enrollment by College: 5-Year Trend
2008 2009 2010 2011 2012 Percent Change
College Enrollment % Enrollment % Enrollment % Enrollment % Enrollment % 1-Year 5-Year
Business 3,053 20% 3,423 21% 3,651 21% 3,481 20% 3,369 19% -3% 10%CLASS 3,243 21% 3,425 21% 3,658 21% 3,736 21% 3,731 21% 0% 15%Education 2,626 17% 2,591 16% 2,621 15% 2,451 14% 2,266 13% -8% -14%Nursing 522 3% 558 3% 592 3% 559 3% 592 3% 6% 13%Engineering 1,132 7% 1,272 8% 1,391 8% 1,452 8% 1,569 9% 8% 39%Science 2,355 15% 2,677 16% 3,072 18% 3,368 19% 3,727 21% 11% 58%Urban Affairs 615 4% 621 4% 688 4% 689 4% 620 4% -10% 1%Law 672 4% 645 4% 610 4% 563 3% 501 3% -11% -25%Undergraduate Studies 784 5% 838 5% 662 4% 739 4% 780 4% 6% -1%Undergraduate Non-Degree 353 2% 367 2% 334 2% 274 2% 245 1% -11% -31%Graduate Studies 53 0% 44 0% 45 0% 23 0% 19 0% -17% -64%Other1 31 0% 45 0% 62 0% 112 1% 106 1% -5% 242%Total Enrollment 15,439 100% 16,506 100% 17,386 100% 17,447 100% 17,525 100% 0% 14%
Table 2.13: Fall Student Credit Hours (SCH) by College: 5-Year Trend
2008 2009 2010 2011 2012 Percent Change
College SCH % SCH % SCH % SCH % SCH % 1-Year 5-Year
Business 23,697 15% 25,804 15% 27,613 15% 27,156 14% 26,889 14% -1% 13%CLASS 51,263 31% 55,788 32% 58,906 32% 57,758 30% 58,808 31% 2% 15%Education 17,326 11% 16,583 9% 17,296 9% 16,542 9% 16,165 8% -2% -7%Nursing 3,328 2% 3,650 2% 3,447 2% 4,411 2% 4,564 2% 3% 37%Engineering 7,807 5% 8,373 5% 10,011 5% 10,290 5% 10,054 5% -2% 29%Science 40,708 25% 45,346 26% 48,889 26% 52,560 28% 56,361 29% 7% 38%Urban Affairs 8,935 5% 9,460 5% 10,722 6% 11,009 6% 10,245 5% -7% 15%Law 8,674 5% 8,496 5% 8,015 4% 7,425 4% 6,776 4% -9% -22%Undergraduate Studies 928 1% 1,053 1% 1,060 1% 1,190 1% 1,419 1% 19% 53%Honors 112 0% 121 0% 144 0% 141 0% 121 0% -14% 8%Other1 562 0% 807 0% 823 0% 1,140 1% 1,284 1% 13% 128%Total SCH 163,340 100% 175,481 100% 186,926 100% 189,622 100% 192,686 100% 2% 18%
Figure 2.12 & 2.13: Fall Enrollment and FTE (SCH/15) Trend: Fall 2008-2012
0
5,000
10,000
15,000
Enrollment FTE
2008 2009 2010 2011 2012

17Section 2 - Campus Enrollment Characteristics & Trends
Sec
tio
n
2
Figure 2.14: Registered Student Credit Hours by Level - Fall 2012
Table 2.14: Registered Student Credit Hours by Level - Fall 2012
Registered Credit
Undergraduate Graduate Law All
Hours Enrollment Cumulative % Enrollment Cumulative % Enrollment Cumulative % Enrollment Cumulative %
0 164 1% - 0% - 0% 164 1% 1 89 2% 172 3% - 0% 261 2% 2 39 2% 77 5% 2 0% 118 3% 3 235 4% 403 13% 4 1% 642 7% 4 534 9% 471 23% 2 2% 1,007 13% 5 74 9% 61 24% 2 2% 137 13% 6 332 12% 982 43% 6 3% 1,320 21% 7 487 16% 350 50% 9 5% 846 26% 8 682 22% 943 69% 7 6% 1,632 35%GRAD FT 9 229 24% 420 78% 20 10% 669 39% 10 285 26% 285 84% 10 12% 580 42% 11 299 29% 125 86% 58 24% 482 45%UGRD FT 12 1,803 44% 224 91% 25 29% 2,052 57%LAW FT 13 1,032 52% 122 93% 32 35% 1,186 63% 14 1,139 62% 83 95% 41 44% 1,263 71% 15 1,549 75% 103 97% 169 77% 1,821 81% 16 1,780 89% 99 99% 58 89% 1,937 92% 17 644 95% 30 99% 32 95% 706 96% 18 385 98% 4 99% 21 99% 410 98% 19 169 99% 31 100% 2 100% 202 99% 20 60 100% - 100% - 100% 60 100% 21 12 100% - 100% - 100% 12 100% 22 10 100% - 100% - 100% 10 100% 23 4 100% - 100% - 100% 4 100% 24+ 3 100% - 100% 1 100% 4 100% TOTAL 12,039 4,985 501 17,525 Average 12.3 7.5 13.6 11.0
0%
20%
40%
60%
80%
Undergraduate Graduate Law
0-3 4-7 8-11 12-15 16-19 20+

Cleveland State University / 2013 Book of Trends18
Table 2.15: Enrollment by Age Category - Fall 2012 65 and Average College Gender Under 18 18-19 20-21 22-24 25-29 30-34 35-39 40-49 50-64 Over Unknown Age
Business Female 3 107 140 337 383 195 83 112 52 1 - 28.3 Male 5 171 260 431 524 250 165 110 39 1 - 27.4 Total 8 278 400 768 907 445 248 222 91 2 - 27.8CLASS Female 19 438 394 411 327 181 104 193 138 3 1 27.4 Male 12 293 294 313 260 116 61 90 76 7 - 26.5 Total 31 731 688 724 587 297 165 283 214 10 1 27.1Education Female 2 105 113 291 356 229 151 241 146 7 - 31.9 Male 1 30 55 96 134 100 76 79 52 2 - 31.9 Total 3 135 168 387 490 329 227 320 198 9 - 31.9Nursing Female 4 152 90 94 62 37 24 28 16 1 - 25.1 Male 2 18 14 22 11 8 1 5 3 - - 25.2 Total 6 170 104 116 73 45 25 33 19 1 - 25.1Engineering Female 3 49 53 64 37 22 5 8 3 - - 24.2 Male 9 275 229 335 273 101 35 54 14 - - 24.5 Total 12 324 282 399 310 123 40 62 17 - - 24.4Science Female 20 471 472 599 482 169 94 117 48 1 - 25.0 Male 14 202 217 301 286 100 54 56 24 - - 25.4 Total 34 673 689 900 768 269 148 173 72 1 - 25.1Urban Affairs Female 1 14 16 47 64 55 38 61 47 - - 34.5 Male - 10 19 54 56 46 22 40 29 1 - 32.5 Total 1 24 35 101 120 101 60 101 76 1 - 33.5Law Female - - 2 98 59 32 13 9 - - - 26.9 Male - - 1 111 100 53 13 9 1 - - 27.4 Total - - 3 209 159 85 26 18 1 - - 27.1Undergraduate Female 138 113 43 19 17 14 7 9 37 73 1 31.5Studies Male 88 41 16 26 18 9 2 5 29 75 - 36.7 Total 226 154 59 45 35 23 9 14 66 148 1 33.5Undergraduate Female - 2 11 40 20 10 6 14 15 2 - 32.0Non-Degree Male - 2 7 44 24 20 7 11 9 1 - 30.1 Total - 4 18 84 44 30 13 25 24 3 - 31.0Graduate Female - - - 2 - 2 1 4 2 - - 39.9Studies Male - - - 1 2 - 4 - 1 - - 34.8 Total - - - 3 2 2 5 4 3 - - 37.7Other1 Female - 5 3 15 14 1 2 1 - - - 25.0 Male - 14 8 19 9 13 1 1 - - - 24.5 Total - 19 11 34 23 14 3 2 - - - 24.7University Female 190 1,456 1,337 2,017 1,821 947 528 797 504 88 2 28.0 Male 131 1,056 1,120 1,753 1,697 816 441 460 277 87 - 27.3 Total 321 2,512 2,457 3,770 3,518 1,763 969 1,257 781 175 2 27.7
1Other includes students enrolled in Air Force, Career Services, English as a Second Language, Military Science, Special Programs and Study Abroad. Note: Age is unknown for one male student in Engineering.
Average Median
University: 27.7 24Undergraduate: 25.9 22Graduate: 32.0 29Law: 27.1 25
Figure 2.15: Enrollment by Age Category - Fall 2012
Under 18 18-19 20-21 22-24 25-29 30-34 35-39 40-49 50-64 65 and Over
22-2421.5%
25-2920.1%
40-497.2%
35-395.5%
30-3410.1%
18-19.3%
20-2114.0%
Under 181.8%
65 and Over1.0%
50-644.5%
14

19Section 2 - Campus Enrollment Characteristics & Trends
Sec
tio
n
2
Table 2.16: Enrollment by Level and Residency Status - Fall 2012
Resident Type Undergraduate Undergraduate in % Graduate Graduate in % Law Law in % Total
Ohio Resident 11,098 92 4161 84 469 92 15,728 Non-Ohio Resident 401 3 128 2 25 7 554 Non-Resident Alien 540 4 696 14 7 1 1,243 Total 12,039 100% 4,985 100% 501 100% 17,525
Table 2.18: Enrollment by Ohio County Fall 2012
County Number of Students
Cuyahoga .......................................................................11,733Lake ..................................................................................1,313Lorain ...................................................................................926Summit ................................................................................456Medina .................................................................................441Geauga ................................................................................307Erie ......................................................................................106Portage ..................................................................................95Stark ......................................................................................88Ashtabula ..............................................................................87Trumbull .................................................................................78Franklin ..................................................................................38Wayne ....................................................................................32Lucas, Mahoning (28/county) ................................................56Columbiana ...........................................................................23Huron .....................................................................................18Sandusky ...............................................................................16Delaware ................................................................................14Wood .....................................................................................13Hamilton ................................................................................12Ashland ..................................................................................12Montgomery, Richland (11/county) .......................................22Tuscarawas ..............................................................................9Seneca ....................................................................................7Fairfield, Licking (6/county) ...................................................12Washington ..............................................................................5Allen, Crawford, Fayette, Greene, Hancock, Ottawa, Warren (4/county) ..................................................................28Butler, Carroll, Clermont, Fulton, Knox, Marion, Muskingum, Putnam, Union, Williams (3/county) ..................30Athens, Auglaize, Belmont, Henry, Jackson, Jefferson, Lawrence, Logan, Miami, Ross (2/county) ............................20Champaign, Clark, Clinton, Coshocton, Defiance, Guernsey, Harrison, Holmes, Madison, Monroe, Pauling, Perry, Pickaway, Preble, Shelby, Van Wert (1/county) .....................16Total ............................................................................................... 16,013* Excluding Non-Resident Aliens
Table 2.17: Enrollment by State Fall 2012
State Number of Students
Ohio ..................................................................................... 16,012Pennsylvania .............................................................................. 67New York .................................................................................... 41Michigan .................................................................................... 26Illinois ......................................................................................... 20Indiana, Virginia (11/state) ......................................................... 22Maryland, Florida (9/state) ........................................................ 18California, Kentucky (8/state) .................................................... 16New Jersey .................................................................................. 6Tennessee, Wisconsin (5/state)................................................. 10Oklahoma, North Carolina (4/state) ............................................ 8Connecticut, Washington, Idaho, Georgia, Texas, Massachusetts (3/state) ............................................................ 18Arizona, Oregon, District of Columbia (2/state) .......................... 6Missouri, Minnesota, Louisiana, West Virginia, Mississippi, Kansas, New Mexico, Armed Forces Europe, Delaware, North Dakota, Vermont ........................................................................ 11Unknown State ............................................................................ 1Non-Resident Alien .............................................................. 1,243Total States ..................................................................................17,525
Note: Table 2.16 is based on student’s residency for fee purposes, while Table 2.17 and 2.18 are based on student’s address.
Non-Resident Aliens are those with a citizenship status of Alien Temporary.
A resident of Ohio may have mail sent to an out of state address. As a result, Ohio resident totals may not match in the two tables.

Cleveland State University / 2013 Book of Trends20
Map of 2012 Fall Enrollment by Ohio County
Williams3
Fulton3
Henry2
Lucas
Wood
Paulding1 Putnam
3Hancock
Van Wert1 Allen
4
MercerAuglaize
2
Shelby
DarkeMiami
2
Preble1
Montgomery11
Butler Warren4
12Clermont
3
28
13
4
1
Clark1
Champaign1
Logan2
Greene4
3
Hamilton
Union3
Marion3
Wyandot Crawford4
Seneca7
Hardin1
Ottawa4
Sandusky16
Clinton1
Highland
Brown Adams Scioto1
Pike
Ross2
Pickaway1Fayette
4
Madison1
Franklin38
Delaware14
Morrow
Richland11
Huron18
Erie 106 Lorain926
Cuyahoga11,733
Lake
Geauga307
Medina441
Summit456
Portage95
Ashtabula87
Columbiana23
Stark88
Wayne32
Ashland12
Mahoning28
rumbull78
1,313
Licking6
Knox3
Muskingum3
Guernsey1 Belmont
2
Harrison1
Jefferson2
Carroll3
Tuscarawas9
Coshocton1
Holmes1
T
Jackson2
Gallia
Meigs
VintonAthens
2
Hocking
6Perry
1
Washington5
Morgan1
Noble Monroe1
Lawrence2

21Section 2 - Campus Enrollment Characteristics & Trends
Sec
tio
n
2
Country/Region Number of Students
Saudi Arabia ......................................................................................409
India ...................................................................................................319
China..................................................................................................187
Republic of Korea, Turkey (27/country) ................................................54
Kuwait ..................................................................................................24
Canada .................................................................................................20
Nigeria .................................................................................................18
Province of China Taiwan ....................................................................15
Islamic Republic Of Iran .......................................................................13
Lebanon, Nepal (8/country) .................................................................16
Egypt, Viet Nam (7/country) .................................................................14
Sweden, Venezuela (6/country) ...........................................................12
Brazil......................................................................................................5
Albania, Germany, Jordan, Kenya, Pakistan, Russian Federation, Senegal, Thailand, South Africa, Zambia (4/country) ...........................40
Table 2.19: Enrollment by Country or Regions, Fall 2012
Burkina Faso, Bangladesh, Colombia, Ethiopia, France, Ghana, Indonesia, Israel, Japan, Libyan Arab Jamahiriya, Netherlands, New Zealand, Poland, Sri Lanka, United Kingdom (3/country) ............45
Bulgaria, Ecuador, Jamaica, Malaysia, Mexico, Mongolia, Philippines, Republic of Serbia, Romania, Syrian Arab Republic, Togo, United Arab Emirates (2/country) ...............................................24
Australia, Azerbaijan, Bosnia and Herzegovina, Botswana, Cameroon, Chile, Costa Rica, Cote D’Ivoire, Czech Republic, Denmark, Finland, Georgia, Hong Kong, Iraq, Kyrgyzstan, Peru, Romania, Slovenia, Sudan, United Republic of Tanzania, Tunisia, Uganda, Ukraine, Uzbekistan, Virgin Islands (British), Zimbabwe (1/country) .................26
Unknown ................................................................................................2
Total ................................................................................................1,243
Note: This list includes those students with Alien Temporary Status.
Source: Institutional Research
Country/Region Number of Students

Cleveland State University / 2013 Book of Trends22
Table 2.20: Spring Enrollment by College: 5-Year Trend
2009 2010 2011 2012 2013 Percent Change
College Enrollment % Enrollment % Enrollment % Enrollment % Enrollment % 1-Year 5-Year
Business 2,995 19% 3,408 21% 3,401 20% 3,265 20% 3,201 19% -2% 7%CLASS 3,243 20% 3,298 20% 3,461 21% 3,499 21% 3,446 21% -2% 6%Education 2,554 16% 2,636 16% 2,556 15% 2,371 14% 2,285 14% -4% -11%Nursing 545 3% 455 3% 641 4% 588 4% 630 4% 7% 16%Engineering 1,067 7% 1,249 8% 1,334 8% 1,354 8% 1,534 9% 13% 44%Science 2,312 14% 2,644 16% 2,957 18% 3,185 19% 3,484 21% 9% 51%Urban Affairs 618 4% 623 4% 692 4% 641 4% 573 3% -11% -7%Law 628 4% 606 4% 568 3% 525 3% 474 3% -10% -25%Undergraduate Studies 690 4% 745 5% 577 3% 631 4% 763 5% 21% 11%Undergraduate Non-Degree 365 2% 346 2% 285 2% 284 2% 220 1% -23% -40%Graduate Studies 87 1% 50 0% 54 0% 46 0% 14 0% -70% -84%Other1 33 0% 46 0% 74 0% 88 1% 86 1% -2% 161%Total Enrollment 15,137 100% 16,106 100% 16,600 100% 16,477 100% 16,710 100% 1% 10%
Table 2.21: Spring Student Credit Hours (SCH) by College: 5-Year Trend
2009 2010 2011 2012 2013 Percent Change
College SCH % SCH % SCH % SCH % SCH % 1-Year 5-Year
Business 22,563 14% 25,932 14% 25,896 15% 25,618 15% 26,296 14% 3% 17%CLASS 50,119 31% 53,720 33% 53,808 33% 52,789 32% 55,955 31% 6% 12%Education 17,475 12% 17,277 12% 17,898 11% 16,980 10% 16,768 9% -1% -4%Nursing 3,644 2% 4,026 2% 4,550 2% 5,063 2% 5,481 3% 8% 50%Engineering 7,584 5% 8,778 5% 9,952 5% 10,024 5% 10,404 6% 4% 37%Science 39,181 22% 41,834 24% 44,637 26% 47,147 25% 50,493 28% 7% 29%Urban Affairs 9,740 5% 9,897 6% 10,629 6% 10,603 6% 9,993 5% -6% 3%Law 7,901 6% 7,801 6% 7,451 5% 6,844 5% 6,262 3% -9% -21%Undergraduate Studies 202 1% 198 0% 179 0% 186 0% 229 0% 23% 13%Graduate Studies - 0% - 0% - 0% - 0% - 0% - - Honors 131 0% 102 0% 204 0% 101 0% 27 0% -73% -79%Other1 585 0% 911 0% 975 0% 1,019 1% 855 0% -16% 46%Total SCH 159,125 100% 170,476 100% 176,179 100% 176,374 100% 182,763 100% 4% 15%1 Other includes students enrolled in Air Force, Career Services, English as a Second Language, Military Science, Physician Assistant, Special Programs and Study Abroad.This table uses units progress. The Graduate Studies category has been removed from this table as these courses are not offered in Spring.
Figure 2.20 & 2.21: Spring Enrollment and FTE (SCH/15) Trend Spring 2009-2013
0
5,000
10,000
15,000
Enrollment FTE2009 2010 2011 2012 2013

23Section 2 - Campus Enrollment Characteristics & Trends
Sec
tio
n
2
Table 2.22: Summer Enrollment by College: 5-Year Trend
2008 2009 2010 2011 2012 Percent Change
College Enrollment % Enrollment % Enrollment % Enrollment % Enrollment % 1-Year 5-Year
Business 1,581 21% 1,650 23% 1,837 26% 1,783 24% 1,733 24% -3% 10%CLASS 1,007 13% 1,066 15% 1,162 17% 1,076 15% 1,066 15% -1% 6%Education 1,818 24% 1,616 22% 1,581 23% 1,420 19% 1,374 19% -3% -24%Nursing 202 3% 223 3% 207 3% 209 3% 172 2% -18% -15%Engineering 336 4% 239 3% 354 5% 366 5% 445 6% 22% 32%Science 899 12% 962 13% 1,068 15% 1,242 17% 1,337 18% 8% 49%Urban Affairs 215 3% 195 3% 225 3% 265 4% 218 3% -18% 1%Law 217 3% 216 3% 204 3% 207 3% 189 3% -9% -13%Undergraduate Studies 204 3% 150 2% 155 2% 108 1% 155 2% 44% -24%Undergraduate Non-Degree 606 8% 618 9% 572 8% 529 7% 493 7% -7% -19%Graduate Studies 99 1% 45 1% 50 1% 36 0% 19 0% -47% -81%Other1 21 0% 36 0% 48 1% 73 1% 94 1% 29% 348%Total Enrollment 7,205 100% 7,016 100% 7,463 100% 7,314 100% 7,295 100% 0% -3%
Table 2.23: Summer Student Credit Hours (SCH) by College: 5-Year Trend
2008 2009 2010 2011 2012 Percent Change
College SCH % SCH % SCH % SCH % SCH % 1-Year 5-Year
Business 10,093 21% 10,775 23% 11,043 22% 10,626 22% 10,594 22% 0% 5%CLASS 9,743 21% 9,276 20% 10,989 22% 10,821 22% 10,490 22% -3% 8%Education 9,758 21% 9,493 20% 9,354 19% 8,582 17% 8,132 17% -5% -17%Nursing 1,629 3% 1,968 4% 1,750 4% 1,436 3% 1,250 3% -13% -23%Engineering 661 1% 189 0% 564 1% 435 1% 938 2% 116% 42%Science 10,313 22% 10,189 22% 11,183 23% 12,236 25% 11,951 25% -2% 16%Urban Affairs 3,502 7% 3,454 7% 3,176 6% 3,774 8% 3,041 6% -19% -13%Law 915 2% 944 2% 890 2% 992 2% 922 2% -7% 1%Other1 360 1% 723 2% 649 1% 503 1% 540 1.1% 7% 50%Total SCH 46,974 100% 47,011 100% 49,598 100% 49,405 100% 47,858 100% -3% 2%1 Other includes students enrolled in Air Force, Career Services, English as a Second Language, Military Science, Special Programs and Study Abroad.This table uses units progress ratheer than units taken.
Figure 2.22 & 2.23: Summer Enrollment and FTE (SCH/15) Trend Summer 2008-2012
0
5,000
10,000
Enrollment FTE
2008 2009 2010 2011 2012

Cleveland State University / 2013 Book of Trends24
Table 2.24: Annualized Student Credit Hours (SCH) by College: 5-Year Trend
2008-09 2009-10 2010-11 2011-12 2012-13 Percent Change
College SCH % SCH % SCH % SCH % SCH % 1-Year 5-Year
Business 56,353 15% 62,511 16% 64,552 17% 63,400 15% 63,779 15% 1% 13%
CLASS 111,125 30% 118,784 30% 123,703 33% 121,368 29% 125,253 30% 3% 13%
Education 44,559 12% 43,353 11% 44,548 12% 42,104 10% 41,065 10% -2% -8%
Nursing 8,601 2% 9,644 2% 9,747 3% 10,910 3% 11,295 3% 4% 31%
Engineering 16,052 4% 17,340 4% 20,527 6% 20,749 5% 21,396 5% 3% 33%
Science 90,202 24% 97,369 25% 104,709 28% 111,943 27% 118,805 28% 6% 32%
Urban Affairs 22,177 6% 22,811 6% 24,527 7% 25,386 6% 23,279 5% -8% 5%
Law 17,489 5% 17,240 4% 16,356 4% 15,261 4% 13,960 3% -9% -20%
Undergraduate Studies 1,130 0% 1,251 0% 1,239 0% 1,376 0% 1,648 0% 20% 46%
Graduate Studies - 0% - 0% - 0% - 0% - 0% - -
Honors 243 0% 223 0% 348 0% 242 0% 148 0% -39% -39%
Other1 1,507 0% 2,441 1% 2,447 1% 2,662 1% 2,679 1% 1% 78%
Total Annualized SCH 369,438 100% 392,967 100% 412,703 100% 415,401 100% 423,307 100% 2% 15%
Annualized FTE (Annualized SCH/30) 12,314 13,099 13,757 13,847 14,110 2% 15%
Unduplicated Enrollment 20,109 21,035 21,717 21,319 21,510 1% 7%
1Other includes students enrolled in Air Force, Career Services, English as a Second Language, Military Science, Physician Assistant, Special Programs and Study Abroad.
Figure 2.24: Annualized FTE (SCH/30) and Unduplicated Enrollment Trend
5,000
15,000
25,000
2008-09 2009-10 2010-11 2011-12 2012-13
Unduplicated Enrollment Annualized FTE (Annualized SCH/30)

25Section 2 - Campus Enrollment Characteristics & Trends
Sec
tio
n
2
Table 2.25: Yearly Change in Enrollment by Campus Types for Ohio Institutions Fall 2008 – 2012
Percent Change
Campus Type 2008† 2009 2010 2011 2012 1-year 5-year
Community College 74,792 82,528 85,093 83,107 80,786 -2.8% 8.0%State Community College 72,570 82,491 84,663 80,459 74,669 -7.2% 2.9%Technical College 32,080 38,242 41,247 40,658 37,279 -8.3% 16.2%University Branch Campus 48,815 54,999 58,714 57,389 55,013 -4.1% 12.7%University Main Campus 262,506 274,449 286,753 289,882 287,306 -0.9% 9.4%Note: (†) Medical University of Ohio was excluded because their data has not been finalized. Data for 2011 have now been finalized for Wright State University and Lorain County Community College, which has slightly increased some of the totals for 2011 that were reported in last year’s Book of Trends. Run Date: 10/8/2013.
Figure 2.25: Yearly Change in Enrollment by Campus Types for Ohio Institutions Fall 2008 – 2012
Table 2.26: Main Campus Enrollment for Select Ohio Four Year Institutions Fall 2008 – 2012
Percent Change
Institution 2008 2009 2010 2011 2012 1-year 5-year
University of Akron 24,722 26,395 27,718 27,998 26,930 -3.8% 8.9%Bowling Green State University 17,877 17,350 17,666 17,502 17,276 -1.3% -3.4%University of Cincinnati 29,566 31,296 32,617 33,812 34,283 1.4% 16.0%Cleveland State University 15,438 16,506† 17,386 17,447 17,525 0.4% 13.5%Central State University 2,157† 2,423 2,272 2,476 2,125 -14.2% -1.5%Kent State University 23,174† 25,351† 26,841 28,064 28,827 2.7% 24.4%Medical University of Ohio NA NA NA NA NA NA NAMiami University 16,815 16,767 18,243 17,926 18,107 1.0% 7.7%Ohio State University 54,551† 55,687 57,360† 57,857† 57,516 -0.6% 5.4%Ohio University 21,363† 22,640† 25,083 26,201 27,402 4.6% 28.3%Shawnee State University 3,988 4,326 4,554 4,684 4,620 -1.4% 15.8%University of Toledo 22,252† 23,119 23,144 22,679 21,715 -4.3% -2.4%Wright State University 16,626† 17,593† 18,354† 18,214† 16,665† -8.5% 0.2%Youngstown State University 13,683 14,649 15,100 14,496 13,769 -5.0% 0.6%
Note: (†) Indicates institutions which had not finalized enrollment data by query date. Enrollment data excludes Study Abroad and Graduation Requirement course enrollments.
Source: The Ohio Board of Regents HEI Student Enrollment query. Run Date: October 8, 2013.
T
Yearly Change in Headcount Enrollment
-30.0%-25.0%-20.0%-15.0%-10.0%
-5.0%0.0%5.0%
10.0%15.0%20.0%25.0%30.0%
07 - 08 08 - 09 09 - 10 10-11 11-12Community College State Community College echnical College University Branch Campus University Main Campus

Cleveland State University / 2013 Book of Trends26

Se
ct
ion
3
Book of Trends
Cleveland State University
2013
Campus EnrollmentCharacteristics & Trends
3

Cleveland State University / 2013 Book of Trends28
For this year’s Book of Trends we have made an adjustment in how we group students within a given department (tables 3.1 through 3.11a). Students with multiple majors are now reported in each major. Tables 3.1 through 3.11a show the number of declared majors within a given department and school, not the number of students. We were only able to apply this new method to Fall 2010 and Fall 2011 enrollment numbers; therefore numbers using the old method are reported from 2007, 2008, and 2009.
The rest of the tables in this chapter are at the school level and do follow the old rubric of selecting students based on their primary major, as determined by state reporting rules. As such, these tables do represent headcounts.

29Section 3 - Enrollm
ent Characteristics of Students in CSU Colleges
Section 3
Table 3.1: College of Business: Fall Enrollment by Level and Major, 5-Year Trend Fall Term Percent Change
Primary Primary All All All
Department/Program Description 2008 2009 2010 2011 2012 1 year 5 year
Undergraduate
Accounting Accounting 365 390 412 366 372 2% 2%Business Administration Business Administration 298 404 469 485 503 4% 69% Business Administration (LK) 21 49 55 51 43 -16% 105%Computer & Information Science Computer and Information Science 131 176 183 183 213 16% 63% Computer Science 25 20 21 23 26 13% 4% Information Systems 95 107 128 117 109 -7% 15%Finance Finance 218 185 186 158 131 -17% -40%Management & Labor Relations Management & Labor Relations 118 100 137 119 95 -20% -19%Marketing Marketing 197 196 238 221 214 -3% 9%Operations & Supply Chain Management Operations & Supply Chain Management 42 41 48 59 65 10% 55%Other Business Accelerated Bachelors of Business Administration - - - 2 - -100% - Business Biotechnology - - - - 1 - - Business Economics 61 58 61 56 52 -7% -15% International Business 84 103 125 122 102 -16% 21% Pre-Business Administration 13 10 6 6 2 -67% -85% Undecided Business 258 227 212 140 83 -41% -68%Total 1,926 2,066 2,281 2,108 2,011 -5% 4%Graduate (excluding Doctoral) Accounting Financial Accounting & Audit 80 161 205 224 243 8% 204% Tax Program 17 25 34 43 44 2% 159%AMBA Accelerated Business Administration 45 15 33 47 44 -6% -2%Business Administration Business Administration 564 672 691 666 620 -7% 10%Computer & Information Science Computer and Information Science 93 99 110 87 91 5% -2% Computer and Information Science (4+1) - - - 1 1 0% - Health Care Informatics Certificate 1 - - 1 2 100% 100%EMBA Executive Business Administration 42 34 40 28 31 11% -26%Finance Finance 1 - - - - - -100%Health Care Administration MBA-Health Care 22 42 45 44 49 11% 123%Labor Relations & Human Resources Labor Relations & Human Resources 57 50 69 70 73 4% 28%Marketing Global Business - 1 - 1 - -100% - Marketing Analytics Certificate - 2 1 2 2 0% -Other Business Graduate Business 169 194 174 199 184 -8% 9%Total 1,091 1,295 1,402 1,413 1,384 -2% 27%
continued on next page

Cleveland State U
niversity / 2013 Book of Trends30 Table 3.1: College of Business: Fall Enrollment by Level and Major, 5-Year Trend
Fall Term Percent Change
Primary Primary All All All
Department/Program Description 2008 2009 2010 2011 2012 1 year 5 year
Doctoral Business Administration Accounting 1 - - - - - -100% Business Administration 21 - - - - - -100% Computer and Information Science - 13 12 10 8 -20% - Finance 4 17 8 8 7 -13% 75% Labor Relations and Human Resources - 2 2 2 - -100% - Marketing 5 16 12 11 9 -18% 80% Marketing-Global Business Specialization - 3 3 2 1 -50% - Operations & Supply Chain Management 5 11 10 5 5 0% 0%%
Total 36 62 47 38 30 -21% -17%
Total Business 3,053 3,423 3,730 3,559 3,425 -4% 12%
Note: Public Health transitioned from the College of Business to the College of Education during the 2007 reporting period.
continued from previous page

31Section 3 - Enrollm
ent Characteristics of Students in CSU Colleges
Section 3
Table 3.2 : College of Liberal Arts and Social Sciences: Fall Enrollment by Level and Major, 5-Year Trend
Fall Term Percent Change
Primary Primary All All All
Department/Program Description 2008 2009 2010 2011 2012 1 year 5 year
Undergraduate Anthropology Anthropology 53 62 82 89 76 -15% 43% Linguistics 16 18 28 28 30 7% 88%Art Art 197 215 228 240 78 -68% -60% Art Education - - - - 20 - - Graphic Design 6 5 12 7 5 -29% -17% Studio Art: Drawing - - - - 15 - - Studio Art: Graphic Design - - - - 70 - - Studio Art: Painting - - - - 10 - - Studio Art: Photography - - - - 17 - - Studio Art: Print Making - - - - 2 - - Studio Art: Sculpture/Ceramics - - - - 4 - -Communication Certificate in Journalism 1 - 2 - - - -100% Communication 261 236 248 203 192 -5% -26% Communication Management 29 37 42 39 37 -5% 28% Film and Digital Media 136 132 167 174 168 -3% 24% Journalism 155 172 203 185 201 9% 30% Multimedia Advertising 1 - 1 - - - -100%Economics Economics 17 29 41 38 46 21% 171%English English 210 221 251 244 206 -16% -2% Professional Writing Certificate - 1 1 - 1 - -History History 119 143 135 122 104 -15% -13% Social Studies 23 28 52 43 39 -9% 70%Interdisciplinary Black Studies - - - 4 10 150% - Classical and Medieval Studies 11 11 7 9 9 0% -18% Liberal Studies 54 48 65 46 36 -22% -33% Women’s Studies 10 7 12 8 7 -13% -30%Modern Languages French 16 8 9 12 13 8% -19% Spanish 39 45 60 55 52 -5% 33%Music Music 95 68 62 71 14 -80% -85% Music Composition - - - - 8 - - Music Education - - - 3 35 1067% - Music Performance - - - 6 29 383% - Music Therapy - - - 4 38 850% - Bachelor of Arts in Music - - 9 13 6 -54% - Pre-Music 21 59 83 62 32 -48% 52%Other CLASS Other CLASS (FC) 2 - 2 2 1 -50% -50% Pre-Education 14 7 2 2 - -100% -100% Pre-Social Work 61 101 79 107 143 34% 134% Undecided 134 216 248 253 191 -25% 43% Undecided CLASS 229 170 101 215 346 61% 51%
continued on next page
Note: Other CLASS (FC) represents former First College students with non-specific majors, such as Personally Designed Major, who have not declared a new major.

Cleveland State U
niversity / 2013 Book of Trends32 Table 3.2 : College of Liberal Arts and Social Sciences: Fall Enrollment by Level and Major, 5-Year Trend
Philosophy Bioethics Certificate - 1 3 3 1 -67% - Philosophy 22 25 27 25 26 4% 18% Philosophy - Ethics Track - - 3 1 2 100% -Political Science/IR International Relations 50 58 79 92 96 4% 92% Political Science 111 138 162 144 148 3% 33%Religious Studies Religious Studies 23 16 30 25 21 -16% -9%Social Work Social Work 224 194 241 242 219 -10% -2%Sociology Criminal Justice Certificate - - - 1 1 0% - Criminology 202 220 340 353 351 -1% 74% Social Science 10 8 12 13 8 -38% -20% Sociology 100 95 145 178 166 -7% 66%Theatre and Dance Drama 45 49 52 54 63 17% 40%Total 2,697 2,843 3,326 3,415 3,393 -1% 26%
Fall Term Percent Change
Primary Primary All All All
Department/Program Description 2008 2009 2010 2011 2012 1 year 5 year
Graduate Art Art - 1 - 1 - -100% -Communication Communication 25 35 36 30 23 -23% -8%Economics Economics 16 27 24 31 29 -6% 81%English English 65 68 78 74 78 5% 20%English Master of Fine Arts-Creative Writing 19 17 23 24 20 -17% 5%History History 31 32 33 38 34 -11% 10%Modern Languages Spanish 18 21 16 11 7 -36% -61%Music Music 46 43 44 28 32 14% -30%Other CLASS Graduate CLASS Certificate 1 1 - - - - -100% Undecided CLASS 72 80 64 73 61 -16% -15%Philosophy Advanced Studies in Bioethics 3 1 7 3 1 -67% -67%Philosophy Philosophy 10 12 13 13 14 8% 40%Political Science/IR Global Interaction - 4 24 46 33 -28% -Social Work Social Work 205 197 193 206 246 19% 20%Sociology Sociology 35 43 38 32 26 -19% -26%Total 546 582 593 610 604 -1% 11%
CLASS TOTAL 3,243 3,425 3,919 4,025 3,997 -1% 23%
Note: Other CLASS (FC) represents former First College students with non-specific majors, such as Personally Designed Major, who have not declared a new major.
Fall Term Percent Change
Primary Primary All All All
Department/Program Description 2008 2009 2010 2011 2012 1 year 5 year
continued from previous page
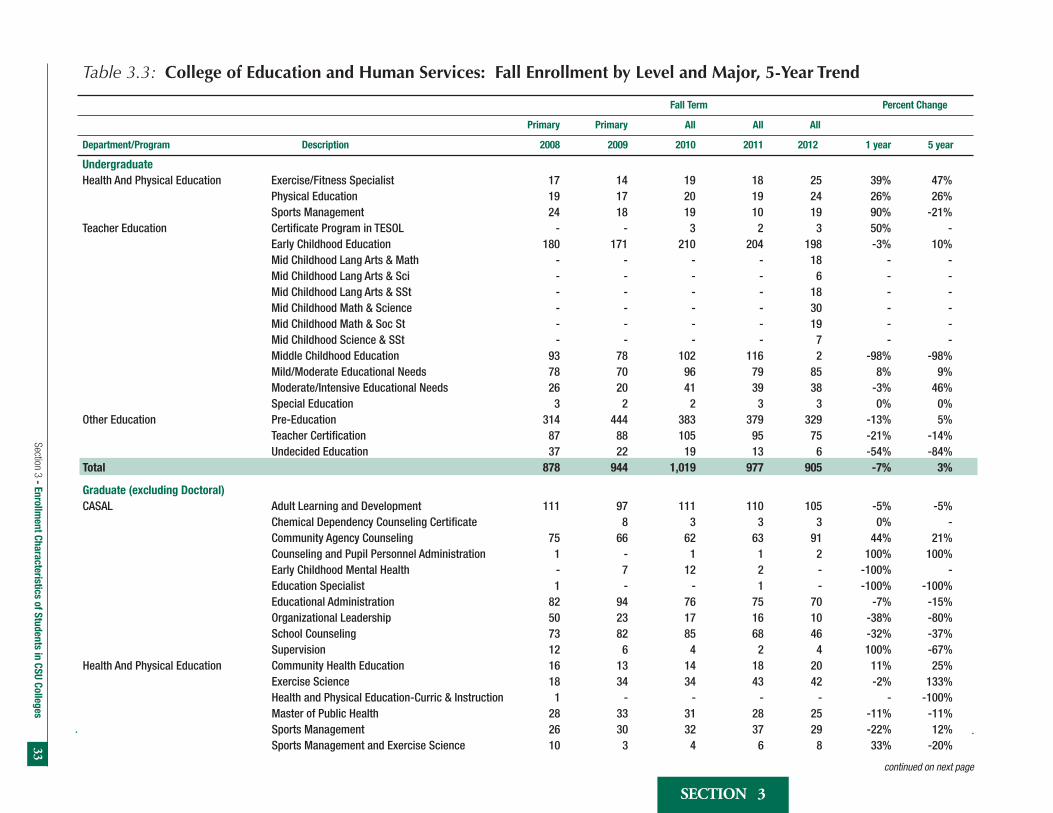
33Section 3 - Enrollm
ent Characteristics of Students in CSU Colleges
Section 3
Table 3.3: College of Education and Human Services: Fall Enrollment by Level and Major, 5-Year Trend Fall Term Percent Change
Primary Primary All All All
Department/Program Description 2008 2009 2010 2011 2012 1 year 5 year
Undergraduate Health And Physical Education Exercise/Fitness Specialist 17 14 19 18 25 39% 47% Physical Education 19 17 20 19 24 26% 26% Sports Management 24 18 19 10 19 90% -21%Teacher Education Certificate Program in TESOL - - 3 2 3 50% - Early Childhood Education 180 171 210 204 198 -3% 10% Mid Childhood Lang Arts & Math - - - - 18 - - Mid Childhood Lang Arts & Sci - - - - 6 - - Mid Childhood Lang Arts & SSt - - - - 18 - - Mid Childhood Math & Science - - - - 30 - - Mid Childhood Math & Soc St - - - - 19 - - Mid Childhood Science & SSt - - - - 7 - - Middle Childhood Education 93 78 102 116 2 -98% -98% Mild/Moderate Educational Needs 78 70 96 79 85 8% 9% Moderate/Intensive Educational Needs 26 20 41 39 38 -3% 46% Special Education 3 2 2 3 3 0% 0%Other Education Pre-Education 314 444 383 379 329 -13% 5% Teacher Certification 87 88 105 95 75 -21% -14% Undecided Education 37 22 19 13 6 -54% -84%Total 878 944 1,019 977 905 -7% 3%
Graduate (excluding Doctoral) CASAL Adult Learning and Development 111 97 111 110 105 -5% -5% Chemical Dependency Counseling Certificate 8 3 3 3 0% - Community Agency Counseling 75 66 62 63 91 44% 21% Counseling and Pupil Personnel Administration 1 - 1 1 2 100% 100% Early Childhood Mental Health - 7 12 2 - -100% - Education Specialist 1 - - 1 - -100% -100% Educational Administration 82 94 76 75 70 -7% -15% Organizational Leadership 50 23 17 16 10 -38% -80% School Counseling 73 82 85 68 46 -32% -37% Supervision 12 6 4 2 4 100% -67%Health And Physical Education Community Health Education 16 13 14 18 20 11% 25% Exercise Science 18 34 34 43 42 -2% 133% Health and Physical Education-Curric & Instruction 1 - - - - - -100% Master of Public Health 28 33 31 28 25 -11% -11% Sports Management 26 30 32 37 29 -22% 12% Sports Management and Exercise Science 10 3 4 6 8 33% -20%
continued on next page

Cleveland State U
niversity / 2013 Book of Trends34 Table 3.3: College of Education and Human Services: Fall Enrollment by Level and Major, 5-Year Trend
Fall Term Percent Change
Primary Primary All All All
Department/Program Description 2008 2009 2010 2011 2012 1 year 5 year
Teacher Education Autism Spectrum Disorder/Fdtn - - - - 1 - - Certificate Program in TESOL 13 6 5 1 3 200% -77% Curriculum & Instruction 684 642 598 498 445 -11% -35% Middle Child Math Education 11 - - - - - -100% Middle Child Science Education 4 - - - - - -100% Teacher Leader Endorsement - - - - 1 - -Other Education Education 2 - - - - - -100% Graduate Education 250 213 219 167 125 -25% -50% Graduate Education Licensure 170 178 218 246 247 0% 45%Total 1,638 1,535 1,526 1,385 1,277 -8% -22%Doctoral Doctoral Counseling 16 18 19 17 16 -6% 0% Counseling Psychology 14 16 19 22 16 -27% 14% Leadership and Lifelong Learning 17 22 20 23 15 -35% -12% Learning and Development 35 29 26 26 31 19% -11% Policy Studies 12 14 16 16 19 19% 58% School Administration 16 13 12 16 13 -19% -19% Urban Education: Nursing - - - 1 2 100% -Total 110 112 112 121 112 -7% 2%Education Total 2,626 2,591 2,657 2,483 2,294 -8% -13%

35Section 3 - Enrollm
ent Characteristics of Students in CSU Colleges
Section 3
Table 3.4: School of Nursing: Fall Enrollment by Level and Major, 5-Year Trend Fall Term Percent Change
Primary Primary All All All
Department/Program Description 2008 2009 2010 2011 2012 1 year 5 year
UndergraduateNursing Nursing, BSN - Accelerated 56 68 46 78 69 -12% 23% RN to BSN Track 48 20 20 11 15 36% -69% Basic BSN Track 137 84 177 212 237 12% 73% Pre-Nursing1 233 343 - - - - -100% Pre-Nursing (Student does not have RN) - - 7 188 207 10% - Pre-Nursing (Student has RN) - - 12 13 10 -23% -Total 474 515 262 502 538 7% 14% Graduate (excluding Doctoral) Nursing Graduate Nursing Nondegree - - - 2 4 100% - MS Nursing 45 41 52 53 50 -6% 11% MS Nursing & MBA Joint Degree 1 1 2 2 2 0% 100% Nursing Education Certificate 1 1 1 1 - -100% -100% School Nurse Licensure Preparation - - - 1 2 100% -Total 47 43 55 59 58 -2% 23%
Nursing Total 521 558 317 561 596 6% 14%
1As the School of Nursing split from the College of Education, a number of changes occurred in the SON’s academic plan codes; specifically, Pre-Nursing plan codes. Originally, all students interested in nursing, but who had not yet been admitted to the school were grouped into general “pre-nursing” codes. The Fall of 2010 was a transitional year, wherein most students who had not been admitted into the nursing program were grouped under an “exploratory nursing” code housed in Undergraduate Studies. This past year, Fall 2011, students who have been admitted to CSU but not yet been admitted to the SON are grouped into codes based on where they are receiving advising. “Pre-Nursing,” regardless of whether the student has earned any other degree or licensure, now refers to students receiving their advising by SON advisors. “Exploratory Nursing” refers to students who have indicated an interest in nursing but who are being advised by Undergraduate Studies advisors.

Cleveland State U
niversity / 2013 Book of Trends36 Table 3.5: College of Engineering: Fall Enrollment by Level and Major, 5-Year Trend
Fall Term Percent Change
Primary Primary All All All
Department/Program Description 2008 2009 2010 2011 2012 1 year 5 year
Undergraduate Chemical & Biomedical Engineering Chemical Engineering 66 76 92 101 112 11% 70%Civil & Environmental Engineering Civil Engineering 104 104 113 108 109 1% 5%Electrical & Computer Engineering Computer Engineering 68 70 75 71 89 25% 31% Electrical & Computer Engineering - - - - - - - Electrical Engineer Technology - - 4 - - - - Electrical Engineering 140 145 170 157 162 3% 16%Engineering Technology Electronic Engineering Technology 27 40 42 51 37 -27% 37% Mechanical Engineering Technology 25 38 42 38 35 -8% 40%Industrial & Manufacturing Engineering Industrial & Manufacturing Engineering 19 12 2 - - - -100%Mechanical Engineering Mechanical Engineering 169 193 194 215 243 13% 44%Other Engineering Engineering Tech - Undecided 16 34 32 24 26 8% 63% Pre-Engineering 91 120 164 226 343 52% 277% Undecided Engineering 14 24 15 15 12 -20% -14%Total 739 856 945 1,006 1,168 16% 58%Graduate (excluding Doctoral) Chemical & Biomedical Engineering Biomedical Engineering - 9 29 33 40 21% - Chemical Engineering 29 25 33 36 27 -25% -7%Civil & Environmental Engineering Civil Engineering 37 50 42 31 28 -10% -24% Engineering Mechanics 1 3 5 3 2 -33% 100% Environmental Engineering 10 9 3 5 7 40% -30%Electrical & Computer Engineering Electrical Engineering 117 108 154 145 123 -15% 5% Software Engineering 27 26 27 34 36 6% 33%Industrial & Manufacturing Engineering Industrial Engineering 28 23 24 24 12 -50% -57%Mechanical Engineering Mechanical Engineering 56 60 62 58 46 -21% -18%Other Engineering Graduate Engineering 20 26 30 26 18 -31% -10%Total 325 339 409 395 339 -14% 4%Doctoral Doctor of Engineering Applied Biomedical Engineering 26 28 24 22 24 9% -8% Chemical Engineering 8 5 3 3 1 -67% -88% Civil Engineering 6 6 9 9 9 0% 50% Electrical Engineering 19 27 26 25 23 -8% 21% Industrial & Manufacturing Engineering 5 5 4 2 3 50% -40% Mechanical Engineering 4 6 3 8 8 0% 100%Total 68 77 69 69 68 -1% 0%
Engineering Total 1,132 1,272 1,423 1,470 1,575 7% 39%

37Section 3 - Enrollm
ent Characteristics of Students in CSU Colleges
Section 3
Table 3.6: College of Sciences and Health Professions: Fall Enrollment by Level and Major, 5-Year Trend Fall Term Percent Change
Primary Primary All All All
Department/Program Description 2008 2009 2010 2011 2012 1 year 5 year
Undergraduate Biology, Geology & Environmental Science Biology 229 291 401 446 476 7% 108% Biology-Medical Technology 39 44 54 61 68 11% 74% Environmental Science 47 48 80 95 99 4% 111% Geological Science 6 19 26 17 23 35% 283%Chemistry Chemistry 83 89 115 104 112 8% 35% Pharmaceutical Science - - 13 24 31 29% - Pre-Pharmacy 66 95 103 94 110 17% 67%Health Sciences Health Science 435 487 348 305 374 23% -14% Health Science Physician Assistant - - 35 104 111 7% - Pre-Occupational Therapy - - - 147 143 -3% - Pre-Therapy - - 214 214 224 5% - Speech & Hearing 76 80 90 110 127 15% 67%Mathematics Mathematics 64 66 115 118 120 2% 88%Physics Physics 26 33 41 46 49 7% 88%Psychology Psychology 426 491 625 676 724 7% 70%Other Science Certificate Programs - - 4 7 1 -86% - Pre-Professional 105 114 176 263 391 49% 272% Undecided Science 83 85 53 42 21 -50% -75%Total 1,685 1,942 2,493 2,873 3,204 12% 90%Graduate (excluding Doctoral) Biology, Geology & Environmental Science Biology 24 27 34 31 25 -19% 4% Environmental Science 11 14 11 8 9 13% -18%Chemistry Chemistry 28 37 43 38 46 21% 64%Health Sciences Health Science 70 80 100 111 142 28% 103% Master of Occupational Therapy 90 93 93 97 103 6% 14% Master of Physical Therapy 28 - - - - - -100% Speech Pathology and Audiology 55 52 49 53 54 2% -2%Mathematics Applied Statistics - - 3 11 12 9% - Mathematics 24 29 26 36 35 -3% 46%Physics Physics 14 16 13 15 21 40% 50% Diversity Management - - - - 2 - -Psychology Psychology 128 120 102 115 114 -1% -11%Other Science Graduate Certificates 3 3 7 1 - -100% -100% Non-Degree Science 51 83 57 59 61 3% 20%Total 526 554 538 575 624 9% 19%
continued on next page

Cleveland State U
niversity / 2013 Book of Trends38 Table 3.6: College of Sciences and Health Professions: Fall Enrollment by Level and Major, 5-Year Trend
Fall Term Percent Change
Primary Primary All All All
Department/Program Description 2008 2009 2010 2011 2012 1 year 5 year
Doctoral Biology, Geology & Environmental Science Regulatory Biology 66 64 64 63 69 10% 5%Chemistry Clinical Bioanalytical-Chemistry 45 52 57 71 60 -15% 33%Health Sciences Doctor of Physical Therapy 33 63 86 91 104 14% 215%Psychology Adult Development and Aging - 2 4 4 7 75% -
Total 144 181 211 229 240 5% 67%
Science Total 2,355 2,677 3,242 3,677 4,068 11% 73%
Note: The Master of Physical Therapy program has transitioned to the Doctor of Physical Therapy program.
* 2 Pre-Occupational moved to Pre-Physical for this in 2010

39Section 3 - Enrollm
ent Characteristics of Students in CSU Colleges
Section 3
Table 3.7: College of Urban Affairs: Fall Enrollment by Level and Major, 5-Year Trend Fall Term Percent Change
Primary Primary All All All
Department/Program Description 2008 2009 2010 2011 2012 1 year 5 year
Undergraduate Urban Studies Environmental Studies 15 14 22 26 16 -38% 7% Nonprofit Adminstration 64 63 50 77 60 -22% -6% Nonprofit Adminstration (LR) - - 8 9 7 -22% - Organizational Leadership - 25 47 45 52 16% - Organizational Leadership (LK) - - 19 22 17 -23% - Public Safety Management 35 34 30 39 44 13% 26% Public Safety Management (LK) - - 10 10 1 -90% - Public Safety Management (LR) - - 5 4 3 -25% - Urban Studies 119 126 120 124 122 -2% 3% Urban Studies (LR) - - 16 13 8 -38% -Other Urban Affairs Pre-Urban Affairs 2 - - - 1 - -50% Undecided Urban Affairs 22 30 10 9 8 -11% -64% Urban Affairs CertificateC 1 - - - - - -100% Urban Geographic Information SystemsC - - 3 - 2 - -Total 258 292 340 378 341 -10% 32%Graduate (excluding Doctoral) Urban Studies Environmental Studies 19 29 32 27 15 -44% -21% Local and Urban ManagementC - 1 1 - 1 - - Nonprofit Admin & Leadership 19 25 31 33 30 -9% 58% NonProfit Admin & Leadership Accel 4+1 - - 2 - 1 - - Nonprofit ManagementC 5 12 11 3 3 0% -40% Public Administration (MPA) 92 80 103 104 101 -3% 10% Research Administration CertificateC - - - - - - - Urban Economic DevelopmentC 3 1 2 1 2 100% -33% Urban Geographic Information SystemsC 2 2 1 3 3 0% 50% Urban Planning & Law - - - - 1 - - Urban Planning and Design 74 61 58 56 46 -18% -38% Urban Real Estate Development & FinanceC 4 3 - 1 3 200% -25% Urban Studies 17 11 15 14 24 71% 41%Other Urban Affairs Graduate Non-Degree Urban Affairs 76 68 75 53 25 -53% -67%Total 311 293 331 295 255 -14% -18%Doctoral Urban Studies and Public Affairs Urban Studies and Public Affairs 46 36 36 38 40 5% -13%Total 46 36 36 38 40 5% -13%
Urban Affairs Total 615 621 707 711 636 -11% 3%
Note: C Certificate Program
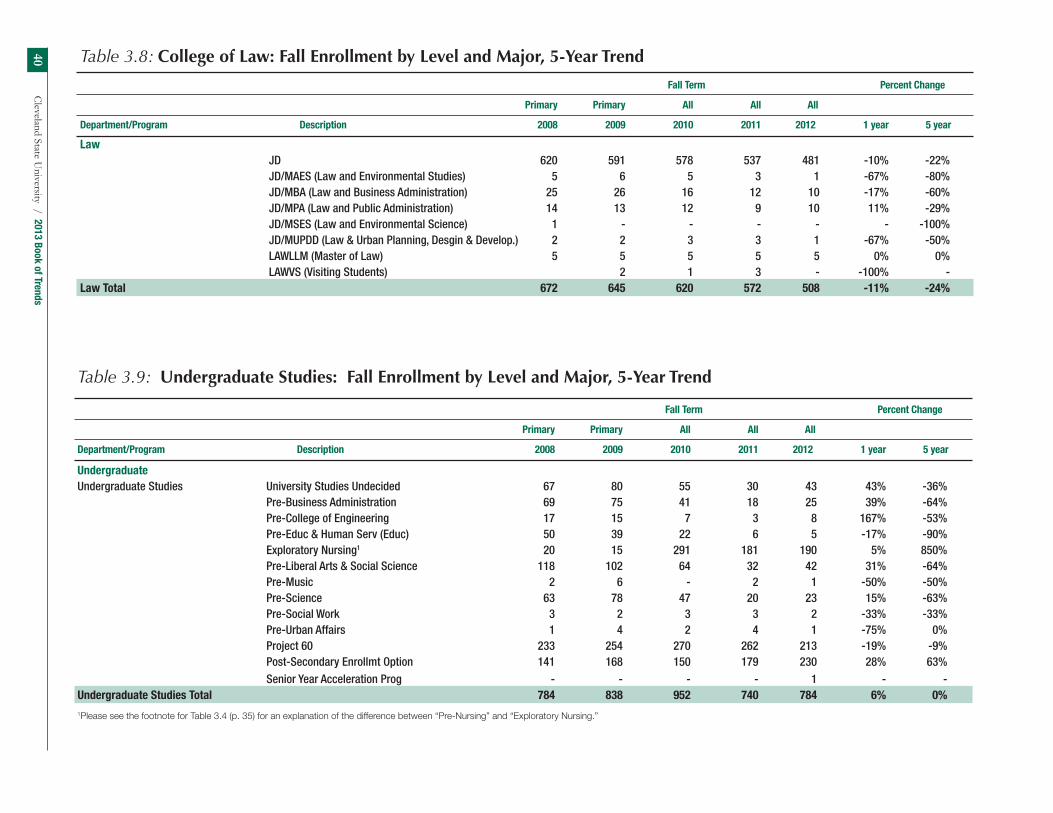
Cleveland State U
niversity / 2013 Book of Trends40 Table 3.8: College of Law: Fall Enrollment by Level and Major, 5-Year Trend
Fall Term Percent Change
Primary Primary All All All
Department/Program Description 2008 2009 2010 2011 2012 1 year 5 year
Law JD 620 591 578 537 481 -10% -22% JD/MAES (Law and Environmental Studies) 5 6 5 3 1 -67% -80% JD/MBA (Law and Business Administration) 25 26 16 12 10 -17% -60% JD/MPA (Law and Public Administration) 14 13 12 9 10 11% -29% JD/MSES (Law and Environmental Science) 1 - - - - - -100% JD/MUPDD (Law & Urban Planning, Desgin & Develop.) 2 2 3 3 1 -67% -50% LAWLLM (Master of Law) 5 5 5 5 5 0% 0% LAWVS (Visiting Students) 2 1 3 - -100% -Law Total 672 645 620 572 508 -11% -24%
Table 3.9: Undergraduate Studies: Fall Enrollment by Level and Major, 5-Year Trend Fall Term Percent Change
Primary Primary All All All
Department/Program Description 2008 2009 2010 2011 2012 1 year 5 year
Undergraduate Undergraduate Studies University Studies Undecided 67 80 55 30 43 43% -36% Pre-Business Administration 69 75 41 18 25 39% -64% Pre-College of Engineering 17 15 7 3 8 167% -53% Pre-Educ & Human Serv (Educ) 50 39 22 6 5 -17% -90% Exploratory Nursing1 20 15 291 181 190 5% 850% Pre-Liberal Arts & Social Science 118 102 64 32 42 31% -64% Pre-Music 2 6 - 2 1 -50% -50% Pre-Science 63 78 47 20 23 15% -63% Pre-Social Work 3 2 3 3 2 -33% -33% Pre-Urban Affairs 1 4 2 4 1 -75% 0% Project 60 233 254 270 262 213 -19% -9% Post-Secondary Enrollmt Option 141 168 150 179 230 28% 63% Senior Year Acceleration Prog - - - - 1 - -Undergraduate Studies Total 784 838 952 740 784 6% 0%1Please see the footnote for Table 3.4 (p. 35) for an explanation of the difference between “Pre-Nursing” and “Exploratory Nursing.”

41Section 3 - Enrollm
ent Characteristics of Students in CSU Colleges
Section 3
Table 3.10: Undergraduate Non-Degree: Fall Enrollment by Level and Major, 5-Year Trend Primary Primary All All All Percent Change
Department/Program Description 2008 2009 2010 2011 2012 1 year 5 year
Undergraduate Non-Degree Undergraduate Non-Degree Cross Registration Undergraduate 33 28 22 17 11 -35% -67% National Student Exchange 1 2 2 1 2 100% 100% Nondegree Post-baccalaureate 2 1 2 - - - -100% Nondegree Undergraduate 255 274 239 184 183 -1% -28% Undergraduate Transient 34 45 41 42 46 10% 35%Other Non-Degree Visiting 28 17 33 32 5 -84% -82% Undergraduate Non-Degree Total 353 367 339 276 247 -11% -30%
Table 3.11: Graduate Studies: Fall Enrollment by Level and Major, 5-Year Trend
Primary Primary All All All Percent Change
Department/Program Description 2008 2009 2010 2011 2012 1 year 5 year
Graduate (excluding Doctoral) Graduate Nondegree Graduate Studies Visiting 3 1 2 - - - -100% Graduate Transient 12 13 13 11 9 -18% -25% Graduate Nondegree 38 30 32 13 12 -8% -68%Graduate Studies Total 53 44 47 24 21 -13% -60%
Table 3.11a: Other: Fall Enrollment by Level and Major, 5-Year Trend
Primary Primary All All All Percent Change
Department/Program Description 2008 2009 2010 2011 2012 1 year 5 year
CSU ESL Intensive Language Program ESL Intensive Language Program 31 45 85 148 163 10% 426%Graduate Studies Total 31 45 85 148 163 10% 426%Note: English as a Second Language.

Cleveland State U
niversity / 2013 Book of Trends42 Table 3.12: College of Business
Fall Enrollment by Class Standing and Student Credit Hours by Course Level: 5-Year Trend
Table 3.12a: Enrollment by Class Standing
Percent Change
Class Standing 2008 % 2009 % 2010 % 2011 % 2012 % 1 Year 5 Year
Freshmen 318 10% 375 11% 360 10% 278 8% 320 9% 15% 1%Sophomore 297 10% 290 8% 334 9% 315 9% 265 8% -16% -11%Junior 478 16% 467 14% 514 14% 459 13% 410 12% -11% -14%Senior 833 27% 934 27% 1,015 28% 1,010 29% 978 29% -3% 17%Master’s 1,091 36% 1,295 38% 1,380 38% 1,381 40% 1,366 41% -1% 25%Doctoral 36 1% 62 2% 48 1% 38 1% 30 1% -21% -17%Total 3,053 100% 3,423 100% 3,651 100% 3,481 100% 3,369 100% -3% 10% Table 3.12b: Student Credit Hours by Course Level
Percent Change
Course Level 2008 % 2009 % 2010 % 2011 % 2012 % 1 year 5 year
Lower (100-299) 4,851 20% 5,103 20% 5,431 20% 5,525 20% 5,363 20% -3% 11%Upper (300-499) 10,846 46% 10,889 42% 11,696 42% 11,449 42% 11,530 43% 1% 6%Master’s (500-699) 7,906 33% 9,460 37% 10,196 37% 9,974 37% 9,864 37% -1% 25%Doctoral (700-899) 94 0% 352 1% 290 1% 208 1% 132 0% -37% 40% Total 23,697 100% 25,804 100% 27,613 100% 27,156 100% 26,889 100% -1% 13%
Note: In 2007 & after Public Health courses are reported under the College of Education and Human Services. In prior years they are under the College of Business.
Figure 3.12a: Enrollment by Class Standing Figure 3.12b: Student Credit Hours by Course Level

43Section 3 - Enrollm
ent Characteristics of Students in CSU Colleges
Section 3
Table 3.13: College of Liberal Arts and Social Sciences Fall Enrollment by Class Standing & Student Credit Hours by Course Level: 5-Year Trend Table 3.13a: Enrollment by Class Standing
Percent Change
Class Standing 2008 % 2009 % 2010 % 2011 % 2012 % 1 Year 5 Year
Freshmen 517 16% 552 16% 652 18% 793 21% 759 20% -4% 47%Sophomore 494 15% 480 14% 468 13% 500 13% 534 14% 7% 8%Junior 610 19% 643 19% 739 20% 640 17% 673 18% 5% 10%Senior 1,076 33% 1,168 34% 1,211 33% 1,200 32% 1,169 31% -3% 9%Master’s 546 17% 582 17% 588 16% 603 16% 596 16% -1% 9%Total 3,243 100% 3,425 100% 3,658 100% 3,736 100% 3,731 100% 0% 15%
Table 3.13b: Student Credit Hours by Course Level
Percent Change
Course Level 2008 % 2009 % 2010 % 2011 % 2012 % 1 Year 5 Year
Developmental 1,486 3% 1,551 3% 342 1% 382 1% 394 1% 3% -73%Lower (100-299) 29,359 57% 32,969 59% 35,412 61% 34,056 59% 35,505 61% 4% 21%Upper (300-499) 15,774 31% 16,344 29% 17,369 30% 17,586 31% 17,347 30% -1% 10%Master’s (500-699) 4,781 9% 5,042 9% 5,111 9% 5,355 9% 5,083 9% -5% 6%Doctoral (700-899) - 0% 28 0% 8 0% 24 0% 8 0% -67% -Total 51,400 100% 55,934 100% 58,242 100% 57,403 100% 58,337 100% 2% 13%
Figure 3.13a: Enrollment by Class Standing Figure 3.13b: Student Credit Hours by Course Level

Cleveland State U
niversity / 2013 Book of Trends44 Table 3.14: College of Education and Human Services
Fall Enrollment by Class Standing & Student Credit Hours by Course Level: 5-Year Trend Table 3.14a: Enrollment by Class Standing
Percent Change
Class Standing 2008 % 2009 % 2010 % 2011 % 2012 % 1 Year 5 Year
Freshmen 125 5% 145 6% 156 6% 156 6% 120 5% -23% -4%Sophomore 101 4% 135 5% 124 5% 111 5% 135 6% 22% 34%Junior 168 6% 177 7% 197 8% 173 7% 158 7% -9% -6%Senior 484 18% 487 19% 535 20% 527 22% 484 21% -8% 0%Master’s 1,638 62% 1,535 59% 1,499 57% 1,365 56% 1,257 55% -8% -23%Doctoral 110 4% 112 4% 110 4% 119 5% 112 5% -6% 2%Total 2,626 100% 2,591 100% 2,621 100% 2,451 100% 2,266 100% -8% -14%
Table 3.14b: Student Credit Hours by Course Level
Percent Change
Course Level 2008 % 2009 % 2010 % 2011 % 2012 % 1 Year 5 Year
Lower (100-299) 1,039 6% 1,088 7% 1,155 7% 1,035 6% 981 6% -5% -6%Upper (300-499) 6,065 35% 5,662 34% 6,416 37% 6,250 38% 6,360 39% 2% 5%Master’s (500-699) 9,143 53% 8,831 54% 8,943 52% 8,416 51% 7,925 49% -6% -13%Doctoral (700-899) 942 5% 856 5% 782 5% 841 5% 899 6% 7% -5%Total 17,189 100% 16,437 100% 17,296 100% 16,542 100% 16,165 100% -2% -6%
Figure 3.14a: Enrollment by Class Standing Figure 3.14b: Student Credit Hours by Course Level

45Section 3 - Enrollm
ent Characteristics of Students in CSU Colleges
Section 3
Figure 3.15a: Enrollment by Class Standing Figure 3.15b: Enrollment by Course Level
Table 3.15: School of Nursing Fall Enrollment by Class Standing & Student Credit Hours by Course Level: 5-Year Trend Table 3.15a: Enrollment by Class Standing
Percent Change
Class Standing 2008 % 2009 % 2010 % 2011 % 2012 % 1 Year 5 Year
Freshmen 126 24% 140 25% 179 30% 114 20% 133 22% 17% 6%Sophomore 63 12% 77 14% 77 13% 71 13% 88 15% 24% 40%Junior 53 10% 74 13% 100 17% 92 16% 89 15% -3% 68%Senior 232 44% 224 40% 180 31% 223 40% 224 38% 0% -3%Master’s 48 9% 43 8% 53 9% 59 11% 58 10% -2% 21%Total 522 100% 558 100% 589 100% 559 100% 592 100% 6% 13%
Table 3.15b: Student Credit Hours by Course Level
Percent Change
Course Level 2008 % 2009 % 2010 % 2011 % 2012 % 1 Year 5 Year
Lower (100-299) 989 30% 1,215 33% 1,016 29% 1,097 25% 1,041 23% -5% 5%Upper (300-499) 2,101 63% 2,163 59% 2,119 61% 3,011 68% 3,192 70% 6% 52%Master’s (500-699) 238 7% 272 7% 312 9% 303 7% 331 7% 9% 39%Total 3,328 100% 3,650 100% 3,447 100% 4,411 100% 4,564 100% 3% 37%

Cleveland State U
niversity / 2013 Book of Trends46 Table 3.16: College of Engineering
Fall Enrollment by Class Standing & Student Credit Hours by Course Level: 5-Year Trend Table 3.16a: Enrollment by Class Standing
Percent Change
Class Standing 2008 % 2009 % 2010 % 2011 % 2012 % 1 Year 5 Year
Freshmen 182 16% 194 15% 222 16% 255 18% 331 21% 30% 82%Sophomore 122 11% 151 12% 147 11% 147 10% 200 13% 36% 64%Junior 127 11% 177 14% 174 13% 176 12% 213 14% 21% 68%Senior 308 27% 334 26% 385 28% 419 29% 422 27% 1% 37%Master’s 325 29% 339 27% 397 29% 388 27% 335 21% -14% 3%Doctoral 68 6% 77 6% 67 5% 67 5% 68 4% 1% 0%Total 1,132 100% 1,272 100% 1,392 100% 1,452 100% 1,569 100% 8% 39%
Table 3.16b: Student Credit Hours by Course Level
Percent Change
Course Level 2008 % 2009 % 2010 % 2011 % 2012 % 1 Year 5 Year
Lower (100-299) 1,655 21% 1,945 23% 2,298 23% 2,164 21% 2,507 25% 16% 51%Upper (300-499) 3,580 46% 3,713 44% 4,592 46% 5,183 50% 4,876 48% -6% 36%Master’s (500-699) 2,130 27% 2,217 26% 2,678 27% 2,533 25% 2,281 23% -10% 7%Doctoral (700-899) 442 6% 498 6% 443 4% 410 4% 390 4% -5% -12%Total 7,807 100% 8,373 100% 10,011 100% 10,290 100% 10,054 100% -2% 29%
Figure 3.16b: Student Credit Hours by Course LevelFigure 3.16a: Enrollment by Class Standing

47Section 3 - Enrollm
ent Characteristics of Students in CSU Colleges
Section 3
Table 3.17: College of Sciences & Health Professions Fall Enrollment by Class Standing & Student Credit Hours by Course Level: 5-Year Trend Table 3.17a: Enrollment by Class Standing
Percent Change
Class Standing 2008 % 2009 % 2010 % 2011 % 2012 % 1 Year 5 Year
Freshmen 333 14% 387 14% 469 15% 472 14% 571 15% 21% 71%Sophomore 276 12% 328 12% 375 12% 464 14% 471 13% 2% 71%Junior 366 16% 405 15% 548 18% 541 16% 624 17% 15% 70%Senior 710 30% 822 31% 948 31% 1,101 33% 1,210 32% 10% 70%Master’s 559 24% 586 22% 522 17% 566 17% 617 17% 9% 10%Doctoral 111 5% 149 6% 210 7% 224 7% 234 6% 4% 111%Total 2,355 100% 2,677 100% 3,072 100% 3,368 100% 3,727 100% 11% 58%
Table 3.17b: Student Credit Hours by Course Level
Percent Change
Course Level 2008 % 2009 % 2010 % 2011 % 2012 % 1 Year 5 Year
Developmental 2,640 6% 2,424 5% 2,396 5% 2,564 5% 2,232 4% -13% -15%Lower (100-299) 22,536 55% 25,836 57% 27,435 56% 28,700 55% 31,226 55% 9% 39%Upper (300-499) 9,496 23% 11,001 24% 12,505 26% 14,109 27% 15,458 27% 10% 63%Master’s (500-699) 5,243 13% 4,867 11% 4,944 10% 5,311 10% 5,769 10% 9% 10%Doctoral (700-899) 793 2% 1,218 3% 1,609 3% 1,576 3% 1,676 3% 6% 111%Total 40,708 100% 45,346 100% 48,889 100% 52,260 100% 56,361 100% 8% 38%
Figure 3.17b: Student Credit Hours by Course LevelFigure 3.17a: Enrollment by Class Standing

Cleveland State U
niversity / 2013 Book of Trends48 Table 3.18: College of Urban Affairs
Fall Enrollment by Class Standing & Student Credit Hours by Course Level: 5-Year Trend Table 3.18a: Enrollment by Class Standing
Percent Change
Class Standing 2008 % 2009 % 2010 % 2011 % 2012 % 1 Year 5 Year
Freshmen 23 4% 16 3% 28 4% 31 4% 31 5% 0% 35%Sophomore 36 6% 41 7% 37 5% 44 6% 38 6% -14% 6%Junior 68 11% 87 14% 85 12% 83 12% 91 15% 10% 34%Senior 131 21% 148 24% 177 26% 202 29% 167 27% -17% 27%Master’s 311 51% 293 47% 325 47% 291 42% 253 41% -13% -19%Doctoral 46 7% 36 6% 36 5% 38 6% 40 6% 5% -13%Total 615 100% 621 100% 688 100% 689 100% 620 100% -10% 1%
Table 3.18b: Student Credit Hours by Course Level
Percent Change
Course Level 2008 % 2009 % 2010 % 2011 % 2012 % 1 Year 5 Year
Lower (100-299) 3,065 34% 3,302 35% 4,589 43% 4,809 44% 4,811 47% 0% 57%Upper (300-499) 2,870 32% 3,154 33% 3,235 30% 3,582 33% 3,188 31% -11% 11%Master’s (500-699) 2,663 30% 2,773 29% 2,710 25% 2,439 22% 2,045 20% -16% -23%Doctoral (700-899) 337 4% 231 2% 188 2% 179 2% 201 2% 12% -40%Total 8,935 100% 9,460 100% 10,722 100% 11,009 100% 10,245 100% -7% 15%
Figure 3.18a: Enrollment by Class Standing Figure 3.18b: Student Credit Hours by Course Level

49Section 3 - Enrollm
ent Characteristics of Students in CSU Colleges
Section 3
Table 3.19: College of Law Fall Enrollment by Class Standing & Student Credit Hours by Course Level: 5-Year Trend Table 3.19a: Enrollment by Class Standing
Percent Change
Class Standing 2008 % 2009 % 2010 % 2011 % 2012 % 1 Year 5 Year
Law 672 100% 645 100% 610 100% 563 100% 501 100% -11% -25%Total 672 100% 645 100% 610 100% 563 100% 501 100% -11% -25% Table 3.19b: Student Credit Hours by Course Level
Percent Change
Course Level 2008 % 2009 % 2010 % 2011 % 2012 % 1 Year 5 Year
Law 8,674 100% 8,496 100% 8,015 100% 7,425 100% 6,776 100% -9% -22%Total 8,674 100% 8,496 100% 8,015 100% 7,425 100% 6,776 100% -9% -22%
Figure 3.19a: Enrollment by Class Standing Figure 3.19b: Student Credit Hours by Course Level

Cleveland State U
niversity / 2013 Book of Trends50 Table 3.20: Undergraduate Studies
Fall Enrollment by Class Standing & Student Credit Hours by Course Level: 5-Year Trend Table 3.20a: Enrollment by Class Standing
Percent Change
Class Standing 2008 % 2009 % 2010 % 2011 % 2012 % 1 Year 5 Year
Freshmen 631 80% 629 75% 533 80% 562 76% 605 78% 8% -4%Sophomore 80 10% 116 14% 65 10% 97 13% 94 12% -3% 18%Junior 37 5% 39 5% 21 3% 29 4% 36 5% 24% -3%Senior 36 5% 54 6% 44 7% 51 7% 45 6% -12% 25%Total 784 100% 838 100% 663 100% 739 100% 780 100% 6% -1%
Table 3.20b: Student Credit Hours by Course Level
Percent Change
Course Level 2008 % 2009 % 2010 % 2011 % 2012 % 1 Year 5 Year
Lower (100-299) 928 100% 1,053 100% 1,060 100% 1,190 100% 1,419 100% -5% -6%Total 928 100% 1,053 100% 1,060 100% 1,190 100% 1,419 100% -5% -6%
Figure 3.20a: Enrollment by Class Standing Figure 3.20b: Student Credit Hours by Course Level

51Section 3 - Enrollm
ent Characteristics of Students in CSU Colleges
Section 3
Table 3.21: CSU Total Fall Enrollment by College and Ethnicity: 5-Year Trend
2008 2009 2010 2011 2012 Percent Change
College Race Enrollment % Enrollment % Enrollment % Enrollment % Enrollment % 1 year 5 year
Business American Indian/Alaska Native 3 0% 5 0% 9 0% 6 0% 6 0% 0% 100% Asian 125 4% 136 4% 142 4% 144 4% 128 4% -11% 2% Black/African American 480 16% 525 15% 575 16% 547 16% 514 15% -6% 7% Hispanic/Latino 55 2% 65 2% 104 3% 96 3% 108 3% 13% 96% Native Hawaiian or Other Pacific Island - 0% - 0% 1 0% 3 0% 3 0% 0% - Non Resident Alien 259 8% 341 10% 387 11% 357 10% 396 12% 11% 53% Two or more races - 0% - 0% 16 0% 30 1% 38 1% 27% - Unknown 233 8% 339 10% 215 6% 173 5% 130 4% -25% -44% White 1,898 62% 2,012 59% 2,202 60% 2,125 61% 2,046 61% -4% 8%Total 3,053 100% 3,423 100% 3,651 100% 3,481 100% 3,369 100% -3% 10%CLASS American Indian/Alaska Native 10 0% 11 0% 12 0% 7 0% 11 0% 57% 10% Asian 54 2% 52 2% 44 1% 53 1% 50 1% -6% -7% Black/African American 783 24% 804 23% 918 25% 940 25% 929 25% -1% 19% Hispanic/Latino 124 4% 147 4% 165 5% 171 5% 186 5% 9% 50% Native Hawaiian or Other Pacific Island - 0% - 0% 1 0% 1 0% 3 0% 200% - Non Resident Alien 50 2% 46 1% 50 1% 54 1% 58 2% 7% 16% Two or more races - 0% - 0% 22 1% 66 2% 93 2% 41% - Unknown 278 9% 357 10% 290 8% 225 6% 188 5% -16% -32% White 1,944 60% 2,008 59% 2,156 59% 2,219 59% 2,213 59% 0% 14%Total 3,243 100% 3,425 100% 3,658 100% 3,736 100% 3,731 100% 0% 15%Education American Indian/Alaska Native 5 0% 6 0% 6 0% 3 0% 1 0% -67% -80% Asian 32 1% 31 1% 26 1% 25 1% 20 1% -20% -38% Black/African American 598 23% 573 22% 608 23% 587 24% 533 24% -9% -11% Hispanic/Latino 59 2% 58 2% 87 3% 74 3% 75 3% 1% 27% Native Hawaiian or Other Pacific Island - 0% - 0% - 0% 2 0% 2 0% 0% - Non Resident Alien 40 2% 44 2% 61 2% 61 2% 65 3% 7% 63% Two or more races - 0% - 0% 7 0% 21 1% 26 1% 24% - Unknown 290 11% 308 12% 247 9% 198 8% 141 6% -29% -51% White 1,602 61% 1,571 61% 1,579 60% 1,480 60% 1,403 62% -5% -12%Total 2,626 100% 2,591 100% 2,621 100% 2,451 100% 2,266 100% -8% -14%Nursing American Indian/Alaska Native 2 0% 1 0% 2 0% 1 0% - 0% -100% -100% Asian 18 3% 15 3% 20 3% 20 4% 21 4% 5% 17% Black/African American 77 15% 102 18% 122 21% 77 14% 79 13% 3% 3% Hispanic/Latino 14 3% 11 2% 22 4% 21 0% 23 4% 10% 64% Native Hawaiian or Other Pacific Island - 0% - 0% - 0% - 0% 1 0% - - Non Resident Alien 2 0% 3 1% 9 2% 7 1% 12 2% 71% 500% Two or more races - 0% - 0% 5 1% 12 2% 14 2% 17% - Unknown 26 5% 34 6% 23 4% 24 4% 18 3% -25% -31% White 383 73% 392 70% 389 66% 397 71% 424 72% 7% 11%Total 522 100% 558 100% 592 100% 559 100% 592 100% 6% 13%
continued on next page
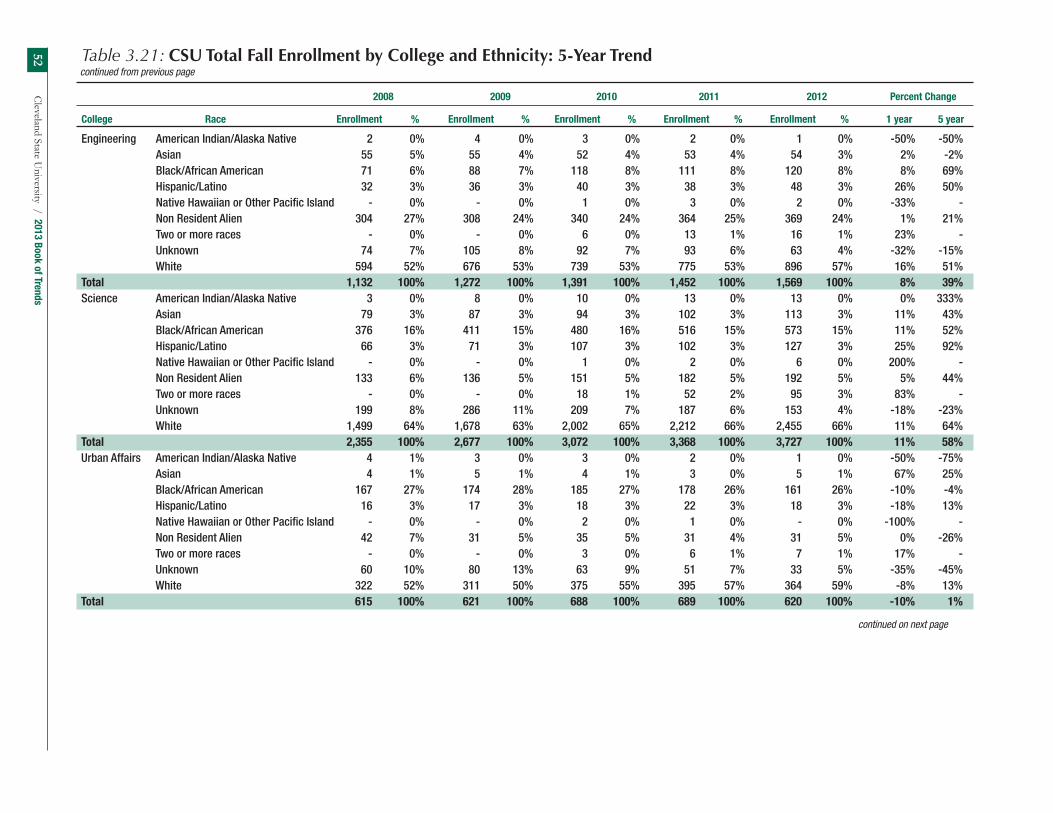
Cleveland State U
niversity / 2013 Book of Trends52
continued from previous page
Table 3.21: CSU Total Fall Enrollment by College and Ethnicity: 5-Year Trend
2008 2009 2010 2011 2012 Percent Change
College Race Enrollment % Enrollment % Enrollment % Enrollment % Enrollment % 1 year 5 year
Engineering American Indian/Alaska Native 2 0% 4 0% 3 0% 2 0% 1 0% -50% -50% Asian 55 5% 55 4% 52 4% 53 4% 54 3% 2% -2% Black/African American 71 6% 88 7% 118 8% 111 8% 120 8% 8% 69% Hispanic/Latino 32 3% 36 3% 40 3% 38 3% 48 3% 26% 50% Native Hawaiian or Other Pacific Island - 0% - 0% 1 0% 3 0% 2 0% -33% - Non Resident Alien 304 27% 308 24% 340 24% 364 25% 369 24% 1% 21% Two or more races - 0% - 0% 6 0% 13 1% 16 1% 23% - Unknown 74 7% 105 8% 92 7% 93 6% 63 4% -32% -15% White 594 52% 676 53% 739 53% 775 53% 896 57% 16% 51%Total 1,132 100% 1,272 100% 1,391 100% 1,452 100% 1,569 100% 8% 39%Science American Indian/Alaska Native 3 0% 8 0% 10 0% 13 0% 13 0% 0% 333% Asian 79 3% 87 3% 94 3% 102 3% 113 3% 11% 43% Black/African American 376 16% 411 15% 480 16% 516 15% 573 15% 11% 52% Hispanic/Latino 66 3% 71 3% 107 3% 102 3% 127 3% 25% 92% Native Hawaiian or Other Pacific Island - 0% - 0% 1 0% 2 0% 6 0% 200% - Non Resident Alien 133 6% 136 5% 151 5% 182 5% 192 5% 5% 44% Two or more races - 0% - 0% 18 1% 52 2% 95 3% 83% - Unknown 199 8% 286 11% 209 7% 187 6% 153 4% -18% -23% White 1,499 64% 1,678 63% 2,002 65% 2,212 66% 2,455 66% 11% 64%Total 2,355 100% 2,677 100% 3,072 100% 3,368 100% 3,727 100% 11% 58%Urban Affairs American Indian/Alaska Native 4 1% 3 0% 3 0% 2 0% 1 0% -50% -75% Asian 4 1% 5 1% 4 1% 3 0% 5 1% 67% 25% Black/African American 167 27% 174 28% 185 27% 178 26% 161 26% -10% -4% Hispanic/Latino 16 3% 17 3% 18 3% 22 3% 18 3% -18% 13% Native Hawaiian or Other Pacific Island - 0% - 0% 2 0% 1 0% - 0% -100% - Non Resident Alien 42 7% 31 5% 35 5% 31 4% 31 5% 0% -26% Two or more races - 0% - 0% 3 0% 6 1% 7 1% 17% - Unknown 60 10% 80 13% 63 9% 51 7% 33 5% -35% -45% White 322 52% 311 50% 375 55% 395 57% 364 59% -8% 13%Total 615 100% 621 100% 688 100% 689 100% 620 100% -10% 1%
continued on next page

53Section 3 - Enrollm
ent Characteristics of Students in CSU Colleges
Section 3
continued from previous page
Table 3.21: CSU Total Fall Enrollment by College and Ethnicity: 5-Year Trend
2008 2009 2010 2011 2012 Percent Change
College Race Enrollment % Enrollment % Enrollment % Enrollment % Enrollment % 1 year 5 year
Law American Indian/Alaska Native 2 0% 3 0% 2 0% 1 0% 1 0% 0% -50% Asian 22 3% 17 3% 11 2% 14 2% 12 2% -14% -45% Black/African American 45 7% 52 8% 55 9% 54 10% 40 8% -26% -11% Hispanic/Latino 15 2% 16 2% 12 2% 17 3% 20 4% 18% 33% Native Hawaiian or Other Pacific Island - 0% - 0% - 0% - 0% - 0% - - Non Resident Alien 9 1% 9 1% 5 1% 6 1% 7 1% 17% -22% Two or more races - 0% - 0% 1 0% 2 0% 5 1% 150% - Unknown 59 9% 77 12% 29 5% 15 3% 9 2% -40% -85% White 520 77% 471 73% 495 81% 454 81% 407 81% -10% -22%Total 672 100% 645 100% 610 100% 563 100% 501 100% -11% -25%Undergraduate American Indian/Alaska Native 3 0% 1 0% 2 0% 1 0% 3 0% 200% 0%Studies Asian 18 2% 16 2% 25 4% 38 5% 34 4% -11% 89% Black/African American 215 27% 228 27% 166 25% 190 26% 227 29% 19% 6% Hispanic/Latino 34 4% 21 3% 27 4% 34 5% 24 3% -29% -29% Native Hawaiian or Other Pacific Island - 0% - 0% - 0% - 0% 1 0% - - Non Resident Alien 2 0% 3 0% 3 0% 9 1% 7 1% -22% 250% Two or more races - 0% - 0% 9 1% 18 2% 21 3% 17% - Unknown 165 21% 278 33% 127 19% 107 14% 84 11% -21% -49% White 347 44% 291 35% 303 46% 342 46% 379 49% 11% 9%Total 784 100% 838 100% 662 100% 739 100% 780 100% 6% -1%Undergraduate American Indian/Alaska Native - 0% 1 0% - 0% - 0% - 0% - -Non-Degree Asian 26 7% 13 4% 17 5% 15 5% 15 6% 0% -42% Black/African American 39 11% 36 10% 26 8% 15 5% 26 11% 73% -33% Hispanic/Latino 8 2% 6 2% 8 2% 10 4% 7 3% -30% -13% Native Hawaiian or Other Pacific Island - 0% - 0% 2 1% - 0% - 0% - - Non Resident Alien 4 1% 7 2% 1 0% 3 1% 2 1% -33% -50% Two or more races - 0% - 0% 1 0% 3 1% 2 1% -33% - Unknown 43 12% 110 30% 64 19% 43 16% 22 9% -49% -49% White 233 66% 194 53% 215 64% 185 68% 171 70% -8% -27%Total 353 100% 367 100% 334 100% 274 100% 245 100% -11% -31%
continued on next page
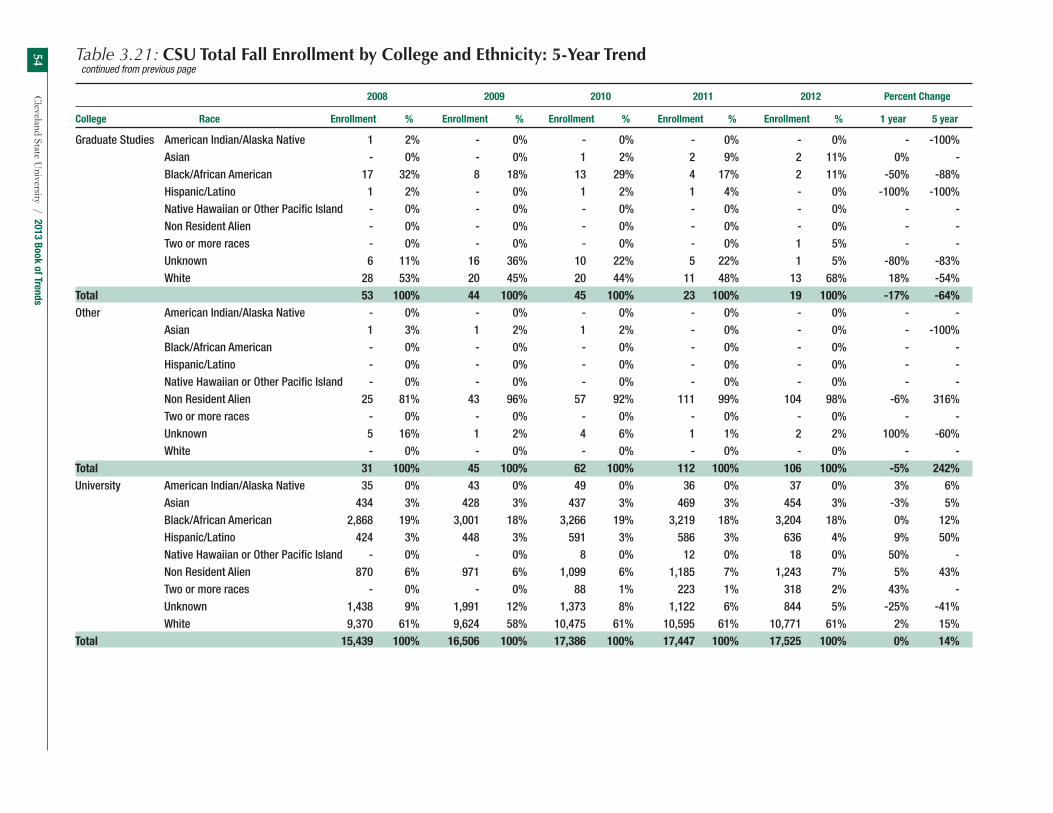
Cleveland State U
niversity / 2013 Book of Trends54
continued from previous page
Table 3.21: CSU Total Fall Enrollment by College and Ethnicity: 5-Year Trend
2008 2009 2010 2011 2012 Percent Change
College Race Enrollment % Enrollment % Enrollment % Enrollment % Enrollment % 1 year 5 year
Graduate Studies American Indian/Alaska Native 1 2% - 0% - 0% - 0% - 0% - -100% Asian - 0% - 0% 1 2% 2 9% 2 11% 0% - Black/African American 17 32% 8 18% 13 29% 4 17% 2 11% -50% -88% Hispanic/Latino 1 2% - 0% 1 2% 1 4% - 0% -100% -100% Native Hawaiian or Other Pacific Island - 0% - 0% - 0% - 0% - 0% - - Non Resident Alien - 0% - 0% - 0% - 0% - 0% - - Two or more races - 0% - 0% - 0% - 0% 1 5% - - Unknown 6 11% 16 36% 10 22% 5 22% 1 5% -80% -83% White 28 53% 20 45% 20 44% 11 48% 13 68% 18% -54%Total 53 100% 44 100% 45 100% 23 100% 19 100% -17% -64%Other American Indian/Alaska Native - 0% - 0% - 0% - 0% - 0% - - Asian 1 3% 1 2% 1 2% - 0% - 0% - -100% Black/African American - 0% - 0% - 0% - 0% - 0% - - Hispanic/Latino - 0% - 0% - 0% - 0% - 0% - - Native Hawaiian or Other Pacific Island - 0% - 0% - 0% - 0% - 0% - - Non Resident Alien 25 81% 43 96% 57 92% 111 99% 104 98% -6% 316% Two or more races - 0% - 0% - 0% - 0% - 0% - - Unknown 5 16% 1 2% 4 6% 1 1% 2 2% 100% -60% White - 0% - 0% - 0% - 0% - 0% - - Total 31 100% 45 100% 62 100% 112 100% 106 100% -5% 242%University American Indian/Alaska Native 35 0% 43 0% 49 0% 36 0% 37 0% 3% 6% Asian 434 3% 428 3% 437 3% 469 3% 454 3% -3% 5% Black/African American 2,868 19% 3,001 18% 3,266 19% 3,219 18% 3,204 18% 0% 12% Hispanic/Latino 424 3% 448 3% 591 3% 586 3% 636 4% 9% 50% Native Hawaiian or Other Pacific Island - 0% - 0% 8 0% 12 0% 18 0% 50% - Non Resident Alien 870 6% 971 6% 1,099 6% 1,185 7% 1,243 7% 5% 43% Two or more races - 0% - 0% 88 1% 223 1% 318 2% 43% - Unknown 1,438 9% 1,991 12% 1,373 8% 1,122 6% 844 5% -25% -41% White 9,370 61% 9,624 58% 10,475 61% 10,595 61% 10,771 61% 2% 15%Total 15,439 100% 16,506 100% 17,386 100% 17,447 100% 17,525 100% 0% 14%

55Section 3 - Enrollm
ent Characteristics of Students in CSU Colleges
Section 3
Table 3.22: CSU Undergraduate Fall Enrollment by College & Ethnicity: 5-Year Trend 2008 2009 2010 2011 2012 Percent Change
College Race Enrollment % Enrollment % Enrollment % Enrollment % Enrollment % 1 year 5 year
Business American Indian/Alaska Native 2 0% 4 0% 8 0% 6 0% 3 0% -50% 50% Asian 85 4% 74 4% 86 4% 77 4% 72 4% -6% -15% Black/African American 376 20% 402 19% 450 20% 423 21% 366 19% -13% -3% Hispanic/Latino 41 2% 50 2% 78 4% 68 3% 72 4% 6% 76% Native Hawaiian or Other Pacific Island - 0% - 0% 1 0% 3 0% 3 0% 0% - Non Resident Alien 71 4% 88 4% 104 5% 112 5% 130 7% 16% 83% Two or more races - 0% - 0% 9 0% 18 1% 30 2% 67% - Unknown 119 6% 178 9% 134 6% 99 5% 69 3% -30% -42% White 1,232 64% 1,270 61% 1,353 61% 1,256 61% 1,228 62% -2% 0%Total 1,926 100% 2,066 100% 2,223 100% 2,062 100% 1,973 100% -4% 2%CLASS American Indian/Alaska Native 10 0% 11 0% 12 0% 7 0% 11 0% 57% 10% Asian 47 2% 47 2% 37 1% 47 2% 45 1% -4% -4% Black/African American 660 24% 675 24% 794 26% 813 26% 786 25% -3% 19% Hispanic/Latino 111 4% 132 5% 153 5% 157 5% 168 5% 7% 51% Native Hawaiian or Other Pacific Island - 0% - 0% 1 0% 1 0% 3 0% 200% - Non Resident Alien 32 1% 32 1% 31 1% 37 1% 40 1% 8% 25% Two or more races - 0% - 0% 18 1% 62 2% 85 3% 37% - Unknown 204 8% 270 9% 233 8% 164 5% 145 5% -12% -29% White 1,633 61% 1,676 59% 1,791 58% 1,845 59% 1,852 59% 0% 13%Total 2,697 100% 2,843 100% 3,070 100% 3,133 100% 3,135 100% 0% 16%Education American Indian/Alaska Native 2 0% 3 0% 3 0% 2 0% 1 0% -50% -50% Asian 12 1% 13 1% 10 1% 7 1% 6 1% -14% -50% Black/African American 195 22% 202 21% 245 24% 228 24% 214 24% -6% 10% Hispanic/Latino 25 3% 31 3% 48 5% 34 4% 41 5% 21% 64% Native Hawaiian or Other Pacific Island - 0% - 0% - 0% 1 0% 1 0% 0% - Non Resident Alien 3 0% 5 1% 5 0% 6 1% 12 1% 100% 300% Two or more races - 0% - 0% 3 0% 11 1% 13 1% 18% - Unknown 55 6% 77 8% 57 6% 45 5% 35 4% -22% -36% White 586 67% 613 65% 641 63% 633 65% 574 64% -9% -2%Total 878 100% 944 100% 1,012 100% 967 100% 897 100% -7% 2%
continued on next page

Cleveland State U
niversity / 2013 Book of Trends56 Table 3.22: CSU Undergraduate Fall Enrollment by College & Ethnicity: 5-Year Trend
2008 2009 2010 2011 2012 Percent Change
College Race Enrollment % Enrollment % Enrollment % Enrollment % Enrollment % 1 year 5 year
Nursing American Indian/Alaska Native 2 0% 1 0% 2 0% 1 0% - 0% -100% -100% Asian 18 4% 15 3% 19 4% 19 4% 20 4% 5% 11% Black/African American 70 15% 100 19% 117 22% 70 14% 70 13% 0% 0% Hispanic/Latino 14 3% 10 2% 20 4% 20 4% 21 4% 5% 50% Native Hawaiian or Other Pacific Island - 0% - 0% - 0% - 0% 1 0% - - Non Resident Alien 2 0% 3 1% 8 1% 6 1% 11 2% 83% 450% Two or more races - 0% - 0% 5 1% 12 2% 13 2% 8% - Unknown 22 5% 30 6% 17 3% 17 3% 13 2% -24% -41% White 346 73% 356 69% 349 65% 355 71% 385 72% 8% 11%Total 474 100% 515 100% 537 100% 500 100% 534 100% 7% 13%Engineering American Indian/Alaska Native 2 0% 3 0% - 0% - 0% - 0% - -100% Asian 45 6% 43 5% 33 4% 34 3% 35 3% 3% -22% Black/African American 61 8% 80 9% 101 11% 97 10% 109 9% 12% 79% Hispanic/Latino 29 4% 32 4% 36 4% 34 3% 40 3% 18% 38% Native Hawaiian or Other Pacific Island - 0% - 0% 1 0% 2 0% 1 0% -50% - Non Resident Alien 62 8% 78 9% 91 10% 117 12% 177 15% 51% 185% Two or more races - 0% - 0% 6 1% 13 1% 16 1% 23% - Unknown 58 8% 79 9% 73 8% 63 6% 41 4% -35% -29% White 482 65% 541 63% 588 63% 637 64% 747 64% 17% 55%Total 739 100% 856 100% 929 100% 997 100% 1,166 100% 17% 58%Science American Indian/Alaska Native 2 0% 6 0% 9 0% 12 0% 13 0% 8% 550% Asian 66 4% 62 3% 68 3% 80 3% 85 3% 6% 29% Black/African American 324 19% 357 18% 432 18% 465 18% 517 18% 11% 60% Hispanic/Latino 53 3% 58 3% 89 4% 89 3% 115 4% 29% 117% Native Hawaiian or Other Pacific Island - 0% - 0% 1 0% 1 0% 5 0% 400% - Non Resident Alien 34 2% 33 2% 41 2% 42 2% 53 2% 26% 56% Two or more races - 0% - 0% 15 1% 48 2% 89 3% 85% - Unknown 129 8% 197 10% 157 7% 141 5% 115 4% -18% -11% White 1,077 64% 1,229 63% 1,528 65% 1,700 66% 1,884 66% 11% 75%Total 1,685 100% 1,942 100% 2,340 100% 2,578 100% 2,876 100% 12% 71%
continued from previous page
continued on next page
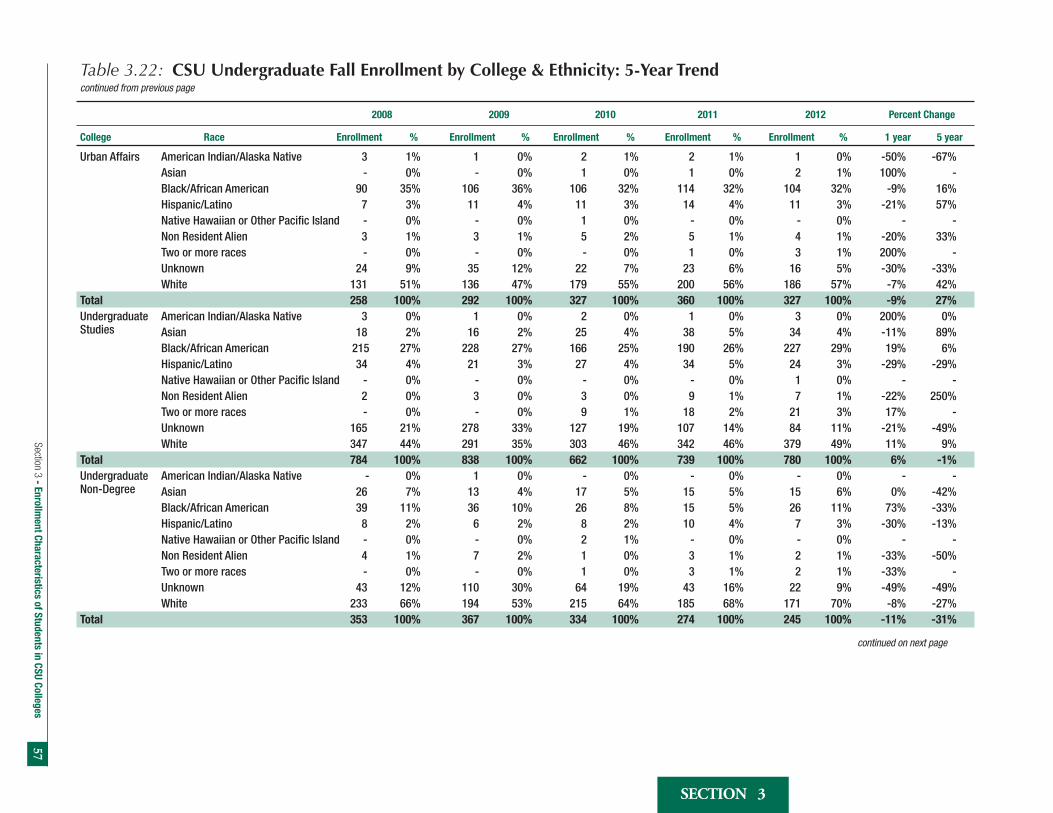
57Section 3 - Enrollm
ent Characteristics of Students in CSU Colleges
Section 3
Table 3.22: CSU Undergraduate Fall Enrollment by College & Ethnicity: 5-Year Trend
2008 2009 2010 2011 2012 Percent Change
College Race Enrollment % Enrollment % Enrollment % Enrollment % Enrollment % 1 year 5 year
Urban Affairs American Indian/Alaska Native 3 1% 1 0% 2 1% 2 1% 1 0% -50% -67% Asian - 0% - 0% 1 0% 1 0% 2 1% 100% - Black/African American 90 35% 106 36% 106 32% 114 32% 104 32% -9% 16% Hispanic/Latino 7 3% 11 4% 11 3% 14 4% 11 3% -21% 57% Native Hawaiian or Other Pacific Island - 0% - 0% 1 0% - 0% - 0% - - Non Resident Alien 3 1% 3 1% 5 2% 5 1% 4 1% -20% 33% Two or more races - 0% - 0% - 0% 1 0% 3 1% 200% - Unknown 24 9% 35 12% 22 7% 23 6% 16 5% -30% -33% White 131 51% 136 47% 179 55% 200 56% 186 57% -7% 42%Total 258 100% 292 100% 327 100% 360 100% 327 100% -9% 27%Undergraduate American Indian/Alaska Native 3 0% 1 0% 2 0% 1 0% 3 0% 200% 0%Studies Asian 18 2% 16 2% 25 4% 38 5% 34 4% -11% 89% Black/African American 215 27% 228 27% 166 25% 190 26% 227 29% 19% 6% Hispanic/Latino 34 4% 21 3% 27 4% 34 5% 24 3% -29% -29% Native Hawaiian or Other Pacific Island - 0% - 0% - 0% - 0% 1 0% - - Non Resident Alien 2 0% 3 0% 3 0% 9 1% 7 1% -22% 250% Two or more races - 0% - 0% 9 1% 18 2% 21 3% 17% - Unknown 165 21% 278 33% 127 19% 107 14% 84 11% -21% -49% White 347 44% 291 35% 303 46% 342 46% 379 49% 11% 9%Total 784 100% 838 100% 662 100% 739 100% 780 100% 6% -1%Undergraduate American Indian/Alaska Native - 0% 1 0% - 0% - 0% - 0% - -Non-Degree Asian 26 7% 13 4% 17 5% 15 5% 15 6% 0% -42% Black/African American 39 11% 36 10% 26 8% 15 5% 26 11% 73% -33% Hispanic/Latino 8 2% 6 2% 8 2% 10 4% 7 3% -30% -13% Native Hawaiian or Other Pacific Island - 0% - 0% 2 1% - 0% - 0% - - Non Resident Alien 4 1% 7 2% 1 0% 3 1% 2 1% -33% -50% Two or more races - 0% - 0% 1 0% 3 1% 2 1% -33% - Unknown 43 12% 110 30% 64 19% 43 16% 22 9% -49% -49% White 233 66% 194 53% 215 64% 185 68% 171 70% -8% -27%Total 353 100% 367 100% 334 100% 274 100% 245 100% -11% -31%
continued from previous page
continued on next page

Cleveland State U
niversity / 2013 Book of Trends58 Table 3.22: CSU Undergraduate Fall Enrollment by College & Ethnicity: 5-Year Trend
2008 2009 2010 2011 2012 Percent Change
College Race Enrollment % Enrollment % Enrollment % Enrollment % Enrollment % 1 year 5 year
Other American Indian/Alaska Native - 0% - 0% - 0% - 0% - 0% - - Asian 1 3% 1 2% 1 2% - 0% - 0% - -100% Black/African American - 0% - 0% - 0% - 0% - 0% - - Hispanic/Latino - 0% - 0% - 0% - 0% - 0% - - Native Hawaiian or Other Pacific Island - 0% - 0% - 0% - 0% - 0% - - Non Resident Alien 25 81% 43 96% 57 92% 111 99% 104 98% -6% 316% Two or more races - 0% - 0% - 0% - 0% - 0% - - Unknown 5 16% 1 2% 4 6% 1 1% 2 2% 100% -60% White - 0% - 0% - 0% - 0% - 0% - -Total 31 100% 45 100% 62 100% 112 100% 106 100% -5% 242%University American Indian/Alaska Native 26 0% 31 0% 38 0% 31 0% 32 0% 3% 23% Asian 318 3% 284 3% 297 3% 318 3% 314 3% -1% -1% Black/African American 2,030 21% 2,186 20% 2,437 21% 2,415 21% 2,419 20% 0% 19% Hispanic/Latino 322 3% 351 3% 470 4% 460 4% 499 4% 8% 55% Native Hawaiian or Other Pacific Island - 0% - 0% 7 0% 8 0% 15 0% 88% - Non Resident Alien 238 2% 295 3% 346 3% 448 4% 540 4% 21% 127% Two or more races - 0% - 0% 66 1% 186 2% 272 2% 46% - Unknown 824 8% 1,255 12% 888 8% 703 6% 542 5% -23% -34% White 6,067 62% 6,306 59% 6,947 60% 7,153 61% 7,406 62% 4% 22%Total 9,825 100% 10,708 100% 11,496 100% 11,722 100% 12,039 100% 3% 23%
continued from previous page

59Section 3 - Enrollm
ent Characteristics of Students in CSU Colleges
Section 3
Table 3.23: CSU Graduate & Law Fall Enrollment by College & Ethnicity: 5-Year Trend 2008 2009 2010 2011 2012 Percent Change
College Race Enrollment % Enrollment % Enrollment % Enrollment % Enrollment % 1 year 5 year
Business American Indian/Alaska Native 1 0% 1 0% 1 0% - 0% 3 0% - 200% Asian 40 4% 62 5% 56 4% 67 5% 56 4% -16% 40% Black/African American 104 9% 123 9% 125 9% 124 9% 148 11% 19% 42% Hispanic/Latino 14 1% 15 1% 26 2% 28 2% 36 3% 29% 157% Native Hawaiian or Other Pacific Island - 0% - 0% - 0% - 0% - 0% - - Non Resident Alien 188 17% 253 19% 283 20% 245 17% 266 19% 9% 41% Two or more races - 0% - 0% 7 0% 12 1% 8 1% -33% - Unknown 114 10% 161 12% 81 6% 74 5% 61 4% -18% -46% White 666 59% 742 55% 849 59% 869 61% 818 59% -6% 23%Total 1,127 100% 1,357 100% 1,428 100% 1,419 100% 1,396 100% -2% 24%CLASS American Indian/Alaska Native - 0% - 0% - 0% - 0% - 0% - - Asian 7 1% 5 1% 7 1% 6 1% 5 1% -17% -29% Black/African American 123 23% 129 22% 124 21% 127 21% 143 24% 13% 16% Hispanic/Latino 13 2% 15 3% 12 2% 14 2% 18 3% 29% 38% Native Hawaiian or Other Pacific Island - 0% - 0% - 0% - 0% - 0% - - Non Resident Alien 18 3% 14 2% 19 3% 17 3% 18 3% 6% 0% Two or more races - 0% - 0% 4 1% 4 1% 8 1% 100% - Unknown 74 14% 87 15% 57 10% 61 10% 43 7% -30% -42% White 311 57% 332 57% 365 62% 374 62% 361 61% -3% 16%Total 546 100% 582 100% 588 100% 603 100% 596 100% -1% 9%Education American Indian/Alaska Native 3 0% 3 0% 3 0% 1 0% - 0% -100% -100% Asian 20 1% 18 1% 16 1% 18 1% 14 1% -22% -30% Black/African American 403 23% 371 23% 363 23% 359 24% 319 23% -11% -21% Hispanic/Latino 34 2% 27 2% 39 2% 40 3% 34 2% -15% 0% Native Hawaiian or Other Pacific Island - 0% - 0% - 0% 1 0% 1 0% 0% - Non Resident Alien 37 2% 39 2% 56 3% 55 4% 53 4% -4% 43% Two or more races - 0% - 0% 4 0% 10 1% 13 1% 30% - Unknown 235 13% 231 14% 190 12% 153 10% 106 8% -31% -55% White 1,016 58% 958 58% 938 58% 847 57% 829 61% -2% -18%Total 1,748 100% 1,647 100% 1,609 100% 1,484 100% 1,369 100% -8% -22%
continued on next page

Cleveland State U
niversity / 2013 Book of Trends60 Table 3.23: CSU Graduate & Law Fall Enrollment by College & Ethnicity: 5-Year Trend
2008 2009 2010 2011 2012 Percent Change
College Race Enrollment % Enrollment % Enrollment % Enrollment % Enrollment % 1 year 5 year
Nursing American Indian/Alaska Native - 0% - 0% - 0% - 0% - 0% - - Asian - 0% - 0% 1 2% 1 2% 1 2% 0% - Black/African American 7 15% 2 5% 5 9% 7 12% 9 16% 29% 29% Hispanic/Latino - 0% 1 2% 2 4% 1 2% 2 3% 100% - Native Hawaiian or Other Pacific Island - 0% - 0% - 0% - 0% - 0% - - Non Resident Alien - 0% - 0% 1 2% 1 2% 1 2% 0% - Two or more races - 0% - 0% - 0% - 0% 1 2% - - Unknown 4 8% 4 9% 6 11% 7 12% 5 9% -29% 25% White 37 77% 36 84% 40 73% 42 71% 39 67% -7% 5%Total 48 100% 43 100% 55 100% 59 100% 58 100% -2% 21%Engineering American Indian/Alaska Native - 0% 1 0% 3 1% 2 0% 1 0% -50% - Asian 10 3% 12 3% 19 4% 19 4% 19 5% 0% 90% Black/African American 10 3% 8 2% 17 4% 14 3% 11 3% -21% 10% Hispanic/Latino 3 1% 4 1% 4 1% 4 1% 8 2% 100% 167% Native Hawaiian or Other Pacific Island - 0% - 0% - 0% 1 0% 1 0% 0% - Non Resident Alien 242 62% 230 55% 249 54% 247 54% 192 48% -22% -21% Two or more races - 0% - 0% - 0% - 0% - 0% - - Unknown 16 4% 26 6% 19 4% 30 7% 22 5% -27% 38% White 112 28% 135 32% 151 33% 138 30% 149 37% 8% 33%Total 393 100% 416 100% 462 100% 455 100% 403 100% -11% 3%Science American Indian/Alaska Native 1 0% 2 0% 1 0% 1 0% - 0% -100% -100% Asian 13 2% 25 3% 26 4% 22 3% 28 3% 27% 115% Black/African American 53 8% 54 7% 48 7% 51 6% 56 7% 10% 6% Hispanic/Latino 13 2% 13 2% 18 2% 13 2% 12 1% -8% -8% Native Hawaiian or Other Pacific Island - 0% - 0% - 0% 1 0% 1 0% 0% - Non Resident Alien 99 15% 103 14% 110 15% 140 18% 139 16% -1% 40% Two or more races - 0% - 0% 3 0% 4 1% 6 1% 50% - Unknown 70 10% 89 12% 52 7% 46 6% 38 4% -17% -46% White 421 63% 449 61% 474 65% 512 65% 571 67% 12% 36%Total 670 100% 735 100% 732 100% 790 100% 851 100% 8% 27%
continued from previous page
continued on next page

61Section 3 - Enrollm
ent Characteristics of Students in CSU Colleges
Section 3
continued on next page
Table 3.23: CSU Graduate & Law Fall Enrollment by College & Ethnicity: 5-Year Trend 2008 2009 2010 2011 2012 Percent Change
College Race Enrollment % Enrollment % Enrollment % Enrollment % Enrollment % 1 year 5 year
Urban Affairs American Indian/Alaska Native 1 0% 2 1% 1 0% - 0% - 0% - -100% Asian 4 1% 5 2% 3 1% 2 1% 3 1% 50% -25% Black/African American 77 22% 68 21% 79 22% 64 19% 57 19% -11% -26% Hispanic/Latino 9 3% 6 2% 7 2% 8 2% 7 2% -13% -22% Native Hawaiian or Other Pacific Island - 0% - 0% 1 0% 1 0% - 0% -100% - Non Resident Alien 39 11% 28 9% 30 8% 26 8% 27 9% 4% -31% Two or more races - 0% - 0% 3 1% 5 2% 4 1% -20% - Unknown 36 10% 45 14% 41 11% 28 9% 17 6% -39% -53% White 191 54% 175 53% 196 54% 195 59% 178 61% -9% -7%Total 357 100% 329 100% 361 100% 329 100% 293 100% -11% -18%Law American Indian/Alaska Native 2 0% 3 0% 2 0% 1 0% 1 0% 0% -50% Asian 22 3% 17 3% 11 2% 14 2% 12 2% -14% -45% Black/African American 45 7% 52 8% 55 9% 54 10% 40 8% -26% -11% Hispanic/Latino 15 2% 16 2% 12 2% 17 3% 20 4% 18% 33% Native Hawaiian or Other Pacific Island - 0% - 0% - 0% - 0% - 0% - - Non Resident Alien 9 1% 9 1% 5 1% 6 1% 7 1% 17% -22% Two or more races - 0% - 0% 1 0% 2 0% 5 1% 150% - Unknown 59 9% 77 12% 29 5% 15 3% 9 2% -40% -85% White 520 77% 471 73% 495 81% 454 81% 407 81% -10% -22%Total 672 100% 645 100% 610 100% 563 100% 501 100% -11% -25%Graduate American Indian/Alaska Native 1 2% - 0% - 0% - 0% - 0% - -100%Studies Asian - 0% - 0% 1 2% 2 9% 2 11% 0% - Black/African American 17 32% 8 18% 13 29% 4 17% 2 11% -50% -88% Hispanic/Latino 1 2% - 0% 1 2% 1 4% - 0% -100% -100% Native Hawaiian or Other Pacific Island - 0% - 0% - 0% - 0% - 0% - - Non Resident Alien - 0% - 0% - 0% - 0% - 0% - - Two or more races - 0% - 0% - 0% - 0% 1 5% - - Unknown 6 11% 16 36% 10 22% 5 22% 1 5% -80% -83% White 28 53% 20 45% 20 44% 11 48% 13 68% 18% -54%Total 53 100% 44 100% 45 100% 23 100% 19 100% -17% -64%
continued from previous page

Cleveland State U
niversity / 2013 Book of Trends62 Table 3.23: CSU Graduate & Law Fall Enrollment by College & Ethnicity: 5-Year Trend
2008 2009 2010 2011 2012 Percent Change
College Race Enrollment % Enrollment % Enrollment % Enrollment % Enrollment % 1 year 5 year
University American Indian/Alaska Native 9 0% 12 0% 11 0% 5 0% 5 0% 0% -44% Asian 116 2% 144 2% 140 2% 151 3% 140 3% -7% 21% Black/African American 839 15% 815 14% 829 14% 804 14% 785 14% -2% -6% Hispanic/Latino 102 2% 97 2% 121 2% 126 2% 137 2% 9% 34% Native Hawaiian or Other Pacific Island - 0% - 0% 1 0% 4 0% 3 0% -25% - Non Resident Alien 632 11% 676 12% 753 13% 737 13% 703 13% -5% 11% Two or more races - 0% - 0% 22 0% 37 1% 46 1% 24% - Unknown 614 11% 736 13% 485 8% 419 7% 302 6% -28% -51% White 3,302 59% 3,318 57% 3,528 60% 3,442 60% 3,365 61% -2% 2%Total 5,614 100% 5,798 100% 5,890 100% 5,725 100% 5,486 100% -4% -2%
continued from previous page

63Section 3 - Enrollment Characteristics of Students in CSU Colleges
Sec
tio
n
3
Table 3.24: Undergraduate Fall Enrollment by College & Load: 5-Year Trend Undergraduate Full-Time
Percent Change
College 2008 2009 2010 2011 2012 1 Year 5 Year
Business 1,333 1,434 1,509 1,402 1,316 -6% -1%CLASS 2,154 2,244 2,440 2,508 2,457 -2% 14%Education 592 664 703 668 634 -5% 7%Nursing 364 416 437 435 469 8% 29%Engineering 577 665 736 808 932 15% 62%Science 1,347 1,521 1,790 1,987 2,219 12% 65%Urban Affairs 163 175 194 220 197 -10% 21%Undergraduate Studies 393 418 255 312 353 13% -10%Undergraduate Non-Degree 45 55 46 31 24 -23% -47%Other 3 1 - - - - -Total 6,971 7,593 8,110 8,371 8,601 3% 23%
Undergraduate Part-Time
Percent Change
College 2008 2009 2010 2011 2012 1 Year 5 Year
Business 593 632 697 660 657 0% 11%CLASS 543 599 639 625 678 8% 25%Education 286 280 309 299 263 -12% -8%Nursing 110 99 100 65 65 0% -41%Engineering 162 191 192 189 234 24% 44%Science 338 421 540 591 657 11% 94%Urban Affairs 95 117 139 140 130 -7% 37%Undergraduate Studies 391 420 408 427 427 0% 9%Undergraduate Non-Degree 308 312 290 243 221 -9% -28%Other 28 44 72 112 106 -5% 279%Total 2,854 3,115 3,386 3,351 3,438 3% 20%

Cleveland State University / 2013 Book of Trends64
Table 3.25: Graduate & Law Fall Enrollment by College & Load: 5-Year Trend Graduate & Law Full-Time
Percent Change
College 2008 2009 2010 2011 2012 1 Year 5 Year
Business 379 487 541 438 457 4% 21%CLASS 246 246 247 250 237 -5% -4%Education 330 299 276 278 241 -13% -27%Nursing 8 8 10 5 19 280% 138%Engineering 136 122 129 80 74 -8% -46%Science 388 438 472 402 436 8% 12%Urban Affairs 89 95 105 74 58 -22% -35%Law 446 449 419 391 350 -10% -22%Graduate Studies 1 - 2 - 4 - 300%Total 2,023 2,144 2,201 1,918 1,876 -2% -7%
Graduate & Law Part-Time
Percent Change
College 2008 2009 2010 2011 2012 1 Year 5 Year
Business 748 870 887 981 939 -4% 26%CLASS 300 336 341 353 359 2% 20%Education 1,418 1,348 1,333 1,206 1,128 -6% -20%Nursing 40 35 45 54 39 -28% -3%Engineering 257 294 333 375 329 -12% 28%Science 282 297 260 388 415 7% 47%Urban Affairs 268 234 256 255 235 -8% -12%Law 226 196 191 172 151 -12% -33%Graduate Studies 52 44 43 23 15 -35% -71%Total 3,591 3,654 3,689 3,807 3,610 -5% 1%

65Section 3 - Enrollment Characteristics of Students in CSU Colleges
Sec
tio
n
3
East and West CentersThe opening of Cleveland State University West Center (Westlake) in August 2003 and East Center (Solon) in August 2004 established a suburban presence for the University’s thriving downtown campus. The mission of the centers is dedicated to serving all students and offering the highest level of customer service. Academic offerings include programs for educators (teachers and administrators), business and public service professionals seeking to complete their university degree, and traditional college-age students and high school students in post-secondary educational option programs. CSU has given high priority to strengthening relationships with local community colleges and supporting the rise of e-Learning. As such, the East Center in Solon closed in August of 2011.
Table 3.26: West Center Student Credit Hours: Fall Semesters
West Center
Undergraduate Graduate/Law Total
College 2008 2009 2010 2011 2012 2008 2009 2010 2011 2012 2008 2009 2010 2011 2012
Business 528 472 493 243 268 500 540 288 310 135 1,028 1,012 781 553 403 CLASS 364 424 306 64 - - - - - 364 424 306 64 - Education 27 39 42 54 267 263 421 224 204 294 302 463 278 204 Science 132 132 15 93 112 56 - - - - 188 132 15 93 112 Nursing - - 80 - - - - - - - - 80 - - Urban Affairs - - - - - 8 - - - - 8 - - - - Total 1,051 1,067 936 454 380 831 803 709 534 339 1,882 1,870 1,645 988 719
Table 3.26a: Annual West Center Historical Enrollment and SCH Trends
West Center
Enrollment Percent Change SCH Percent Change
College 2008-09 2009-10 2010-11 2011-12 2012-13 1-Year 5-Year 2008-09 2009-10 2010-11 2011-12 2012-13 1-Year 5-Year
Summer 343 398 280 179 173 -3% -50% 1,308 1,590 1,087 644 540 -16% -59%Fall 444 416 385 246 170 -31% -62% 1,882 1,870 1,630 988 719 -27% -62%Spring 376 434 486 280 188 -33% -50% 1,648 1,773 1,830 1,086 694 -36% -58%Total 1,163 1,248 1,151 705 531 -25% -54% 4,838 5,233 4,547 2,718 1,953 -28% -60%
Figure 3.26a: Annual West Center Historical Enrollment and SCH Trends
0
100
200
300
400
500
Enro
llmen
t
Summer Fall Spring0
500
1,000
1,500
2,000
Stud
ent C
redi
t Hou
rs
Summer Fall Spring
2008-09 2009-10 2010-11 2011-12 2012-132008-09 2009-10 2010-11 2011-12 2012-13
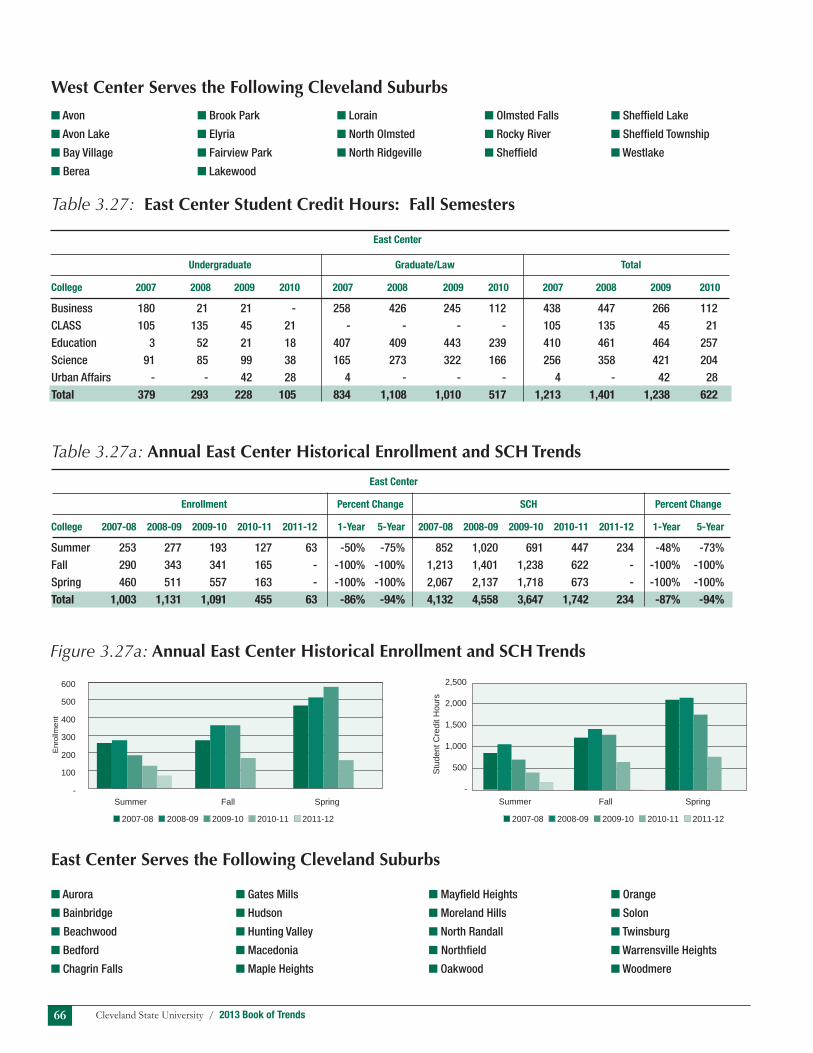
Cleveland State University / 2013 Book of Trends66
Table 3.27: East Center Student Credit Hours: Fall Semesters
East Center
Undergraduate Graduate/Law Total
College 2007 2008 2009 2010 2007 2008 2009 2010 2007 2008 2009 2010
Business 180 21 21 - 258 426 245 112 438 447 266 112CLASS 105 135 45 21 - - - - 105 135 45 21Education 3 52 21 18 407 409 443 239 410 461 464 257 Science 91 85 99 38 165 273 322 166 256 358 421 204Urban Affairs - - 42 28 4 - - - 4 - 42 28Total 379 293 228 105 834 1,108 1,010 517 1,213 1,401 1,238 622
Table 3.27a: Annual East Center Historical Enrollment and SCH Trends
East Center
Enrollment Percent Change SCH Percent Change
College 2007-08 2008-09 2009-10 2010-11 2011-12 1-Year 5-Year 2007-08 2008-09 2009-10 2010-11 2011-12 1-Year 5-Year
Summer 253 277 193 127 63 -50% -75% 852 1,020 691 447 234 -48% -73%Fall 290 343 341 165 - -100% -100% 1,213 1,401 1,238 622 - -100% -100%Spring 460 511 557 163 - -100% -100% 2,067 2,137 1,718 673 - -100% -100%Total 1,003 1,131 1,091 455 63 -86% -94% 4,132 4,558 3,647 1,742 234 -87% -94%
West Center Serves the Following Cleveland Suburbs
n Avon n Brook Park n Lorain n Olmsted Falls n Sheffield Lake
n Avon Lake n Elyria n North Olmsted n Rocky River n Sheffield Township
n Bay Village n Fairview Park n North Ridgeville n Sheffield n Westlake
n Berea n Lakewood
East Center Serves the Following Cleveland Suburbs
n Aurora n Gates Mills n Mayfield Heights n Orange
n Bainbridge n Hudson n Moreland Hills n Solon
nBeachwood n Hunting Valley n North Randall n Twinsburg
n Bedford n Macedonia nNorthfield n Warrensville Heights
n Chagrin Falls n Maple Heights n Oakwood n Woodmere
Figure 3.27a: Annual East Center Historical Enrollment and SCH Trends
1,251 795 852 1,020 969 1,219 1,106 1,213 1,401 1,462 1,348 1,054 2,067 2,137
-
500
1,000
1,500
2,000
2,500
Stud
ent C
redi
t Hou
rs
Summer Fall Spring
332 227 253 277 626 349 275 290 343 431 337 267 460 511
Enro
llmen
t
-
100
200
300
400
500
600
Summer Fall Spring
2007-08 2008-09 2009-10 2010-11 2011-12 2007-08 2008-09 2009-10 2010-11 2011-12
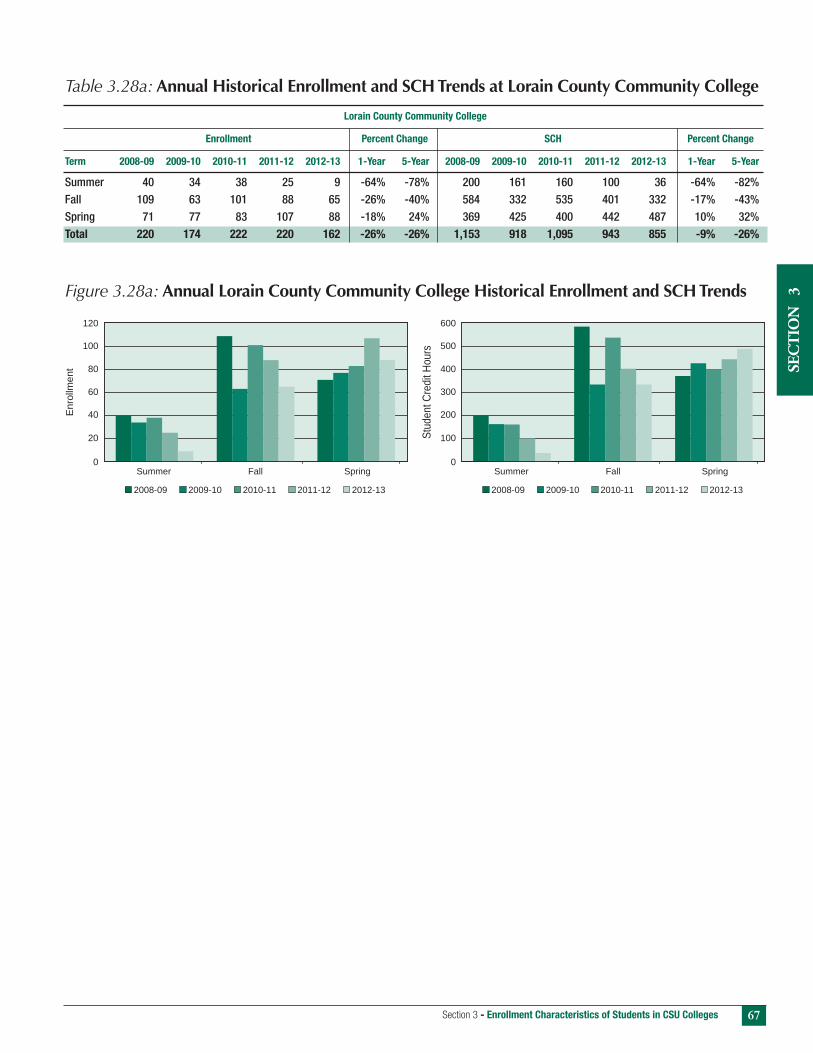
67Section 3 - Enrollment Characteristics of Students in CSU Colleges
Sec
tio
n
3
Table 3.28a: Annual Historical Enrollment and SCH Trends at Lorain County Community College Lorain County Community College
Enrollment Percent Change SCH Percent Change
Term 2008-09 2009-10 2010-11 2011-12 2012-13 1-Year 5-Year 2008-09 2009-10 2010-11 2011-12 2012-13 1-Year 5-Year
Summer 40 34 38 25 9 -64% -78% 200 161 160 100 36 -64% -82%Fall 109 63 101 88 65 -26% -40% 584 332 535 401 332 -17% -43%Spring 71 77 83 107 88 -18% 24% 369 425 400 442 487 10% 32%Total 220 174 222 220 162 -26% -26% 1,153 918 1,095 943 855 -9% -26%
Figure 3.28a: Annual Lorain County Community College Historical Enrollment and SCH Trends
0
20
40
60
80
100
120
Enro
llmen
t
Summer Fall Spring
2008-09 2009-10 2010-11 2011-12 2012-13
0
100
200
300
400
500
600
Stud
ent C
redit
Hou
rs
Summer Fall Spring
2008-09 2009-10 2010-11 2011-12 2012-13

Cleveland State University / 2013 Book of Trends68
Table 3.28b: Annual Historical Enrollment and SCH Trends at Lakeland Community College
Lakeland Community College
Enrollment Percent Change SCH Percent Change
Term 2008-09 2009-10 2010-11 2011-12 2012-13 1-Year 5-Year 2008-09 2009-10 2010-11 2011-12 2012-13 1-Year 5-Year
Summer 83 56 73 36 29 -19% -65% 291 243 266 115 91 -21% -69%Fall 106 142 171 75 92 23% -13% 618 626 672 337 447 33% -28%Spring 171 177 156 96 112 17% -35% 945 808 742 526 500 -5% -47%Total 360 375 400 207 233 13% -35% 1,854 1,677 1,680 978 1,038 6% -44%
Partnerships with Lakeland Community College and Lorain County Community College The partnerships foster direct collaboration with community colleges to offer degree programs on the community college campus in addition to easy transfer through dual admission and various articulation agreements. All locations have grown in popularity as transfer students recognize the value and convenience of gaining an associate’s degree and a degree from CSU. Liaison with these community colleges has been well planned and highly successful due to a shared passion for educating students.
Figure 3.28b: Annual Lakeland Community College Historical Enrollment and SCH Trends
2,0000
200
400
600
800
1,000
Stud
ent C
redit
Hou
rs
Summer Fall Spring
2008-09 2009-10 2010-11 2011-12 2012-13
0
50
100
150
200
Enro
llmen
t
Summer Fall Spring
2008-09 2009-10 2010-11 2011-12 2012-13

69Section 3 - Enrollment Characteristics of Students in CSU Colleges
Sec
tio
n
3
Table 3.28c: Annual Historical Enrollment and SCH Trends at Other Off-Campus Locations
Other Locations*
Enrollment Percent Change SCH Percent Change
2008-09 2009-10 2010-11 2011-12 2012-13 1-Year 5-Year 2008-09 2009-10 2010-11 2011-12 2012-13 1-Year 5-Year
Summer 290 236 224 163 165 1% -43% 1,536 1,248 1,319 1,011 1,008 0% -34%Fall 552 547 518 596 832 40% 51% 2,395 2,418 2,481 2,980 4,018 35% 68%Spring 651 624 588 570 630 11% -3% 3,061 3,019 2,872 2,307 2,510 9% -18%Total 1,493 1,407 1,330 1,329 1,627 22% 9% 6,992 6,685 6,672 6,298 7,536 20% 8%
Note: Student is counted once even if attending multiple off-campus locations
Figure 3.28c: Annual Other Off-Campus Locations Historical Enrollment and SCH Trend
CSU Top 10 Annual Off-Campus Locations In Greater Cleveland Area by Student Credit Hour
nCleveland Clinic Foundation nProgressive Insurance nUniversity Hospital
nLake County Education Service Center nMetroHealth nHeadstart
nSolon High School nDefense Finance & Accounting Service nUrban Design Center
nFairview General Hospital
*Other Off-Campus Locations include all off campus locations except East, West, Lorain and Lakeland.
0100200300400500600700800900
Enro
llmen
t
Summer Fall Spring
2008-09 2009-10 2010-11 2011-12 2012-13
1,000
0
2,000
3,000
4,000
5,000
Stud
ent C
redit
Hou
rs
Summer Fall Spring
2008-09 2009-10 2010-11 2011-12 2012-13

Cleveland State University / 2013 Book of Trends70

Sec
tio
n
4
Book of Trends
Cleveland State University
2013
Sponsored Research
4

Cleveland State University / 2013 Book of Trends72

73Section 4 - Sponsored Programs and Research
Sec
tio
n
4
Fiscal Year Percent Change
Source FY 2007 FY 2008 FY 2009 FY 2010 FY 2011 FY 2012 1 Year 5 Year
Awards $46,453,388 $27,661,642 $18,677,794 $22,909,197 $17,093,917 $13,483,748 -21% -71% CSU Expenditures $23,390,243 $23,854,742 $20,945,565 $18,558,947 $16,913,731 $20,617,912 22% -12% CCF Expenditures N/A N/A N/A $24,422,152 $43,642,969 $44,925,258 3% CSU & CCF Exp Total N/A N/A N/A $42,981,099 $60,556,700 $65,543,170 8%
Sponsored Programs and Research at Cleveland State UniversityThe University is committed to enhancing the research environment in support of its faculty and students. As such, efforts are underway to expand the research services currently offered to assist those seeking external funding for research, scholarship, and creative projects. Cleveland State University established a new office, the Office of Research, headed by the Vice President for Research and Graduate Studies, who is responsible for raising the research profile at Cleveland State University and for establishing the University as a recognized contributor to the local, regional, national and global research priorities. The creation of this expanding office will enable the University to achieve its mission, in which scholarship and research are held as major tenets.
Bringing discoveries from the laboratory to the classroom and to the world is a long and very expensive undertaking, one that is at the heart of what a university should do and do well. While Cleveland State is a “young” institution, it has committed itself to discovery and to becoming a research-focused university. And, while we are still in the early phases of that steep research incline, CSU has much to show for its initial efforts - efforts that presage a promising future.
It is important to note that the sponsored program proposals and awards that are described by the numbers and charts to follow would not have been possible without the drive, dedication and intellect of the University’s talented and diverse faculty and the contributions of graduate students and postdocs.
Table 4.1: Sponsored Program Awards and Expenditures, Fiscal Years 2007-2012
Figure 4.1: Sponsored Program Awards and Expenditures, Fiscal Years 2007-2012
Notes:1 The Total Award amount for FY 2010 & forward differs from that listed in the Monthly Activity Reports previously published by OSPR (http://www.csuohio.edu/offices/spr/monthlyactivityreports/index.html) for two reasons: 1) the reports in the Book of Trends include State Appropriations as a separate line-item while the Monthly Activity Reports do not. The amount stated here is higher because not all State Appropriation funding has been allocated to a Sponsored Program account. 2) The Award amount in the Monthly Activity Report for FY 2010 and the Award Amount numbers published in the Book of Trends for previous years were based on the Award amount received during that period for each project. For FY 2010 and forward, the Total Project Award Amount is reported.2 FY 2010 forward, CSU is including research expenditures from the Lerner Research Institute (LRI) at the Cleveland Clinic Foundation. These expenditures are only for those grants held by LRI faculty who engage with Cleveland State University students.
Note: The large increase in funding during Fiscal Year 2007 is due to the $23.8 million award from the State of Ohio’s Third Frontier program that established the Wright Center for Sensor Systems
Engineering. This Center involves a 33 member partnership led by the University.
$0
$10
$20
$30
$40
$50
$60
$70
FY 2007 FY 2008 FY 2009 FY 2010 FY 2011 FY 2012
Dol
lars
in M
illio
ns
Awards CSU & CCF Expenditures

Cleveland State University / 2013 Book of Trends74
Table 4.2: Sponsored Program Awards by Source, Fiscal Years 2007-2012
Figure 4.2a: Sponsored Program Awards by Source, Fiscal Year 2012
Percent Change
Source FY 2007 FY 2008 FY 2009 FY 2010 FY 2011 FY 2012 1 Year 5 Year
Federal Grants $13,149,371 $13,894,606 $7,165,852 $15,017,485 $12,187,422 $8,696,479 -29% -34%State Grants $26,308,453 $7,466,819 $3,756,471 $1,212,245 $479,032 $589,860 23% -98%Local Grants $664,999 $735,848 $801,757 $822,273 $416,185 $253,289 -39% -62%Private Grants $2,889,061 $2,311,264 $3,950,919 $2,245,353 $2,791,295 $3,944,120 41% 37%State Appropriations $3,441,504 $3,253,105 $3,002,795 $3,611,841 $1,219,983 $360,551 -70% -90%
Total $46,453,388 $27,661,642 $18,677,794 $22,909,197 $17,093,917 $13,844,299 -19% -70%
Notes: 1 The Total Award amount for FY 2010 & forward differs from that listed in the Monthly Activity Reports previously published by OSPR (http://www.csuohio.edu/offices/spr/monthlyactivityreports/index.html) for two reasons: 1) the reports in the Book of Trends include State Appropriations as a separate line-item while the Monthly Activity Reports do not. The amount stated here is higher because not all State Appropriation funding has been allocated to a Sponsored Program account. 2) The Award amount in the Monthly Activity Report for FY 2010 and the Award Amount numbers published in the Book of Trends for previous years were based on the Award amount received during that period for each project. For FY 2010 and forward, the Total Project Award Amount is reported.
Figure 4.2b: Program Awards and Expenditures by Source, Fiscal Years 2007-2012
Source: CSU Office of Sponsored Programs and Research.Appropriation: An authorization granted by the General Assembly to make budgetary expenditures and to incur obligations for specific purposes.Grant: A financial assistance mechanism whereby money and/or direct assistance is provided to carry out approved activities.
Federal Grants63%
State Grants4%
Local Grants2%
Private Grants28%
State Appropriations3%
$0
$5
$10
$15
$20
$25
$30
$35
FY 2007 FY 2008 FY 2009 FY 2010 FY 2011F Y 2012
Dol
lars
in M
illio
ns
Federal Grants State Grants Local Grants Private Grants State Appropriations

75Section 4 - Sponsored Programs and Research
Sec
tio
n
4
Table 4.3: Sponsored Program Expenditures by Source, Fiscal Years 2007-2012
Figure 4.3a: Sponsored Program Expenditures by Source, Fiscal Year 2012
Source: CSU Office of Sponsored Programs and Research
Source: CSU Office of Sponsored Programs and Research. Appropriation: An authorization granted by the General Assembly to make budgetary expenditures and to incur obligations for specific purposes.Grant: A financial assistance mechanism whereby money and/or direct assistance is provided to carry out approved activities.
Figure 4.3b: Sponsored Program Expenditures by Source, Fiscal Years 2007-2012
Federal Grants49%
State Grants33%
Local Grants2%
Private Grants13%
State Appropriations3%
Federal Grants State Grants Local Grants Private Grants State Appropriations
$0
$2
$4
$6
$8
$10
$12
$14
FY 2007F Y 2008 FY 2009 FY 2010 FY 2011 FY 2012
Dol
lars
in M
illio
ns
Percent Change
Source FY 2007 FY 2008 FY 2009 FY 2010 FY 2011 FY 2012 1 Year 5 Year
Federal Grants $13,197,818 $13,034,157 $10,310,031 $11,316,469 $8,875,304 $10,128,616 14% -23%State Grants $3,038,309 $4,508,061 $5,024,183 $3,824,824 $4,837,728 $6,807,950 41% 124%Local Grants $746,548 $755,966 $669,563 $492,569 $536,053 $514,801 -4% -31%Private Grants $2,792,794 $2,293,476 $2,509,684 $1,979,982 $2,105,142 $2,648,247 26% -5%State Appropriations $3,614,774 $3,263,082 $2,432,104 $945,103 $559,504 $518,299 -7% -86%LRI - CCF Expenditures $24,422,152 $43,642,969 $44,925,258 3% N/A
Total $23,390,243 $23,854,742 $20,945,565 $42,981,099 $60,556,700 $65,543,171 8% 180%
Notes: 1 For FY 2010 & forward, CSU is including research expenditures from the Lerner Research Institute (LRI) at the Cleveland Clinic Foundation. These expenditures are only for those grants held by LRI faculty who engage with Cleveland State University students.2 The figures below only detail Cleveland State University expenditures.
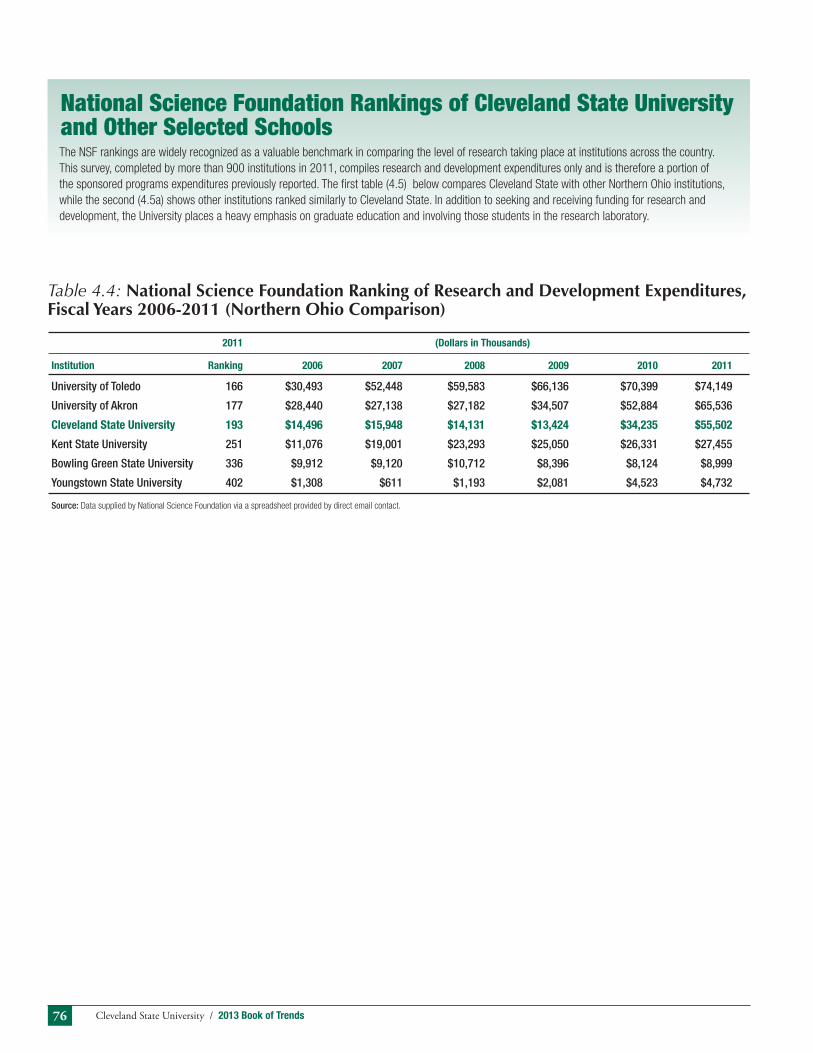
Cleveland State University / 2013 Book of Trends76
National Science Foundation Rankings of Cleveland State University and Other Selected SchoolsThe NSF rankings are widely recognized as a valuable benchmark in comparing the level of research taking place at institutions across the country. This survey, completed by more than 900 institutions in 2011, compiles research and development expenditures only and is therefore a portion of the sponsored programs expenditures previously reported. The first table (4.5) below compares Cleveland State with other Northern Ohio institutions, while the second (4.5a) shows other institutions ranked similarly to Cleveland State. In addition to seeking and receiving funding for research and development, the University places a heavy emphasis on graduate education and involving those students in the research laboratory.
2011 (Dollars in Thousands)
Institution Ranking 2006 2007 2008 2009 2010 2011
University of Toledo 166 $30,493 $52,448 $59,583 $66,136 $70,399 $74,149
University of Akron 177 $28,440 $27,138 $27,182 $34,507 $52,884 $65,536
Cleveland State University 193 $14,496 $15,948 $14,131 $13,424 $34,235 $55,502
Kent State University 251 $11,076 $19,001 $23,293 $25,050 $26,331 $27,455
Bowling Green State University 336 $9,912 $9,120 $10,712 $8,396 $8,124 $8,999
Youngstown State University 402 $1,308 $611 $1,193 $2,081 $4,523 $4,732
Source: Data supplied by National Science Foundation via a spreadsheet provided by direct email contact.
Table 4.4: National Science Foundation Ranking of Research and Development Expenditures,Fiscal Years 2006-2011 (Northern Ohio Comparison)
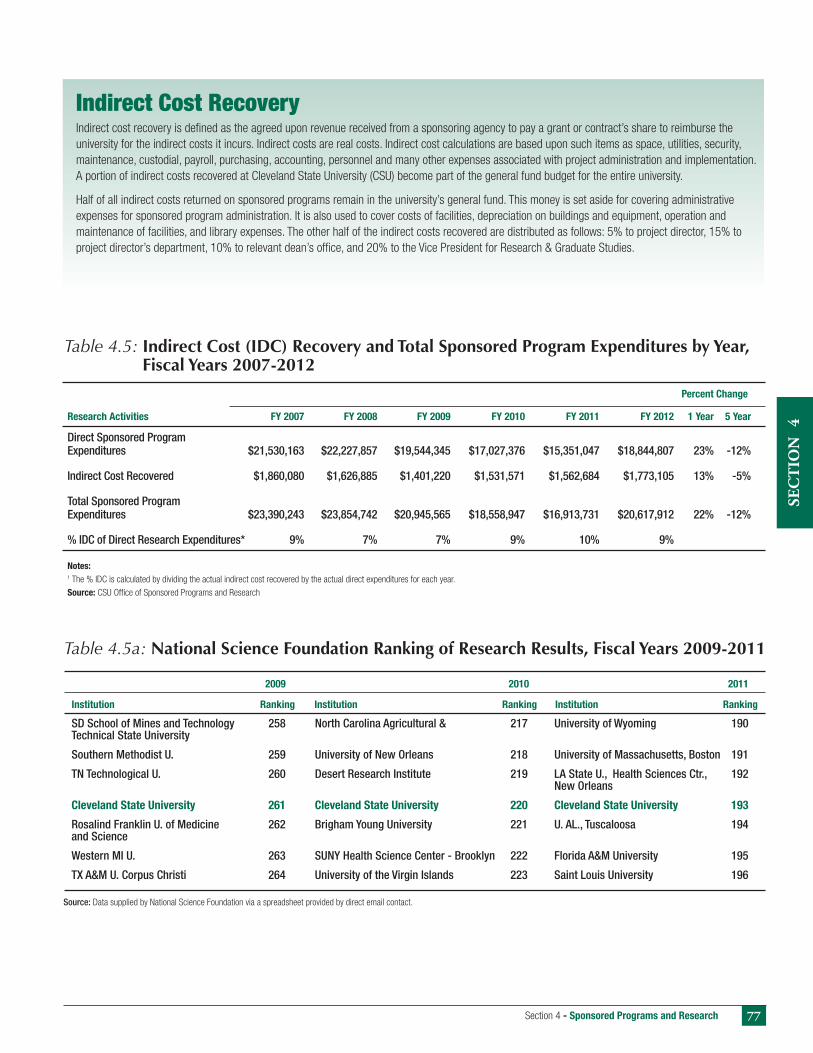
77Section 4 - Sponsored Programs and Research
Sec
tio
n
4
Indirect Cost RecoveryIndirect cost recovery is defined as the agreed upon revenue received from a sponsoring agency to pay a grant or contract’s share to reimburse the university for the indirect costs it incurs. Indirect costs are real costs. Indirect cost calculations are based upon such items as space, utilities, security, maintenance, custodial, payroll, purchasing, accounting, personnel and many other expenses associated with project administration and implementation. A portion of indirect costs recovered at Cleveland State University (CSU) become part of the general fund budget for the entire university.
Half of all indirect costs returned on sponsored programs remain in the university’s general fund. This money is set aside for covering administrative expenses for sponsored program administration. It is also used to cover costs of facilities, depreciation on buildings and equipment, operation and maintenance of facilities, and library expenses. The other half of the indirect costs recovered are distributed as follows: 5% to project director, 15% to project director’s department, 10% to relevant dean’s office, and 20% to the Vice President for Research & Graduate Studies.
Table 4.5: Indirect Cost (IDC) Recovery and Total Sponsored Program Expenditures by Year, Fiscal Years 2007-2012
Percent Change
Research Activities FY 2007 FY 2008 FY 2009 FY 2010 FY 2011 FY 2012 1 Year 5 Year
Direct Sponsored Program Expenditures $21,530,163 $22,227,857 $19,544,345 $17,027,376 $15,351,047 $18,844,807 23% -12%
Indirect Cost Recovered $1,860,080 $1,626,885 $1,401,220 $1,531,571 $1,562,684 $1,773,105 13% -5%
Total Sponsored Program Expenditures $23,390,243 $23,854,742 $20,945,565 $18,558,947 $16,913,731 $20,617,912 22% -12%
% IDC of Direct Research Expenditures* 9% 7% 7% 9% 10% 9%
Notes: 1 The % IDC is calculated by dividing the actual indirect cost recovered by the actual direct expenditures for each year.
Source: CSU Office of Sponsored Programs and Research
2009 2010 2011
Institution Ranking Institution Ranking Institution Ranking
SD School of Mines and Technology 258 North Carolina Agricultural & 217 University of Wyoming 190 Technical State University
Southern Methodist U. 259 University of New Orleans 218 University of Massachusetts, Boston 191
TN Technological U. 260 Desert Research Institute 219 LA State U., Health Sciences Ctr., 192 New Orleans
Cleveland State University 261 Cleveland State University 220 Cleveland State University 193
Rosalind Franklin U. of Medicine 262 Brigham Young University 221 U. AL., Tuscaloosa 194 and Science
Western MI U. 263 SUNY Health Science Center - Brooklyn 222 Florida A&M University 195
TX A&M U. Corpus Christi 264 University of the Virgin Islands 223 Saint Louis University 196
Table 4.5a: National Science Foundation Ranking of Research Results, Fiscal Years 2009-2011
Source: Data supplied by National Science Foundation via a spreadsheet provided by direct email contact.
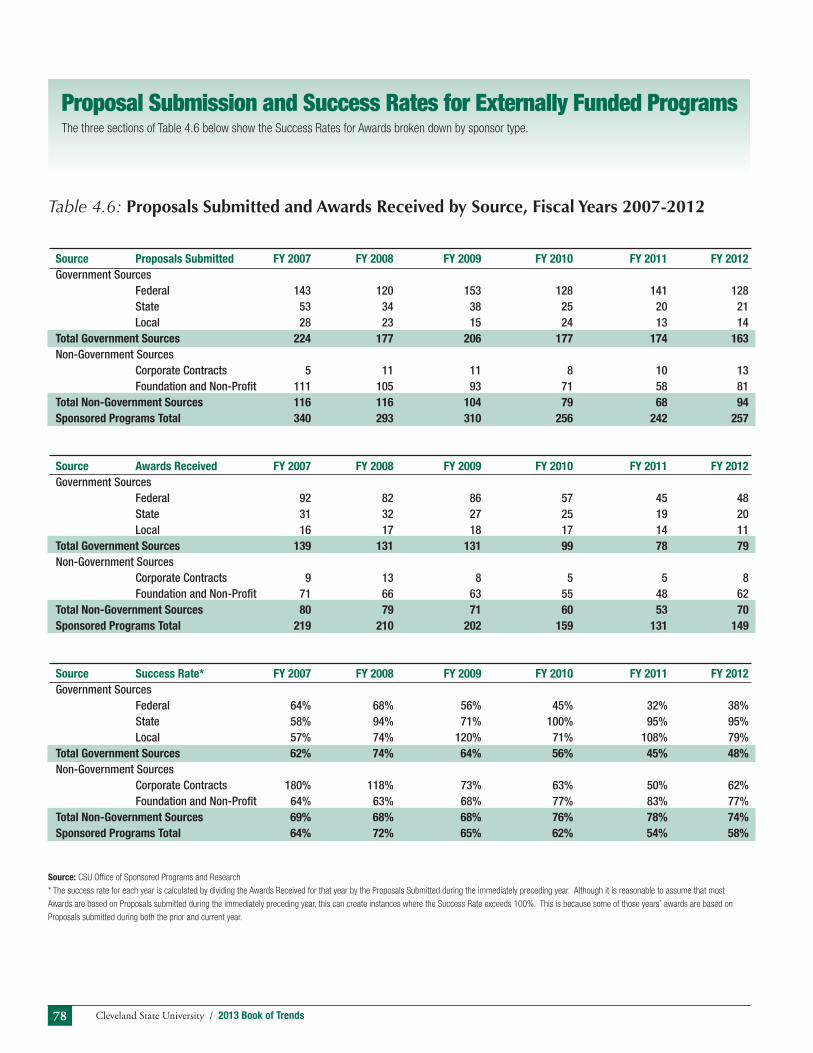
Cleveland State University / 2013 Book of Trends78
Proposal Submission and Success Rates for Externally Funded ProgramsThe three sections of Table 4.6 below show the Success Rates for Awards broken down by sponsor type.
Table 4.6: Proposals Submitted and Awards Received by Source, Fiscal Years 2007-2012
Source Proposals Submitted FY 2007 FY 2008 FY 2009 FY 2010 FY 2011 FY 2012Government Sources Federal 143 120 153 128 141 128 State 53 34 38 25 20 21 Local 28 23 15 24 13 14Total Government Sources 224 177 206 177 174 163Non-Government Sources Corporate Contracts 5 11 11 8 10 13 Foundation and Non-Profit 111 105 93 71 58 81Total Non-Government Sources 116 116 104 79 68 94Sponsored Programs Total 340 293 310 256 242 257
Source Awards Received FY 2007 FY 2008 FY 2009 FY 2010 FY 2011 FY 2012Government Sources Federal 92 82 86 57 45 48 State 31 32 27 25 19 20 Local 16 17 18 17 14 11Total Government Sources 139 131 131 99 78 79Non-Government Sources Corporate Contracts 9 13 8 5 5 8 Foundation and Non-Profit 71 66 63 55 48 62Total Non-Government Sources 80 79 71 60 53 70Sponsored Programs Total 219 210 202 159 131 149
Source Success Rate* FY 2007 FY 2008 FY 2009 FY 2010 FY 2011 FY 2012Government Sources Federal 64% 68% 56% 45% 32% 38% State 58% 94% 71% 100% 95% 95% Local 57% 74% 120% 71% 108% 79%Total Government Sources 62% 74% 64% 56% 45% 48%Non-Government Sources Corporate Contracts 180% 118% 73% 63% 50% 62% Foundation and Non-Profit 64% 63% 68% 77% 83% 77%Total Non-Government Sources 69% 68% 68% 76% 78% 74%Sponsored Programs Total 64% 72% 65% 62% 54% 58%
Source: CSU Office of Sponsored Programs and Research
* The success rate for each year is calculated by dividing the Awards Received for that year by the Proposals Submitted during the immediately preceding year. Although it is reasonable to assume that most
Awards are based on Proposals submitted during the immediately preceding year, this can create instances where the Success Rate exceeds 100%. This is because some of those years’ awards are based on
Proposals submitted during both the prior and current year.

79Section 4 - Sponsored Programs and Research
Sec
tio
n
4
Table 4.7: Proposals Submitted and Awards Received by College or Division, Fiscal Years 2007-2012
Table 4.7a: Fiscal Year 2012 Proposals Submitted by College
Fiscal Year
Proposals and Grant Awards FY 2007 FY 2008 FY 2009 FY 2010 FY 2011 FY 2012
Proposals Submitted 340 293 310 256 242 257Awards Received 219 210 202 159 131 149Success Rate 64% 72% 65% 62% 54% 58%
Source: CSU Office of Sponsored Programs and ResearchNote: The Success Rate for each year is calculated by dividing the Awards Received for that year by the Proposals Submitted during the immediately preceding year.
College or Division Direct Indirect Total Count
College of Business Administration $1,251,992 $239,443 $1,491,435 8College of Education & Human Services $4,630,088 $262,309 $4,892,397 20College of Engineering $17,320,178 $4,372,631 $21,692,809 58College of Law $5,000 $0 $5,000 1College of Liberal Arts & Social Sciences $3,038,504 $910,228 $3,948,732 35School of Nursing $7,810,370 $2,839,009 $10,649,379 4College of Sciences & Health Professions $18,543,074 $4,576,306 $23,119,380 58College of Urban Affairs $2,440,677 $500,459 $2,941,136 61Central Administration $4,374,155 $288,205 $4,662,360 12Continuing Education $0 $0 $0 0Undergraduate Studies $0 $0 $0 0Fiscal Year 2012 Totals $59,414,038 $13,988,590 $73,402,628 257

Cleveland State University / 2013 Book of Trends80
College or Division Direct Indirect Total Count
College of Business Administration $259,750 $0 $259,750 9College of Education & Human Services $1,784,051 $144,478 $1,928,529 9College of Engineering $831,800 $165,845 $997,645 21College of Law $5,000 $0 $5,000 1College of Liberal Arts & Social Sciences $536,224 $101,044 $637,268 25School of Nursing $121,262 $0 $121,262 4College of Sciences & Health Professions $3,538,840 $754,999 $4,293,839 22College of Urban Affairs $2,629,283 $467,856 $3,097,139 51Central Administration $2,141,042 $2,273 $2,143,315 7Continuing Education $0 $0 $0 0Undergraduate Studies $0 $0 $0 0Fiscal Year 2012 Totals $11,847,252 $1,636,495 $13,483,747 149
Table 4.7b: Fiscal Year 2012 Awards Received by College
Figure 4.7: Proposal Submissions and Grant Awards, Fiscal Years 2007-2012
Notes: The amounts above do not include State Appropriations. Due to the manner in which the State Appropriation line-item is included in Table 4.2, it is not possible
to determine which College or Division received those funds.
0
50
100
150
200
250
300
350
400
FY 2007 FY 2008 FY 2009 FY 2010 FY 2011 FY 2012
Cou
nt o
f Pro
posa
ls &
Aw
ards
Proposals Submitted Awards Received

81Section 4 - Sponsored Programs and Research
Sec
tio
n
4
Intellectual PropertyContemporary universities committed to teaching, research, service, and dissemination of knowledge increasingly find themselves in a position of having created knowledge or materials with commercial value. Creation of such knowledge or materials, also referred to as intellectual property, is a much coveted outcome of any vibrant research program. Activities that result in the creation of intellectual property raise the reputation of the university and involved researchers. They also create rich educational opportunities for students participating in such programs. Universities may gain significant revenue through commercialized trademarks.
FISCAL YEAR Percent Change
Source FY 2007 FY 2008 FY 2009 FY 2010 FY 2011 FY 2012 1 Year 5 Year
Disclosures 9 8 6 6 7 3 -57% -67%
Non-Provisional Patent Apps. Filed 2 6 4 4 3 6 100% 200%
Provisional Patent Applications Filed 3 5 3 6 3 1 -67% -67%
Licenses Approved - 1 - - - 1 - -
Source: Technology Transfer Office
5 Year Percent Change is from the period 2007 to 2012.
Notes: The following definitions are from the US Patent and Trademark Office (www.uspto.gov)
Disclosure: Description of an invention in a patent or patent application.
Patent: Granting of a property right to the inventor, issued by the United States Patent and Trademark Office.
Licenses approved: The patent law provides for the transfer or sale of a patent, or of an application for a patent, by an instrument in writing. Such an instrument is referred to as an assignment of license.
Table 4.8: Intellectual Property: Patents and Disclosures, Fiscal Years 2007-2012
Percent Change
Source 2008 2009 2010 2011 2012 1 Year 5 Year
Business $45,680 $33,589 $9,988 $1,375 $0 -100% -100%Education $180,097 $86,525 $57,217 $137,717 $174,568 27% -3%Engineering $155,368 $225,026 $274,368 $270,646 $175,893 -35% 13%Liberal Arts/Social Science $21,485 $12,480 $7,907 $0 $6,300 - -71%Science $334,319 $453,564 $469,847 $472,280 $293,496 -38% -12%Urban Affairs $201,865 $79,401 $49,586 $77,475 $48,786 -37% -76%
Total $938,814 $890,585 $868,913 $959,493 $699,044 -27% -26%
Source: CSU Controller’s Office
Table 4.9: Cleveland State University Graduate Student Support from Externally Funded Research, Fiscal Years 2008-2012

Cleveland State University / 2013 Book of Trends82
Growth in Graduate EducationGraduate education at Cleveland State has seen unprecedented growth in recent years, from 3,000 students in the 1980’s, to 4,000 in the 1990’s, to approximately 5,000 students pursuing graduate and post-graduate programs at the University. Such growth in graduate programs has implications for strengthening the quality of these offerings and seizing opportunities for supporting educational goals of students by creating new and tailored program offerings. Growth in graduate programs at CSU points to numerous research opportunities for future students and faculty researchers. Institutional investments in graduate education are closely linked with strategies for promoting sponsored research, which lead to an increased opportunity for the contributions of graduate, doctoral and post-doctoral students.
Institution 2008 2009 2010 2011 2012 Grad SCH
University of Akron 10% 10% 10% 10% 10% 31,367Bowling Green State University 11% 11% 10% 8% 8% 18,119University of Cincinnati 20% 20% 20% 21% 20% 78,820Cleveland State University 21% 21% 20% 20% 19% 35,994Central State University 1%† 1% 1% 1% 1% 170Kent State University 14%† 14%† 13%† 13% 13% 46,994Medical University of Ohio NA NA NA NA NA NAMiami University 6% 6% 8% 7% 7% 18,522Ohio State University 14%† 14% 14% 14% 13% 91,641Ohio University 12%† 12%† 12% 12% 11% 38,677Shawnee State University 1% 2% 2%† 2% 2% 994University of Toledo 10%† 10% 10% 10% 11% 29,526Wright State University 13%† 14%† 13% 12% 12% 22,859Youngstown State University 5% 5% 4% 5% 5% 82,642
Total 13% 13% 12% 12% 12% 422,125
Note: Graduate students include the following ranks: DS (Doctoral), MS (Master’s), ND, NM and NG (non degree-seeking graduate students).Source: TThe Ohio Board of Regents HEI Course Enrollment (CN) query. Run Date: October 7, 2013† Indicates institutions that had not finalized enrollment data by query date.
Table 4.10: Percentage of Total Student Credit Hours Taken by Graduate Level Students at Selected Ohio 4-Year Institutions-Main Campuses Only, Fall Terms 2008-2012
Highlights
n Table 4.10 From 2008 to 2012 Cleveland State University has continued to hold steady in the percentage of total student credit hours taken by graduate students. At 19%, Cleveland State University’s percentage of total student credits remains among the highest of Ohio’s 4-year institutions.

83Section 4 - Sponsored Programs and Research
Sec
tio
n
4
College Department Project Description
Table 4.11: Selected Research & Grant Highlights by College
Business
Education and Human Services
Outreach and Business Center
Counseling, Administration and Adult Learning
Curriculum and Foundations
Greater Cleveland Educational Development Center
Small Business Development Center (SBDC): The College received $70,000 from the State of Ohio to run the Small Business Development Center. The Cleveland State University (CSU) SBDC is funded by the Ohio Department of Development (ODOD) and the Small Business Administration (SBA). The CSU SBDC serves Cuyahoga County. The CSU SBDC provides high quality business and economic development assistance to small businesses and nascent entrepreneurs in order to promote growth, expansion, innovation, increased productivity and management improvement. In addition, the SBA, SBDC, City of Cleveland Heights and the Cleveland Heights Library provided $70,000 to set up a new SBDC office and hire a P/T SBDC counselor.
Small Business Jobs Act: The college received $69,389 from the State of Ohio for the Small Business Jobs Act. The CSU SBDC is the recipient of additional funding made available through the Small Business Jobs Act to extend the Small Business Administration’s (SBA) Recovery Loans for small business owners. These funds expand the current small business assistance services offered through the CSU SBDC at Shaker LaunchHouse.
International Trade Assistance Center (ITAC): The College received $125,000 from the State of Ohio to run the International Trade Assistance Center for Region 8 and Region 5. International trade specialists provide export assistance and focus new-to-export businesses and exporters on expanding overseas markets. They promote business development through international market opportunities, increase small business export transactions, export sales, and support future competitiveness.
Center for Educational Leadership: Evolved from the nationally recognized First Ring Leadership Academy, the Center for Educational Leadership partners with urban school districts to offer professional development for principals and academic programs to develop and sustain inspired leaders for today’s schools. Most notably is the Inspired Leaders Principal Licensure Program, which is launching its fifth cohort. Also offered are the Master of Education in Organizational Leadership, the Empowered Leaders Teacher Endorsement Program and the Education Policy Fellowship Program.
Career Passport Program currently called Making My Future Work: A three year $1,000,000 USDE, Institute of Education Sciences grant. It continues to develop, refine, implement and evaluate a college and career readiness program for use in urban secondary schools as an intervention to prevent school dropouts. A state-of-the art, user friendly curriculum manual consisting of 100 lessons and four modules has been created by key personnel, public high school teachers, graduate assistants and a graphics design consultant. A training and orientation video to accompany the manual is being developed in collaboration with the Center for Educational Technology. During the FY12-13 school year the program was delivered in seven different high schools.
Gifted Education Enters Cyberspace: The graduate program in Gifted Education is offering all six required courses online, extending outreach to meet teachers’ needs in serving gifted, talented, and advanced learners in schools across the country.
The Center for Urban Education: Carries out part of its mission by assisting faculty at CSU and external partners in P-20 education with the identification, development and/or submission of grant proposals including the execution and management of grants at post-award. During the second fiscal year of operation the Center helped obtain and/or serve on 10 grants which total to $4,461,472 in aggregate funding. The Center is awaiting official award notification for an 11th grant which was recommended for funding by NSF.
The Cleveland Schools Book Fund: The program is designed to supply all Pre-K through Grade 3 classrooms in the Cleveland Municipal School District with libraries of children’s literature as well as provide teacher professional development to increase young students’ interest in and ability to read, comprehend and enjoy.
The Stocker Foundation, Reading Adventure!: The grant targets students in two low-performing Cleveland schools, provides each student with 20 books, both non-fiction and fiction, and imparts parental instructions to develop literacy within their homes and provide enrichment of the English Language Arts common core standards.

Cleveland State University / 2013 Book of Trends84
First Ring Leadership Academy: Coordinates the design and delivery of a year long training program promoting transformational leadership in the teachers and administrators working in the Cleveland Municipal School District and the thirteen inner ring school districts bordering Cleveland.
Project Reach: A major five year grant to improve Cleveland State University’s ability to prepare all teachers to provide effective instruction for Limited English Proficient students, professional development for content area teachers to improve academic achievement of Limited English Proficient students, and to become a region that provides strong support in both language acquisition and content learning for all classrooms that serve Limited English Proficient students.
Highly Qualified Teachers Program: A five year U.S. Department of Education grant to enhance the Special Education Programs. The emphasis is on graduating candidates who meet the highly qualified teacher guidelines under the No Child Left Behind and Individuals with Disabilities Education Act legislation.
CSUTeach: With the support of the NSF Noyce Scholars Program and Cleveland State’s partners (National Math and Science Initiative, UTeach Institute, Ohio STEM Learning Network, and the Cleveland Metropolitan School District) Cleveland State is bringing the UTeach model to Ohio transforming the teacher education experience for pre-service teachers to be licensed to teach grades 7-12, with an emphasis on preparing for underserved, urban classrooms. The program provides project-based instruction and inquiry design in mathematics and science classrooms. Students participate in internships with local schools and non-profit organizations. Scholarship funds are available to eligible STEM students. Noyce Scholars will be eligible to become licensed STEM teachers.
Choose Ohio First: This scholarship program which provides renewable scholarships of up to $4,700 per year is designed to attract and graduate qualified STEMM Education students. Scholarship recipients are required to tutor in an academic environment to support classroom education. As part of the Ohio Innovation Partnership and funded through the Ohio Board of Regents, the scholarships are designed to significantly strengthen Ohio’s competitiveness in science, technology, engineering, mathematics and medicine (STEMM) and STEM education.
The Masters of Urban Secondary Teaching (MUST) STEM Fellows Program: The program awards full tuition scholarships to eligible students pursuing licensure in math or science and will also fund up to 8 hours of undergraduate credit for students who need to complete pre or co-requisites for the MUST program.
Careers in Health and Medical Professions (CHAMPS): An ongoing year round program developed to recruit minorities into high skill level health care careers by increasing awareness and knowledge. The program provides two or more years of intensive academic enrichment by engaging high school students in skill enhancement, in-depth medical career experiences and thought-provoking science activities while helping them develop into a unified, cohesive cohort.
The Campus International School (CIS): Conceived as a professional development school with the Cleveland Metropolitan School District (CMSD), Campus International School is a public school currently offering instruction in Kindergarten through 5th grade to an economically and socially diverse population of students. The aim of the school is to develop well-rounded, knowledgeable, internationally minded students who recognize their common humanity and shared guardianship of the planet. In all areas of the school, the teachers and staff model the learners’ profiles to help teachers and students establish goals, plan units of inquiry, and assess performance. CIS teachers collaborate within and across grade levels to ensure that each student’s instructional needs are met. Professional development is institutionalized with two hours of professional development each week with varied topics based on need. Cleveland State provides a Professor-in-Residence to the school staff and serves as an intermediary between the school and university. Interactions with the university include student field experiences, speech, hearing, psychology and occupational therapy assessments, regular after-school physical science experiences, daily Mandarin language and cultural instruction, facilities for physical education classes, administrative support and grant funding to support school instruction.
Teacher Education
College Department Project Description

85Section 4 - Sponsored Programs and Research
Sec
tio
n
4Engineering
Health and Human Performance
Chemical and Biomedical Engineering
College Department Project Description
Differentiating Instruction at the Campus International School: Supported by the Martha Holden Jennings Foundation the project was developed by an observation that some of the CIS teachers were tracking students by dividing them into static ability groups rather than differentiating instruction by developing multilevel activities that provide opportunities for all children to participate and achieve. The CSU project team introduced and/or extended their knowledge of and ability to implement specific ways to differentiate instruction. The project consisted of numerous phases during school year and included two levels of evaluation: a formative evaluation and an external evaluation. The resulting summary and recommendations were ways Differentiated Instruction can be sustained at the Campus International School and transferred to other CMSD schools. The teachers assessed their students’ learning and the faculty members and external evaluator assessed teacher learning. The Community Learning Center: Formerly the Educational Services Center, the Community Learning Center for Children and Youth (CLC) provides an engaged-learning experience for students at Cleveland State while serving the community by offering free assessment and tutoring programs for children at the elementary and middle-school grade levels who have difficulties with reading, math, or learning in general. The children’s positive learning experiences with the CLC have been recognized both by their families at home and their teachers at school. Under the supervision of the Department of Teacher Education, the CLC has grown from supporting two classes serving thirty children from the community to nine serving 180 children from the community. Continuously expanding, the CLC now offers a program for children learning English as a second or foreign language for university students pursuing a degree or endorsement in TESOL (Teaching English to Speakers of Other Languages). As an integral part of the teacher-education program, the CLC allows for both undergraduate and graduate students to engage in real-life experiences assessing and teaching children from diverse backgrounds. Through interactions with the children at the CLC, faculty provides supervised opportunities in their courses for university students pursuing licenses and/or degrees in education to explore the links between research, theory, and practice. Additionally, the CLC hosts a range of educational resources, including assessment and curriculum materials and assistive technology devices, for faculty to demonstrate in classes and for students to examine and use.
Workplace Health Programs: Working in collaboration with CSU’s VikeHealth program, Departmental faculty in Health and Exercise Physiology oversee the Fitness for Life employee fitness program and offer a multitude of health promotion and fitness programs for the Journey to Wellness program for CSU employees.
Human Performance Laboratory: The Human Performance Laboratory is a state of the art facility designed for teaching and research. Currently the laboratory is working on several projects with Orbital Research Inc., including a pilot physiological assessment system aimed to monitor hypoxia (lack of oxygen) in the Air Force’s F-22 Raptor pilots. The lab is equipped to simulate flight physiology of pilots up to 25,000 feet altitude and is testing Orbital’s sensors to predict hypoxia before the pilots become impaired and unable to fly. Another Orbital Research project is the development and testing of a microsystem to sense and control warfighter physiology, in particular Special Forces in extreme military dive operations. During this research, the lab will test sensors developed by Orbital that can monitor and deliver proper breathing gas mixtures during rapid descent from altitude. Currently several graduate students are conducting research involving devices to enhance recovery in athletes, prevent hyperthermia, and to correlate power with speed and agility. The lab will be expanding into new areas for subcellular research.
Material World Network: Synthesis and Characterization of Functional Molecular Building Blocks for Responsive Materials: This NSF project has aimed at developing environmentally responsive materials that can generate larger responses with shorter response times than current materials.
Optical Instrumentation, Non-Destructive Evaluation (NDE), High Temperature Materials and Structures and Numerical Modeling for Advanced Aerospace Application: This NASA project has been carried out via four sub-tasks: propulsion health monitoring system development and instrumentation; integration of NDE and finite element modeling and image visualization; development of acoustics, tomography, and radiography sciences and facilities in operations; and planar optical diagnostics for flow field measurements and optical build up.
Effect of Convection on Dendritic Array Morphology During Directional Solidification: This NASA project has involved experiments on the International Space Station to understand the role that convection plays in determining the dendritic array morphology and homogeneity.

Cleveland State University / 2013 Book of Trends86
Civil and Environmental Engineering
Electrical and Computer Engineering
College Department Project Description
Stem Cell Therapy Strategies for Prevention and Treatment of Pelvic Organ Prolapse: This graduate research fellowship grant funded by NSF is investigating the potential for Mesenchymal Stem Cell therapy in the treatment and prevention of pelvic organ prolapse and urinary incontinence.
Effect of Varying Convection on Dendrite Morphology and Macrosegregation: This project aims to: (a) study directional solidification of Al-Cu alloys that are compatible with the Space Station facilities; (b) conduct experiments involving solidification through cross-section decrease and through cross-section increase; and (c) examine array morphology changes and macrosegregation associated with DS through cross-section changes.
Characterizing and Benchmarking Zeolite Absorbents for Oxygen Concentrators: This project in collaboration with Invacare corporation aims at improving oxygen concentrators for persons who need oxygen therapy. The heart of these devices is a “molecular sieve bed” which concentrates oxygen from ambient air at 21% to about 98%. CSU’s research expertise in gas separation and storage by adsorption and in modeling chemical processes will perfect the next generation portable oxygen concentrators with higher efficiency.
An Integrated Framework for Creation and Assessment of Sustainable Construction Processes: This NSF project has aimed toward reducing the carbon footprint of construction. The research has involved developing metrics, strategies, and case studies for sustainable development.
Implementation and Assessment of Failure Case Studies in the Engineering Curriculum: This NSF project has aimed at developing a series of failure case study workshops for faculty at many locations in the United States and abroad.
Uncontrolled Concrete Bridge Parapet Cracking: There appears to be wide-spread premature cracking of bridge concrete parapets on relatively recently constructed bridge decks. Cracked parapets are a safety concern and the potential cost to remove and replace parapets could be significant. This ODOT project aims at determining the reasons for uncontrolled bridge deck parapet cracking, and to provide recommendations to ODOT to prevent such cracking in the future.
University Transportation Center for Work Zone Safety and Efficiency: The goal of this USDOT project has been to better understand driving behaviors and motivations, and establish work zone traffic control best practices and design protocols to save lives.
Evaluation of Traffic Flow Analysis and Road User Tools Applied to Work Zones: When a construction or maintenance project on an ODOT interstate or freeway violates the Permitted Lane Closure Schedule, a queue analysis must be completed. The objective of this ODOT project is to establish a reliable, user-friendly procedure for analyzing work zone queuing and calculating road user costs that is reflective of current traffic conditions and technologies.
Evaluation of Ohio Work Zone Speed Zones Process: In April 2011, the ODOT published a new process for the use and determination of speed zones in an effort to enhance the safety of the traveling public and workers while providing efficient flow of traffic through work zones. The objectives of this research are to determine the effectiveness of the new ODOT process for establishing work zone speed zones as compared to the previous ODOT process and previous NCHRP recommendations and recommend improvements to ensure the safe and efficient flow of traffic in work zones.
Mobility & Security Support in Disadvantaged Cyber-Physical Systems: This project has been modeling mobility of ground as well as aerial units, such as unmanned aerial vehicles, and proposing mobility support mechanisms and algorithms, and security measures implemented at the physical level of communication protocol as an effective anti-jamming method.
Biogeography-Based Optimization: This NSF project has aimed at developing new nature-inspired methods for the optimization of engineering systems with applications to power distribution, robot control, and cardiac disease diagnosis.
Rapid Rehabilitation and Return to Function for Amputee Soldiers: This ODOD project has investigated a new design for a hydraulic prosthetic knee for transfemoral amputees, and also aimed to derive control signals for the prosthesis.
Automotive Engine Time-to-Torque Optimization: Automobile manufacturers are interested in finding engine controls to take automotive engines from a given initial torque to a desired final torque. This project is using computer intelligence-based methods to solve this problem. This has resulted in an improved time-to-torque by over 75% from the best previously-obtained solution.

87Section 4 - Sponsored Programs and Research
Sec
tio
n
4
Liberal Arts and Social Sciences
Mechanical Engineering
College Department Project Description
Improving the Productivity of the Sensor Network Programmer: This NSF project has investigated ways to make construction and maintenance of sensor network systems accessible to “non-programmer specialists”, outside the field of computing, who are the real end users of sensor networks.
Stabilization of Immobilized Enzymes for Implantable Glucose Monitoring Devices: An obstacle for the development of implantable glucose biosensors is the instability of the enzyme immobilized on the electrodes of the sensors as the sensing element. This project funded by the American Diabetes Association has aimed to overcome this problem using a spatial confinement approach.
US-Egypt Cooperative Research: Ultrasmall Silicon Nanoparticle Technology for Renewable Energy Applications: This NSF project aims to substantially advance renewable energy technology. The prototype devices to be built are expected to show enhanced performance in terms of energy harvest efficiency and energy storage capacities.
A Nationwide Consortium of Universities to Revitalize Electric Power Engineering Education by State-Of-The-Art Laboratories: This research project, funded by USDOE, aims at developing state-of-the-art test benches in the field of power for both research and teaching purposes.
EAGER: Towards Next Generation Anonymous Communication Networks: The main objective of this NSF project is to study new architectures for anonymous communications in order to defeat privacy attacks, both passive and active privacy attacks.
Non-Destructive Evaluation and Structural Health Monitoring of Advanced Composite Materials and Propulsion Systems: The goal of this NASA project is the development and application of nondestructive evaluation techniques for advanced aerospace materials and components. The techniques should distinguish and quantify the types and extent of material manufacturing defects and mission exposure damage.
Robust Model-Based Fault Diagnosis for Propulsion System Components with Uncertainties: This NASA project focuses on the identification of structural faults for propulsion components or entire system described by the model which can be uncertain. The model-based identification is based on derived transfer functions, generated from an analytical model or directly measured. To identify the structural damage, the robust control tools are applied to extract the missing component/system dynamics due to localized damage. Results of this research can find direct applications in structural health monitoring of aircraft engines or other propulsion systems.
US-Germany collaboration: Achieving breakthroughs in the mechanics of high-temperature ceramic coatings with novel thermal-gradient mechanical fatigue studies: This work aims to enable breakthroughs in the understanding of degradation and failure mechanisms in high temperature ceramic coatings. Synchrotron X-ray diffraction (XRD) and piezospectroscopic (PS) techniques are used for high resolution measurements to quantify the in situ evolution of strain in these coatings under thermal gradient-mechanical fatigue conditions. These measurements are matched with numerical simulations. This is a collaborative effort between Cleveland State University, University of Central Florida and the German Aerospace Center.
Hot Extrusion of Ultraconductive Nanocomposite Copper: The project seeks to extend the ultra conductivity results achieved in our patented (US Patent 8,347,944) work from the millimeter scale to longer ultra conductive wire on the meter-Kilometer scale. The project also aims to perfect the manufacturing process that will be used to mass produce the ultra conductive copper wire.
Experimental and Computational Investigation of Unsteady Endwall and Tip Gap Flows in Gas Turbine: This NASA – US Naval Academy project aims at better understanding complex flows in the endwall regions of gas turbine passages under a variety of tip gaps or endwall treatments. Computational unsteady 3D studies will be performed and validated by experimental studies.
In AY 2012-2013 CLASS faculty published or sent to the press a total of 12 books, including seven academic press research monographs or collections and five new textbooks. Departments represented include Art (2), Communication (2), English (1), History (3), Modern Languages (1), Music (2), and Sociology (1). CLASS faculty also published 76 scholarly journal articles and gave over one hundred conference presentations. CLASS faculty from the Arts departments (Music, Art, and Theatre/Dance) gave 78 creative performances (in music or drama) and made 80 creative productions (music, art work, and new drama), variously presented in local, national or international venues. New research grants included one in Political Science from the US Agency for International Development. The Criminology Research Center filed its final report to the Cuyahoga County Prosecutor’s Office on “Discretion in Police Decision-Making.” This year Sociology also contributed to the conceptualization for a significant university patent application for new digital device software.

Cleveland State University / 2013 Book of Trends88
Preventing Diabetes Using the Stanford Chronic Disease Self-Management (CDSM) Model: Funding from the Ohio Commission on Minority Health allowed the School of Nursing to address the prevention of type 2 diabetes and obesity through the Stanford University Chronic Disease Diabetes Self-Management (CDDSM) program. The health promotion and disease prevention focused program was provided to intergenerational and diverse groups in the community. For those with chronic illness, CDSM has been shown to improve health, and better manage symptoms, while reducing distress and cost.
Ohio Department of Job & Family Services/Ohio Medicaid Technical Assistance & Policy Program (MedTAPP) Healthcare Access Initiative: Working with project partners (the CSU School of Social Work, Sisters of Charity Foundation, St. Vincent Charity Medical Center, CareSource, Care Alliance, The MetroHealth System, University Hospitals, and the Cleveland Metropolitan School District), this project trained 50 mentors and 50 mentees from the Schools of Nursing and Social Work (both undergraduate and graduate students) through a newly designed mentor training project. The objectives include increasing the health care practitioners working with Medicaid patients; facilitating interdisciplinary collaboration; and fostering readiness and knowledge of entry-level health care practitioners to meet the needs of the Medicaid population.
Choose Ohio First Nursing Scholarship Initiative: Funding from the State of Ohio provided scholarship support and mentoring for a group of nursing students.
Nurse Faculty Loan Program (NFLP): Funding from HRSA enables CSU to offer forgivable loans to MSN and PhD Nursing candidates who plan to embark upon a career in Nursing education after graduation. Operation STEM. $875,000 NSF-funded initiative to help students who begin mathematics classes at the precalculus level complete their mathematics requirements to obtain a STEM degree.
University Scholars in STEM and Choose Ohio First Success in Math. $600,000 NSF and State of Ohio initiative for scholarships for students majoring in a STEM-related major.
Statistical Inferences from Topology of Complex Networks. $279,000 U.S. Air Force initiative for research at the interplay of mathematics and statistics in complex networks.
Lie Models, Mapping Theorems, C-Kahler Manifolds and Topological Complexity. $35,000 Simons Foundation initiative for collaborative research in mathematics.
Fluid flow is an environmental modifier of ADPKD. Study how the primary cilium senses the state of fluid flow to act as a complex signaling center (National Institutes of Health).
Synthesis, structure & swelling properties of a potential drug delivery system: polysaccharide microgel nanoparticles. Development of non-carcinogenic, stable, reusable microgel nanoparticle that is sensitive to environmental stimuli and can serve as a reservoir for controlled drug delivery and release (Research Corporation).
Implementation and operation of a field emission scanning electron microscope (FE SEM) facility. Funded by a Major Instrumentation Grant (National Science Foundation).
Nonlinear Analysis of ECG Time Series of Patients with Epilepsy and Pseudoseizures. Collaboration with Epilepsy Center, Dept of Neurology, CCF to use the mathematical theory of coupled phase oscillators [Kuramoto model] to characterize heart-rate variability of patients and physiological processes controlled by the autonomous nervous systems on times scales 10 s or longer.
Equation of state from the Potts-percolation model of a solid. Published collaboration in premier journal (Physical Review) with Professor H. T. Diep of the Institute of Advanced Studies of the University of Cergy-Pontoise, France.
Multi-User Biosensor Integrated Platform. $15,000; State of Ohio 3rd Frontier Program (via Cleveland Clinic). The project aims at the creation of a multi-user center (consortium) for the development of biosensor devices based on microfluidics that allow for rapid electrokinetic separation and detection of clinically important cellular biomarkers and for in vivo analysis of bacterial cells. State-of-the-art equipment will allow for designing, prototyping, and fabrication of needed devices in a one-stop within the multi-user center.
School of Nursing
Sciences and Health Professions
Nursing
Mathematics
Physics
Chemistry
College Department Project Description

89Section 4 - Sponsored Programs and Research
Sec
tio
n
4
BGES
Psychology
College Department Project Description
Novel Biophotonic Probes to Monitor Cellular Metabolism of Nucleosides. $82,649; National Science Foundation (via Case Western Reserve University). This project uses metal-containing nucleosides as spectroscopic probes to further define the mechanism of how nucleosides enter cells. These non-invasive probes can be used to measure the activity of membrane proteins involved in the uptake of natural nucleosides.
Development of LC-MS/MS Method for Determination of NGP-01 Biological Samples. $5,526; NEOMED. Aberrant calcium levels are thought to play a large role in the pathogenesis of neurodegenerative diseases such as Parkinson’s, Alzheimer’s, and Huntington’s diseases. In the present work, a quantitative HPLC/mass spectrometry method has been developed for a candidate neuroprotective drug, NGP1-01, a heterocyclic cage compound with multifunctional calcium channel blocking activity, to determine its pharmacokinetics in blood, brain and retina in a mouse model.
OBOR Scholarship Programs of Innovation. $75,000; Ohio Board of Regents. This “Choose Ohio First” type of grant from the Ohio Board of Regents is meant to provide tuition assistance to pre-medical students.
Drug Development of Orally Active Anti-Trypanosomiasis Agents. $436,500; National Institutes of Health. African trypanosomiasis, also known as sleeping sickness, threatens over 60 million people in 36 countries of sub-Saharan Africa. There are no effective vaccines and satisfactory drugs for its treatment. Dr. Su and biologist Dr. Bibo Li will work together to develop new, small molecule drugs to treat this neglected disease.
Investigating Promoter Interactions with Various RNA Polymerases. $5,079; NSF (via Case Western Reserve University)This project employs biophysical and biochemical techniques to understand the role of specific proteins involved in the initiation of RNA transcription in bacteria. Site-directed mutagenesis is also used to probe the role of specific amino acids with DNA substrates.
Targeting Tyrosine Phosphatase SHP2 (PTPN11) for the Treatment of Pediatric Leukemias. $108,610; National Institutes of Health (via CWRU). Ptpn11 (Shp2) which is a Src homology 2 (SH2) domain containing protein tyrosine phosphatase (PTP) and implicated in multiple intracellular signaling processes, has emerged as a critical regulator of embryonic development and hematopoiesis. In this proposal, our specific aims include: 1) to validate the efficacy and specificity of the Shp2 inhibitors through the use of the Ptpn11 E76K animal disease model; 2) to test the efficacy of the Shp2 inhibitors using human JMML bone marrow cells; and 3) to optimize Shp2 inhibitors to increase the potency and specificity.
Structure of nascent peptides and kinetic control of co-translational folding on the ribosome. A three year, interdisciplinary research program involving researchers from Max Planck Institute of Biophysical Chemistry (Goettingen, Germany) and Johann Wolfgang Goethe University (Frankfurt, Germany) and led by CSU that aims to understand the key mechanisms of the protein synthesis and folding in the cell (Human Frontiers Science Program).
Stalking the wild Tetrahymena. Publication in Molecular Ecology received commentary on the fundamental importance of population data to understanding the origin and diversification of microbial lineages.
Hemophilia B. A comparative study of nonsynonymous and synonymous mutations causing hemophilia B. (American Heart Association).
Circadian clock and dietary restriction. The role of an internal time keeping system, known as the circadian clock, in the regulation of longevity and age-associated pathology (National Institute on Aging).
Strength-Based Intervention for Dyads with Mild Dementia. Examination of intervention with caretakers and patients with dementia (National Institute on Aging).
Examining Direct Service Worker Turnover in Ohio. Study of factors predicting turnover of individuals providing direct care to the elderly and individuals with disabilities (Centers for Medicare and Medicaid).
Understanding PTSD in Pregnant Women. An exploration of the impact of stress on mothers and newborns (Faculty Research Development Award).

Cleveland State University / 2013 Book of Trends90
Factors Influencing School Psychologist Engagement in Preventive Services. Demographic, professional, and workplace features associated with service provision in K-12 schools (Ohio School Psychologists Association).
Spatial Navigation by Patients with Parkinson’s Disease. Neuroscience of impaired and preserved spatial navigation abilities (Faculty Research Development Award).
Project SHAKTI. Stigma Reduction and Transgender Issues. Study of health care provider awareness and knowledge of transgender issues in India (National Institutes of Health).
Assessment of Mood and Cognitive Functioning in Older Adults. Examination of functioning in older adults with bipolar and unipolar depression who are undergoing electroconvulsive therapy (Morley Foundation).
Holistic Aspects of Word Perception. Cognitive processes in perceiving words during act of reading (Engaged Learning Award).
Motor System Markers of Depression Severity. Neuroscience of impairments associated with clinical depression (Engaged Learning Award).
Innovations in Integrated OT Services [Every Moment Counts: Promoting Children’s Mental Health Throughout the Day]. A three-year $600,000 grant was renewed for Year 2 by the Ohio Department of Education to promote the inclusion of children with disabilities in all school activities and environments and to change the culture in schools throughout Ohio to promote children’s mental health. A number of positive outcomes were reported by principals, teachers, parents, children, and occupational therapists for Year 1.
Education Core for NIMHD P60 grant. A five-year $600,000 grant to engage institutions in the community to reduce health disparities in Cleveland.
Culture in Clinical Care: Strategies for Competence, 2nd ed. This text is used to introduce students in healthcare fields to the cultural dimensions of health, beliefs about health, and health practices.
Preventing occupational dysfunction secondary to aging. Chapter published in Occupational Therapy for Physical Dysfunction, 7th ed. Provides a health promotion perspective on keeping aging adults active, productive, and healthy.
The relationship between occupational engagement and wellbeing from the perspective of university students with disabilities. Published in the Journal of Occupational Science, this study describes the experience of students with disabilities as they attempt to navigate curricular and extracurricular university life.
Potent anti-inflammatory activity of sesquiterpene lactones from Neurolaena lobata (L.) R. Br. ex Cass., a Q’eqchi’ Maya traditional medicine. Published in Phytochemistry. The widespread use of the leaf of this plant among the Maya of the Caribbean led to a controlled study of its efficacy. The results provide a pharmacological and phytochemical basis for the traditional use of this leaf for inflammatory conditions.
Endogenous dynorphins, glutamate and N-Methyl-D-Asparate (NMDA) receptors may participate in a stress-mediated type-I auditory neural exacerbation of tinnitus. This study, published in Brain Research, sets the stage for determining the mechanisms in the nervous system in bringing about or exacerbating tinnitus. Center for Community Planning and DevelopmentFraming Paper and Roundtable on Suburban Poverty, U.S. Department of Health and Human Services (Westat). Draft report submitted to HHS in April 2013; roundtable discussion September 6, 2013 in Washington, DC.
This research frames the issue of suburban poverty using customized census data, existing research and interviews. It is the only research on suburban poverty that looks at all suburban places across the country, not just those in major metropolitan areas. It builds on our previous research looking at predominantly minority suburbs of older, large industrial cities, communities that once were thriving but are now severely distressed and have limited capacities to respond to increasing needs. Funded by the U.S. Department of Health and Human Services.
Maxine Goodman Levin College of Urban Affairs
School of Health Sciences
Urban Research & Public Policy
College Department Project Description

91Section 4 - Sponsored Programs and Research
Sec
tio
n
4
Center for Community Planning and Development & Center for Leadership DevelopmentSustainable Cities, Sustainable Communities (SC2) Fellowship program. December 2011 through 2014.
The Levin College received a $360,000 grant to be part of a national team with the German Marshall Fund and Virginia Tech to run the SC2 Fellowship Program. SC2 is a federal interagency pilot initiative that aims to strengthen neighborhoods, cities, and regions by enhancing the capacity of local governments to develop and implement economic visions and strategies. The fellowship program will place highly motivated, mid-career professionals in local government agencies in seven pilot cities for a two-year fellowship period. This project continues through 2014.
Center for Community Planning and DevelopmentRussell Township Land Use Guide Plan Survey - September 2012
The Center completed a land use guide plan survey for the Russell Township Trustees and Zoning Commission. The survey will be used to update the Township’s guide plan which will guide development for the next 20 years.
Center for Community Planning and DevelopmentRethinking the Future of Community Development - 2011-2013
The Center for Community Planning and Development received two grants, one from the George Gund Foundation and one from Key Bank Foundation to undertake a two-year study of the community development system in Cleveland and make recommendations for the future direction of community development corporations (CDCs). The study includes implementation strategies and will be used to inform the community development/planning curriculum of the Levin College. Center for Community Planning and DevelopmentEvaluation of the Cuyahoga County Foreclosure Prevention Program - September 2012
The Center for Community Planning and Development completed its seventh year evaluating the County’s innovative and effective foreclosure prevention program. The program helps Cuyahoga County families prevent foreclosure through counseling, mediation and financial assistance. As the cause of foreclosures shifted from predatory loans to unemployment and under-employment, the evaluation helped the County adjust the program to meet constantly changing needs, $40,000 for the 6-month period ending May 31, 2013. Center for Community Planning and Development and Center for Economic Development Evaluation of Living Cities Integration Initiative in Cleveland - 2010-2013
The Centers for Community Planning and Development and Economic Development have been working with The Cleveland Foundation since 2010 as the local evaluators for The Integration Initiative (TII). Cleveland is one of five cities that have received funding through this three-year initiative. The other cities are Detroit, MI; Baltimore, MD; Twin Cities, MN; and Newark, NJ. Each city has a local evaluator and all of the local evaluators work closely with a single national evaluator. The goal of the Cleveland TII is to harness the collective power of the anchor institutions, the city, and other key players in Greater University Circle to develop jobs, income and ownership opportunities for residents of the Greater University Circle neighborhoods. Center for Community Planning and Development - Community Planning Program Ongoing
This ongoing program provides training and technical assistance to local communities and is home to Best Local Land Use Practices, the local government outreach component of the Ohio Balanced Growth Program, a project of the Ohio Lake Erie Commission and the Ohio Water Resources Council.
Center for Nonprofit Policy & PracticeWelcome House Strategic Plan Update - July 2012
This project reviewed and assessed the 2008 Strategic progress toward benchmark measures and offers board of directors development strategies for further implementation of the updated plan, $10,000.
College Department Project Description

Cleveland State University / 2013 Book of Trends92
Center for Public ManagementFeasibility Study for Consolidation of 9-1-1 Dispatch Centers in Richland County, Ohio – December 2012
This report assessed the feasibility of consolidating the 9-1-1 public safety answering points located in Richland County, Ohio. The study found that consolidation is feasible, but would not result in a significant savings at this time. Funded by the Richland County Board of Commissioners, $35,917.
Center for Public ManagementFeasibility Study for Consolidation of 9-1-1 Dispatch Centers in Cuyahoga County - September 2012-March 2014
This project includes three separate feasibility studies for different groups of communities interested in assessing the feasibility of consolidating public safety answering points. These studies will be completed in 2013 and 2014.Funded by Cuyahoga County, $240,618
Ohio Center for the Advancement of Women in Public Service Fiscal Year 2012
The State of Ohio awarded the Center with $75,000 to continue the Mentoring Program, which places University students with Mentors from public, private, and nonprofit organizations in the Cleveland area. The Center focuses on tracking program participants during and after the conclusion of the program. Additionally, the Center showcases College Majors by holding various speaker panels for students to gain insight into possible career tracks. For example, panels of Elected Officials, Economic Development Specialists, as well as Environmental Planners helped students learn about career opportunities. The Center also hosted in conjunction with the Cleveland Council on World Affairs the “Women as Political Leaders Program.” Women from South America, the Middle East, and Africa engaged in a conversation with leaders from Ohio on how American Government works, $75,000 in FY12.
Center for Emergency PreparednessPublic Utilities Commission of Ohio (PUCO) - July 2012
The delivery of Hazardous Material associated programs for public sector agencies who respond to hazardous material related incidents within the jurisdiction of the PUCO, $400,000.
The Voinovich Collections (www.voinovichcollections.library.ohio.edu) Ongoing
Available through an innovative digital home, the Omeka-based archival website allows users to explore exhibits comprised of material from the collections, view multimedia pieces, and learn about George Voinovich’s impressive 45-year career in public service. This site is a partnership between Cleveland State University’s Levin College of Urban Affairs and Center for Public History and Digital Humanities and Ohio University’s Voinovich School of Leadership and Public Affairs and the Ohio University Libraries. Through an incremental approach, The Voinovich Collections digital archive document selection is driven by student & professor demand. The Voinovich Collections was awarded $10,000 in April 2012 to support the costs of the Phase 1 & 2 of building and maintaining the website. As well, through the partnership the Voinovich Fellowship was created to grant $1,000 to a faculty member utilizing the archives in their classroom. Dr. Vera Vogelsang Coombs from the Levin College was granted the award in May 2013. Finally, the project was highlighted by the United States Senate Archivist, encouraging current Senators to utilize the model of our website as it follows the best practices for digitization of archives of this type, $10,000.
The Northern Ohio Data Information Service (NODIS) Center Summit County Abandoned and Vacant Database - Completed July 31, 2012
NODIS provided Summit County with a property-based database, along with software and database updating procedures for identifying and profiling potential abandoned and vacant properties in the county. The database system will enable the county’s Department of Development, the City of Akron’s Economic Development Department, and other county and city agencies to address economic, community, and neighborhood development issues related to property abandonment and vacancy. Data from county property and service records are combined and a program produces a profile of important characteristics of selected properties or addresses, $10,000.
College Department Project Description

93Section 4 - Sponsored Programs and Research
Sec
tio
n
4
Northern Ohio Data Information Service (NODIS)Completed August 31, 2012
Demographic and Socioeconomic Conditions and a Patron Borrowing Analysis of Cleveland Heights – University Heights Public Library Main and Branch Libraries - NODIS provided an analysis of the demographic and socioeconomic characteristics of the Cleveland Heights - University Heights Public Library’s (CH-UHPL) service area and those of the neighborhoods in which the library’s patrons live. The project also described the borrowing patterns for the branch and Main libraries and the residential areas in which the libraries are the patrons’ primary service facility. The census-based demographic and socioeconomic data included income, number of children, race, Hispanic ethnicity, language spoken at home, ability to speak English, public-versus-private school attendance by grade level, housing tenure (owner/renter), educational attainment, employment status, and place of employment (Cleveland versus other). Data from the 2010 census and the Census Bureau’s 2006-2010 American Community Survey are used. The analysis included projected population to 2015 and 2020. Rates of patronage by neighborhood provided insights into the market penetration of library services in each neighborhood and revealed potential issues of accessibility and quality of service among the branch locations. A matrix of borrower counts by lending branch and residential service area of the patrons provided insight into how a branch draws patronage from its own and other library service areas, $17,000. Northern Ohio Data Information Service (NODIS)The NEO Data Collaboration’s Enhancement and Updating of NEO CANDO - Completed May 31, 2012
The NEO Data Collaborative is a partnership among three Cleveland institutions – CWRU’s Center on Urban Poverty and Community Development, CSU’s NODIS, and The Center for Community Solutions-- that collectively have a long history of providing data, information and analysis related to the wellbeing of residents and communities in Northeast Ohio. Although these entities have shared data and worked collaboratively in the past, they have now established a joint program that is providing a unified port of entry and a seamless set of data products and services for the region. See http://urban.csuohio.edu/nodis/nodc/Among the Collaborative’s early projects, it received 10 small grants to create NEO CANDO 2010+, which updates the legacy NEO CANDO data with 2010 Census and American Community Survey data. See http://neocando.case.edu/NODIS provided the data for all census and local geographies, while CWRU developed the web interface, $28,000. Northern Ohio Data Information Service (NODIS)Cleveland Municipal School District - September 30, 2012
NODIS produced student enrollment projections at the neighborhood level for the Cleveland Municipal School District in order to effectively plan for its facilities. The projections must provide a sufficient level of geographic detail (i.e. census blocks) to enable the District to develop alternative school service (catchment) areas and any transportation requirements necessary for the facilities planning and implementation process. Thus the objective of the project was to provide enrollment projections by census block which can be aggregated to school catchment area for a five-year period. The project generated projections for each grade level, $19,000. Northern Ohio Data Information Service (NODIS)Medina County - October 10, 2012
NODIS assisted the Medina County Board of Elections (BOE) in revising precinct geography in the county that was required due to recent congressional, Ohio General Assembly, and city ward boundary changes. The project also assisted the BOE in reducing the number of precincts in the county, $9,000. Northern Ohio Data Information Service (NODIS)Ohio Manufacturers’ Association - June 30, 2012
NODIS provided demographic, socioeconomic, and election results data for the new Ohio General Assembly and congressional districts. Maps for the Ohio Manufacturers’ Association’s 2010 Election Guide, $11,000.
College Department Project Description

Cleveland State University / 2013 Book of Trends94
Leadership ProgramsStrong Cities, Strong Communities (SC2) - Jan. 2012 - May 2014; Dec. 2011 - May 2014
The Levin College, Center for Leadership Development received a grant from the U.S. Department of Housing and Urban Development (HUD) to design and deliver the SC2 Fellowship Management Academy. This White House initiative is a federal inter-agency initiative housed at HUD that aims to strengthen neighborhoods, cities, and regions by enhancing the capacity of local governments to develop and implement economic visions and strategies. A gift from the Rockefeller Foundation funds the fellowship program. The seventeen SC2 fellows are highly motivated mid-career professionals working in local government agencies for a two-year (24 month) fellowship period, $360,680.
Leadership ProgramsPublic Transit Management Academy (PTMA) - Jan. 2012 - July 2013
The Levin College, Center for Leadership Development received a grant from the Federal Transit Administration to run the Public Transit Management Academy for the Greater Cleveland Regional Transit Authority (GCRTA). This program provides a customized professional development program that will improve GCRTA employees’ management and leadership skills. In addition, this program guarantees delivery of innovative solutions to agency problems through required participant projects. These projects are designed to disseminate innovative solutions and transform its organizational culture. Ninety employees will participate in the program and be eligible for continuing education credit and/or academic credit at the Levin College, $286,688.
Leadership ProgramsNeighborhood Leadership Cleveland (Class #28) – Feb. 2012 – Offered Annually The Levin College Center for Leadership Development offers the Neighborhood Leadership Cleveland program in collaboration with the Neighborhood Leadership Institute. Its 14-week curriculum includes class sessions on leadership topics ranging from personal goal setting to neighborhood development. In addition to the weekly classes, participants also attend an opening two-day retreat, organize tours of their neighborhoods, and work with their classmates on group projects. Through their participation in Neighborhood Leadership Cleveland, grassroots leaders learn a wide variety of skills, including how to: serve as advocates for their families and communities, collaborate with others to get things done, make public presentations, work with government agencies and social service providers, and find and utilize resources. The program is funded through a City of Cleveland block grant, $28,000.
Great Lakes Environmental Finance CenterGLEFC 2012 – 2013: U.S. EPA: April 1, 2012 to March 31, 2013, $190,000.GLEFC 2013 – 2014: U.S. EPA: April 1, 2013 to March 31, 2014, $165,000.
Training and Technical Assistance for Small Public Water Systems in U.S. EPA Region 5, New Mexico Tech./Environmental Finance Center Network/EPA: $83,000. Valuation of Public Assets, Cincinnati Streetcar System, The Superlative Group $6,000. Valuation of Public Assets, Playhouse Square Theatre District, The Superlative Group, $9,000. Valuation of Public Assets, Dallas (Tx.) Area Rapid Transit (DART), The Superlative Group, $9,000. Valuation of Public Assets, Ohio Department of Transportation: Four Services, The Superlative Group, $9,000.
Skills, regions and entrepreneurship. Funded by Regional Studies Association. Dr. Qian’s research examines the effects of geographically bounded skills on entrepreneurship. A recent U.S. Department of Labor dataset (O*NET) identifies 87 skills related to specific occupations. The principal outcome of this research is to identify the subset of these skills associated with regional entrepreneurial activity. From the policy perspective, this research aims to provide a skills-enhancing alternative to direct subsidies or incentives as a way to encourage entrepreneurship, $15,000.
College Department Project Description
Department of Urban Studies
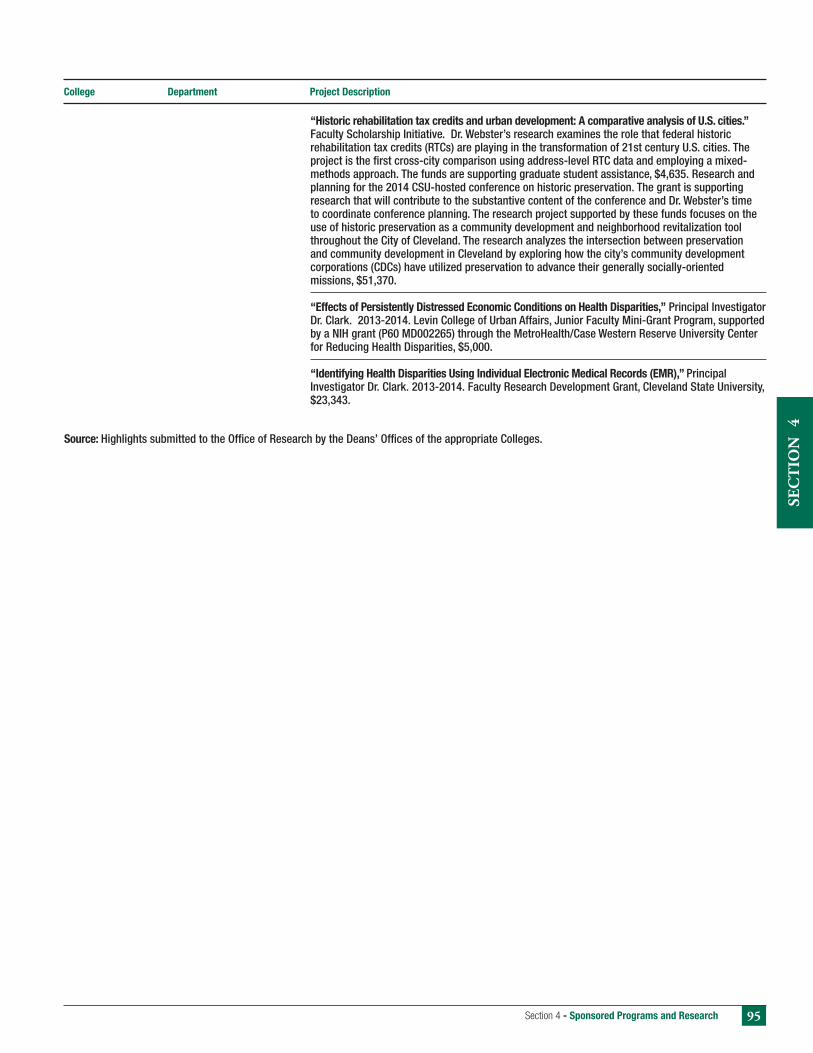
95Section 4 - Sponsored Programs and Research
Sec
tio
n
4
“Historic rehabilitation tax credits and urban development: A comparative analysis of U.S. cities.” Faculty Scholarship Initiative. Dr. Webster’s research examines the role that federal historic rehabilitation tax credits (RTCs) are playing in the transformation of 21st century U.S. cities. The project is the first cross-city comparison using address-level RTC data and employing a mixed-methods approach. The funds are supporting graduate student assistance, $4,635. Research and planning for the 2014 CSU-hosted conference on historic preservation. The grant is supporting research that will contribute to the substantive content of the conference and Dr. Webster’s time to coordinate conference planning. The research project supported by these funds focuses on the use of historic preservation as a community development and neighborhood revitalization tool throughout the City of Cleveland. The research analyzes the intersection between preservation and community development in Cleveland by exploring how the city’s community development corporations (CDCs) have utilized preservation to advance their generally socially-oriented missions, $51,370. “Effects of Persistently Distressed Economic Conditions on Health Disparities,” Principal Investigator Dr. Clark. 2013-2014. Levin College of Urban Affairs, Junior Faculty Mini-Grant Program, supported by a NIH grant (P60 MD002265) through the MetroHealth/Case Western Reserve University Center for Reducing Health Disparities, $5,000.
“Identifying Health Disparities Using Individual Electronic Medical Records (EMR),” Principal Investigator Dr. Clark. 2013-2014. Faculty Research Development Grant, Cleveland State University, $23,343.
College Department Project Description
Source: Highlights submitted to the Office of Research by the Deans’ Offices of the appropriate Colleges.

Cleveland State University / 2013 Book of Trends96
Name Established Website
Bioethics Center 2002 http://www.csuohio.edu/class/bioethics/
Center for Advanced Control Technologies (CACT) 1995 http://cact.csuohio.edu/
Center for Advancements in Renewable Energy (CARE) 2010 http://www.csuohio.edu/engineering/care/home.html
Center for Arts and Innovation 2005 http://www.csuohio.edu/class/cai/
Center for Community Planning and Development 2009 http://www.urban.csuohio.edu/community_planning/
Center for Economic Development 1986 http://www.urban.csuohio.edu/economicdevelopment/
Center for Gene Regulation in Health and Disease 2008 http://www.csuohio.edu/sciences/grhd.html
Center for Healing Across Cultures 2005 http://www.csuohio.edu/sciences/dept/chac/
Center for Health Equity 2006 http://www.urban.csuohio.edu/che/
Center for Health Law and Policy 2009 http://www.law.csuohio.edu/academics/chlp
Center for Leadership Development 1993 http://www.urban.csuohio.edu/leadership/
Center for Nonprofit Policy and Practice 1970 http://www.urban.csuohio.edu/nonprofit/
Center for Public Management 1982 http://www.urban.csuohio.edu/publicmanagement/
Center for Research in Electronics and Aerospace 2003 http://www.csuohio.edu/engineering/create/Technology (CREATE)
Center for Rotating Machinery Dynamics and Control (RoMaDyC) 2006 http://academic.csuohio.edu/romadyc/
Center for Urban Education (CUE) 2010 http://www.csuohio.edu/cehs/centers/cue.html
Communication Research Center 1976 http://www.csuohio.edu/class/com/CRChome.html
Criminology Research Center 2008 http://www.csuohio.edu/class/criminologyresearch/
Fenn Research and Development Institute (FRDI) 2009 http://www.csuohio.edu/engineering/frdi/home.html
Global Business Center N/A http://www.csuohio.edu/business/global/
Great Lakes Environmental Finance Center 1995 http://www.urban.csuohio.edu/glefc/
Northern Ohio Data and Information Service (NODIS) 1982 http://www.urban.csuohio.edu/nodis/
Paul J. Everson Center for the Study of Real Estate Brokerage/ 1992 http://www.csuohio.edu/business/realestate/Agency and Markets
Poetry Center 1962 http://www.csuohio.edu/poetrycenter/
The Ohio Center for the Advancement of Women in 2001 http://www.urban.csuohio.edu/womenscenter/Public Service
The Urban Center 1979 http://www.urban.csuohio.edu/urban_center/
Unger International Center for Local Government Leadership 2001 http://www.urban.csuohio.edu/unger_international/
University Transportation Center 2004 http://www.csuohio.edu/engineering/utc/
Wright Center for Sensor System Engineering (WCSSE) 2007 http://www.csuohio.edu/research/wcsse/
Table 4.12: Cleveland State University Research Centers and Institutes
Source: http://www.csuohio.edu/academic/centers.html

97Section 4 - Sponsored Program
s and Research
Section 4
Type Award
Teaching Service Research
Year Name Department Name Department Name Department
1995 Rosemary E. Sutton Curriculum & Foundations Robert I. Abelman Communication Robert A. Wheeler History Roger B. Manning History1996 Sherwood D. Silliman Mathematics Murali D. Nair Social Work Sarah Matthews Sociology1997 Ravindra R. Kamath Finance David F. Forte Law Jose J. Labrador Modern Languages Robert N. Sollod Psychology 1998 William A. Beasley Curriculum & Foundations Valerie D. George Nursing Richard Bingham Urban Studies Majid Rashidi Mechanical Engineering Edward W. Hill Urban Studies 1999 Sanda Kaufman Urban Studies Lynn Deering HPERD Rama S. R. Gorla Mechanical Engineering John P. Wilson Psychology Richard M. Perloff Communication2000 Edward G. Thomas Marketing David Atkin Communication Michael J. Tevesz BGES2001 Lee A. Makala History Jill M. Black HPERD Thomas Donaldson Art Heidi Meier Accounting Norman Krumholz Urban Studies John Greppin English2002 David W. Ball Chemistry Daniel D. Drake CASAL Mark Ashcraft Psychology Carolyn Lin Communication2003 Glenn Goodman Occupational Therapy Patricia Falk Law Bahman Ghorashi Chemical Engineering Ralph Mawdsley CASAL Bhushan Wadhwa Mathematics Baochuan Guo Chemistry2004 Rama S. R. Gorla Mechanical Engineering Susan E. Kogler Hill Communication Andrew Rindfleisch Music Elizabeth Welfel CASAL Mieko K. Smith Social Work Jerzy T. Sawicki Mechanical Engineering 2005 Eric Ziolek Music Ravindra R. Kamath Finance Michael Kalafatis Chemistry John P. Holcomb, Jr. Mathematics Cheryl P. McCahon Nursing Catherine Hansman CASAL2006 Donald Ramos History Andrew Gross Marketing Leo W.Jeffres Communication Eileen Berlin Ray Communication Orhan Talu Chemical & Biomedical Engineering2007 Stephen Lazarus Law Lily Ng Chemistry Miron Kaufman Physics Mekki Bayachou Chemistry 2008 Elliot R. Ingersoll CASAL Sheldon Gelman Law Angelin Chang Music David F. Forte Law Barbara H. Margolius Mathematics John F. Oprea Mathematics2009 Jearl D. Walker Physics Barbara K. Modney BGES Crystal M. Weyman BGES Murali D. Nair Social Work William M. Bowen Urban Studies Dena S. Davis Law2010 Susan S. Bazyk Health Sciences David Bell Chemistry John A.C. Greppin English Susan J. Becker Law Maggie Jackson Social Work Barsanjit Mazumder BGES2011 Dinah Volk Teacher Education Beth Ekelman Health Sciences James Lock Physics Vera Vogelsang-Coombs Urban Studies Mary Ellen Waithe Philosophy2012 Kathryn C. MacCluskie CASAL Ronald J. Abate Teacher Education Xue-Long Sun Chemistry John J. Jeziorowski Health Sciences Christopher a. Maller Social Work2013 Peter S. Dunham Anthropology Ashutosh Dixit Marketing Siu-Tung Yau Electrical & Computer Engineering Catherine H. Monaghan CASAL Kenneth E. Sparks Health, Physical Education, Justin Clement Perry CASAL Recreation, and Dance
Source: CSU Provost’s Office
Table 4.13: Past Recipients of Distinguished Faculty Awards by Award Type 1995-2013

Cleveland State University / 2013 Book of Trends98

Se
ct
ion
5
Book of Trends
Cleveland State University
2013
Retention & Graduation
5

Cleveland State University / 2013 Book of Trends100

101Section 5 - Retention &
Graduation
Section 5
Table 5.1: Fall to Fall Retention Rates for IPEDS Cohort by Ethnicity and Gender (New Degree-Seeking, Full-Time, First-Time First Year) Enrolled Fall 2007-2011 / Returned Fall 2008-2012
Fall 2007 Cohort Fall 2008 Cohort Fall 2009 Cohort Fall 2010 Cohort Fall 2011 Cohort
Fall 07 Fall 08 Fall 08 Fall 09 Fall 09 Fall 10 Fall 10 Fall 11 Fall 11 Fall 12 Newly Ret. Newly Ret. Newly Ret. Newly Ret. Newly Ret. Enrolled Return Rate Enrolled Return Rate Enrolled Return Rate Enrolled Return Rate Enrolled Return Rate
White 612 396 65% 617 429 70% 662 456 69% 704 500 71% 861 604 70%F 293 186 63% 303 214 71% 323 234 72% 353 240 68% 465 315 68%M 319 210 66% 314 215 68% 339 222 65% 351 260 74% 396 289 73%Black/African American 317 130 41% 201 111 55% 247 118 48% 224 100 45% 266 123 46%F 212 93 44% 137 77 56% 161 74 46% 151 66 44% 171 81 47%M 105 37 35% 64 34 53% 86 44 51% 73 34 47% 95 42 44%Hispanic/Latino 63 29 46% 61 34 56% 51 32 63% 75 44 59% 62 35 56%F 40 16 40% 39 19 49% 34 19 56% 42 27 64% 34 20 59%M 23 13 57% 22 15 68% 17 13 76% 33 17 52% 28 15 54%Asian 39 26 67% 32 23 72% 27 22 81% 26 18 69% 28 20 71%F 19 13 68% 16 12 75% 12 9 75% 15 10 67% 12 9 75%M 20 13 65% 16 11 69% 15 13 87% 11 8 73% 16 11 69%American Indian/ 3 2 67% 5 3 60% 7 4 57% 4 3 75% 1 1 100%Alaska NativeF 3 2 67% 2 1 50% 5 3 60% 2 2 100% - - -M - - - 3 2 67% 2 1 50% 2 1 50% 1 1 100%Native Hawaiian or Other - - - - - - - - - 1 - 0% - - -Pacific IslandF - - - - - - - - - - - - - - -M - - - - - - - - - 1 - 0% - - -Non Resident Alien 11 10 91% 17 13 76% 22 19 86% 31 27 87% 23 22 96%F 6 5 83% 8 6 75% 9 8 89% 8 7 88% 8 8 100%M 5 5 100% 9 7 78% 13 11 85% 23 20 87% 15 14 93%Two or more races - - - - - - - - - 15 11 73% 64 39 61%F - - - - - - - - - 9 6 67% 38 21 55%M - - - - - - - - - 6 5 83% 26 18 69%Unknown 87 54 62% 74 52 70% 111 68 61% 68 54 79% 23 16 70%F 49 28 57% 44 31 70% 57 32 56% 35 28 80% 14 9 64%M 38 26 68% 30 21 70% 54 36 67% 33 26 79% 9 7 78%TotalF 622 343 55% 549 360 66% 601 379 63% 615 386 63% 742 463 62%M 510 304 60% 458 305 67% 526 340 65% 533 371 70% 586 397 68%Total Female & Male 1,132 647 57% 1,007 665 66% 1,127 719 64% 1,148 757 66% 1,328 860 65%

Cleveland State U
niversity / 2013 Book of Trends102 Table 5.2: Fall to Fall Retention Rates for IPEDS Cohort (New Degree-Seeking, Full-Time) by College
Enrolled Fall 2007-2011 / Returned Fall 2008-2012
Fall 2007 Cohort Fall 2008 Cohort Fall 2009 Cohort Fall 2010 Cohort Fall 2011 Cohort
Fall 07 Fall 08 Fall 08 Fall 09 Fall 09 Fall 10 Fall 10 Fall 11 Fall 11 Fall 12
Ret. Ret. Ret. Ret. Ret. Ret. Rate Enrolled Return Rate Enrolled Return Rate Enrolled Return Rate Enrolled Return Rate Enrolled Return Rate
Business 62% 145 96 66% 148 105 71% 156 97 62% 132 87 66% 139 79 57%CLASS 66% 277 176 64% 272 169 62% 319 203 64% 344 221 64% 465 287 62%Education 66% 116 55 47% 160 104 65% 122 68 56% 85 50 59% 89 51 57%Engineering 79% 105 80 76% 108 86 80% 125 94 75% 137 101 74% 148 119 80%Nursing 41 21 51% 118 75 64% 82 57 70%Science 65% 194 120 62% 205 137 67% 246 169 69% 282 193 68% 316 223 71%Urban Affairs 50% 11 7 64% 4 4 100% 5 3 60% 9 8 89% 13 9 69%Undergraduate Studies 48% 284 113 40% 110 60 55% 113 64 57% 41 22 54% 76 35 46%TOTAL 62% 1,132 647 57% 1,007 665 66% 1,127 719 64% 1,148 757 66% 1,328 860 65%
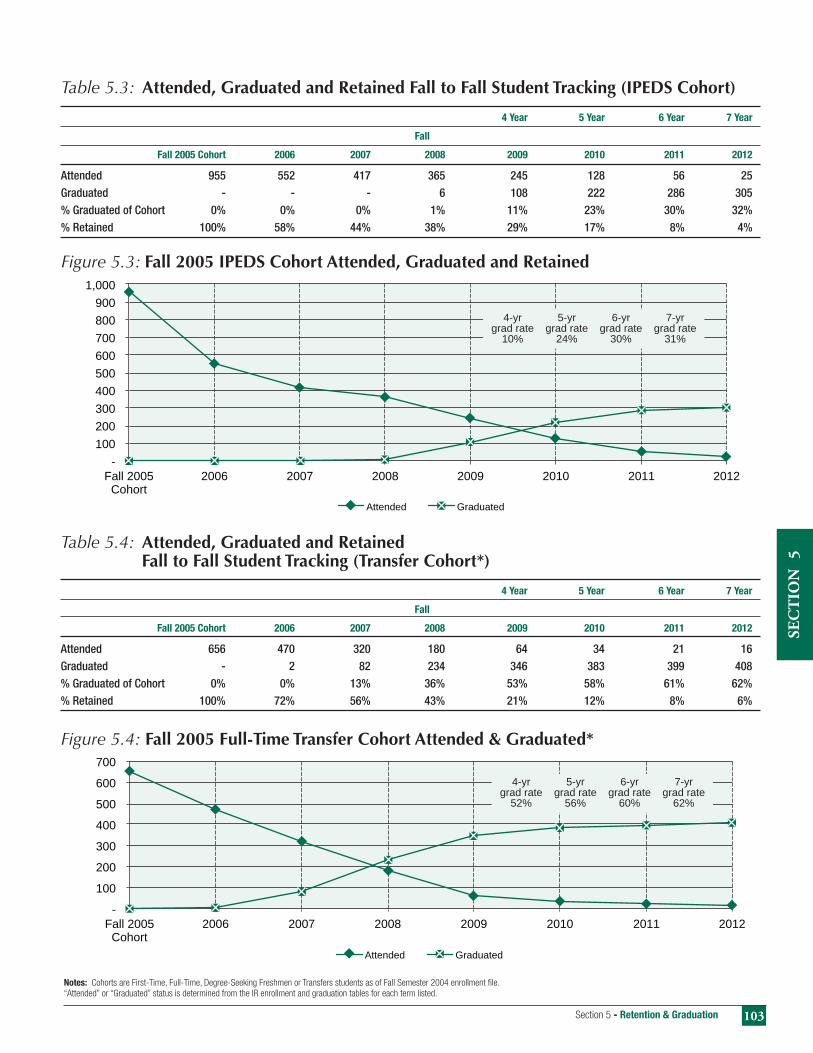
103Section 5 - Retention & Graduation
Sec
tio
n
5
Table 5.3: Attended, Graduated and Retained Fall to Fall Student Tracking (IPEDS Cohort)
4 Year 5 Year 6 Year 7 Year
Fall
Fall 2005 Cohort 2006 2007 2008 2009 2010 2011 2012
Attended 955 552 417 365 245 128 56 25 Graduated - - - 6 108 222 286 305 % Graduated of Cohort 0% 0% 0% 1% 11% 23% 30% 32%% Retained 100% 58% 44% 38% 29% 17% 8% 4%
Figure 5.3: Fall 2005 IPEDS Cohort Attended, Graduated and Retained
Table 5.4: Attended, Graduated and Retained Fall to Fall Student Tracking (Transfer Cohort*)
4 Year 5 Year 6 Year 7 Year
Fall
Fall 2005 Cohort 2006 2007 2008 2009 2010 2011 2012
Attended 656 470 320 180 64 34 21 16 Graduated - 2 82 234 346 383 399 408 % Graduated of Cohort 0% 0% 13% 36% 53% 58% 61% 62%% Retained 100% 72% 56% 43% 21% 12% 8% 6%
Figure 5.4: Fall 2005 Full-Time Transfer Cohort Attended & Graduated*
Notes: Cohorts are First-Time, Full-Time, Degree-Seeking Freshmen or Transfers students as of Fall Semester 2004 enrollment file. “Attended” or “Graduated” status is determined from the IR enrollment and graduation tables for each term listed.
- 100 200 300 400 500 600 700 800 900
1,000
Fall 2005 Cohort
2006 2007 2008 2009 2010 2011 2012
Attended Graduated
4-yrgrad rate
10%
5-yrgrad rate
24%
6-yrgrad rate
30%
7-yrgrad rate
31%
Attended Graduated
-
100 200 300 400 500 600 700
Fall 2005 Cohort
2006 2007 2008 2009 2010 2011 2012
4-yrgrad rate
52%
5-yrgrad rate
56%
6-yrgrad rate
60%
7-yrgrad rate
62%

Cleveland State University / 2013 Book of Trends104
Cohort Cohort Size 1st Year 2nd Year 3rd Year 4th Year 5th Year 6th Year 7th Year 8th Year
Fall 2004 922
Graduated 0 0 11 92 224 275 310 319
% Graduated 0% 0% 1% 10% 24% 30% 34% 35%
Fall 2005 955
Graduated 0 0 6 108 222 286 305
% Graduated 0% 0% 1% 11% 23% 30% 32%
Fall 2006 947
Graduated 0 0 5 107 259 313
% Graduated 0% 0% 1% 11% 27% 33%
Fall 2007 1,132
Graduated 0 1 15 121 255
% Graduated 0% 0% 1% 11% 23%
Fall 2008 1,007
Graduated 0 2 13 128
% Graduated 0% 0% 1% 13%
Fall 2009 1,127
Graduated 0 2 9
% Graduated 0% 0% 1%
Fall 2010 1,148
Graduated 0 4
% Graduated 0% 0%
Fall 2011 1,328
Graduated 0
% Graduated 0%
Fall 2012 1,531
Graduated
% Graduated
Graduated: represents the cumulative number of distinct cohort students receiving a CSU baccalaureate award between the student’s first term and the term prior to a given year.
Table 5.5a: Undergraduate First-Year, Full-Time Degree-Seeking IPEDS Cohort Graduation

105Section 5 - Retention &
Graduation
Section 5
Table 5.5b: Undergraduate First-Year, Full-Time Degree-Seeking IPEDS Cohort Retention Rate
Year One Year Two Year Three Year Four Year Five Year Six Year Seven Year Eight
TERM Cohort Size 1st Spring 2nd Fall 2nd Spring 3rd Fall 3rd Spring 4th Fall 4th Spring 5th Fall 5th Spring 6th Fall 6th Spring 7th Fall 7th Spring 8th Fall 8th Spring
Fall 2004 Enrolled 922 796 549 495 427 401 370 338 259 200 125 106 73 62 40 34 % Still Enrolled 86% 60% 54% 46% 43% 40% 37% 28% 22% 14% 11% 8% 7% 4% 4% Graduated 0 0 0 2 7 23 81 141 211 243 270 288 298 310 319 % Graduated 0% 0% 0% 0% 1% 2% 9% 15% 23% 26% 29% 31% 32% 34% 35% % Enrolled/Grad 86% 60% 54% 47% 44% 43% 45% 43% 45% 40% 41% 39% 39% 38% 38% % Stopped Out 14% 40% 46% 53% 56% 57% 55% 57% 55% 60% 59% 61% 61% 62% 62%Fall 2005 Enrolled 955 804 552 473 417 397 365 357 245 201 128 97 56 43 25 23 % Still Enrolled 84% 58% 50% 44% 42% 38% 37% 26% 21% 13% 10% 6% 5% 3% 2% Graduated 0 0 0 0 3 18 90 148 211 242 274 293 305 % Graduated 0% 0% 0% 0% 0% 2% 9% 15% 22% 25% 29% 31% 32% % Enrolled/Grad 84% 58% 50% 44% 42% 40% 47% 41% 43% 39% 39% 37% 36% % Stopped Out 16% 42% 50% 56% 58% 60% 53% 59% 57% 61% 61% 63% 64% Fall 2006 Enrolled 947 795 587 513 448 438 397 395 294 233 131 105 74 59 37 % Still Enrolled 84% 62% 54% 47% 46% 42% 42% 31% 25% 14% 11% 8% 6% 4% Graduated 0 0 0 0 2 14 95 158 241 285 313 % Graduated 0% 0% 0% 0% 0% 1% 10% 17% 25% 30% 33% % Enrolled/Grad 84% 62% 54% 47% 46% 43% 52% 48% 50% 44% 44% % Stopped Out 16% 38% 46% 53% 54% 57% 48% 52% 50% 56% 56% Fall 2007 Enrolled 1131 962 646 596 511 491 443 423 321 254 159 103 66 % Still Enrolled 85% 57% 53% 45% 43% 39% 37% 28% 22% 14% 9% 6% Graduated 0 0 1 2 11 23 94 182 255 % Graduated 0% 0% 0% 0% 1% 2% 8% 16% 23% % Enrolled/Grad 85% 57% 53% 45% 44% 41% 46% 44% 45% % Stopped Out 15% 43% 47% 55% 56% 59% 54% 56% 55% Fall 2008 Enrolled 1007 884 665 607 531 491 465 450 315 229 115 % Still Enrolled 88% 66% 60% 53% 49% 46% 45% 31% 23% 11% Graduated 0 0 1 4 13 27 128 % Graduated 0% 0% 0% 0% 1% 3% 13% % Enrolled/Grad 88% 66% 60% 53% 50% 49% 57% % Stopped Out 12% 34% 40% 47% 50% 51% 43% Fall 2009 Enrolled 1127 969 718 631 560 530 517 492 334 % Still Enrolled 86% 64% 56% 50% 47% 46% 44% 30% Graduated 0 0 1 3 9 % Graduated 0% 0% 0% 0% 1% % Enrolled/Grad 86% 64% 56% 50% 48% % Stopped Out 14% 36% 44% 50% 52% Fall 2010 Enrolled 1148 991 757 685 621 595 542 % Still Enrolled 86% 66% 60% 54% 52% 47% Graduated 0 0 4 % Graduated 0% 0% 0% % Enrolled/Grad 86% 66% 60% % Stopped Out 14% 34% 40% Fall 2011 Enrolled 1328 1157 860 811 725 % Still Enrolled 87% 65% 61% 55% Graduated 0 % Graduated 0% % Enrolled/Grad 87% % Stopped Out 13% Fall 2012 Enrolled 1531 1373 1030 % Still Enrolled 90% 67% Graduated % Graduated % Enrolled/Grad % Stopped Out
Enrolled: represents the number of cohort students enrolled as an undergraduate in a given term excluding those who have received a bachelor’s degree from CSU prior to the reported term.Note: Cohort Definition 1) A student attending any institution of higher learning for the first time at the undergraduate level includes students enrolled in the fall term who attended college for the first time in the prior summer term and students who entered CSU with advanced standing (college credits earned before graduation from high school).2) By the university census date, the student has registered for 12 or more credit hours in the fall semester.3) The student is seeking a baccalaureate degree.

Cleveland State U
niversity / 2013 Book of Trends106
Percent Change
2007-08 2008-09 2009-10 2010-11 2011-12 1 Year 5 Year
Degree Level Female Male Female Male Female Male Female Male Female Male
Bachelor’s Degree Accounting 29 42 42 39 36 29 52 40 39 36 -18% 6% Business Administration 1 6 9 17 35 37 38 29 36 50 28% 1129% Business Administration (LK) - - - - - - 17 10 10 8 -33% - Business Economics 3 2 4 6 3 5 3 10 2 8 -23% 100% Computer and Information Science 4 22 2 20 1 22 3 16 2 8 -47% -62% Computer Science - - - - - 1 - 4 - 1 -75% - Finance 22 69 27 55 23 44 22 39 13 28 -33% -55% Information Systems 3 23 5 15 6 15 1 21 7 27 55% 31% International Business 7 12 12 4 9 11 10 15 16 16 28% 68% Management & Labor Relations 35 34 23 27 26 17 35 17 23 17 -23% -42% Marketing 33 35 31 36 34 30 26 38 26 30 -13% -18% Operations & Supply Chain Mgmt 5 11 4 10 7 10 3 16 4 12 -16% 0% Total 142 256 159 229 180 221 210 255 178 241 -10% 5%
Table 5.7: Annual Degrees/Certificates Awarded by Major and Gender - College of Business
continued on next page
Percent Change
2007-08 2008-09 2009-10 2010-11 2011-12 1 Year 5 Year
Degree Level Female Male Female Male Female Male Female Male Female Male
Bachelor’s Degree 964 745 1,008 733 1,053 758 1,100 817 1,192 874 8% 21%Master’s Degree 858 520 794 546 871 523 798 580 830 633 6% 6%Post-Master’s Certificate 11 2 20 4 16 6 16 7 19 4 0% 77%Doctoral-Professional 95 103 103 103 77 97 96 125 98 106 -8% 3%Doctoral-Research 20 23 21 29 22 28 23 23 13 22 -24% -19%Total 1,948 1,393 1,946 1,415 2,039 1,412 2,033 1,552 2,152 1,639 6% 13%Notes: Degrees/Certificates awarded summer through spring
Two students level were corrected from last years book for 2010-2011 (1 Bachelor’s Public Administration was moved to Master’s Public Administration and 1 Bachelor’s in Social Work was moved to Master’s Social Work)
Table 5.6: Annual Degrees/Certificates Awarded by Academic Level and Gender - University Total
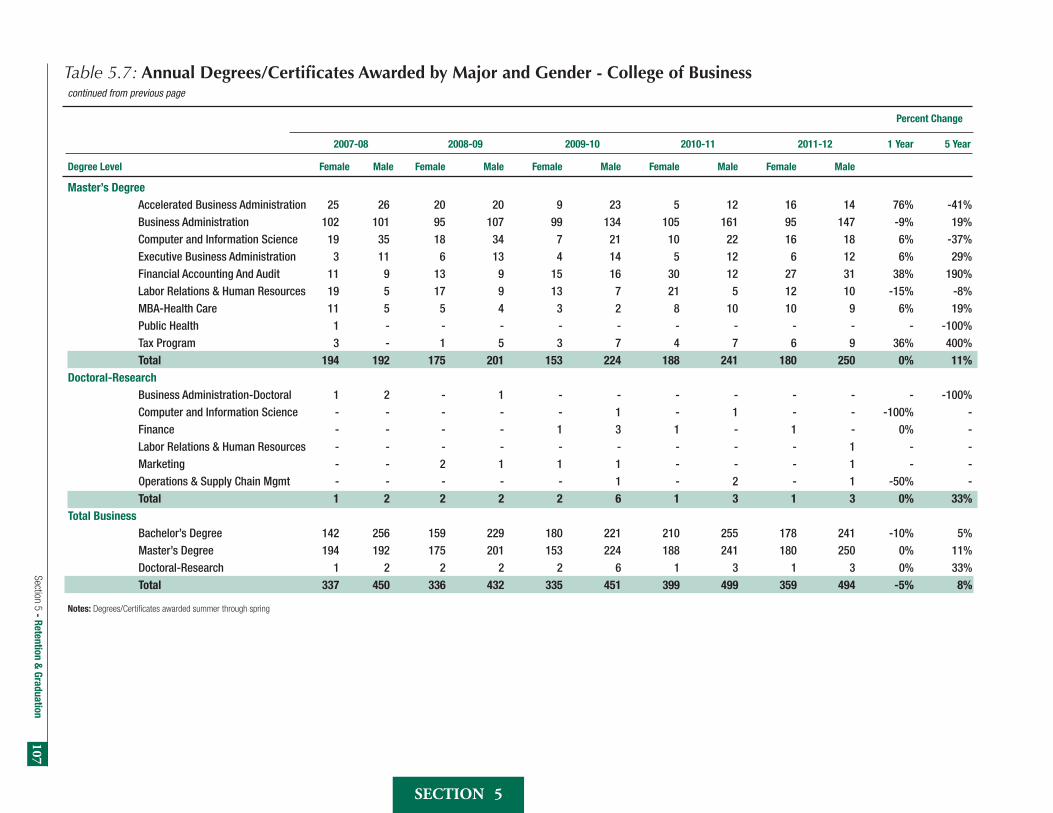
107Section 5 - Retention &
Graduation
Section 5
continued from previous page
Percent Change
2007-08 2008-09 2009-10 2010-11 2011-12 1 Year 5 Year
Degree Level Female Male Female Male Female Male Female Male Female Male
Master’s Degree Accelerated Business Administration 25 26 20 20 9 23 5 12 16 14 76% -41% Business Administration 102 101 95 107 99 134 105 161 95 147 -9% 19% Computer and Information Science 19 35 18 34 7 21 10 22 16 18 6% -37% Executive Business Administration 3 11 6 13 4 14 5 12 6 12 6% 29% Financial Accounting And Audit 11 9 13 9 15 16 30 12 27 31 38% 190% Labor Relations & Human Resources 19 5 17 9 13 7 21 5 12 10 -15% -8% MBA-Health Care 11 5 5 4 3 2 8 10 10 9 6% 19% Public Health 1 - - - - - - - - - - -100% Tax Program 3 - 1 5 3 7 4 7 6 9 36% 400% Total 194 192 175 201 153 224 188 241 180 250 0% 11%Doctoral-Research Business Administration-Doctoral 1 2 - 1 - - - - - - - -100% Computer and Information Science - - - - - 1 - 1 - - -100% - Finance - - - - 1 3 1 - 1 - 0% - Labor Relations & Human Resources - - - - - - - - - 1 - - Marketing - - 2 1 1 1 - - - 1 - - Operations & Supply Chain Mgmt - - - - - 1 - 2 - 1 -50% - Total 1 2 2 2 2 6 1 3 1 3 0% 33%Total Business Bachelor’s Degree 142 256 159 229 180 221 210 255 178 241 -10% 5% Master’s Degree 194 192 175 201 153 224 188 241 180 250 0% 11% Doctoral-Research 1 2 2 2 2 6 1 3 1 3 0% 33% Total 337 450 336 432 335 451 399 499 359 494 -5% 8%
Notes: Degrees/Certificates awarded summer through spring
Table 5.7: Annual Degrees/Certificates Awarded by Major and Gender - College of Business

Cleveland State U
niversity / 2013 Book of Trends108
continued on next page
Percent Change
2007-08 2008-09 2009-10 2010-11 2011-12 1 Year 5 Year
Degree Level Female Male Female Male Female Male Female Male Female Male
Bachelor’s Degree Anthropology 11 2 6 3 15 3 7 6 14 7 62% 62% Art 30 15 27 13 25 17 25 22 21 6 -43% -40% Art Education - - - - - - - - 2 1 - - Black Studies - - - - - - - - - 1 - - Classical and Medieval Studies 2 2 1 2 2 2 - 1 - 1 0% -75% Communication 47 41 34 37 45 26 47 36 30 24 -35% -39% Communication Management 9 3 8 4 11 1 10 8 7 1 -56% -33% Criminology 20 7 33 14 16 14 29 25 22 21 -20% 59% Drama 3 - 3 3 5 7 4 5 - - -100% -100% Economics 2 5 1 4 - 6 3 8 5 3 -27% 14% English 39 17 39 20 38 21 36 19 45 16 11% 9% Film and Digital Media 5 8 11 17 5 19 7 24 11 18 -6% 123% French 1 - 2 3 1 - 2 - 1 - -50% 0% History 12 20 11 17 11 23 7 18 7 17 -4% -25% International Relations 7 10 7 3 6 4 6 4 4 9 30% -24% Journalism & Promotional Communication 25 10 40 14 25 18 29 12 26 21 15% 34% Liberal Studies 18 6 8 5 9 3 8 5 7 5 -8% -50% Linguistics 4 1 3 1 1 5 5 1 4 2 0% 20% Music 7 3 9 9 5 9 4 6 2 4 -40% -40% Music Education - - - - - - - - 2 1 - - Music Performance - - - - - - - - - 2 - - Philosophy 2 4 1 6 3 2 3 4 - 2 -71% -67% Philosophy - Ethics Track - - - - - - 1 - - - -100% - Political Science 12 14 9 13 16 17 17 21 21 15 -5% 38% Religious Studies 1 1 2 2 6 1 1 9 3 - -70% 50% Social Science - 1 1 2 - - - - 2 - - 100% Social Studies 6 9 2 6 3 9 - 6 - 3 -50% -80% Social Work 65 14 70 12 71 15 68 12 69 15 5% 6% Sociology 29 14 25 14 31 10 19 12 29 18 52% 9% Spanish 6 4 6 1 11 1 9 1 8 3 10% 10% Studio Art: Graphic Design - - - - - - - - 4 1 - - Studio Art: Painting - - - - - - - - 1 2 - - Theatre Arts - - - - - - - - 4 - - - Women’s Studies 2 - 2 - 4 - 5 - 3 - -40% 50% Total 365 211 361 225 365 233 352 265 354 219 -7% -1%
Table 5.8: Annual Degrees/Certificates Awarded by Major and Gender - College of Liberal Arts and Social Sciences

109Section 5 - Retention &
Graduation
Section 5
continued from previous page Percent Change
2007-08 2008-09 2009-10 2010-11 2011-12 1 Year 5 Year
Degree Level Female Male Female Male Female Male Female Male Female Male
Master’s Degree Communication 10 3 5 1 7 - 10 5 7 6 -13% 0% Economics 4 6 5 5 3 6 2 10 5 5 -17% 0% English 8 8 8 4 9 4 8 5 6 3 -31% -44% Global Interaction - - - - - - - - 6 9 - - History 7 7 10 6 4 12 7 7 6 11 21% 21% Master of Fine Arts-Creative Writing - - 5 2 1 2 5 2 1 2 -57% - Music 7 3 2 8 8 10 9 9 6 11 -6% 70% Philosophy 2 3 3 2 1 4 - 1 4 5 800% 80% Social Work 65 13 63 13 72 13 49 9 52 13 12% -17% Sociology 12 5 7 2 12 3 10 4 9 2 -21% -35% Spanish 3 1 10 2 7 1 7 2 4 - -56% 0% Total 118 49 118 45 124 55 107 54 106 67 7% 4%Total CLASS Bachelor’s Degree 365 211 361 225 365 233 352 265 354 219 -7% -1% Master’s Degree 118 49 118 45 124 55 107 54 106 67 7% 4% Total 483 260 479 270 489 288 459 319 460 286 -4% 0%
First College Bachelor’s Degree 1 - - - - - - - - - - -100%
Note: Degrees/Certificates awarded summer through spring.
Table 5.8: Annual Degrees/Certificates Awarded by Major and Gender - College of Liberal Arts and Social Sciences

Cleveland State U
niversity / 2013 Book of Trends110
continued on next page
Percent Change 2007-08 2008-09 2009-10 2010-11 2011-12 1 Year 5 Year
Degree Level Major Female Male Female Male Female Male Female Male Female Male
Bachelor’s Degree Early Childhood Education 58 4 48 3 46 3 61 2 60 7 6% 8% Exercise/Fitness Specialist 1 3 5 2 3 1 2 2 1 5 50% 50% Health and Physical Education 3 3 - - - - - - - - - -100% Mid Childhood Lang Arts & Math - - - - - - - - 4 - - - Mid Childhood Lang Arts & Sci - - - - - - - - 1 - - Mid Childhood Lang Arts & SSt - - - - - - - - 2 1 - - Mid Childhood Math & Science - - - - - - - - 3 3 - - Mid Childhood Math & Soc St - - - - - - - - 2 1 - - Mid Childhood Science & SSt - - - - - - - - - 1 - - Middle Childhood Education 22 13 17 7 19 9 17 11 6 4 -64% -71% Mild/Moderate Educational Need 23 7 20 11 20 3 23 4 24 4 4% -7% Moderate/Intensive Educational Needs 8 - 10 2 4 2 14 1 13 - -13% 63% Physical Education - - 2 2 2 6 4 5 1 6 -22% - Sports Management - 5 1 7 3 8 2 5 1 5 -14% 20% Total 115 35 103 34 97 32 123 30 118 37 1% 3%
Master’s Degree Adult Learning and Development 46 5 46 6 37 4 32 4 45 6 42% 0% Clinical Mental Health Cnsling - - - - - - - - 10 2 - - Community Agency Counseling 15 4 19 1 22 3 17 3 - - -100% -100% Community Health Education 10 1 5 1 4 - 5 1 6 1 17% -36% Counselor Education 32 5 - - - - 24 4 30 4 21% -8% Curriculum and Instruction 224 65 192 52 225 58 183 51 187 51 2% -18% Educational Administration 25 13 12 17 22 10 19 13 13 9 -31% -42% Exercise Science 11 3 3 1 6 8 12 3 9 4 -13% -7% Master of Public Health 2 1 9 3 18 5 5 5 4 6 0% 233% Organizational Leadership - - 5 3 4 5 4 3 9 3 71% - School Counseling - - 25 5 25 3 - - - - - - Sports & Exercise Management 9 9 - - - - - - - - - -100% Sports Management - - - 9 6 5 3 8 5 10 36% - Sports Management and Exercise Science - - 2 - - 1 1 - - - -100% - Supervision 2 1 6 1 3 - 1 - 2 - 100% -33% Total 376 107 324 99 372 102 306 95 320 96 4% -14%
Table 5.9: Annual Awards by Major and Gender - College of Education and Human Services

111Section 5 - Retention &
Graduation
Section 5
Table 5.9: Annual Awards by Major and Gender - College of Education and Human Services
continued from previous page Percent Change
2007-08 2008-09 2009-10 2010-11 2011-12 1 Year 5 Year
Degree Level Major Female Male Female Male Female Male Female Male Female Male
Post-Master’s Certificate Educational Administration Specialist 7 1 7 3 5 3 8 4 9 1 -17% 25% Total 7 1 7 3 5 3 8 4 9 1 -17% 25%
Doctoral-Research Ph.D. in Urb Edu: Counsel Psy - 2 - - - - - - 1 - - -50% Urban Ed: Administration 2 2 1 - - - 3 1 2 1 -25% -25% Urban Education: Counseling 2 - 1 1 - 1 - - - - - -100% Urban Education: Leadership - - - 1 - - 3 1 1 1 -50% - & Life-long Learning Urban Education: Learning 2 2 6 1 4 1 2 2 - 1 -75% -75% & Development Urban Education: Policy - 1 1 2 - 2 2 1 1 - -67% 0% Total 6 7 9 5 4 4 10 5 5 3 -47% -38%
Total College of Education and Human Services Bachelor’s Degree 115 35 103 34 97 32 123 30 118 37 1% 3% Master’s Degree 376 107 324 99 372 102 306 95 320 96 4% -14% Post-Master’s Certificates 7 1 7 3 5 3 8 4 9 1 -17% 25% Doctoral-Research 6 7 9 5 4 4 10 5 5 3 -47% -38% Total 504 150 443 141 478 141 447 134 452 137 1% -10%Notes: Degrees/Certificates awarded summer through spring

Cleveland State U
niversity / 2013 Book of Trends112
Percent Change
2007-08 2008-09 2009-10 2010-11 2011-12 1 Year 5 Year
Degree Level Major Female Male Female Male Female Male Female Male Female Male
Bachelor’s Degree Chemical Engineering 1 6 8 6 3 13 2 5 6 13 171% 171% Civil Engineering 2 11 2 16 2 6 1 13 7 18 79% 92% Computer Engineering - 3 - 11 - 3 1 6 - 14 100% 367% Electrical Engineering 4 21 - 21 3 26 5 26 5 31 16% 44% Electronic Engineering Technology - 9 1 4 1 13 3 11 1 21 57% 144% Industrial and Manufacturing Engineering - 5 2 3 4 1 2 1 - - -100% -100% Mechanical Engineering 1 28 1 13 3 30 3 22 5 37 68% 45% Mechanical Engineering Technology - 7 - 9 2 9 2 8 1 16 70% 143% Total 8 90 14 83 18 101 19 92 25 150 58% 79%
Master’s Degree Biomedical Engineering - - - - - - 3 3 5 7 100% - Chemical Engineering 1 8 2 14 1 5 1 5 5 8 117% 44% Civil Engineering 3 11 - 10 3 8 2 20 3 11 -36% 0% Electrical & Computer Engineering - - - - 9 27 - - - - - - Electrical Engineering 7 50 10 42 - - 10 39 12 55 37% 18% Engineering Mechanics - 1 - - - - - 1 - - -100% -100% Environmental Engineering 1 4 - 2 - 4 - 2 1 - -50% -80% Industrial and Manufacturing Engineering 7 9 5 16 1 10 - - - - - -100% Industrial Engineering - - - - - - - 17 3 13 -6% - Mechanical Engineering 4 14 2 17 7 3 15 10 12 22% 22% Software Engineering - 2 - 7 2 5 2 8 1 4 -50% 150% Total 23 99 19 108 16 66 21 110 40 110 15% 23%
Doctoral-Research Applied Biomedical Engineering 1 3 2 3 4 4 2 4 - 1 -83% -75% Chemical Engineering - - 1 2 - - - - - 1 - - Civil Engineering - 2 - 1 - 1 - 1 - - -100% -100% Electrical & Computer Engineering - - - - 2 - - - - - - - Electrical Engineering - 1 - 1 - - - 1 1 5 500% 500% Industrial and Manufacturing Engineering - 1 - 1 - 1 - - - - - -100% Industrial Engineering - - - - - - - 1 - - -100% - Mechanical Engineering - - - - 1 - - - - 1 - - Total 1 7 3 8 7 6 2 7 1 8 0% 13%
Total Engineering Bachelor’s Degree 8 90 14 83 18 101 19 92 25 150 58% 79% Master’s Degree 23 99 19 108 16 66 21 110 40 110 15% 23% Doctoral-Research 1 7 3 8 7 6 2 7 1 8 0% 13% Total 32 196 36 199 41 173 42 209 66 268 33% 46%
Note: Degrees/Certificates awarded summer through spring
Table 5.10: Annual Degrees/Certificates Awarded by Major and Gender - College of Engineering

113Section 5 - Retention &
Graduation
Section 5
Percent Change
2007-08 2008-09 2009-10 2010-11 2011-12 1 Year 5 Year
Degree Level Major Female Male Female Male Female Male Female Male Female Male
Bachelor’s Degree Nursing, BSN 15 1 12 2 8 4 16 2 11 1 -33% -25% Nursing, BSN - Accelerated 1 - 22 5 44 10 63 16 52 11 -20% 6200% Nursing, BSN (LK) - - 12 1 10 2 1 - 2 - 100% - Nursing, BSN/RN 76 19 61 10 32 9 30 9 43 9 33% -45% Total 92 20 107 18 94 25 110 27 108 21 -6% 15%
Master’s Degree Nursing - - 11 1 11 1 17 1 13 - -28% - Total - - 11 1 11 1 17 1 13 - -28% -
Total Nursing Bachelor’s Degree 92 20 107 18 94 25 110 27 108 21 -6% 15% Master’s Degree - - 11 1 11 1 17 1 13 - -28% - Total 92 20 118 19 105 26 127 28 121 21 -8% 27%
Note: Degrees/Certificates awarded summer through spring
Percent Change 2007-08 2008-09 2009-10 2010-11 2011-12 1 Year 5 YearDegree Level Major Female Male Female Male Female Male Female Male Female Male
Bachelor’s Degree Biology 25 14 24 18 26 14 32 15 46 28 57% 90% Biology-Medical Technology 1 - 2 1 9 1 2 - 10 2 500% 1100% Chemistry 6 8 4 8 9 11 7 7 3 10 -7% -7% Environmental Sciences 4 2 5 5 6 6 6 4 2 9 10% 83% Geological Sciences - 1 1 1 - - 1 1 2 3 150% 400% Health Science Podiatry - - - 1 - - - - 1 - - - Health Science Pre-Occupational Therapy - - - - - - 5 2 26 7 371% - Health Science Pre-Physical Therapy 8 5 12 5 23 6 15 7 17 13 36% 131% Health Science Pre-Physician Assistant - - - - 1 1 2 2 14 2 300% - Health Sciences BS 45 14 66 20 51 24 45 16 47 20 10% 14% Mathematics 8 20 2 12 6 10 5 11 9 12 31% -25% Pharmaceutical Science - - - - - - 1 1 - - -100% - Physics 4 3 1 4 1 8 - 3 2 8 233% 43% Psychology 95 32 95 33 104 28 99 41 119 32 8% 19% Psychology (LR) - - - - - - 14 5 21 9 58% - Speech & Hearing 11 - 12 - 13 - 6 1 16 2 157% 64% Total 207 99 224 108 249 109 240 116 335 157 38% 61%
Table 5.12: Annual Awards by Major and Gender - College of Sciences and Health Professions
continued on next page
Table 5.11: Annual Degrees/Certificates Awarded by Major and Gender - School of Nursing

Cleveland State U
niversity / 2013 Book of Trends114
continued from previous page Percent Change
2007-08 2008-09 2009-10 2010-11 2011-12 1 Year 5 Year
Degree Level Major Female Male Female Male Female Male Female Male Female Male
Master’s Degree Applied Statistics - - - - - - - 1 - 3 200% - Biology 9 2 3 4 1 3 5 2 4 6 43% -9% Chemistry 3 6 3 1 5 1 7 5 3 12 25% 67% Environmental Science - - 1 1 1 1 1 - 3 - 200% - Health Science 7 4 7 1 10 2 24 8 25 12 16% 236% Health Science- Phy. Assistant Track - - - - 10 4 1 1 1 - -50% - Master of Occupational Therapy 1 - 25 3 24 5 28 1 23 5 -3% 2700% Mathematics 5 4 4 6 5 4 4 8 4 12 33% 78% MS in Physics Optical Medical - - - - - - 1 1 - - -100% - Physical Therapy 18 6 17 11 - 1 - - - - - -100% Physics 2 7 2 2 4 7 3 1 - 3 -25% -67% Psychology 36 3 23 12 9 3 1 1 2 - 0% -95% Psychology - Clinical - - - - 10 - 3 1 5 2 75% - Psychology-Cons.Indus.Research - - - - 1 - - - 1 1 - - Psychology-Diversity Managementt 1 - 2 - 12 3 6 1 7 2 29% 800% Psychology-Experimental - - - - - - 3 5 3 2 -38% - Psychology-School - - - - 4 2 8 2 5 2 -30% - Speech Pathology and Audiology 15 1 12 2 43 - 13 - 30 1 138% 94% Total 97 33 99 43 139 36 108 38 116 63 23% 38%Post-Master’s Certificate Psychology Specialist 3 1 12 - 8 3 8 3 9 2 0% 175%
Total 3 1 12 - 8 3 8 3 9 2 0% 175%Doctoral-Research Clinical-Bioanalytical Chemistry 4 3 4 10 2 2 4 4 2 3 -38% -29% Regulatory Biology 3 2 1 2 5 4 4 2 4 2 0% 20%
Total 7 5 5 12 7 6 8 6 6 5 -21% -8%
Doctoral-Professional Doctor of Physical Therapy - - - - - - 22 9 22 9 0% - Total - - - - - - 22 9 22 9 0% -Total Science Bachelor’s Degree 207 99 224 108 249 109 240 116 335 157 38% 61% Master’s Degree 97 33 99 43 139 36 108 38 116 63 23% 38% Post-Master’s Certificates 3 1 12 - 8 3 8 3 9 2 0% 175% Doctoral-Research 7 5 5 12 7 6 8 6 6 5 -21% -8% Doctoral-Professional - - - - - - 22 9 22 9 0% - Total 314 138 340 163 403 154 386 172 488 236 30% 60%
Note: Degrees/Certificates awarded Summer through Spring.
Table 5.12: Annual Awards by Major and Gender - College of Sciences and Health Professions

115Section 5 - Retention &
Graduation
Section 5
Percent Change
2007-08 2008-09 2009-10 2010-11 2011-12 1 Year 5 Year
Degree Level Major Female Male Female Male Female Male Female Male Female Male
Bachelor’s Degree Environmental Studies 2 - 1 2 - - 2 1 5 4 200% 350% Nonprofit Administration - - 6 1 22 5 15 2 23 4 59% - Organizational Leadership - - - - 3 1 9 6 16 8 60% - Public Safety Management 4 15 4 15 3 10 - 4 6 8 250% -26% Public Safety Management (LK) - - - - - - 1 1 2 4 200% - Urban Services Administration 10 4 11 - - - - - - - - -100% Urban Studies 18 15 18 18 22 21 19 18 17 20 0% 12% Urban Studies (LR) - - - - - - - - 5 1 - - Total 34 34 40 36 50 37 46 32 74 49 58% 81%Master’s Degree Environmental Studies 5 - 3 1 3 6 3 4 - - -100% -100% Environmental Studies and Law - - 1 - - - 1 1 - 1 -50% - Environmental Studies M.A. - - - - - - - - 6 10 - - Nonprofit Admin & Leadership - - - - 9 1 6 2 13 1 75% - Public Admin Accel 4+1 - - - - - - - - - 1 - - Public Administration 30 18 24 23 27 18 28 18 22 17 -15% -19% Urban Planning & Law - 1 - 2 - 3 - - - - - -100% Urban Planning, Design and Development 10 15 17 19 14 10 10 13 11 13 4% -4% Urban Studies 5 6 3 4 3 1 3 3 3 4 17% -36% Total 50 40 48 49 56 39 51 41 55 47 11% 13%Doctoral-Research Urban Studies & Public Affairs 5 2 2 2 2 6 2 2 - 3 -25% -57% Total 5 2 2 2 2 6 2 2 - 3 -25% -57%Total Urban Affairs Bachelor’s Degree 34 34 40 36 50 37 46 32 74 49 58% 81% Master’s Degree 50 40 48 49 56 39 51 41 55 47 11% 13% Doctoral-Research 5 2 2 2 2 6 2 2 - 3 -25% -57% Total 89 76 90 87 108 82 99 75 129 99 31% 38%
Note: Degrees/Certificates awarded summer through spring
Table 5.13: Annual Degrees/Certificates Awarded by Major and Gender - College of Urban Affairs
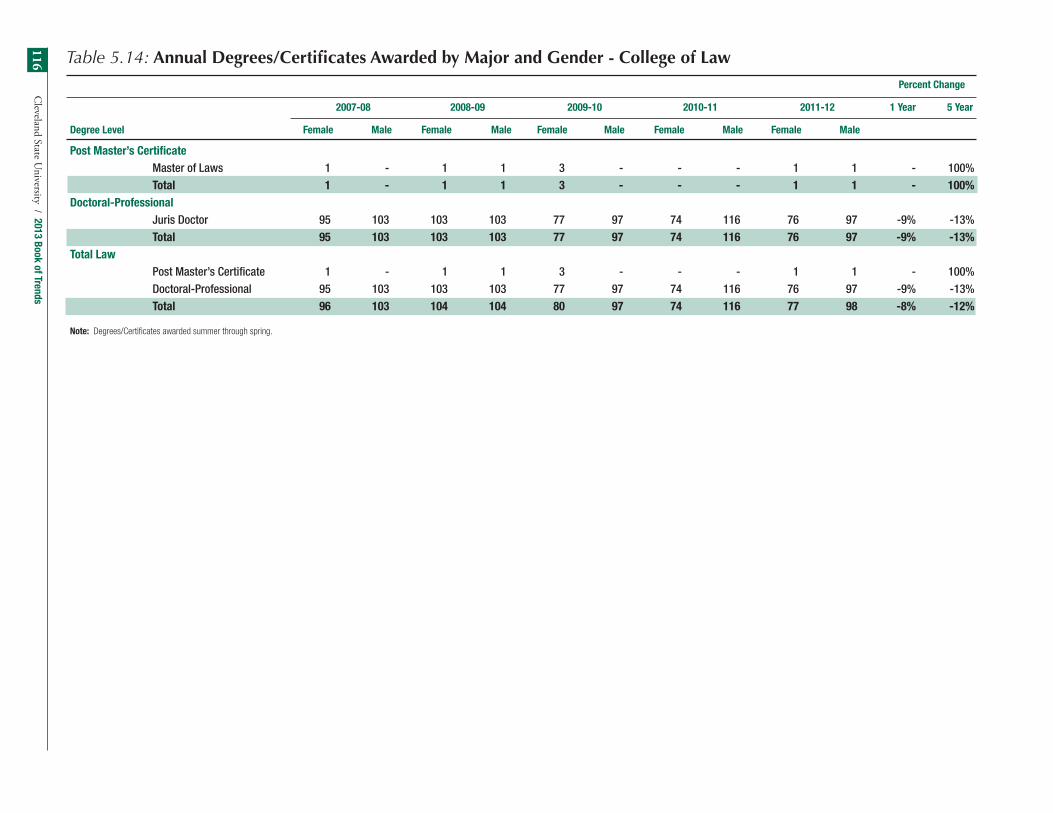
Cleveland State U
niversity / 2013 Book of Trends116
Percent Change
2007-08 2008-09 2009-10 2010-11 2011-12 1 Year 5 Year
Degree Level Female Male Female Male Female Male Female Male Female Male
Post Master’s Certificate Master of Laws 1 - 1 1 3 - - - 1 1 - 100% Total 1 - 1 1 3 - - - 1 1 - 100%Doctoral-Professional Juris Doctor 95 103 103 103 77 97 74 116 76 97 -9% -13% Total 95 103 103 103 77 97 74 116 76 97 -9% -13%Total Law Post Master’s Certificate 1 - 1 1 3 - - - 1 1 - 100% Doctoral-Professional 95 103 103 103 77 97 74 116 76 97 -9% -13% Total 96 103 104 104 80 97 74 116 77 98 -8% -12%
Note: Degrees/Certificates awarded summer through spring.
Table 5.14: Annual Degrees/Certificates Awarded by Major and Gender - College of Law
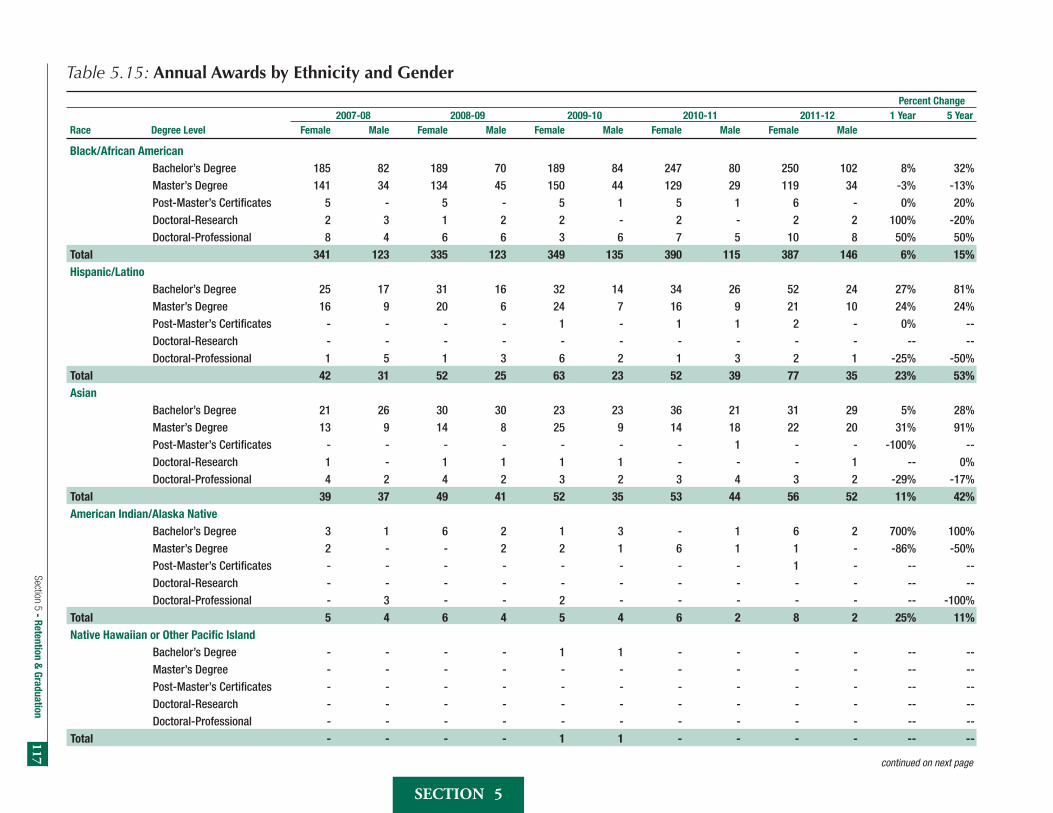
117Section 5 - Retention &
Graduation
Section 5
Percent Change 2007-08 2008-09 2009-10 2010-11 2011-12 1 Year 5 YearRace Degree Level Female Male Female Male Female Male Female Male Female Male
Black/African American Bachelor’s Degree 185 82 189 70 189 84 247 80 250 102 8% 32% Master’s Degree 141 34 134 45 150 44 129 29 119 34 -3% -13% Post-Master’s Certificates 5 - 5 - 5 1 5 1 6 - 0% 20% Doctoral-Research 2 3 1 2 2 - 2 - 2 2 100% -20% Doctoral-Professional 8 4 6 6 3 6 7 5 10 8 50% 50%Total 341 123 335 123 349 135 390 115 387 146 6% 15%Hispanic/Latino Bachelor’s Degree 25 17 31 16 32 14 34 26 52 24 27% 81% Master’s Degree 16 9 20 6 24 7 16 9 21 10 24% 24% Post-Master’s Certificates - - - - 1 - 1 1 2 - 0% -- Doctoral-Research - - - - - - - - - - -- -- Doctoral-Professional 1 5 1 3 6 2 1 3 2 1 -25% -50%Total 42 31 52 25 63 23 52 39 77 35 23% 53%Asian Bachelor’s Degree 21 26 30 30 23 23 36 21 31 29 5% 28% Master’s Degree 13 9 14 8 25 9 14 18 22 20 31% 91% Post-Master’s Certificates - - - - - - - 1 - - -100% -- Doctoral-Research 1 - 1 1 1 1 - - - 1 -- 0% Doctoral-Professional 4 2 4 2 3 2 3 4 3 2 -29% -17%Total 39 37 49 41 52 35 53 44 56 52 11% 42%American Indian/Alaska Native Bachelor’s Degree 3 1 6 2 1 3 - 1 6 2 700% 100% Master’s Degree 2 - - 2 2 1 6 1 1 - -86% -50% Post-Master’s Certificates - - - - - - - - 1 - -- -- Doctoral-Research - - - - - - - - - - -- -- Doctoral-Professional - 3 - - 2 - - - - - -- -100%Total 5 4 6 4 5 4 6 2 8 2 25% 11%Native Hawaiian or Other Pacific Island Bachelor’s Degree - - - - 1 1 - - - - -- -- Master’s Degree - - - - - - - - - - -- -- Post-Master’s Certificates - - - - - - - - - - -- -- Doctoral-Research - - - - - - - - - - -- -- Doctoral-Professional - - - - - - - - - - -- --Total - - - - 1 1 - - - - -- --
Table 5.15: Annual Awards by Ethnicity and Gender
continued on next page

Cleveland State U
niversity / 2013 Book of Trends118
continued from previous page Percent Change
2007-08 2008-09 2009-10 2010-11 2011-12 1 Year 5 Year
Race Degree Level Female Male Female Male Female Male Female Male Female Male
Two or More Races Bachelor’s Degree - - - - 3 - 9 3 5 3 -33% -- Master’s Degree - - - - 2 2 - - 3 5 -- -- Post-Master’s Certificates - - - - - - - - - - -- -- Doctoral-Research - - - - - - - - - - -- -- Doctoral-Professional - - - - - - - 1 - - -100% --Total - - - - 5 2 9 4 8 8 23% --Total Minority* Bachelor’s Degree 234 126 256 118 249 125 326 131 344 160 10% 40% Master’s Degree 172 52 168 61 203 63 165 57 166 69 6% 5% Post-Master’s Certificates 5 - 5 - 6 1 6 3 9 - 0% 80% Doctoral-Research 3 3 2 3 3 1 2 - 2 3 150% -17% Doctoral-Professional 13 14 11 11 14 10 11 13 15 11 8% -4%Total 427 195 442 193 475 200 510 204 536 243 9% 25%Non-Resident Alien Bachelor’s Degree 9 24 19 31 20 27 20 22 22 29 21% 55% Master’s Degree 84 142 74 146 60 82 68 132 96 153 25% 10% Post-Master’s Certificates - - - 1 1 - - - - 1 -- -- Doctoral-Research 6 13 7 13 11 15 12 9 5 10 -29% -21% Doctoral-Professional - 2 1 1 1 3 2 1 - - -100% -100%Total 99 181 101 192 93 127 102 164 123 193 19% 13%Unknown Bachelor’s Degree 60 66 79 43 60 49 60 54 69 58 11% 1% Master’s Degree 78 69 69 49 107 66 76 48 77 47 0% -16% Post-Master’s Certificates - - 2 - - 1 1 - 1 1 100% -- Doctoral-Research 1 - - - - 1 2 - 2 1 50% 200% Doctoral-Professional 16 10 10 14 8 10 7 11 4 7 -39% -58%Total 155 145 160 106 175 127 146 113 153 114 3% -11%White Bachelor’s Degree 661 529 654 541 724 557 694 610 757 627 6% 16% Master’s Degree 524 257 483 290 501 312 489 343 491 364 3% 9% Post-Master’s Certificates 6 2 13 3 9 4 9 4 9 2 -15% 38% Doctoral-Research 10 7 12 13 8 11 7 14 4 8 -43% -29% Doctoral-Professional 66 77 81 77 54 74 76 100 79 88 -5% 17%Total 1,267 872 1,243 924 1,296 958 1,275 1,071 1,340 1,089 4% 14%
continued on next page
Table 5.15: Annual Awards by Ethnicity and Gender

119Section 5 - Retention &
Graduation
Section 5
continued from previous page Percent Change
2007-08 2008-09 2009-10 2010-11 2011-12 1 Year 5 Year
Race Degree Level Female Male Female Male Female Male Female Male Female Male
University Totals Bachelor’s Degree 964 745 1,008 733 1,053 758 1,100 817 1,192 874 8% 21% Master’s Degree 858 520 794 546 871 523 798 580 830 633 6% 6% Post-Master’s Certificates 11 2 20 4 16 6 16 7 19 4 0% 77% Doctoral-Research 20 23 21 29 22 28 23 23 13 22 -24% -19% Doctoral-Professional 95 103 103 103 77 97 96 125 98 106 -8% 3%Total 1,948 1,393 1,946 1,415 2,039 1,412 2,033 1,552 2,152 1,639 6% 13%
Note: Degrees/Certificates awarded summer through spring.
*Total Minority excludes White, Unknown and Non-Resident Alien.
Table 5.15: Annual Awards by Ethnicity and Gender

Cleveland State U
niversity / 2013 Book of Trends120 Table 5.16: University System of Ohio Accountability Measures Access Goal #4 - Associate and Bachelor’s Degrees
Awarded to First Generation College Students Total First Generation Degrees Total Associates & Bachelors Degrees % First Generation of Total Associates & Bachelors Degrees
Institution FY 2007 FY 2008 FY 2009 FY 2010 FY 2011 FY 2007 FY 2008 FY 2009 FY 2010 FY 2011 FY 2007 FY 2008 FY 2009 FY 2010 FY 2011
University Main and Regional Campuses Bowling Green 1,003 1,110 1,034 975 1,014 3,166 3,516 3,432 3,244 2,928 32% 32% 30% 30% 35%Central State University 72 76 70 81 82 169 170 182 212 228 43% 45% 38% 38% 36%Cleveland State University 747 720 701 766 855 1,770 1,695 1,741 1,810 1,919 42% 42% 40% 42% 45%Kent State University 1,785 1,790 1,934 1,875 1,991 4,582 4,595 4,710 4,703 4,985 39% 39% 41% 40% 40%Miami University 680 624 583 665 721 4,065 3,913 3,895 4,042 4,153 17% 16% 15% 16% 17%Ohio State University 2,461 2,509 2,599 2,504 2,661 9,776 9,700 10,112 10,403 11,300 25% 26% 26% 24% 24%Ohio University 1,274 1,295 1,306 1,349 1,567 4,522 4,631 4,537 4,666 5,318 28% 28% 29% 29% 29%Shawnee State University 363 235 276 276 273 692 502 589 578 561 52% 47% 47% 48% 49%University of Akron 1,149 1,097 1,134 1,176 1,433 2,765 2,674 2,860 2,995 3,411 42% 41% 40% 39% 42%University of Cincinnati 1,217 1,326 1,392 1,357 1,492 4,038 4,464 4,588 4,601 5,050 30% 30% 30% 29% 30%University of Toledo 964 835 856 808 930 2,858 2,591 2,639 2,521 2,839 34% 32% 32% 32% 33%Wright State University 789 859 791 849 876 2,218 2,344 2,189 2,264 2,230 36% 37% 36% 38% 39%Youngstown State University 719 778 712 801 769 1,641 1,703 1,651 1,698 1,669 44% 46% 43% 47% 46%
Selected Statewide Totals 13,223 13,254 13,388 13,482 14,664 42,262 42,498 43,125 43,737 46,591 31% 31% 31% 31% 31%
Source: Ohio Board of Regents - computed based on “Associate and Bachelor’s Degrees Awarded to First-Generation College Students” and Total Associate and Bachelor’s Degrees Awarded.
Note: The Ohio Board of Regents had not reported any new data for degrees awarded to first generation college students at the time of publication. As such, Table 5.16 has been re-printed unchanged from the 2012 Book of Trends.

Sec
tio
n
6
Book of Trends
Cleveland State University
2013
Selected Strategic Indicators –Academic & Administrative Programs
6

Cleveland State University / 2013 Book of Trends122
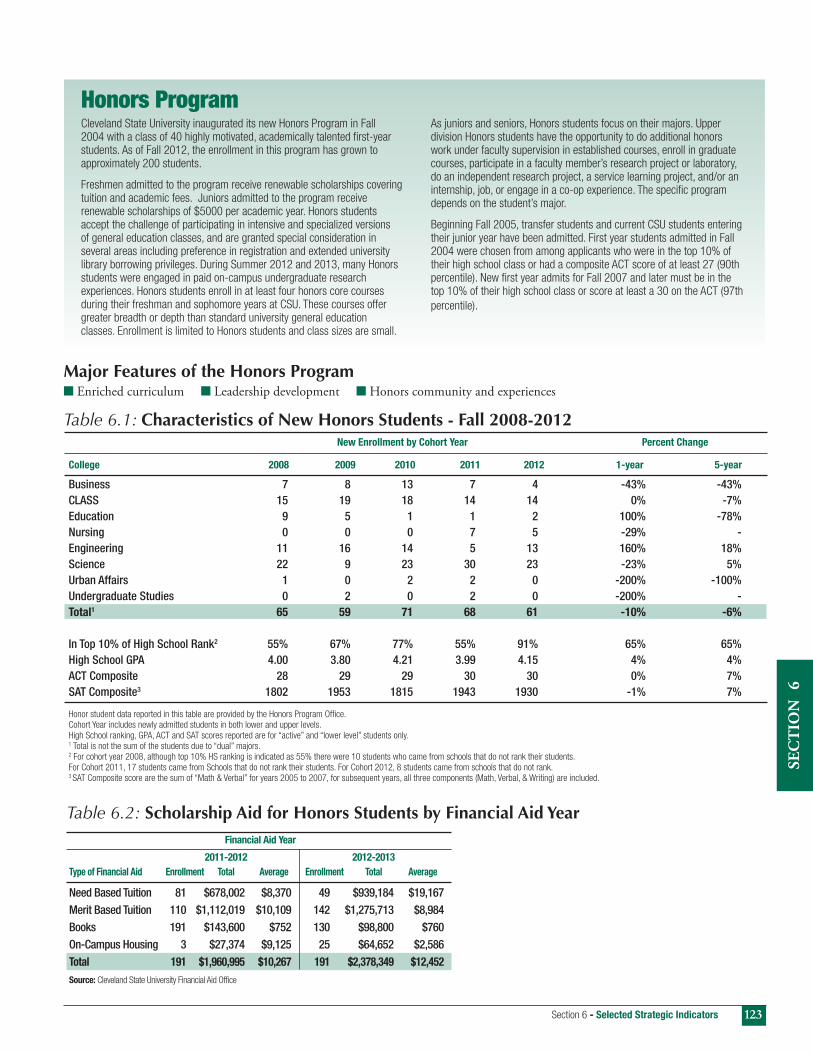
Section 6 - Selected Strategic Indicators
Sec
tio
n
6
123
Honors Program
New Enrollment by Cohort Year Percent Change
College 2008 2009 2010 2011 2012 1-year 5-year
Business 7 8 13 7 4 -43% -43%CLASS 15 19 18 14 14 0% -7%Education 9 5 1 1 2 100% -78%Nursing 0 0 0 7 5 -29% -Engineering 11 16 14 5 13 160% 18%Science 22 9 23 30 23 -23% 5%Urban Affairs 1 0 2 2 0 -200% -100%Undergraduate Studies 0 2 0 2 0 -200% -Total1 65 59 71 68 61 -10% -6%
In Top 10% of High School Rank2 55% 67% 77% 55% 91% 65% 65%High School GPA 4.00 3.80 4.21 3.99 4.15 4% 4%ACT Composite 28 29 29 30 30 0% 7%SAT Composite3 1802 1953 1815 1943 1930 -1% 7%
Honor student data reported in this table are provided by the Honors Program Office. Cohort Year includes newly admitted students in both lower and upper levels. High School ranking, GPA, ACT and SAT scores reported are for “active” and “lower level” students only.1 Total is not the sum of the students due to “dual” majors. 2 For cohort year 2008, although top 10% HS ranking is indicated as 55% there were 10 students who came from schools that do not rank their students. For Cohort 2011, 17 students came from Schools that do not rank their students. For Cohort 2012, 8 students came from schools that do not rank. 3 SAT Composite score are the sum of “Math & Verbal” for years 2005 to 2007, for subsequent years, all three components (Math, Verbal, & Writing) are included.
Major Features of the Honors Programn Enriched curriculum n Leadership development n Honors community and experiences
Table 6.1: Characteristics of New Honors Students - Fall 2008-2012
Table 6.2: Scholarship Aid for Honors Students by Financial Aid YearFinancial Aid Year
2011-2012 2012-2013Type of Financial Aid Enrollment Total Average Enrollment Total Average
Need Based Tuition 81 $678,002 $8,370 49 $939,184 $19,167Merit Based Tuition 110 $1,112,019 $10,109 142 $1,275,713 $8,984Books 191 $143,600 $752 130 $98,800 $760On-Campus Housing 3 $27,374 $9,125 25 $64,652 $2,586Total 191 $1,960,995 $10,267 191 $2,378,349 $12,452Source: Cleveland State University Financial Aid Office
Cleveland State University inaugurated its new Honors Program in Fall 2004 with a class of 40 highly motivated, academically talented first-year students. As of Fall 2012, the enrollment in this program has grown to approximately 200 students.
Freshmen admitted to the program receive renewable scholarships covering tuition and academic fees. Juniors admitted to the program receive renewable scholarships of $5000 per academic year. Honors students accept the challenge of participating in intensive and specialized versions of general education classes, and are granted special consideration in several areas including preference in registration and extended university library borrowing privileges. During Summer 2012 and 2013, many Honors students were engaged in paid on-campus undergraduate research experiences. Honors students enroll in at least four honors core courses during their freshman and sophomore years at CSU. These courses offer greater breadth or depth than standard university general education classes. Enrollment is limited to Honors students and class sizes are small.
As juniors and seniors, Honors students focus on their majors. Upper division Honors students have the opportunity to do additional honors work under faculty supervision in established courses, enroll in graduate courses, participate in a faculty member’s research project or laboratory, do an independent research project, a service learning project, and/or an internship, job, or engage in a co-op experience. The specific program depends on the student’s major.
Beginning Fall 2005, transfer students and current CSU students entering their junior year have been admitted. First year students admitted in Fall 2004 were chosen from among applicants who were in the top 10% of their high school class or had a composite ACT score of at least 27 (90th percentile). New first year admits for Fall 2007 and later must be in the top 10% of their high school class or score at least a 30 on the ACT (97th percentile).
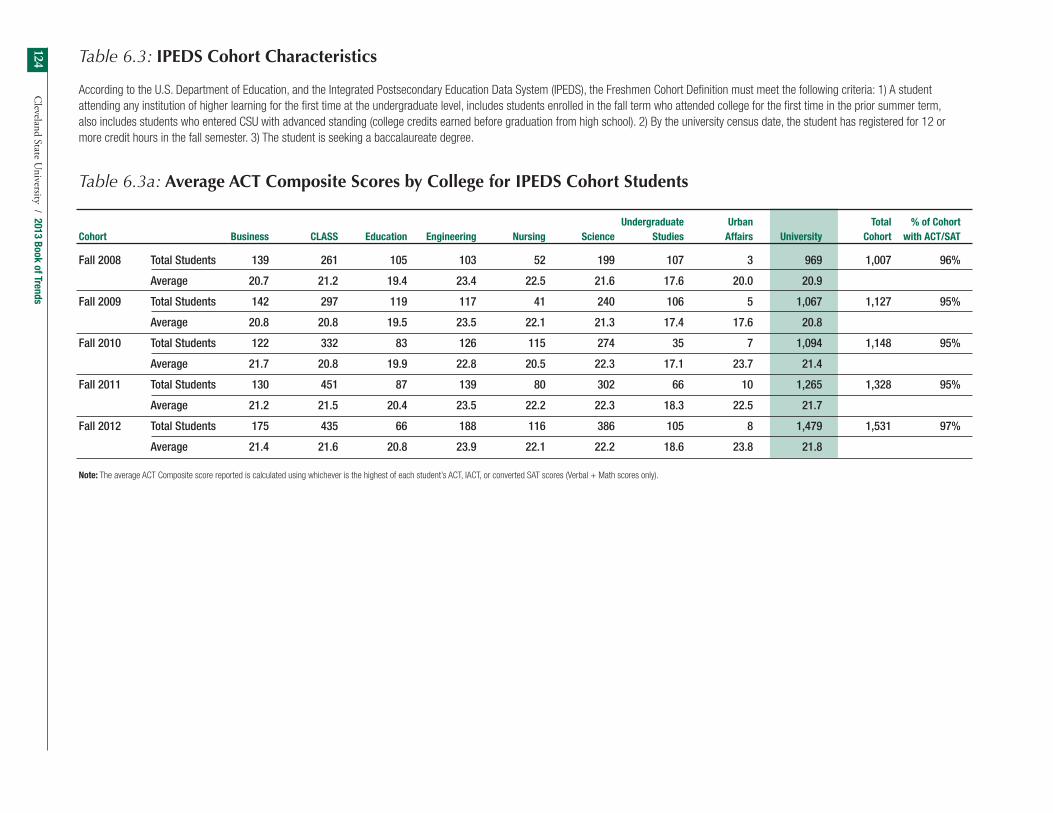
Cleveland State U
niversity / 2013 Book of Trends124 Table 6.3: IPEDS Cohort Characteristics
According to the U.S. Department of Education, and the Integrated Postsecondary Education Data System (IPEDS), the Freshmen Cohort Definition must meet the following criteria: 1) A student attending any institution of higher learning for the first time at the undergraduate level, includes students enrolled in the fall term who attended college for the first time in the prior summer term, also includes students who entered CSU with advanced standing (college credits earned before graduation from high school). 2) By the university census date, the student has registered for 12 or more credit hours in the fall semester. 3) The student is seeking a baccalaureate degree.
Table 6.3a: Average ACT Composite Scores by College for IPEDS Cohort Students Undergraduate Urban Total % of CohortCohort Business CLASS Education Engineering Nursing Science Studies Affairs University Cohort with ACT/SAT
Fall 2008 Total Students 139 261 105 103 52 199 107 3 969 1,007 96%
Average 20.7 21.2 19.4 23.4 22.5 21.6 17.6 20.0 20.9
Fall 2009 Total Students 142 297 119 117 41 240 106 5 1,067 1,127 95%
Average 20.8 20.8 19.5 23.5 22.1 21.3 17.4 17.6 20.8
Fall 2010 Total Students 122 332 83 126 115 274 35 7 1,094 1,148 95%
Average 21.7 20.8 19.9 22.8 20.5 22.3 17.1 23.7 21.4
Fall 2011 Total Students 130 451 87 139 80 302 66 10 1,265 1,328 95%
Average 21.2 21.5 20.4 23.5 22.2 22.3 18.3 22.5 21.7
Fall 2012 Total Students 175 435 66 188 116 386 105 8 1,479 1,531 97%
Average 21.4 21.6 20.8 23.9 22.1 22.2 18.6 23.8 21.8
Note: The average ACT Composite score reported is calculated using whichever is the highest of each student’s ACT, IACT, or converted SAT scores (Verbal + Math scores only).

Section 6 - Selected Strategic Indicators
Sec
tio
n
6
125
Table 6.3b: Fall IPEDS Cohort by Gender, 5 Year Trend
Fall 2008 Fall 2009 Fall 2010 Fall 2011 Fall 2012
Gender N % N % N % N % N %
Female 549 55% 601 53% 615 54% 742 56% 678 44%Male 458 45% 526 47% 533 46% 586 44% 853 56%COHORT 1,007 100% 1,127 100% 1,148 100% 1,328 100% 1,531 100%
Table 6.3c: Fall IPEDS Cohort by Ethnicity, 5 Year Trend Fall 2008 Fall 2009 Fall 2010 Fall 2011 Fall 2012
Ethnicity N % N % N % N % N %
White 617 61% 662 59% 704 61% 861 65% 973 64%African American 201 20% 247 22% 224 20% 266 20% 291 19%Hispanic 61 6% 51 5% 75 7% 62 5% 91 6%Asian 32 3% 27 2% 26 2% 28 2% 49 3%Native Hawaiian/ 0 0% 0 0% 1 0% 0 0% 2 0% Other Pacific IslanderNative American 5 0% 7 1% 4 0% 1 0% 5 0%Two or More Races 0 0% 0 0% 15 1% 64 5% 65 4%Minority Total 299 30% 332 29% 345 30% 421 32% 503 33%Non-Resident Alien 17 2% 22 2% 31 3% 23 2% 33 2%Unknown 74 7% 111 10% 68 6% 23 2% 22 1%COHORT 1,007 100% 1,127 100% 1,148 100% 1,328 100% 1,531 100%
Table 6.3d: Fall IPEDS Cohort by Age Group, 5 Year Trend Fall 2008 Fall 2009 Fall 2010 Fall 2011 Fall 2012
Age N % N % N % N % N %
Under 18 76 8% 73 6% 77 7% 67 5% 90 6%18-19 843 84% 963 85% 984 86% 1,162 88% 1,372 90%20-21 39 4% 24 2% 32 3% 33 2% 21 1%22-24 23 2% 30 3% 18 2% 27 2% 16 1%25-29 20 2% 19 2% 24 2% 20 2% 19 1%30 and above 6 1% 18 2% 13 1% 19 1% 13 1%COHORT 1,007 100% 1,127 100% 1,148 100% 1,328 100% 1,531 100%
Table 6.3e: Fall IPEDS Cohort by Selected Major, 5 Year Trend Fall 2008 Fall 2009 Fall 2010 Fall 2011 Fall 2012
Academic Major Type N % N % N % N % N %
Major Selected 885 88% 950 84% 1,001 87% 1,095 82% 1,313 86%Major Undeclared 122 12% 177 16% 147 13% 233 18% 218 14%COHORT 1,007 100% 1,127 100% 1,148 100% 1,328 100% 1,531 100%
Table 6.3f: Fall IPEDS Cohort by Notable Student Groups, 5 Year Trend Fall 2008 Fall 2009 Fall 2010 Fall 2011 Fall 2012
Student Groups N % N % N % N % N %
Living in 322 32% 353 31% 353 31% 523 39% 568 37% University Housing Honors 39 4% 28 2% 47 4% 40 3% 41 3%Ohio Resident 936 93% 1,041 92% 1,048 91% 1,226 92% 1,226 80%Pell Grant Recipient 447 44% 630 56% 617 54% 685 52% 797 52%Taking Developmental Class 520 52% 516 46% 369 32% 412 31% 497 32%COHORT 1,007 1,127 1,148 1,328 1,531 Note: Groups are not exclusive; for instance, a single student might be an Ohio Resident, Living in University Housing and be in Honors.

Cleveland State U
niversity / 2013 Book of Trends126 Table 6.4: Average High School GPA by College for IPEDS Cohort Students, 5 Year Trend
Undergraduate Urban Total % of CohortCohort Business CLASS Education Engineering Nursing Science Studies Affairs University Cohort with HS GPA
Fall 2008 Total Students 144 264 107 106 52 202 110 3 988 1,007 98%
Average 3.10 3.15 3.03 3.39 3.48 3.27 2.55 2.80 3.13
Fall 2009 Total Students 148 306 118 122 41 242 113 5 1,095 1,127 97%
Average 3.07 3.11 3.03 3.35 3.38 3.36 2.47 3.10 3.12
Fall 2010 Total Students 129 339 84 134 117 279 41 9 1,132 1,148 99%
Average 3.21 3.10 3.06 3.39 3.30 3.40 2.67 3.23 3.22
Fall 2011 Total Students 134 456 89 146 82 309 75 11 1,302 1,328 98%
Average 3.13 3.14 3.08 3.35 3.48 3.33 2.59 3.05 3.19
Fall 2012 Total Students 181 439 67 201 116 389 106 9 1,508 1,531 98%
Average 3.10 3.14 3.22 3.45 3.45 3.29 2.65 3.37 3.21
Note: High School GPAs between ‘greater than 0’ and ‘less or equal to 5.0’ were used to calculate the average. GEDs were excluded.
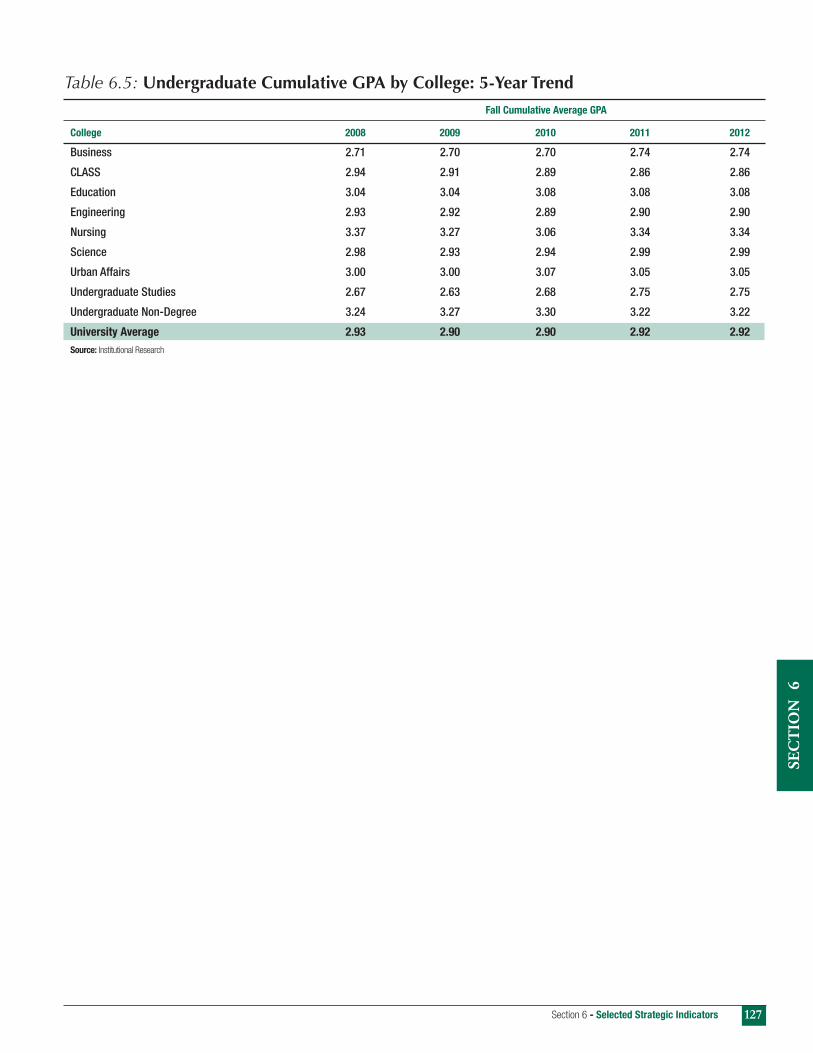
Section 6 - Selected Strategic Indicators
Sec
tio
n
6
127
Fall Cumulative Average GPA
College 2008 2009 2010 2011 2012
Business 2.71 2.70 2.70 2.74 2.74
CLASS 2.94 2.91 2.89 2.86 2.86
Education 3.04 3.04 3.08 3.08 3.08
Engineering 2.93 2.92 2.89 2.90 2.90
Nursing 3.37 3.27 3.06 3.34 3.34
Science 2.98 2.93 2.94 2.99 2.99
Urban Affairs 3.00 3.00 3.07 3.05 3.05
Undergraduate Studies 2.67 2.63 2.68 2.75 2.75
Undergraduate Non-Degree 3.24 3.27 3.30 3.22 3.22
University Average 2.93 2.90 2.90 2.92 2.92Source: Institutional Research
Table 6.5: Undergraduate Cumulative GPA by College: 5-Year Trend

Cleveland State University / 2013 Book of Trends128
Table 6.6a: Fall 2012 Top 15 Majors by Academic Level
Undergraduate: Graduate (excluding Law):Description Total Description Total
Psychology-PSY 593 Business Administration-MBA 617
Business Administration-BADM 483 Curriculum and Instruction-C&I 445
Biology-BIO 445 Social Work-GSW 246
Criminology-CRIM 340 Financial Accounting Audit-ACCAUDIT 243
Accounting-ACT 330 Electrical Engineering-ELG 110
Health Sciences BS-HSCBS 322 Doctor of Physical Therapy-DPT 104
Mechanical Engineering-MCE 228 Master of Occupational Therapy-MOT 103
Nursing, BSN/RN-NUB 225 Public Administration-MPA 99
Marketing-MKT 211 Adult Learning and Development-ALD 99
English-ENG 198 Clinical Mental Health Cnsling-CAC 91
Journalism & Promotional Comm-JRN/PROMOT 198 Computer and Information-GCS 91
Health Science Pre-PhysThrpy-HSTHP 196 English-GEG 78
Computer & Information Science-CIS 196 Health Science-GHE 76
Early Childhood Education-ECE 193 Labor Relations and Huma-GLR 73
Communication-COM 188 Regulatory Biology-DBI 69
Table 6.6b: Fall 2012 Top 15 Departments by Academic Level
Undergraduate: Graduate (excluding Law):Description Total Description Total
Health Sciences 854 Business Administration 650
Psychology 724 Teacher Education 445
Biology, Geology & Environmental Science 664 Health Sciences 349
Communication 602 CASAL 312
Business Administration 546 Accounting 287
Sociology 525 Urban Studies 257
Teacher Education 444 Social Work 246
Accounting 372 Electrical & Computer Engineering 182
Computer & Information Science 348 Health And Physical Education 124
Urban Studies 330 Doctoral (Education) 112
Nursing 321 Chemistry 106
Electrical & Computer Engineering 251 Biology, Geology & Environmental Science 103
Political Science/IR 244 Psychology 101
Mechanical Engineering 243 English 98
Social Work 219 Computer & Information Science 92
Chemical & Biomedical Engineering 92
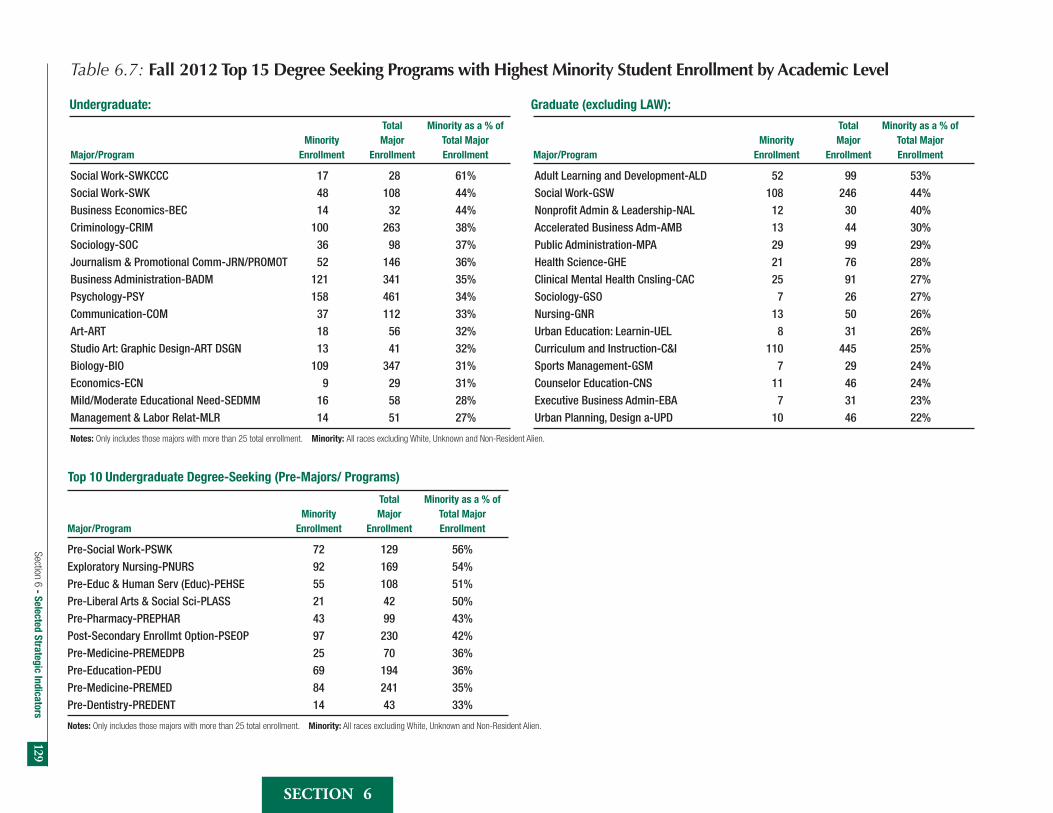
Section 6 - Selected Strategic Indicators
Section 6
129
Total Minority as a % of Total Minority as a % of Minority Major Total Major Minority Major Total Major Major/Program Enrollment Enrollment Enrollment Major/Program Enrollment Enrollment Enrollment
Social Work-SWKCCC 17 28 61% Adult Learning and Development-ALD 52 99 53%Social Work-SWK 48 108 44% Social Work-GSW 108 246 44%Business Economics-BEC 14 32 44% Nonprofit Admin & Leadership-NAL 12 30 40%Criminology-CRIM 100 263 38% Accelerated Business Adm-AMB 13 44 30%Sociology-SOC 36 98 37% Public Administration-MPA 29 99 29%Journalism & Promotional Comm-JRN/PROMOT 52 146 36% Health Science-GHE 21 76 28%Business Administration-BADM 121 341 35% Clinical Mental Health Cnsling-CAC 25 91 27%Psychology-PSY 158 461 34% Sociology-GSO 7 26 27%Communication-COM 37 112 33% Nursing-GNR 13 50 26%Art-ART 18 56 32% Urban Education: Learnin-UEL 8 31 26%Studio Art: Graphic Design-ART DSGN 13 41 32% Curriculum and Instruction-C&I 110 445 25%Biology-BIO 109 347 31% Sports Management-GSM 7 29 24%Economics-ECN 9 29 31% Counselor Education-CNS 11 46 24%Mild/Moderate Educational Need-SEDMM 16 58 28% Executive Business Admin-EBA 7 31 23%Management & Labor Relat-MLR 14 51 27% Urban Planning, Design a-UPD 10 46 22%
Notes: Only includes those majors with more than 25 total enrollment. Minority: All races excluding White, Unknown and Non-Resident Alien.
Table 6.7: Fall 2012 Top 15 Degree Seeking Programs with Highest Minority Student Enrollment by Academic Level Undergraduate: Graduate (excluding LAW):
Total Minority as a % of Minority Major Total Major Major/Program Enrollment Enrollment Enrollment
Pre-Social Work-PSWK 72 129 56%Exploratory Nursing-PNURS 92 169 54%Pre-Educ & Human Serv (Educ)-PEHSE 55 108 51%Pre-Liberal Arts & Social Sci-PLASS 21 42 50%Pre-Pharmacy-PREPHAR 43 99 43%Post-Secondary Enrollmt Option-PSEOP 97 230 42%Pre-Medicine-PREMEDPB 25 70 36%Pre-Education-PEDU 69 194 36%Pre-Medicine-PREMED 84 241 35%Pre-Dentistry-PREDENT 14 43 33%
Notes: Only includes those majors with more than 25 total enrollment. Minority: All races excluding White, Unknown and Non-Resident Alien.
Top 10 Undergraduate Degree-Seeking (Pre-Majors/ Programs)
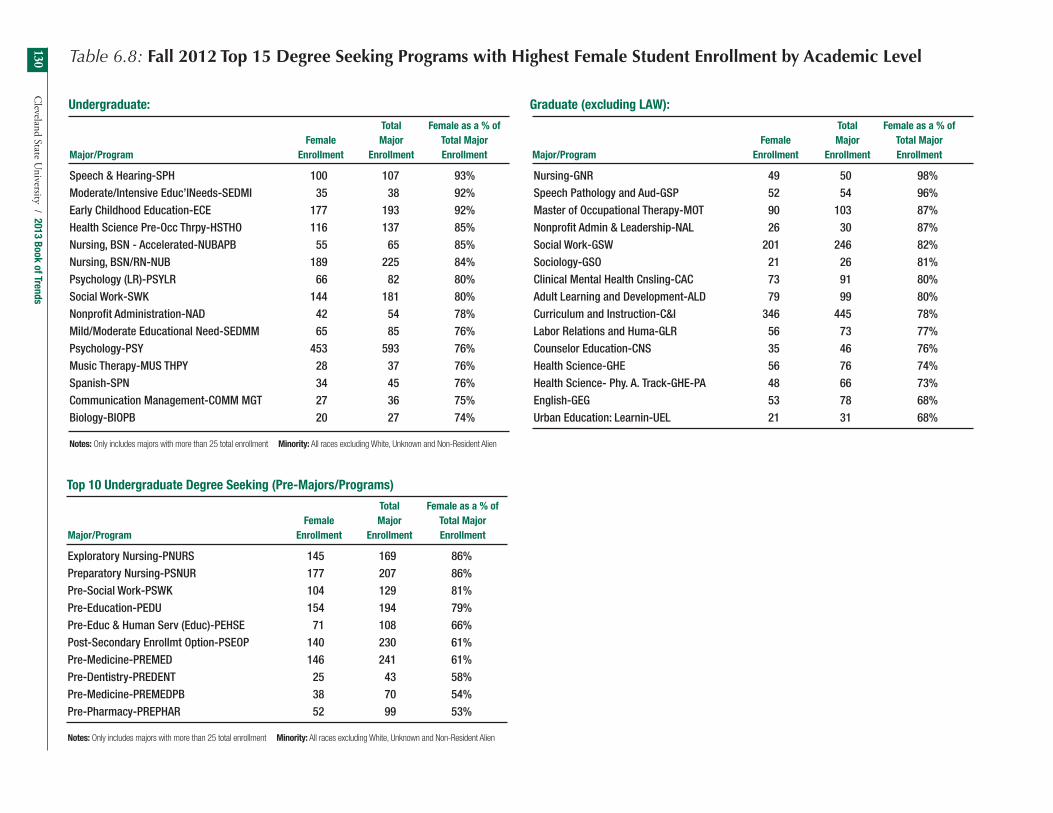
Cleveland State U
niversity / 2013 Book of Trends130
Total Female as a % of Total Female as a % of Female Major Total Major Female Major Total Major Major/Program Enrollment Enrollment Enrollment Major/Program Enrollment Enrollment Enrollment
Speech & Hearing-SPH 100 107 93% Nursing-GNR 49 50 98%Moderate/Intensive Educ’lNeeds-SEDMI 35 38 92% Speech Pathology and Aud-GSP 52 54 96%Early Childhood Education-ECE 177 193 92% Master of Occupational Therapy-MOT 90 103 87%Health Science Pre-Occ Thrpy-HSTHO 116 137 85% Nonprofit Admin & Leadership-NAL 26 30 87%Nursing, BSN - Accelerated-NUBAPB 55 65 85% Social Work-GSW 201 246 82%Nursing, BSN/RN-NUB 189 225 84% Sociology-GSO 21 26 81%Psychology (LR)-PSYLR 66 82 80% Clinical Mental Health Cnsling-CAC 73 91 80%Social Work-SWK 144 181 80% Adult Learning and Development-ALD 79 99 80%Nonprofit Administration-NAD 42 54 78% Curriculum and Instruction-C&I 346 445 78%Mild/Moderate Educational Need-SEDMM 65 85 76% Labor Relations and Huma-GLR 56 73 77%Psychology-PSY 453 593 76% Counselor Education-CNS 35 46 76%Music Therapy-MUS THPY 28 37 76% Health Science-GHE 56 76 74%Spanish-SPN 34 45 76% Health Science- Phy. A. Track-GHE-PA 48 66 73%Communication Management-COMM MGT 27 36 75% English-GEG 53 78 68%Biology-BIOPB 20 27 74% Urban Education: Learnin-UEL 21 31 68%
Notes: Only includes majors with more than 25 total enrollment Minority: All races excluding White, Unknown and Non-Resident Alien
Undergraduate: Graduate (excluding LAW):
Total Female as a % of Female Major Total Major Major/Program Enrollment Enrollment Enrollment
Exploratory Nursing-PNURS 145 169 86%Preparatory Nursing-PSNUR 177 207 86%Pre-Social Work-PSWK 104 129 81%Pre-Education-PEDU 154 194 79%Pre-Educ & Human Serv (Educ)-PEHSE 71 108 66%Post-Secondary Enrollmt Option-PSEOP 140 230 61%Pre-Medicine-PREMED 146 241 61%Pre-Dentistry-PREDENT 25 43 58%Pre-Medicine-PREMEDPB 38 70 54%Pre-Pharmacy-PREPHAR 52 99 53%
Notes: Only includes majors with more than 25 total enrollment Minority: All races excluding White, Unknown and Non-Resident Alien
Top 10 Undergraduate Degree Seeking (Pre-Majors/Programs)
Table 6.8: Fall 2012 Top 15 Degree Seeking Programs with Highest Female Student Enrollment by Academic Level

Section 6 - Selected Strategic Indicators
Section 6
131
Percent Change College 2008 2009 2010 2011 2012 1-Year 5-Year Sections Avg. Size Sections Avg. Size Sections Avg. Size Sections Avg. Size Sections Avg. Size Sections Avg. Size Sections Avg. Size
Business Day 33 16 38 17 44 17 41 17 42 15 2% -11% 27% -4%Evening 88 20 88 21 87 22 91 19 88 19 -3% -3% 0% -9%Other* 26 25 30 28 26 28 29 27 36 22 24% -18% 38% -12%Total 147 20 156 21 157 21 161 20 166 19 3% -5% 13% -6%
CLASS Day 87 16 77 17 74 18 52 23 40 22 -23% -6% -54% 37%Evening 44 15 43 14 46 16 20 19 22 20 10% 2% -50% 34%Other* 18 18 22 23 33 24 54 23 62 25 15% 7% 244% 34%Total 149 16 142 17 153 18 126 23 124 22 -2% -3% -17% 38%
Education Day 68 16 49 21 29 17 22 19 25 13 14% -33% -63% -23% Evening 81 16 66 17 63 15 50 16 50 13 0% -17% -38% -16% Other* 47 17 60 19 69 21 75 20 80 17 7% -18% 70% -2% Total 196 16 175 19 161 18 147 18 155 17 5% -9% -21% 4%
Nursing Day - - - - 7 40 2 68 3 64 50% -5% - -Evening - - - - - - - - - - - - - -Other* - - - - 7 15 8 19 4 13 -50% -32% - -Total - - - - 14 27 10 29 7 35 -30% 22% - -
Engineering Day 2 24 - - 1 17 3 14 5 23 67% 68% 150% -4%Evening 3 21 1 5 4 30 2 32 5 29 150% -8% 67% 36%Other* 1 5 - - - - - - 2 - - - 100% -100%Total 6 20 1 5 5 27 5 21 12 23 140% 10% 100% 17%
Science Day 72 22 67 25 87 24 76 27 80 23 5% -14% 11% 3% Evening 25 17 25 19 19 19 15 20 15 17 0% -16% -40% -1% Other* 35 18 28 18 17 24 34 21 37 22 9% 6% 6% 21% Total 132 20 120 22 123 23 125 24 132 23 6% -7% 0% 13%
Urban Affairs Day 3 51 - - - - - - - - - - -100% -100%Evening 11 25 8 19 9 20 10 22 11 23 10% 5% 0% -8%Other* 5 41 18 39 17 35 20 35 23 26 15% -26% 360% -36%Total 19 33 26 33 26 30 30 31 34 21 13% -31% 79% -36%
Table 6.9: Summer Class Section and Average Class Size by Time of Day and College: 5-Year Trend
(continued on next page)

Cleveland State U
niversity / 2013 Book of Trends132 Table 6.9: Summer Class Section and Average Class Size by Time of Day and College: 5-Year Trend
Percent Change College 2008 2009 2010 2011 2012 1-Year 5-Year Sections Avg. Size Sections Avg. Size Sections Avg. Size Sections Avg. Size Sections Avg. Size Sections Avg. Size Sections Avg. Size
Law Day 1 34 1 24 2 8 3 25 3 30 0% 23% 200% -11%Evening 9 20 8 25 8 21 7 19 7 15 0% -19% -22% -25%Other* 2 31 2 19 2 28 3 25 2 24 -33% -5% 0% -23%Total 12 23 11 23 12 20 13 22 12 21 -8% -6% 0% -12%
Undergraduate Studies Day - - - - - - - - - - - - - -Evening - - - - - - - - - - - - - -Other* - - - - - - - - - - - - - -Total - - - - - - - - - - - - - -
Honors Day - - - - - - - - - - - - - -Evening - - - - - - - - - - - - - -Other* - - - - - - - - - - - - - -Total - - - - - - - - - - - - - -
University Total Day 266 18 232 17 244 20 199 23 198 21 -1% -9% -26% 15% Evening 261 18 239 16 236 19 195 19 198 18 2% -4% -24% 1% Other* 134 20 160 23 171 24 223 23 246 21 10% -8% 84% 7% Total 661 18 631 20 651 21 617 22 642 20 4% -7% -3% 10%
Notes: This table only reflects lecture, seminar and studio courses with 5 or more students enrolled.
*‘Other’ includes weekends (Friday after 4pm, Saturday and Sunday) and sections with no class time. Cross listed courses are counted once only.
Day, Evening and Weekends are determined by meeting time. Some web courses may be included due to available meeting time.
Day: Monday – Friday 7 am to 4 pm.
Evening: Monday – Thursday 4 pm to 12 am.
.
(continued from previous page)

Section 6 - Selected Strategic Indicators
Section 6
133
Percent Change College 2008 2009 2010 2011 2012 1-Year 5-Year Sections Avg. Size Sections Avg. Size Sections Avg. Size Sections Avg. Size Sections Avg. Size Sections Avg. Size Sections Avg. Size
Business Day 91 32 89 33 94 34 96 33 88 33 -8% 2% -3% 4%Evening 129 25 143 25 156 25 156 24 152 24 -3% 0% 18% -2%Other* 49 26 50 28 47 30 45 31 59 25 31% -20% 20% -6%Total 269 27 282 28 297 29 297 28 299 27 1% -3% 11% -1%
CLASS Day 355 27 360 29 365 29 336 30 352 28 5% -7% -1% 5% Evening 159 19 138 23 153 24 148 23 140 26 -5% 9.9% -12% 32% Other* 42 18 43 19 51 19 61 22 51 26 -16% 19% 21% 45% Total 556 24 541 27 569 27 545 28 543 28 0% 2% -2% 17%
Education Day 100 22 83 24 54 22 48 23 43 23 -10% 0% -57% 7%Evening 141 18 118 21 114 20 100 21 105 18 5% -14% -26% 2%Other* 69 17 72 20 71 21 74 22 82 19 11% -13% 19% 9%Total 310 19 273 22 239 21 222 22 230 21 4% -2% -26% 12%
Nursing Day - - - - 13 57 14 73 13 72 -7% -1% - -Evening - - - - - - - - - - - - - -Other* - - - - 11 19 13 15 12 17 -8% 11% - -Total - - - - 24 40 27 45 25 47 -7% 4% - -
Engineering Day 41 23 34 27 39 29 41 30 41 32 0% 7% 0% 40%Evening 60 17 59 20 72 18 64 21 64 22 0% 2% 7% 25%Other* 2 6 5 13 10 11 8 17 3 14 -63% -18% 50% 133%Total 103 19 98 22 121 21 113 24 108 25 -4% 4% 5% 30%
Science Day 201 39 218 41 217 41 201 47 219 42 9% -10% 9% 9%Evening 82 28 90 29 88 30 81 31 89 33 10% 9% 9% 20%Other* 43 22 42 23 37 23 43 27 41 31 -5% 15% -5% 39%Total 326 34 350 36 342 36 325 40 349 42 7% 5% 7% 24%
Table 6.10: Fall Section Enrollment by Time of Day and College: 5-Year Trend
(continued on next page)

Cleveland State U
niversity / 2013 Book of Trends134 Table 6.10: Fall Section Enrollment by Time of Day and College: 5-Year Trend
Percent Change College 2008 2009 2010 2011 2012 1-Year 5-Year Sections Avg. Size Sections Avg. Size Sections Avg. Size Sections Avg. Size Sections Avg. Size Sections Avg. Size Sections Avg. Size
Urban Affairs Day 11 30 10 34 8 45 11 39 13 32 18% -18% 18% 7% Evening 40 21 30 26 42 23 43 23 48 21 12% -11% 20% 1% Other* 25 41 28 43 31 42 29 44 23 43 -21% -2% -8% 7% Total 76 29 68 34 81 33 83 33 84 30 1% -8% 11% 5%
Law Day 51 35 48 35 48 34 50 29 41 28 -18% -4% -20% -19%Evening 45 22 45 22 43 20 38 21 41 20 8% -5% -9% -10%Other* 4 12 3 13 4 17 29 14 4 14 -86% 0% 0% 15%Total 100 28 96 28 95 27 117 25 86 23 -26% -7% -14% -16%
Undergraduate Studies Day 44 20 43 24 47 22 45 25 53 25 18% 0% 20% 23%Evening 3 8 4 8 3 13 3 18 2 23 -33% 23% -33% 181%Other* - - - - - - 0 - 2 20 - - - -Total 47 20 47 22 50 21 48 25 57 25 19% 0% 21% 27%
Honors Day 5 20 5 18 8 18 7 16 7 16 0% -1% 40% -18%Evening 0 0 1 11 - - - - - - - - - -Other* 1 10 1 18 0 0 1 24 1 20 0% -17% 0% 100%Total 6 18 7 17 8 18 8 17 8 16 0% -6% 33% -11%
University Total Day 899 30 890 30 893 32 849 34 870 21 2% -38% -3% -29%Evening 659 21 628 23 671 23 633 24 641 18 1% -24% -3% -16%Other* 235 23 244 19 262 25 303 26 278 21 -8% -18% 18% -5%Total 1,793 26 1,762 28 1,826 28 1,785 29 1,789 28 0% -2% 0% 11%
Notes: This table only reflects lecture, seminar and studio courses with 5 or more students enrolled.
*Other includes weekends (Friday after 4 pm, Saturday and Sunday) and sections with no class time. Cross listed courses are counted once only.
Day, Evening and Weekend courses are determined by meeting time. Some web courses may be included due to available meeting time.
Day: Monday – Friday 7 am to 4 pm.
Evening: Monday – Thursday 4 pm to 12 am.
(continued from previous page)

Section 6 - Selected Strategic Indicators
Section 6
135
Percent Change College 2009 2010 2011 2012 2013 1 Year 5 Year Sections Avg. Size Sections Avg. Size Sections Avg. Size Sections Avg. Size Sections Avg. Size Sections Avg. Size Sections Avg. Size
Business Day 81 33 91 34 93 31 87 32 82 34 -6% 5% 1% 4%Evening 131 25 135 27 160 24 159 23 153 25 -4% 9% 17% 0%Other* 39 24 40 29 42 27 46 26 52 25 13% -7% 33% 1%Total 251 27 266 30 295 27 292 26 287 28 -2% 4% 14% 0%
CLASS Day 323 28 326 29 335 28 308 30 329 30 7% 0% 2% 8%Evening 161 19 162 21 150 21 131 23 134 24 2% 5% -17% 27%Other* 44 18 48 19 61 23 52 26 61 24 17% -5% 39% 37%Total 528 24 536 26 546 25 491 28 524 28 7% 1% -1% 14%
Education Day 97 22 76 25 53 22 55 21 46 22 -16% 5% -53% 0%Evening 143 18 117 20 103 21 102 19 104 20 2% 2% -27% 11%Other* 75 17 75 22 69 24 77 22 84 22 9% -2% 12% 29%Total 315 19 268 22 225 22 234 20 234 21 0% 1% -26% 11%
Nursing Day - - - - 14 59 14 72 14 70 0% -2% - - Evening - - - - - - - - - - - - - - Other* - - - - 15 16 14 13 9 22 -36% 70% - - Total - - - - 29 36 28 42 23 53 -18% 25% - -
Engineering Day 41 21 42 23 44 24 43 27 48 28 12% 5% 17% 35%Evening 58 16 60 19 65 21 56 22 55 23 -2% 1% -5% 37%Other* 4 9 3 12 3 19 6 18 2 32 -67% 75% -50% 256%Total 103 18 105 21 112 22 105 24 105 25 0% 6% 2% 41%
Science Day 189 38 187 42 181 41 189 42 204 42 8% 0% 8% 10%Evening 101 24 89 31 96 30 87 31 87 31 0% -2% -14% 25%Other* 54 22 37 25 38 27 45 27 47 29 4% 9% -13% 33%Total 344 32 313 37 315 36 321 37 338 38 5% 1% -2% 18%
Table 6.11: Spring Section Enrollment by Time of Day and College: 5-Year Trend
(continued on next page)

Cleveland State U
niversity / 2013 Book of Trends136
Percent Change College 2009 2010 2011 2012 2013 1 Year 5 Year Sections Avg. Size Sections Avg. Size Sections Avg. Size Sections Avg. Size Sections Avg. Size Sections Avg. Size Sections Avg. Size
Urban Affairs Day 14 31 11 37 10 40 13 39 11 41 -15% 4% -21% 32% Evening 40 21 40 21 44 22 44 19 42 20 -5% 7% 5% -2% Other* 27 42 28 42 29 42 28 45 25 46 -11% 2% -7% 8% Total 81 30 79 31 83 31 85 31 78 31 -8% 2% -4% 5%
Law Day 47 34 50 33 46 34 44 31 41 28 -7% -10% -13% -16%Evening 44 21 40 21 39 19 39 21 28 19 -28% -10% -36% -12%Other* 5 27 3 23 4 30 2 19 4 27 100% 39% -20% -1%Total 96 28 93 27 89 27 85 26 73 25 -14% -7% -24% -12%
Undergraduate Studies Day 7 25 9 19 7 23 8 23 8 26 0% 11% 14% 4% Evening 1 27 1 29 1 18 - - 1 21 - - 0% -22% Other* - - - - - - - - - - - - - - Total 8 25 10 20 8 22 8 23 9 25 13% 8% 13% 1%
Honors Day 4 18 3 18 5 19.8 4 16 4 17 0% 10% 0% -6% Evening 0 0 - - - - - - - - - - - - Other* 2 30 3 15 2 16 3 13 - 0 -100% -100% -100% -100% Total 6 22 6 16 7 19 7 14 4 17 -43% 18% -33% -22%
University Total Day 803 30 795 30 788 32 765 33 787 34 3% 1% -2% 12%Evening 679 21 644 21 658 23 618 23 604 24 -2% 4% -11% 15%Other* 250 22 237 19 263 26 273 26 284 26 4% 2% 14% 19%Total 1,732 25 1,676 28 1,709 27 1,656 28 1,675 29 1% 2% -3% 14%
Notes: This table only reflects lecture, seminar and studio courses with 5 or more students enrolled.
*‘Other’ includes weekends (Friday after 4pm, Saturday and Sunday) and sections with no class time. Cross listed courses are counted once only.
Day, Evening and Weekends are determined by meeting time. Some web courses may be included due to available meeting time.
Day: Monday – Friday 7 am to 4 pm.
Evening: Monday – Thursday 4 pm to 12 am.
Table 6.11: Spring Section Enrollment by Time of Day and College: 5-Year Trend
(continued from previous page)

Section 6 - Selected Strategic Indicators
Section 6
137
Day Percent Change Evening & Weekends Percent Change Unknown* Percent Change College 2008 2009 2010 2011 2012 1-Year 5-Year 2008 2009 2010 2011 2012 1-Year 5-Year 2008 2009 2010 2011 2012 1-Year 5-Year
Business 54 59 64 56 48 -13% -10% 402 500 522 521 488 -6% 21% 77 94 113 102 131 28% 70%
CLASS 59 51 58 60 61 1% 4% 201 229 218 233 201 -14% 0% 59 58 64 65 78 19% 32%Education 16 28 18 14 2 -83% -86% 488 442 428 382 348 -9% -29% 169 176 203 221 238 8% 41%Nursing - - - - - - - - - - - - - - 16 18 21 20 22 - -Engineering 19 20 19 12 18 50% -2% 117 121 148 144 123 -15% 5% 35 40 40 40 37 -7% 4%Science 181 201 221 227 26 -89% -86% 100 98 90 121 124 2% 25% 121 107 125 131 126 -4% 4%Urban Affairs - 1 - 1 - - - 161 148 170 144 132 -9% -19% 39 51 24 29 18 -38% -53%Law 360 346 328 299 262 -12% -27% 207 214 194 185 171 -8% -17% 12 7 12 11 19 67% 62%Graduate Studies 1 - - - - -100% -100% - - - - - - - - - - - - - -Other2 1 1 1 - 1 - - - - - - - - - 12 27 31 58 58 - -Total 690 708 709 669 419 -37% -39% 1,677 1,752 1,771 1,731 1,586 -8% -5% 539 577 633 677 726 7% 35%
Notes: Days: Monday – Friday 7 a.m. to 4 p.m.
Evenings: Monday – Thursday 4 p.m. to 12 a.m.
Weekends: Classes start after Friday 4 p.m., Saturday and Sunday.
*Unknown includes sections with no class time.
Source: All figures are taken from census files.
Table 6.12: Fall Undergraduate Student FTE by College and Class Time: 5-Year Trend Fall 2008 – 2012 Day Percent Change Evening & Weekends Percent Change Unknown* Percent Change College 2008 2009 2010 2011 2012 1-Year 5-Year 2008 2009 2010 2011 2012 1-Year 5-Year 2008 2009 2010 2011 2012 1-Year 5-Year
Business 577 598 631 626 581 -7% 1% 376 380 414 407 400 -2% 6% 93 88 97 99 145 46% 56%CLASS 2,326 2,552 2,648 2,489 2,548 2% 10% 603 632 703 687 720 5% 19% 170 197 235 315 314 0% 84%Education 413 385 213 180 164 -9% -60% 172 171 153 140 153 9% -11% 103 129 139 165 172 4% 66%Nursing - - 186 246 258 5% - - - - 4 2 - - - - 23 24 22 - -Engineering 207 206 262 281 275 -2% 33% 137 166 182 189 201 7% 47% 5 5 15 20 16 -21% 200%Science 1,765 1,970 2,100 2,258 2,390 6% 35% 450 529 580 532 611 15% 36% 97 118 142 235 261 11% 169%Urban Affairs 89 99 105 122 129 5% 45% 78 80 122 141 120 -15% 54% 229 252 295 296 284 -4% 24%Undergraduate Studies 60 68 68 76 89 18% 48% 2 2 3 4 3 -18% 61% - - - - 3 - -Honors 7 6 10 8 7 -14% 3% - 1 - - - - - 1 1 - 2 1 0% -Other1 10 10 10 7 11 66% 17% 1 1 - 2 - -81% -50% 15 14 13 9 15 65% 4%Total 5,452 5,895 6,233 6,294 6,452 3% 18% 1,820 1,961 2,158 2,105 2,211 5% 21% 713 805 958 1,164 1,233 6% 73%
1 Other includes students enrolled in Air Force, Career Services, English as a Second Language, Military Science, Special program and Study Abroad *Unknown includes sections with no class time.
Table 6.13: Fall Graduate & Law Student FTE by College and Class Time: 5-Year Trend Fall 2008 – 2012

Cleveland State University / 2013 Book of Trends138
Table 6.14a: Annual Web Historical Enrollment and SCH Trends
WEB
Enrollment Percent Change SCH Percent Change
Term 2008-09* 2009-10** 2010-11 2011-12 2012-13 1-Year 5-Year 2008-09* 2009-10** 2010-11 2011-12 2012-13 1-Year 5-Year
Summer 1,721 2,105 2,533 3,012 3,044 1% 77% 7,194 9,261 11,711 14,919 15,348 3% 113%Fall 2,605 3,104 3,589 4,064 4,287 5% 65% 10,546 12,646 15,127 18,159 19,659 8% 86%Spring 2,598 3,128 3,770 4,176 4,305 3% 66% 10,727 14,470 16,563 19,073 19,674 3% 83%Total 6,924 8,337 9,892 11,252 11,636 3% 119% 28,467 36,377 43,401 52,151 54,681 5% 92%* In Spring 2008, the process was changed to use the Class Attribute Table for those Classes listed as ONLINE and/or BLENDED.
** In 2008-09 and going forward, the process will use the Class Attribute Table for extracting Enrollment and SCH information for Annual Web Enrollment and SCH Trends.
Note: Enrollment and SCH is based on those students who did not have a withdrawal date for a Web Based Course.
Enrollment within each semester is unduplicated, but Total may be duplicated if a student was enrolled in multiple terms over the year.
Figure 6.14a: Annual Web Historical Enrollment and SCH Trends
Center for eLearningIn 2006 the Center for eLearning was established to lead the University’s eLearning initiative. The Center has the goals of increasing University enrollments and enhancing academic quality through fully online degree and certificate programs available.
The Center’s major roles are to:
n Provide leadership for the University’s eLearning initiative
n Support and train faculty in designing and developing fully online, blended, and Web-enhanced courses
n Work with academic units on eLearning program development and marketing
n Lead in the use of emerging eLearning technologies
n Ensure availability of information and services for online students
Since its establishment, the Center has worked energetically to create a solid support infrastructure for eLearning and to expand the number of programs and courses offered in online or blended formats. As the charts below show, substantial growth in eLearning enrollments has occurred as more online and blended courses are being offered. Enrollments in eLearning courses have continued to grow rapidly, new programs have joined the group of programs already offered online, and support for both faculty and students is strong.
0
5001,000
1,500
2,000
3,500
2,500
3,000
4,0004,500
Enro
llmen
t
Summer Fall Spring
2008-09** 2010-11 2011-12 2012-13
0
5,000
10,000
20,000
15,000
Stud
ent C
redi
t Hou
rs
Summer Fall Spring
2009-10 2008-09** 2010-11 2011-12 2012-132009-10

Section 6 - Selected Strategic Indicators
Sec
tio
n
6
139
Table 6.14b: 5-Year Trends in Web-Based Instructional Delivery Student Credit Hours Generated
Undergraduate
Fall Percent Change
Web-Based** 2008 2009 2010 2011 2012 1-Year 5-Year
Business 1,104 1,146 1,137 1,301 1,819 40% 65%CLASS 1,472 1,588 2,089 2,975 3,230 9% 119%Education 397 1,083 1,443 1,330 1,391 5% 250%Engineering - 6 140 236 203 -14% -Nursing - - - 316 316 0% -Science 966 1,227 1,726 2,806 3,329 19% 245%Urban Affairs 2,974 3,307 3,769 3,982 3,633 -9% 22%Other (AF-CSC-MSC) 48 82 72 65 86 32% 79%
Total 6,961 8,439 10,376 13,011 14,007 8% 101%
Graduate
Fall Percent Change
Web-Based** 2008 2009 2010 2011 2012 1-Year 5-Year
Business 823 1,079 1,196 1,203 1,432 19% 74%CLASS 92 84 166 134 283 111% 208%Education 2,092 2,054 2,718 2,683 2,738 2% 31%Engineering - 45 100 88 84 -5% -Nursing - - - 282 303 7% -Science 264 373 368 438 662 51% 151%Urban Affairs 312 571 196 320 144 -55% -54%Other (AF-CSC-MSC) 2 1 7 6 - 200%Total 3,585 4,207 4,751 5,148 5,652 10% 73%
Totals
Fall Percent Change
Web-Based** 2008 2009 2010 2011 2012 1-Year 5-Year
Business 1,927 2,225 2,333 2,504 3,251 30% 69%CLASS 1,564 1,672 2,255 3,109 3,513 13% 125%Education 2,489 3,137 4,161 4,013 4,129 3% 66%Engineering - 51 240 324 287 -11% -Nursing - - - - 619 - -Science 1,230 1,600 2,094 3,244 3,991 23% 224%Urban Affairs 3,286 3,878 3,965 4,302 3,777 -12% 15%Other (AF-CSC-MSC) 50 83 79 65 92 42% 84%Total 10,546 12,646 15,127 17,561 19,659 12% 86%
** Web-based: Courses delivered primarily using the Internet. These courses are identified by section number (501-509) for Fall 2004-2007,
or by their class attribute (Online and/or Blended) for Fall 2008 and going forward.

Cleveland State University / 2013 Book of Trends140
Trends in Interactive Video and Telecourse Instructional DeliveryThe rapid growth in distance delivered student credit hours illustrates the important role distance learning plays today at many institutions, including Cleveland State. New technology, equipment, growing faculty interest, and support services at CSU have led to an increase in courses offered, the number of students enrolled, and smoother instructional delivery. Faculty development workshops and individual training and support in conducting interactive video classes along with creating web-based classes have been instrumental in developing these courses. Interactive video hook-ups now link our extended campuses and partner schools with the Main Campus, providing students the opportunity to take a class at another site which might not have been possible in the past. Web-based courses provide even more scheduling flexibility.
Table 6.15: 5-Year Trends in Interactive Video and Telecourse Delivery Student Credit Hours Generated
Undergraduate
Fall Percent Change
Interactive Video and Telecourse* 2008 2009 2010 2011 2012 1-Year 5-Year
Business - - 78 - - - -CLASS 28 131 20 48 - - -Education 8 - 4 - - - -Engineering - - 183 - 92 - -Science 168 126 120 75 93 24% -45%Urban Affairs 112 348 296 776 400 -48% 257%Total 316 605 701 899 585 -35% 85%
Graduate
Fall Percent Change
Interactive Video and Telecourse* 2008 2009 2010 2011 2012 1-Year 5-Year
Business - - - - - - -CLASS 1,056 925 993 1,119 489 -56% -54%Education 234 246 364 213 136 -36% -42%Engineering - - - - - - -Science - - - - - - -Urban Affairs 68 104 12 28 4 -86% -94%Total 1,358 1,275 1,369 1,360 629 -54% -54%
Total
Fall Percent Change
Interactive Video and Telecourse* 2008 2009 2010 2011 2012 1-Year 5-Year
Business - - 78 - - - -CLASS 1,084 1,056 1,013 1,167 489 -58% -55%Education 242 246 368 213 136 -36% -44%Engineering - - 183 - 92 - -Science 168 126 120 75 93 24% -45%Urban Affairs 180 452 308 804 404 -50% 124%Total 1,674 1,880 2,070 2,259 1,214 -46% -27%* Interactive video: Courses delivered via interactive television at two or more sites simutaneously and are identified by their section number (701-709 and 780-789) for Fall 2004-2007 or by their class
attribute
(IDVL) for Fall 2008 and going forward.
* Telecourse: Courses involving home viewing of videotaped programs, use of reading materials and some class interaction with the instructor and determined by the section number
(530-539) for Fall 2005-2007, but telecourses are not offered for Fall 2008 and going forward.

Section 6 - Selected Strategic Indicators
Sec
tio
n
6
141
Library FY 2012
Resources Total Titles Total Volumes/Items
Print Resources in Scholar Monographs 484,533 573,496Scores 13,800 22,508Periodicals and books (to be added to Scholar) 255,802Classed Serials 6,945 63,721Periodicals 27,369 187,474Theses and Dissertations 3,194 4,047Print Resources in Microform 10,737 725,281Total Print Resources 546,578 1,832,329Media Resources in Scholar Audio Resources 16,734 21,455Video Resources 11,710 14,642Other Resources 859 2,725Total Media Resources 29,303 38,822Total Physical Resources 575,881 1,871,151
Electronic Resources in Scholar Electronic Books 96,905 96,905Electronic Journals 57,882 57,882Electronic Serials 206 206Databases 772 772Websites 2,191 2,191Streaming Audio 4,018 4,018Streaming Video 8,435 8,435Total Electronic Resources 170,409 170,409
Total digital resources in CONTENTdm 50,740 50,740
Total digital resources in EngagedScholarship@CSU 1,154 1,154
Total Locally Digitized Resources 51,894 51,894
Total Digital Resources 274,197 274,197
GRAND TOTAL 850,078 2,106,526
Archival Resources Number of Collections Linear FeetSpecial Collections 406 7,153University Archives 427 3,183Total Archival Resources 758 10,158 Current Subscriptions Number of Titles FY12Paper Periodical 42Electronic Periodicals (paid subscriptions, including EJC) 10,585Other Paper Continuing Resources 99Other Electronic Continuing Resources (not journals) 422Total Subscriptions 11,148
Table 6.16: Michael Schwartz Library Collections, FY 2012
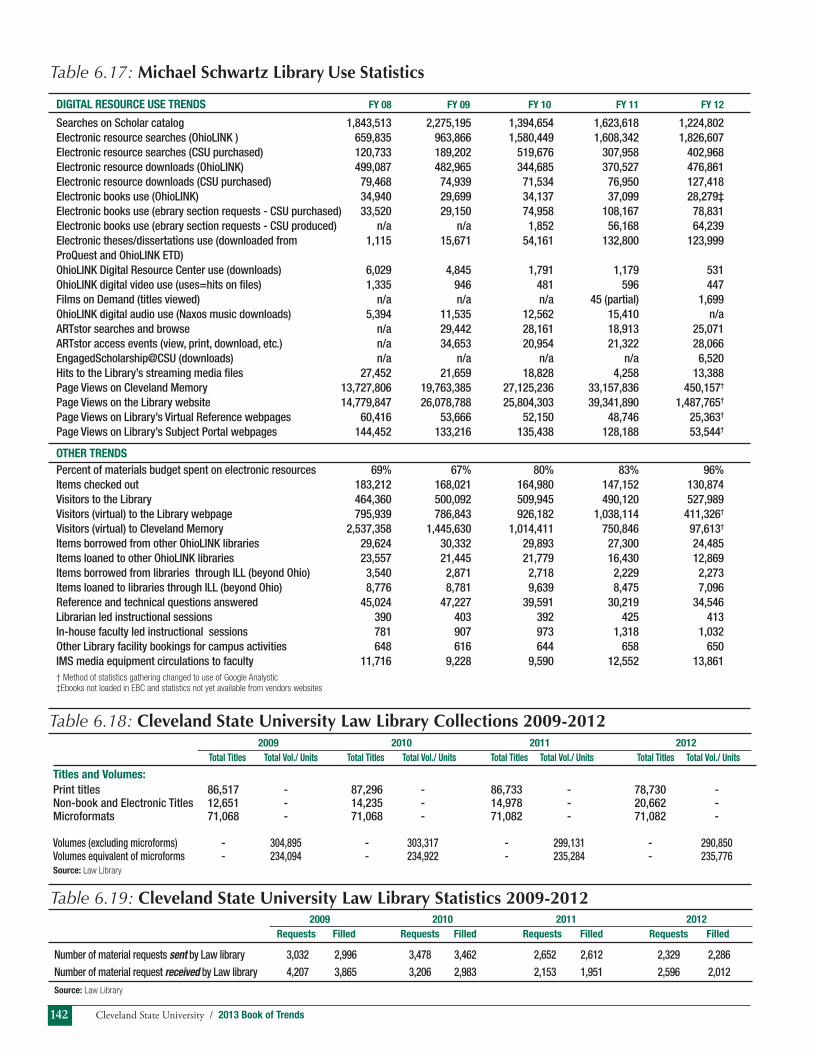
Cleveland State University / 2013 Book of Trends142
2009 2010 2011 2012 Requests Filled Requests Filled Requests Filled Requests Filled
Number of material requests sent by Law library 3,032 2,996 3,478 3,462 2,652 2,612 2,329 2,286Number of material request received by Law library 4,207 3,865 3,206 2,983 2,153 1,951 2,596 2,012Source: Law Library
DIGITAL RESOURCE USE TRENDS FY 08 FY 09 FY 10 FY 11 FY 12
Searches on Scholar catalog 1,843,513 2,275,195 1,394,654 1,623,618 1,224,802Electronic resource searches (OhioLINK ) 659,835 963,866 1,580,449 1,608,342 1,826,607 Electronic resource searches (CSU purchased) 120,733 189,202 519,676 307,958 402,968Electronic resource downloads (OhioLINK) 499,087 482,965 344,685 370,527 476,861Electronic resource downloads (CSU purchased) 79,468 74,939 71,534 76,950 127,418Electronic books use (OhioLINK) 34,940 29,699 34,137 37,099 28,279‡Electronic books use (ebrary section requests - CSU purchased) 33,520 29,150 74,958 108,167 78,831Electronic books use (ebrary section requests - CSU produced) n/a n/a 1,852 56,168 64,239Electronic theses/dissertations use (downloaded from 1,115 15,671 54,161 132,800 123,999ProQuest and OhioLINK ETD)OhioLINK Digital Resource Center use (downloads) 6,029 4,845 1,791 1,179 531OhioLINK digital video use (uses=hits on files) 1,335 946 481 596 447Films on Demand (titles viewed) n/a n/a n/a 45 (partial) 1,699OhioLINK digital audio use (Naxos music downloads) 5,394 11,535 12,562 15,410 n/aARTstor searches and browse n/a 29,442 28,161 18,913 25,071ARTstor access events (view, print, download, etc.) n/a 34,653 20,954 21,322 28,066EngagedScholarship@CSU (downloads) n/a n/a n/a n/a 6,520Hits to the Library’s streaming media files 27,452 21,659 18,828 4,258 13,388Page Views on Cleveland Memory 13,727,806 19,763,385 27,125,236 33,157,836 450,157†
Page Views on the Library website 14,779,847 26,078,788 25,804,303 39,341,890 1,487,765†
Page Views on Library’s Virtual Reference webpages 60,416 53,666 52,150 48,746 25,363†
Page Views on Library’s Subject Portal webpages 144,452 133,216 135,438 128,188 53,544†
OTHER TRENDS Percent of materials budget spent on electronic resources 69% 67% 80% 83% 96%Items checked out 183,212 168,021 164,980 147,152 130,874Visitors to the Library 464,360 500,092 509,945 490,120 527,989Visitors (virtual) to the Library webpage 795,939 786,843 926,182 1,038,114 411,326†
Visitors (virtual) to Cleveland Memory 2,537,358 1,445,630 1,014,411 750,846 97,613†
Items borrowed from other OhioLINK libraries 29,624 30,332 29,893 27,300 24,485Items loaned to other OhioLINK libraries 23,557 21,445 21,779 16,430 12,869Items borrowed from libraries through ILL (beyond Ohio) 3,540 2,871 2,718 2,229 2,273Items loaned to libraries through ILL (beyond Ohio) 8,776 8,781 9,639 8,475 7,096Reference and technical questions answered 45,024 47,227 39,591 30,219 34,546Librarian led instructional sessions 390 403 392 425 413In-house faculty led instructional sessions 781 907 973 1,318 1,032Other Library facility bookings for campus activities 648 616 644 658 650IMS media equipment circulations to faculty 11,716 9,228 9,590 12,552 13,861† Method of statistics gathering changed to use of Google Analystic‡Ebooks not loaded in EBC and statistics not yet available from vendors websites
Table 6.17: Michael Schwartz Library Use Statistics
Table 6.19: Cleveland State University Law Library Statistics 2009-2012
2009 2010 2011 2012 Total Titles Total Vol./ Units Total Titles Total Vol./ Units Total Titles Total Vol./ Units Total Titles Total Vol./ Units
Titles and Volumes: Print titles 86,517 - 87,296 - 86,733 - 78,730 -Non-book and Electronic Titles 12,651 - 14,235 - 14,978 - 20,662 -Microformats 71,068 - 71,068 - 71,082 - 71,082 - Volumes (excluding microforms) - 304,895 - 303,317 - 299,131 - 290,850Volumes equivalent of microforms - 234,094 - 234,922 - 235,284 - 235,776Source: Law Library
Table 6.18: Cleveland State University Law Library Collections 2009-2012

Section 6 - Selected Strategic Indicators
Sec
tio
n
6
143
Cleveland Transfer Connection (CTC)Building upon the experiences and success of the CSU learning community initiative, in 2009 we successfully launched the Cleveland Transfer Connection Program, a cooperative initiative between CSU and Cuyahoga Community College designed to promote academic success and increase college graduation rates. Cleveland Transfer Connection offers the benefit of a systematic process of course completion that leads to transfer-readiness and contributes to retention and degree completion. In this unique partnership program students begin their college years enrolled in learning communities at the community college to earn an Associate’s Degree then transfer to CSU to complete the Bachelor’s Degree in a total of 4-5 years. The program is customized for students who are entering advance level course work. The first cohort of 87 Cleveland Transfer Connection students entered the program in 2009 and 57 (66%) will transfer to CSU for Fall 2012 classes.

Cleveland State University / 2013 Book of Trends144

Se
ct
ion
7
Book of Trends
Cleveland State University
2013
Faculty & Staff
7

Cleveland State University / 2013 Book of Trends146

147Section 7 - Faculty & Staff
Sec
tio
n
7
Table 7.1: Full-Time Employees by Standard Occupational Classification (SOC) Fall 2012
Figure 7.1: Full-Time Employees by SOC Category Fall 2012
SOC Category Count % of Total
Management 229 15.0%Faculty 520 34.1%Archivists/Curators/Museum Technicians 17 1.1%Non-Postsecondary Teaching 78 5.1%Business/Financial Operations 84 5.5%Computer/Engineering/Science 137 9.0%Comm Service/Legal/Arts/Media 63 4.1%Health Practioners & Technical Occupations 13 0.9%Service 102 6.7%Sales and Related 3 0.2%Office/Administrative Support 239 15.7%Natural Resources/Construct/Mnt 28 1.8%Production/Transport/Material 11 0.7%Total Full-time Employees 1,524 100%Source: All figures are taken from the IPEDS/EAP files as of November 1.
Management15.0%
Faculty34.1%
Archivists/Curators/Museum Technicians
1.1%
Non-Postsecondary Teaching
Business/Financial Operations5.5%
Computer/Engineering/Science9.0%
Comm Service/Legal/Arts/Media
4.1%Health Practioners & Technical
Occupations0.9%
Service6.7%
Sales and Related0.2%
Office/Administrative Support15.7%
Natural Resources/Construct/Mnt
1.8%
Production/Transport/Material0.7%
5.1%

Cleveland State University / 2013 Book of Trends148
Table 7.2: Full-Time Employees by Gender, Ethnicity, and (SOC) Category Fall 2012
(continued on next page)
Management Non Resident Alien - - White 86 91 Black/African American 7 27 Hispanic/Latino 4 1 Asian 10 2 American Indian/Alaskan Native - - Other Pacific Islander/Native Hawaiian - - Two or More Races 1 - Unknown - - Total 108 121
Faculty Non Resident Alien 9 3 White 220 160 Black/African American 15 20 Hispanic/Latino 9 3 Asian 56 23 American Indian/Alaskan Native - - Other Pacific Islander/Native Hawaiian 1 - Two or More Races - - Unknown - 1 Total 310 210
Archivists/Curators/Museum Technicians Non Resident Alien - - White 3 13 Black/African American - - Hispanic/Latino - - Asian - 1 American Indian/Alaskan Native - - Other Pacific Islander/Native Hawaiian - - Two or More Races - - Unknown - - Total 3 14
Non-Postsecondary Teaching Non Resident Alien - 1 White 16 45 Black/African American 1 9 Hispanic/Latino - 3 Asian - - American Indian/Alaskan Native - 1 Other Pacific Islander/Native Hawaiian - - Two or More Races - 2 Unknown - - Total 17 61
Business/Financial Operations Non Resident Alien 1 - White 23 42 Black/African American 3 13 Hispanic/Latino - 2 Asian - - American Indian/Alaskan Native - - Other Pacific Islander/Native Hawaiian - - Two or More Races - - Unknown - - Total 27 57
Computer/Engineering/Science Non Resident Alien 3 2 White 74 35 Black/African American 5 5 Hispanic/Latino - 2 Asian 9 2 American Indian/Alaskan Native - - Other Pacific Islander/Native Hawaiian - - Two or More Races - - Unknown - - Total 91 46
Comm Service/Legal/Arts/Media Non Resident Alien 1 - White 23 22 Black/African American 8 8 Hispanic/Latino 1 - Asian - - American Indian/Alaskan Native - - Other Pacific Islander/Native Hawaiian - - Two or More Races - - Unknown - - Total 33 30
Health Practitioners & Technical Occupations Non Resident Alien - - White 2 8 Black/African American - 1 Hispanic/Latino - - Asian 1 1 American Indian/Alaskan Native - - Other Pacific Islander/Native Hawaiian - - Two or More Races - - Unknown - - Total 3 10
2012
SOC Category/Ethnicity Male Female
2012
SOC Category/Ethnicity Male Female

149Section 7 - Faculty & Staff
Sec
tio
n
7
2012
SOC Category/Ethnicity Male Female
Table 7.2: Full-Time Employees by Gender, Ethnicity, and (SOC) Category Fall 2012
Source: All figures are taken from the IPEDS/EAP files as of November 1.
Note: Please see that Asian/Pacific Islander was split into two categories.
Also a new category of two or more races was added per Federal Reporting Rule Changes.
Service Non Resident Alien - - White 27 4 Black/African American 39 25 Hispanic/Latino 4 1 Asian - - American Indian/Alaskan Native - - Other Pacific Islander/Native Hawaiian - - Two or More Races - - Unknown 2 - Total 72 30
Sales and Related Non Resident Alien - - White 2 - Black/African American 1 - Hispanic/Latino - - Asian - - American Indian/Alaskan Native - - Other Pacific Islander/Native Hawaiian - - Two or More Races - - Unknown - - Total 3 -
Office/Administrative Support Non Resident Alien - - White 14 135 Black/African American 8 73 Hispanic/Latino 1 2 Asian 1 3 American Indian/Alaskan Native - - Other Pacific Islander/Native Hawaiian - - Two or More Races - 2 Unknown - - Total 24 215
Natural Resources/Construct/Mnt Non Resident Alien - - White 21 - Black/African American 6 - Hispanic/Latino 1 - Asian - - American Indian/Alaskan Native - - Other Pacific Islander/Native Hawaiian - - Two or More Races - - Unknown - - Total 28 -
2012
SOC Category/Ethnicity Male Female
Production/Transport/Material Non Resident Alien - - White 8 - Black/African American 1 1 Hispanic/Latino 1 - Asian - - American Indian/Alaskan Native - - Other Pacific Islander/Native Hawaiian - - Two or More Races - - Unknown - - Total 10 1 Total Full-Time Employees Non Resident Alien 14 6 White 519 555 Black/African American 94 182 Hispanic/Latino 21 14 Asian 77 32 Native American/Alaskan Native - 1 Other Pacific Islander/Native Hawaiian 1 - Two or More Races 1 4 Unknown 2 1 Total 729 795

Cleveland State University / 2013 Book of Trends150
Table 7.3: Full-Time Employees: Women and Minorities as a Percentage of Total by SOC Category Fall 2012
(continued on next page)
2012 2012
Management Women 53%Black/African American 15%Hispanic/Latino 2%Asian 5%Native American/Alaskan Native 0%Other Pacific Islander/Native Hawaiian 0%Two or More Races 0%Minorities 23%
Faculty Women 40%Black/African American 7%Hispanic/Latino 2%Asian 15%Native American/Alaskan Native 0%Other Pacific Islander/Native Hawaiian 0%Two or More Races 0%Minorities 24%
Archivists/Curators/Museum Technicians Women 82%Black/African American 0%Hispanic/Latino 0%Asian 6%Native American/Alaskan Native 0%Other Pacific Islander/Native Hawaiian 0%Two or More Races 0%Minorities 6%
Non-Postsecondary Teaching Women 78%Black/African American 13%Hispanic/Latino 4%Asian 0%Native American/Alaskan Native 1%Other Pacific Islander/Native Hawaiian 0%Two or More Races 3%Minorities 21%
Business/Financial Operations Women 68%Black/African American 19%Hispanic/Latino 2%Asian 0%Native American/Alaskan Native 0%Other Pacific Islander/Native Hawaiian 0%Two or More Races 0%Minorities 21%
Computer/Engineering/Science Women 34%Black/African American 7%Hispanic/Latino 1%Asian 8%Native American/Alaskan Native 0%Other Pacific Islander/Native Hawaiian 0%Two or More Races 0%Minorities 17%
Comm Service/Legal/Arts/Media Women 48%Black/African American 25%Hispanic/Latino 2%Asian 0%Native American/Alaskan Native 0%Other Pacific Islander/Native Hawaiian 0%Two or More Races 0%Minorities 27%
Health Practitioners & Technical Occupations Women 77%Black/African American 8%Hispanic/Latino 0%Asian 15%Native American/Alaskan Native 0%Other Pacific Islander/Native Hawaiian 0%Two or More Races 0%Minorities 23%

151Section 7 - Faculty & Staff
Sec
tio
n
7
Table 7.3: Full-Time Employees: Women and Minorities as a Percentage of Total by SOC Category Fall 2012
2012 2012
Service Women 29%Black/African American 63%Hispanic/Latino 5%Asian 0%Native American/Alaskan Native 0%Other Pacific Islander/Native Hawaiian 0%Two or More Races 0%Minorities 68%
Sales and Related Women 0%Black/African American 33%Hispanic/Latino 0%Asian 0%Native American/Alaskan Native 0%Other Pacific Islander/Native Hawaiian 0%Two or More Races 0%Minorities 33%
Office/Administrative Support Women 90%Black/African American 34%Hispanic/Latino 1%Asian 2%Native American/Alaskan Native 0%Other Pacific Islander/Native Hawaiian 0%Two or More Races 1%Minorities 38%
Natural Resources/Construct/Mnt Women 0%Black/African American 21%Hispanic/Latino 4%Asian 0%Native American/Alaskan Native 0%Other Pacific Islander/Native Hawaiian 0%Two or More Races 0%Minorities 25%
Production/Transport/Material Women 9%Black/African American 18%Hispanic/Latino 9%Asian 0%Native American/Alaskan Native 0%Other Pacific Islander/Native Hawaiian 0%Two or More Races 0%Minorities 27%
Total Full-Time Employees Women 52%Black/African American 18%Hispanic/Latino 2%Asian 7%Native American/Alaskan Native 0%Other Pacific Islander/Native Hawaiian 0%Two or More Races 0%Minorities 28%
Source: All figures are taken from the IPEDS/EAP files as of November 1.
Note: Minorities include Black, Hispanics, Asian, Native American/Alaskan Native, Other Pacific Islander/Native Hawaiian, and Two or More Races.

Cleveland State University / 2013 Book of Trends152
Employees
SOC Category Description Full Time Part Time Total Time
Management 229 16 245 Faculty 520 521 1,041 Archivists/Curators/Museum Technicians 17 - 17 Non-Postsecondary Teaching 78 5 83 Business/Financial Operations 84 6 90 Computer/Engineering/Science 137 6 143 Comm Service/Legal/Arts/Media 63 35 98 Health Practitioners & Technical Occupations 13 1 14 Service 102 31 133 Sales and Related 3 2 5 Office/Administrative Support 239 30 269 Natural Resources/Construct/Mnt 28 - 28 Production/Transport/Material 11 1 12 Total Employees 1,524 654 2,178
Source: All figures are taken from the IPEDS/EAP files as of November 1.
Table 7.4: Total Employees by SOC Category Fall 2012
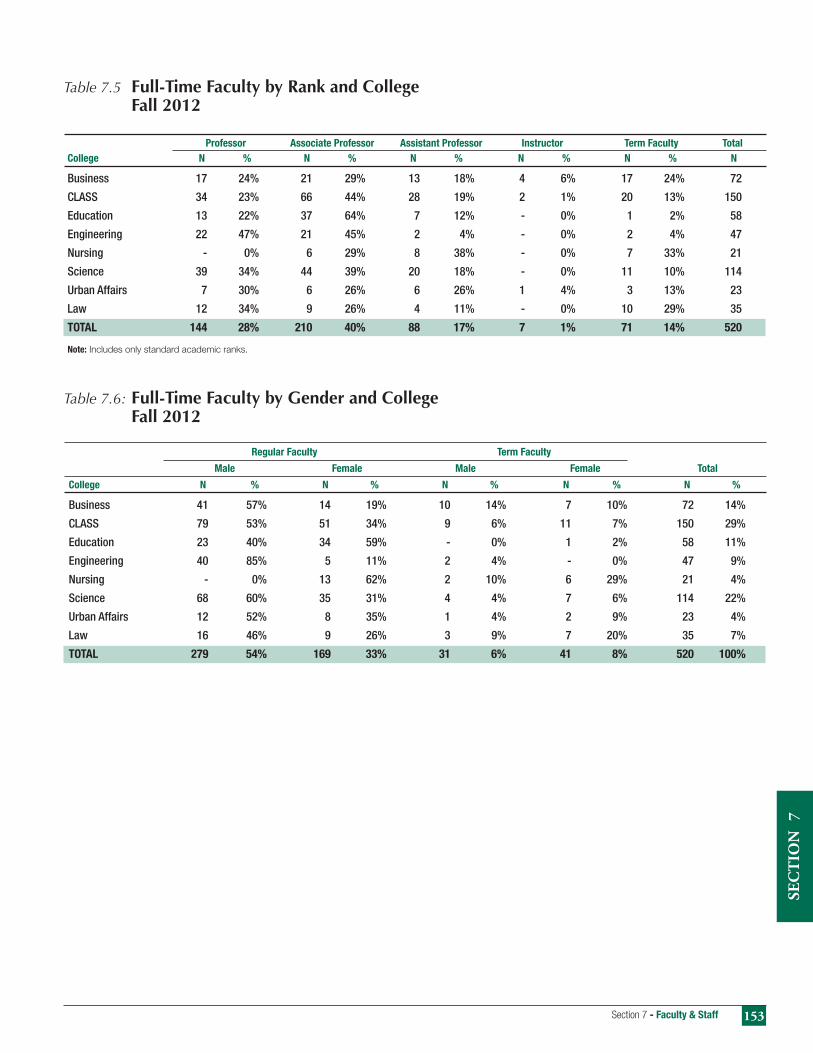
153Section 7 - Faculty & Staff
Sec
tio
n
7
Regular Faculty Term Faculty
Male Female Male Female Total
College N % N % N % N % N %
Business 41 57% 14 19% 10 14% 7 10% 72 14%
CLASS 79 53% 51 34% 9 6% 11 7% 150 29%
Education 23 40% 34 59% - 0% 1 2% 58 11%
Engineering 40 85% 5 11% 2 4% - 0% 47 9%
Nursing - 0% 13 62% 2 10% 6 29% 21 4%
Science 68 60% 35 31% 4 4% 7 6% 114 22%
Urban Affairs 12 52% 8 35% 1 4% 2 9% 23 4%
Law 16 46% 9 26% 3 9% 7 20% 35 7%
TOTAL 279 54% 169 33% 31 6% 41 8% 520 100%
Professor Associate Professor Assistant Professor Instructor Term Faculty TotalCollege N % N % N % N % N % N
Business 17 24% 21 29% 13 18% 4 6% 17 24% 72
CLASS 34 23% 66 44% 28 19% 2 1% 20 13% 150
Education 13 22% 37 64% 7 12% - 0% 1 2% 58
Engineering 22 47% 21 45% 2 4% - 0% 2 4% 47
Nursing - 0% 6 29% 8 38% - 0% 7 33% 21
Science 39 34% 44 39% 20 18% - 0% 11 10% 114
Urban Affairs 7 30% 6 26% 6 26% 1 4% 3 13% 23
Law 12 34% 9 26% 4 11% - 0% 10 29% 35
TOTAL 144 28% 210 40% 88 17% 7 1% 71 14% 520
Note: Includes only standard academic ranks.
Table 7.5 Full-Time Faculty by Rank and College Fall 2012
Table 7.6: Full-Time Faculty by Gender and College Fall 2012

Cleveland State University / 2013 Book of Trends154
Degree %College Bachelor’s Master’s Doctorate Professional Total Terminal Degree
Business 0% 22% 74% 4% 14% 75%
CLASS 1% 18% 81% 0% 29% 89%
Education 0% 7% 93% 0% 11% 98%
Engineering 0% 6% 94% 0% 9% 100%
Nursing 0% 71% 29% 0% 4% 67%
Science 0% 11% 88% 1% 22% 90%
Urban Affairs 0% 13% 87% 0% 4% 87%
Law 0% 0% 3% 97% 7% 100%
TOTAL 0% 16% 77% 7% 100% 89%
Source: All figures are taken from the IPEDS/EAP files as of November 1.
Table 7.7: Full-Time Faculty by Highest Degree Attained, Fall 2012
Professor Associate Professor Assistant Professor Instructor Term Faculty Total
College Gender N % N % N % N % N % N
Business F 3 14% 6 29% 5 24% - 0% 7 33% 21 M 14 27% 15 29% 8 16% 4 8% 10 20% 51 CLASS F 14 23% 22 35% 14 23% 1 2% 11 18% 62 M 20 23% 44 50% 14 16% 1 1% 9 10% 88 Education F 6 17% 24 69% 4 11% - 0% 1 3% 35 M 7 30% 13 57% 3 13% - 0% - 0% 23 Engineering F 2 40% 2 40% 1 20% - 0% - 0% 5 M 20 48% 19 45% 1 2% - 0% 2 5% 42 Nursing F - 0% 6 32% 7 37% - 0% 6 32% 19 M - 0% - 0 - 0 - 0 2 100% 2 Science F 8 19% 18 43% 9 21% - 0% 7 17% 42 M 31 43% 26 36% 11 15% - 0% 4 6% 72 Urban Affairs F 3 30% 3 30% 2 20% - 0% 2 20% 10 M 4 31% 3 23% 4 31% 1 8% 1 8% 13 Law F 5 31% 3 19% 1 6% - 0% 7 44% 16 M 7 37% 6 32% 3 16% - 0% 3 16% 19 TOTAL 144 28% 210 40% 87 17% 7 1% 72 14% 520
Note: Includes only standard academic ranks.Source: All figures are taken from the IPEDS/EAP files as of November 1.
Table 7.6a: Full-Time Faculty by College, Gender and Rank, Fall 2012

155Section 7 - Faculty &
Staff
Section 7
Table 7.8: Full-Time Tenured/Tenure-Track and Non-Tenure Track Faculty by College/Department: 5-Year Trend
Fall
2008 2009 2010 2011 2012 Percent Change
Tenured Non Tenured Non Tenured Non Tenured Non Tenured Non & Tenure Tenure & Tenure Tenure & Tenure Tenure & Tenure Tenure & Tenure TenureCollege/Department
Track Track Total Track Track Total Track Track Total Track Track Total Track Track Total 1 year 5 year
Business Accounting 9 4 13 10 4 14 10 5 15 9 6 15 11 6 17 13% 31%Computer & Information Science 15 3 18 13 3 16 14 3 17 12 4 16 12 3 15 -6% -17%Finance 8 2 10 7 2 9 7 2 9 4 5 9 2 5 7 -22% -30%Health Care Administration 2 - 2 - - - - - - - - - - - - - -100%Management & Labor Relations 7 5 12 9 4 13 10 3 13 11 1 12 10 3 13 8% 8%Marketing 12 3 15 10 3 13 11 4 15 11 4 15 8 4 12 -20% -20%Operation and Supply Chain Management 6 2 8 6 3 9 6 3 9 6 2 8 6 2 8 0% 0%Business Total 59 19 78 55 19 74 58 20 78 53 22 75 49 23 72 -4% -8%
Liberal Arts & Social Sciences Anthropology 5 - 5 5 - 5 5 - 5 5 - 5 5 1 6 20% 20%Art 12 - 12 12 - 12 11 1 12 11 - 11 11 - 11 0% -8%Economics 7 - 7 7 - 7 7 - 7 5 1 6 5 2 7 17% 0%English 17 2 19 15 3 18 14 3 17 14 4 18 12 7 19 6% 0%History 16 2 18 16 - 16 15 - 15 15 - 15 15 - 15 0% -17%Liberal Studies - - - - - - - - - - - - - - - - -Modern Languages 10 2 12 9 2 11 9 2 11 9 2 11 10 2 12 9% 0%Music 12 1 13 11 1 12 11 1 12 10 2 12 9 4 13 8% 0%Philosophy 8 - 8 6 - 6 6 - 6 6 - 6 6 - 6 0% -25%Political Science 8 - 8 8 - 8 9 - 9 9 - 9 7 2 9 0% 13%Religious Studies 2 1 3 4 - 4 4 - 4 4 - 4 3 - 3 -25% 0%School of Communication 19 1 20 20 2 22 19 2 21 19 2 21 17 3 20 -5% 0%Social Work 14 1 15 13 2 15 13 2 15 10 2 12 8 3 11 -8% -27%Sociology 10 3 13 9 3 12 8 3 11 9 3 12 10 4 14 17% 8%Theatre and Dance 3 1 4 3 1 4 5 - 5 4 - 4 4 - 4 0% 0%Liberal Arts & Social Sciences Total 143 14 157 138 14 152 136 14 150 130 16 146 122 28 150 3% -4%
(continued on next page)

Cleveland State U
niversity / 2013 Book of Trends156
Table 7.8: Full-Time Tenured/Tenure-Track and Non-Tenure Track Faculty by College/Department: 5-Year Trend
(continued from previous page)
Fall
2008 2009 2010 2011 2012 Percent Change
Tenured Non Tenured Non Tenured Non Tenured Non Tenured Non & Tenure Tenure & Tenure Tenure & Tenure Tenure & Tenure Tenure & Tenure TenureCollege/Department
Track Track Total Track Track Total Track Track Total Track Track Total Track Track Total 1 year 5 year
Education and Human Services CASAL 16 - 16 15 - 15 15 - 15 16 - 16 14 - 14 -13% -13%Curriculum & Foundations 16 - 16 14 - 14 13 - 13 13 - 13 11 1 12 -8% -25%Health And Physical Education 8 - 8 8 - 8 8 - 8 8 - 8 7 1 8 0% 0%Teachers Education 25 1 26 23 - 23 24 - 24 24 - 24 24 - 24 0% -8%Education and Human Services Total 65 1 66 60 - 60 60 - 60 61 - 61 56 2 58 -5% -12%
Engineering Chemical Engineering 9 - 9 8 - 8 8 - 8 10 - 10 10 - 10 0% 11%Civil & Environmental Engineering 11 - 11 10 - 10 10 - 10 9 - 9 9 - 9 0% -18%Electrical & Computer Engineering 15 - 15 15 - 15 15 - 15 15 - 15 15 - 15 0% 0%Engineering Technology 5 - 5 4 - 4 4 - 4 4 - 4 4 1 5 25% 0%Industrial & Manufacturing Engineering 5 - 5 - - - - - - - - - - - - - -Mechanical Engineering 9 - 9 13 - 13 10 - 10 8 - 8 7 1 8 0% -11%Engineering Total 54 - 54 50 - 50 47 - 47 46 - 46 45 2 47 2% -13%
Law 30 12 42 30 12 42 30 12 42 28 12 40 25 10 35 -13% -17%
Nursing 15 4 19 17 6 23 17 5 22 15 4 19 14 7 21 11% 11%
Science Biology, Geology & Environmental Science 21 - 21 20 - 20 19 - 19 19 - 19 21 - 21 11% 0%Chemistry 13 - 13 14 - 14 14 - 14 14 - 14 14 - 14 0% 8%Health Sciences 17 - 17 20 3 23 22 2 24 21 3 24 23 3 26 8% 53%Mathematics 23 2 25 20 3 23 20 4 24 21 4 25 20 7 27 8% 8%Physics 10 - 10 10 - 10 10 - 10 10 - 10 8 1 9 -10% -10%Psychology 19 1 20 20 1 21 19 2 21 18 2 20 16 1 17 -15% -15%Speech & Hearing - - - - - - - - - - - - - - - - -Science Total 103 3 106 104 7 111 104 8 112 103 9 112 102 12 114 2% 8%
Urban Affairs 22 4 26 21 4 25 23 4 27 21 4 25 18 5 23 -8% -12%
University Total 491 57 548 475 62 537 475 63 538 457 67 524 431 89 520 -1% -5%

157Section 7 - Faculty & Staff
Sec
tio
n
7
Table 7.9: Percentage of Undergraduate Student Credit Hours (SCH) Generated by Full-Time Faculty Fall 2012
SCH Generated SCH Generated SCH Generated Total SCH % of SCH Generated by Full-time by Part-time by Other Generated GeneratedDepartment Description Faculty Faculty Instructors Full-time Faculty
College of Business Accounting Accounting 2,625 267 - 2,892 91% Business Law 240 159 - 399 60%Computer & Information Science Computer and Information Science 967 562 100 1,629 59% Information Science 1,590 87 157 1,834 87%Finance Finance 1,356 140 160 1,656 82%Health Care Administration Health Care Administration 78 - - 78 100%Management & Labor Relations Management & Labor Relations 1,479 507 42 2,028 73%Marketing General Administration 207 516 - 723 29% Marketing 1,203 548 220 1,971 61%Operations & Supply Chain Operations & Supply Chain 1,432 649 24 2,105 68% Management Management
Other Business International Business 151 - 96 247 61% Other Business 524 657 150 1,331 39%Business Total 11,852 4,092 949 16,893 70%
College of Liberal Arts and Social Sciences Anthropology Anthropology 2,528 864 - 3,392 75% Linguistics 96 - - 96 100%Art Art 1,657 800 52 2,509 66%Communication Communication 4,658 1,356 176 6,190 75%Economics Economics 1,462 798 - 2,260 65%English English 2,826 4,793 903 8,522 33% Developmental English - 240 154 394 0%History History 2,692 2,008 364 5,064 53%Interdisciplinary Black Studies - - 296 296 0% Classical and Medieval Studies 3 - - 3 100% National Student Exchange - - 60 60 0% Women’s Studies 12 244 160 416 3%Modern Languages Arabic 116 235 - 351 33% Chinese - 173 - 173 0% French 120 260 - 380 32% German - 231 - 231 0% Greek - - 72 72 0% Italian 235 - - 235 100% Japanese - 134 - 134 0% Latin - 120 - 120 0% Modern Languages 84 33 - 117 72% Spanish 1,160 - 545 1,705 68%Music Applied Music 37 360 18 415 9% Music 703 2,345 43 3,091 23%Philosophy Philosophy 988 1,474 - 2,462 40%Political Science/IR Political Science 1,850 180 - 2,030 91%Religious Studies Religious Studies 988 740 240 1,968 50%Social Work Social Work 1,697 975 595 3,267 52%Sociology Sociology 5,679 897 122 6,698 85%Theatre and Dance Dance 173 37 112 322 54% Theatre and Dance 393 315 36 744 53%College of Liberal Arts and Social Sciences Total 30,157 19,612 3,948 53,717 56%
(continued on next page)

Cleveland State University / 2013 Book of Trends158
SCH Generated SCH Generated SCH Generated Total SCH % of SCH Generated by Full-time by Part-time by Other Generated GeneratedDepartment Description Faculty Faculty Instructors Full-time Faculty
College of Education & Human Services CASAL Education Specialist 88 - - 88 100%Curriculum and Foundations Curriculum & Instruction 495 437 253 1,185 42%Health And Physical Education Health and Physical Education 342 160 372 874 39% Health Education 115 30 - 145 79% HPER-Core Curriculum 75 94 78 247 30% HPERD-Special Topics - 75 - 75 0% Physical Education-Service - 43 173 216 0%Other Education Physical Education - - 17 17 0%Teachers Education Early Childhood Education 320 515 - 835 38% Education U Teach 105 - 38 143 73% Education-SIP 54 487 40 581 9% Middle Childhood Education 136 200 - 336 40% Special Education 224 387 132 743 30% Specialized Instructional/Teacher Education 420 447 - 867 48% Specialized Study & Field Experiences 989 - - 989 100%Education Total 3,363 2,875 1,103 7,341 46%
College of Engineering Chemical & Biomedical Chemical Engineering 418 - - 418 100% Engineering Engineering Science 549 54 - 603 91%Civil & Environmental Civil Engineering 578 - 84 662 87% Engineering Engineering Science 461 - - 461 100%Dean’s Office Engineering Science - - 244 244 0%Electrical & Computer Electrical & Computer Engineering 1,082 472 141 1,695 64% Engineering Engineering Science 62 - 54 116 53%Engineering Technology Electronic Engineering Technology 201 84 - 285 71% Engineering Science 225 - - 225 100% General Engineering Technology 191 - - 191 100% Math Technology 152 - - 152 100% Mechanical Engineering Technology 305 - - 305 100%Industrial& Manufacturing Engineering Science - - 183 183 0% Engineering
Mechanical Engineering Engineering Science 465 - 156 621 75% Mechanical Engineering 756 88 378 1,222 62%Engineering Total 5,445 698 1,240 7,383 74%
Honors Honors Honors 3 35 83 121 2%Honors Total 3 35 83 121 2%
Table 7.9: Percentage of Undergraduate Student Credit Hours (SCH) Generated by Full-Time Faculty Fall 2012(continued from previous page)
(continued on next page)

159Section 7 - Faculty & Staff
Sec
tio
n
7
(continued from previous page)
SCH Generated SCH Generated SCH Generated Total SCH % of SCH Generated by Full-time by Part-time by Other Generated GeneratedDepartment Description Faculty Faculty Instructors Full-time Faculty
Nursing Nursing Nursing RN 3,505 478 250 4,233 83%Nursing Total 3,505 478 250 4,233 83%
College of Science Biology, Geology & Biology 4,539 3,156 - 7,695 59% Environmental Science Environmental Sciences 405 - 210 615 66% Geological Sciences 469 117 87 673 70% Science 56 72 - 128 44%Chemistry Chemistry 1,066 3,145 2,397 6,608 16%Health Sciences Pre-Health Science 1,665 1,272 347 3,284 51%Mathematics Mathematics 6,600 6,154 436 13,190 50%Physics Physics 1,934 889 200 3,023 64%Psychology Psychology 4,525 4,138 682 9,345 48%Speech & Hearing Speech & Hearing 337 1,574 212 2,123 16%Other Science Developmental Mathematics 1,220 1,012 - 2,232 55%College of Science Total 22,816 21,529 4,571 48,916 47%
College of Urban Affairs Urban Studies Urban Studies 3,502 3,297 1,200 7,999 44%College of Urban Affairs Total 3,502 3,297 1,200 7,999 44% Undergraduate Studies/ Other Undergraduate Studies ASC 24 419 820 1,263 2% Business Freshman Orientation 78 - 78 156 50%Undergraduate Studies Total 102 419 898 1,419 7%Total SCH 80,745 53,099 14,580 148,424 36%
This report includes only the SCH generated by instructors who have a valid I.D. available in the CSU employee database system.
Table 7.9: Percentage of Undergraduate Student Credit Hours (SCH) Generated by Full-Time Faculty Fall 2012

Cleveland State University / 2013 Book of Trends160
2008 2009 2010 2011 2012 Institution Women Minorities Women Minorities Women Minorities Women Minorities Women Minorities
University of Akron 42% 16% 42% 16% 48% 12% 43% 17% 44% 18%Bowling Green State 44% 10% 45% 11% 47% 10% 48% 11% 47% 12% University
University of Cincinnati 37% 17% 38% 17% 39% 17% 39% 17% 39% 18%Cleveland State University 39% 21% 40% 22% 41% 23% 40% 23% 40% 24%Central State University 36% 64% 36% 64% 40% 66% 40% 65% 41% 60%Kent State University 50% 14% 49% 14% 50% 16% 50% 17% 51% 21%Miami University 41% 15% 41% 13% 41% 15% 43% 14% NA NAOhio State University 36% 16% 36% 18% 37% 18% 38% 20% 38% 19%Ohio University 36% 16% 37% 14% 38% 15% 38% 15% 39% 16%Shawnee State University 40% 8% 40% 8% 44% 9% 47% 5% 46% 7%University of Toledo 38% 20% 39% 18% 39% 17% 39% 17% 40% 18%Wright State University 42% 20% 44% 21% 44% 21% 45% 21% 46% 22%Youngstown State University 40% 16% 40% 15% 41% 17% 41% 17% 42% 17%Total 39% 17% 39% 17% 41% 17% 41% 18% 41% 19%Source: The Ohio Board of Regents HEI All Employee (AM) query - rundate: August 9, 2013
Note: Non-resident aliens as well as individuals whose race and ethnicity was unknown are assumed not to be a minority. Individuals who have two or more races are considered to be a minority. University of Toledo numbers reflect changes for their merger with Medical University of Ohio in 2008.
Table 7.10: Women and Minorities as a Percentage of Full-Time Faculty Selected Ohio 4-Year Institutions Fall 2008 - 2012
Table 7.11: Full-Time Faculty as a Percentage of Total Full-Time Employees Selected Ohio 4-Year Institutions Fall 2008 - 2012
Institution 2008 2009 2010 2011 2012
University of Akron 34% 33% 34% 33% 32%Bowling Green State University 38% 37% 39% 40% 41%University of Cincinnati 39% 40% 38% 38% 37%Cleveland State University 33% 33% 33% 34% 34%Central State University 26% 28% 26% 27% 27%Kent State University 29% 31% 31% 31% 30%Miami University 24% 25% 26% 27% NAOhio State University 21% 21% 21% 21% 17%Ohio University 29% 31% 31% 31% 30%Shawnee State University 35% 38% 40% 39% 40%University of Toledo 22% 24% 25% 41% 34%Wright State University 35% 36% 35% 36% 40%Youngstown State University 38% 38% 39% 39% 38%Total 27% 28% 28% 29% 27%Source: The Ohio Board of Regents HEI All Employee (AM) query. Run Date: August 9, 2013.
Note: Percentage is the total number of full-time faculty divided by the total number of full-time employees. University of Toledo numbers reflect changes for their merger with Medical University of Ohio.

161Section 7 - Faculty & Staff
Sec
tio
n
7
Table 7.12: Rate of Annual Student FTE to Number of Full-Time Faculty Selected Ohio 4-Year Institutions Fiscal Years 2008 - 2012
Table 7.13: Student FTE to Full-Time Staff Ratio Selected Ohio 4-Year Institutions Main Campuses Only Fall 2008 - 2012
Percent Change Institution 2008 2009 2010 2011 2012 1 Year 5 Year
University of Akron 23.4 24.5 26.0 27.4 28.3 3.6% 21.1%Bowling Green State University 19.8 20.3 19.5 19.1 18.8 -1.5% -4.9%University of Cincinnati 10.3 10.2 12.3 13.1 13.8 6.0% 34.4%Cleveland State University 22.1 22.9 24.3 26.2 26.6 1.6% 20.5%Central State University 18.2‡ 18.3‡ 20.3 20.0 22.1 10.3% 21.6%Kent State University 21.7‡ 22.8‡ 25.0 26.8 27.5 2.3% 26.7%Miami University 19.4 20.1 21.3 20.0 20.1 0.5% 3.8%Ohio State University 12.7‡ 12.5‡ 12.5 12.7 15.1 19.4% 19.0%Ohio University 22.3‡ 22.2‡ 23.5 26.3 27.5 4.6% 23.5%Shawnee State University 23.6 26.7 26.4 28.2 28.0 -0.9% 18.6%University of Toledo 14.8‡ 15.6‡ 17.0‡ 17.4 18.6 7.3% 26.1%Wright State University 16.7‡ 17.3‡ 18.3‡ 18.3 16.3 -10.6% -1.9%Youngstown State University 26.1 25.9 26.8 28.5 28.2 -0.9% 8.1%Total 16.4 16.6 17.6 18.1 19.4 6.7% 18.0%
Source: The Ohio Board of Regents HEI All Employee (AM) and Course Enrollment queries: run date: October 8, 2013 Note: Ratio equals the annualized student FTE for the fiscal year divided by the number of full-time faculty. University of Toledo numbers reflect changes for their merger with Medical University of Ohio. † Indicates that portions of the data for the year are not available from the institution. ‡ Indicates that unfinalized data has been included in this result.
Percent Change Institution 2008 2009 2010 2011 2012 1 Year 5 Year
University of Akron 11.6 12.4 12.9 12.7 12.1 -5.1% 3.6%Bowling Green State University 10.7 10.7 12.0 12.0 12.2 1.7% 13.7%University of Cincinnati 6.6 7.0 7.7 8.2 7.6 -7.9% 15.3%Cleveland State University 10.0 10.8 11.5 12.4 12.8 3.0% 28.2%Central State University 6.6† 7.5† 6.6 7.6 6.6 -13.3% -1.0%Kent State University 8.5† 10.6† 10.9† 11.8 11.4 -2.9% 35.0%Miami University 5.9 6.4 7.7 7.0 7.0 0.5% 19.2%Ohio State University 3.2† 3.2† 3.2 3.2† 2.7 -15.4% -15.7%Ohio University 9.1 9.7 10.8 11.3 10.7 -5.6% 18.3%Shawnee State University 12.9 16.8 17.8 18.0 17.7 -1.7% 37.1%University of Toledo 4.3 4.7† 5.4 11.2 8.4 -25.0% 96.4%Wright State University 8.9 9.5† 9.6† 9.7† 9.2 -5.2% 3.8%Youngstown State University 15.5 16.1 16.7 17.0 16.1 -5.3% 4.0%Total 5.9 6.3 6.6 7.0 6.4 -9.0% 8.0%
Source: The Ohio Board of Regents HEI All Employees (AM) and Course Enrollment (CN) queries - run date: October 9, 2013.Updated data for 2011 that was not available last year has now been added to this year’s table.* University of Toledo numbers reflect changes for their merger with Medical University of Ohio
Note: † Indicates institutions which had not finalized enrollment data by query date. Ratio equals the student FTE for the term divided by the number of full-time non-faculty employees employed on November 1 of each year.

Cleveland State University / 2013 Book of Trends162

Sec
tio
n
8
Book of Trends
Cleveland State University
2013
Selected Administrative Centers, Departments & Offices
8

Cleveland State University / 2013 Book of Trends164

165Section 8 - Selected Administrative Centers, Departments & Offices
Sec
tio
n
8
Application, Admission, and YieldTable 8.1: University Totals Application Trends Unduplicated for Degree-Seeking Students, Fall 2008 - 2012
Table 8.1a: New FirsT Year UNdergradUaTe applicaTioN TreNd For degree-seekiNg sTUdeNTs, Fall 2008 - 2012
First Year percent change
2008 2009 2010 2011 2012 1 year 5 year
Total Applied 3,957 4,347 4,366 4,838 5,819 20% 47% Admitted 2,573 2,850 2,830 3,059 3,721 22% 45% Enrolled 1,006 1,139 1,199 1,324 1,562 18% 55% Yield 39.1% 40.0% 42.4% 43.3% 42.0%
Table 8.1b: New TraNsFer UNdergradUaTe applicaTioN TreNd For degree-seekiNg sTUdeNTs, Fall 2008 - 2012
Transfer percent change
2008 2009 2010 2011 2012 1 year 5 year
Total Applied 2,906 3,199 3,223 3,198 3,769 18% 30% Admitted 2,046 2,128 2,228 2,059 2,288 11% 12% Enrolled 1,068 1,394 1,517 1,358 1,539 13% 44% Yield 52.2% 65.5% 68.1% 66.0% 67.3%
Table 8.1c: New law applicaTioN TreNd For degree-seekiNg sTUdeNTs, Fall 2008 - 2012
law percent change
2008 2009 2010 2011 2012 1 year 5 year
Total Applied 1,580 1,831 1,712 1,571 1,114 -29% -29% Admitted 575 561 223 579 471 -19% -18% Enrolled 192 183 173 149 124 -17% -35% Yield 33.4% 32.6% 77.6% 25.7% 26.3%
Table 8.1d: New gradUaTe applicaTioN TreNds For degree-seekiNg sTUdeNTs, Fall 2008 - 2012
graduate percent change
2008 2009 2010 2011 2012 1 year 5 year
Total Applied 3,352 3,702 3,814 3,973 4,108 3% 23% Admitted 1,864 2,079 2,171 2,185 2,206 1% 18% Enrolled 1,004 1,180 1,165 1,018 1,079 6% 7% Yield 53.9% 56.8% 53.7% 46.6% 48.9%
source: Institutional Research
Notes: Yield is calculated as the percent of those enrolled from the total admitted.

Cleveland State University / 2013 Book of Trends166
Office of Advancement
CSU FoundationAlumni, faculty, staff, friends, corporations and foundations support Cleveland State University each year with philanthropic gifts. These gifts provide additional resources that are necessary for sustaining a high quality educational experience for the University’s diverse student body. Various appeals and initiatives are conducted through the Annual Giving Program, including direct mailings to all alumni, student phonathon drives, specialized mailings from various departments within the University, an annual appeal among the faculty and staff of Cleveland State University, and collaboration with multiple special events held both on and off campus.
Table 8.2: CSU Foundation: 5-Year Endowment Growth by College/Division endowment (program giving & scholarship) percent change
college/division 2008 2009 2010 2011 2012 1 Year 5 Year
Business 3,686,995 3,141,323 3,572,103 6,497,561 6,751,369 4% 83%CLASS 1,961,787 1,718,310 1,743,532 2,048,334 2,105,107 3% 7%Education 6,082,783 4,897,851 5,289,436 6,105,603 5,979,224 -2% -2%Engineering 3,356,288 3,369,490 4,642,145 6,360,505 6,861,201 8% 104%Science 456,336 475,965 571,390 707,652 760,010 7% 67%Urban Affiars 4,833,990 3,809,094 4,207,683 4,906,531 5,091,246 4% 5%Law 6,781,211 5,999,966 7,466,503 8,773,829 9,048,175 3% 33%Athletics 1,497,619 1,346,880 1,516,901 1,756,498 1,733,176 -1% 16%General University 5,249,049 6,264,903 7,242,975 9,396,696 9,639,669 3% 84%Library 883,573 658,761 711,654 819,034 801,651 -2% -9%Office of the President 350,141 296,490 320,338 369,127 724,927 96% 107%Total endowment $35,139,773 $31,979,031 $37,284,660 $47,741,370 $49,495,755 4% 41%
program giving1 percent change
college/division 2008 2009 2010 2011 2012 1 Year 5 Year
Business 687,012 530,635 573,510 659,975 677,030 3% -1%CLASS 487,750 623,558 437,129 503,771 521,181 3% 7%Education 5,256,437 4,115,267 4,565,273 5,260,712 5,147,654 -2% -2%Engineering 1,078,417 801,862 1,460,579 1,778,371 1,880,219 6% 74%Science 237,151 182,842 218,515 256,636 261,279 2% 10%Urban Affiars 3,748,663 2,816,477 2,988,607 3,436,645 3,459,679 1% -8%Law 2,331,635 1,512,999 2,021,873 2,331,886 2,388,876 2% 2%Athletics 41,022 39,362 34,641 40,416 39,064 -3% -5%General University 665,155 694,302 1,012,040 1,353,675 1,442,663 7% 117%Library 883,573 658,761 711,654 819,034 801,651 -2% -9%Office of the President 350,141 296,490 320,338 369,127 724,927 96% 107%Total program $15,766,954 $12,272,555 $14,344,159 $16,810,248 $17,344,223 3% 10%
(continued on next page)
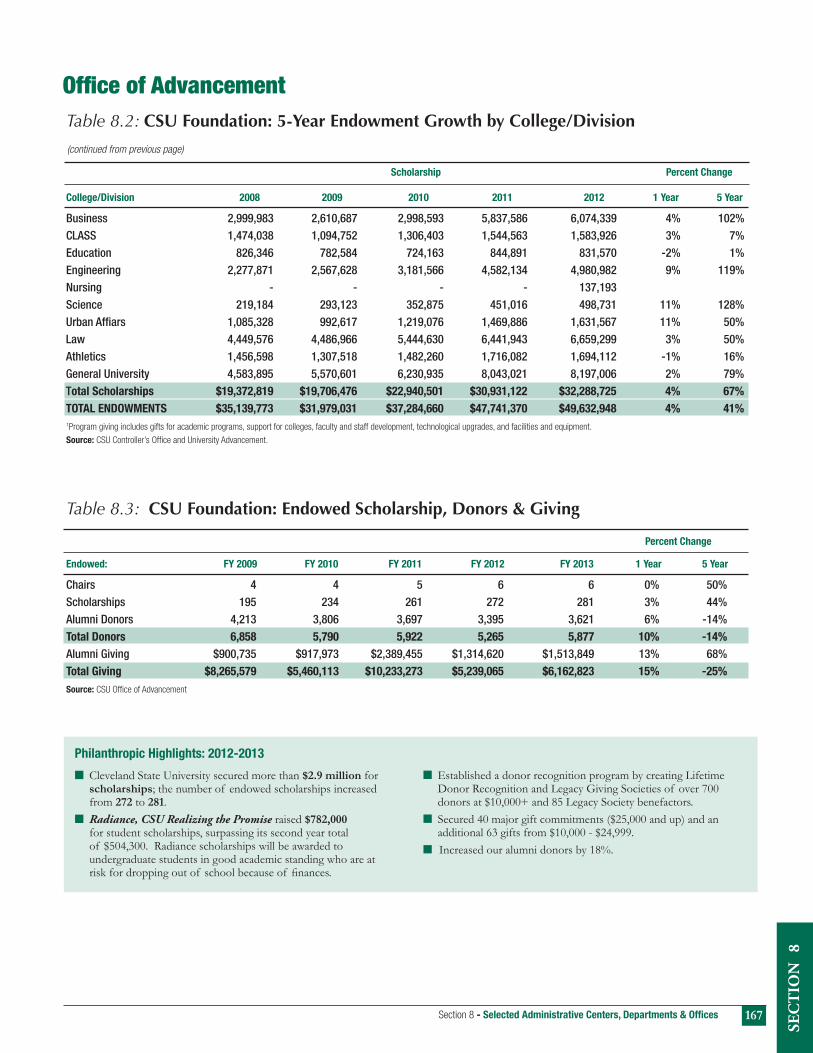
167Section 8 - Selected Administrative Centers, Departments & Offices
Sec
tio
n
8
Office of Advancement
philanthropic Highlights: 2012-2013
n Cleveland State University secured more than $2.9 million for scholarships; the number of endowed scholarships increased from 272 to 281.
n Radiance, CSU Realizing the Promise raised $782,000 for student scholarships, surpassing its second year total of $504,300. Radiance scholarships will be awarded to undergraduate students in good academic standing who are at risk for dropping out of school because of finances.
n Established a donor recognition program by creating Lifetime Donor Recognition and Legacy Giving Societies of over 700 donors at $10,000+ and 85 Legacy Society benefactors.
n Secured 40 major gift commitments ($25,000 and up) and an additional 63 gifts from $10,000 - $24,999.
n Increased our alumni donors by 18%.
Table 8.2: CSU Foundation: 5-Year Endowment Growth by College/Division
scholarship percent change
college/division 2008 2009 2010 2011 2012 1 Year 5 Year
Business 2,999,983 2,610,687 2,998,593 5,837,586 6,074,339 4% 102%CLASS 1,474,038 1,094,752 1,306,403 1,544,563 1,583,926 3% 7%Education 826,346 782,584 724,163 844,891 831,570 -2% 1%Engineering 2,277,871 2,567,628 3,181,566 4,582,134 4,980,982 9% 119%Nursing - - - - 137,193 Science 219,184 293,123 352,875 451,016 498,731 11% 128%Urban Affiars 1,085,328 992,617 1,219,076 1,469,886 1,631,567 11% 50%Law 4,449,576 4,486,966 5,444,630 6,441,943 6,659,299 3% 50%Athletics 1,456,598 1,307,518 1,482,260 1,716,082 1,694,112 -1% 16%General University 4,583,895 5,570,601 6,230,935 8,043,021 8,197,006 2% 79%Total scholarships $19,372,819 $19,706,476 $22,940,501 $30,931,122 $32,288,725 4% 67%ToTal eNdowMeNTs $35,139,773 $31,979,031 $37,284,660 $47,741,370 $49,632,948 4% 41%1Program giving includes gifts for academic programs, support for colleges, faculty and staff development, technological upgrades, and facilities and equipment.
source: CSU Controller’s Office and University Advancement.
(continued from previous page)
Table 8.3: CSU Foundation: Endowed Scholarship, Donors & Giving
percent change
endowed: FY 2009 FY 2010 FY 2011 FY 2012 FY 2013 1 Year 5 Year
Chairs 4 4 5 6 6 0% 50%Scholarships 195 234 261 272 281 3% 44% Alumni Donors 4,213 3,806 3,697 3,395 3,621 6% -14%Total donors 6,858 5,790 5,922 5,265 5,877 10% -14%Alumni Giving $900,735 $917,973 $2,389,455 $1,314,620 $1,513,849 13% 68%Total giving $8,265,579 $5,460,113 $10,233,273 $5,239,065 $6,162,823 15% -25%source: CSU Office of Advancement

Cleveland State University / 2013 Book of Trends168
AthleticsTable 8.4: Athletic Sports at Cleveland State University by EnrollmentMeN’s sporTs
2008-2009 2009-2010 2010-2011 2011-2012 2012-2013
enrollment % enrollment % enrollment % enrollment % enrollment %
Baseball 31 25% 25 21% 23 19% 5 5% 5 5%Basketball 13 11% 13 11% 13 11% 13 14% 12 13%Fencing 4 3% 2 2% 0 0% 0 0% 0 0%Golf 9 7% 8 7% 11 9% 7 7% 9 10%Soccer 19 16% 23 20% 26 21% 22 23% 20 21%Swimming & Diving 19 16% 19 16% 24 20% 19 20% 19 20%Tennis 8 7% 8 7% 9 7% 8 8% 8 9%Wrestling 19 16% 19 16% 17 14% 22 23% 21 22%Total Men 122 100% 117 100% 123 100% 96 100% 94 100%cumulative gpa, Males 2.83 2.91 2.95 2.88 2.96
woMeN’s sporTs
2008-2009 2009-2010 2010-2011 2011-2012 2012-2013
enrollment % enrollment % enrollment % enrollment % enrollment %
Basketball 15 14% 14 13% 12 11% 13 11% 13 11%Cross Country 8 7% 6 6% 9 8% 12 10% 9 8%Fencing 3 3% 1 1% 0 0% 0 0% 0 0%Golf 7 7% 6 6% 6 5% 7 6% 8 7%Soccer 19 18% 19 18% 20 18% 23 20% 22 19%Softball 19 18% 21 20% 19 17% 19 16% 21 18%Swimming & Diving 17 16% 17 16% 25 22% 23 20% 22 19%Tennis 6 6% 7 7% 8 7% 7 6% 8 7%Volleyball 13 12% 13 13% 13 12% 12 10% 12 10%Total women 107 100% 104 100% 112 100% 116 100% 115 100%cumulative gpa, Females 3.26 3.26 3.29 3.26 3.31 Total all athletes 229 221 235 212 209 cumulative gpa, all athletes 3.01 3.08 3.11 3.08 3.16 Note: Enrollment reflects students who received athletic financial aid. GPA reflects fall term. source: CSU Athletics Department
Highlights • Cleveland State captured the 2012-13 James J. McCafferty Trophy, presented annually by
the Horizon League in recognition of the league’s all-sport champion. It is the second time CSU won the award (2007-08).
• CSU also won the Men’s All-Sports Award, scoring the most points among the men’s sports among the nine schools in the Horizon League.
• The Vikings won four Horizon League Championships this year; men’s soccer, volleyball, men’s swimming and diving and men’s tennis.
• In addition, women’s swimming and diving and men’s golf finished as Horizon League runner-up.
• Cross country runner Kelly Zaleski was named the Spring 2013 College of Nursing Valedictorian as well as the Spring 2013 Class Valedictorian.
• Junior wrestler Ben Willeford captured the 125-pound title at the EWL Championship and advanced to the NCAA Championship. He was joined at nationals by freshman heavyweight
Riley Shaw who finished third at the EWL Championship.• Senior softball standout Dara Toman was named the Horizon League Player of the Year and
concluded her career as the all-time leader in home runs in Horizon League history with 60.• The cross country team earned All-Academic Team honors from the United States Track and
Field/Cross Country Coaches Association.• Both the men’s and women’s swimming and diving teams were named Scholar All-America
Teams by the College Swimming Coaches Association of America.• Seniors Kara Koch (volleyball) and Dara Toman (softball) and juniors Andrew Bailey (men’s
golf) and Al Shillito (men’s swimming) were all named Horizon League Player of the Year in their respective sports.
• Three head coaches - Chuck Voss of volleyball, Ali Kazemaini from men’s soccer and Wally Morton of men’s swimming and diving - were honored as Horizon League Coaches of the Year.
Table 8.5: Athletic Sports at Cleveland State University 4, 5, and 6 Year Graduation Rate
New Undergraduate First-time, Fall
degree-seeking, 2002 2003 2004 2005 2006
First Year athletes enrollment % enrollment % enrollment % enrollment % enrollment %
Total athletes 34 40 55 56 50 Athletes graduated in 4 years 15 44% 12 30% 10 18% 19 34% 17 34%Athletes graduated in 5 years 7 21% 11 28% 19 35% 11 20% 14 28%Athletes graduated in 6 years 4 12% 1 3% 2 4% 0 0% 1 2%Total athletes graduated ≤ 6 Years 26 76% 24 60% 31 56% 30 54% 32 64%

169Section 8 - Selected Adm
inistrative Centers, Departments &
Offices
Section 8
Table 8.6: Statement of Revenues, Expenditures and Other Changes Fiscal Years 2008 – 2012
2008 2009 2010 2011 2012 percent change
$ amount % $ amount % $ amount % $ amount % $ amount % 1 year 5 year
operaTiNg reVeNUes Student Tuition and Fees, Net 116,662,514 73% 115,263,410 74% 126,182,341 75% 140,713,140 76% 148,869,484 75% 6% 28%Federal Grants & Contracts 15,876,339 10% 9,681,219 6% 11,992,099 7% 9,944,701 5% 10,584,556 5% 6% -33%State Grants & Contracts 4,713,781 3% 5,504,478 4% 6,296,917 4% 5,726,269 3% 8,973,341 5% 57% 90%Local Grants & Contracts 655,670 0% 681,071 0% 490,186 0% 765,192 0% 263,589 0% -66% -60%Private Gifts, Grants & Contracts 2,260,372 1% 2,922,127 2% 1,701,310 1% 2,772,540 1% 2,695,376 1% -3% 19%Sales & Services 4,567,254 3% 4,709,650 3% 4,773,836 3% 4,297,708 2% 4,524,083 2% 5% -1%Auxiliary Enterprises 15,289,171 10% 15,433,175 10% 15,912,209 9% 20,845,190 11% 22,458,921 11% 8% 47%Other Sources 454,031 0% 569,657 0% 417,549 0% 500,246 0% 377,838 0% -24% -17%ToTal operaTiNg reVeNUes 160,479,132 100% 154,764,787 100% 167,766,447 100% 185,564,986 100% 198,747,188 100% 7% 24% operaTiNg eXpeNses Instruction 92,620,024 36% 95,209,808 35% 92,025,220 34% 94,507,110 32% 91,932,544 33% -3% -1%Research 13,768,194 5% 12,880,105 5% 9,688,834 4% 12,295,867 4% 14,961,949 5% 22% 9%Public Service 12,505,036 5% 11,357,482 4% 11,186,289 4% 8,193,701 3% 5,997,307 2% -27% -52%Academic Support 22,213,611 9% 24,067,498 9% 22,934,405 9% 23,531,908 8% 23,017,435 8% -2% 4%Student Services 18,225,802 7% 19,781,003 7% 20,105,695 7% 20,953,129 7% 17,787,324 6% -15% -2%Institutional Support 25,885,712 10% 29,714,486 11% 28,300,239 10% 30,856,817 11% 27,057,901 10% -12% 5%Operation & Maintenance of Plant 18,331,523 7% 22,711,537 8% 24,816,384 9% 26,045,710 9% 27,975,181 10% 7% 53%Scholarships and Fellowships 12,134,617 5% 10,876,936 4% 17,572,385 7% 19,842,144 7% 18,018,604 6% -9% 48%Auxiliary Enterprises 23,215,882 9% 25,553,858 9% 23,386,092 9% 31,200,532 11% 29,152,533 10% -7% 26%Depreciation and Amortization 18,363,172 7% 17,742,326 7% 19,722,338 7% 24,818,443 8% 24,203,824 9% -2% 32%ToTal operaTiNg eXpeNses 257,263,573 100% 269,895,039 100% 269,737,881 100% 292,245,361 100% 280,104,602 100% -4% 9%
(Continued on next page)
Finance

Cleveland State U
niversity / 2013 Book of Trends170
Table 8.6: Statement of Revenues, Expenditures and Other Changes Fiscal Years 2008 – 2012
2008 2009 2010 2011 2012 percent change
$ amount % $ amount % $ amount % $ amount % $ amount % 1-year 5-year
NoN-operaTiNg iTeMs State Appropriations 72,934,809 76% 79,056,333 74% 63,692,313 51% 63,544,555 55% 64,434,747 69% 1% -12%Federal Appropriations 0 0 10,367,388 10,567,874 - 0% Federal Grants and Contracts 12,551,220 13% 13,998,357 13% 21,555,446 17% 26,129,061 22% 23,453,217 25% -10% 87%State Grants and Contracts 3,886,127 4% 4,015,508 4% 3,279,699 3% 3,392,498 3% 2,646,337 3% -22% -32%Gifts 6,371,709 7% 4,557,213 4% 4,477,080 4% 4,390,082 4% 7,196,632 8% 64% 13%Investment Income -552,911 -1% -6,546,238 -6% 7,698,092 6% 13,179,158 11% 1,048,743 1% -92% -290%Interest on Debt -2,908,053 -3% -3,360,216 -3% -5,275,459 -4% -9,460,196 -8% (9,034,400) -10% -5% 211%State Capital Appropriations 3,384,009 4% 15,069,316 14% 19,978,296 16% 4,615,439 4% 3,179,823 3% -31% -6%Capital Gifts 233,450 0% 12,245 0% 0 0% 0 0% 0 0% Other Nonoperating Items 0 0% 0 0% 0 0% 0 0% 0 0% ToTal NoNoperaTiNg iTeMs 95,900,360 100% 106,802,518 100% 125,772,855 100% 116,358,471 100% 92,925,099 100% -20% -3%NeT asseTs Increase in Net Assets -884,081 0% -8,327,734 -3% 23,801,421 7% 9,678,096 3% 11,567,685 3% 20% -1408%Net Assets at Beginning of Year 322,469,511 100% 321,585,430 103% 313,257,696 93% 337,059,117 97% 346,737,213 97% 3% 8%NeT asseTs aT eNd oF Year 321,585,430 100% 313,257,696 100% 337,059,117 100% 346,737,213 100% 358,304,898 100% 3% 11%source: CSU Controller’s Office
(Continued from previous page)
Figure 8.6a: Total Revenues Fiscal Years 2008 - 2012
Figure 8.6b: Operating Expenses Fiscal Years 2008 - 2012
Finance

171Section 8 - Selected Administrative Centers, Departments & Offices
Sec
tio
n
8
FinanceTable 8.7: Public Service Expenditures as a Percentage of Total Expenditures Selected Ohio 4-Year Institutions - Main Campuses Only Fiscal Years 2008 - 2012
institution 2008 2009 2010 2011 2012
University of Akron 5.3% 4.7% 4.0% 3.6% 3.1%
Bowling Green State University 2.2% 2.1% 2.0% 1.7% 1.4%
University of Cincinnati 6.1% 6.0% 5.7% 5.5% 5.8%
cleveland state University 5.0% 4.2% 4.2% 2.9% 2.2%
Central State University 3.7% 3.6% 2.7% 2.9% 4.4%
Kent State University 3.2% 3.5% 3.4% 2.8% 2.7%
Medical University of Ohio NA NA NA NA NA
Miami University 0.6% 0.6% 0.5% 0.4% 0.2%
Ohio State University 3.2% 3.0% 2.8% 2.5% 2.4%
Ohio University 4.0% 4.1% 3.8% 4.4% 4.4%
Shawnee State University 5.4% 5.6% 5.6% 4.0% 2.9%
University of Toledo 2.2% 0.8% 1.6% 0.8% 0.7%
Wright State University 3.4% 3.3% 3.3% 3.2% 3.7%
Youngstown State University 2.4% 2.2% 2.2% 2.3% 2.6%
Totals 3.3% 3.2% 3.0% 2.7% 2.7%
source: The Ohio Board of Regents HEI Current Fund Expenditures (CF) queries. Run Date: June 25, 2013. Note: Percentage equals the expenditures for public service for the fiscal year divided by the total expenditures.
Highlight
n In proportion to total spending, Cleveland State University’s Public Service expenditures have consistently remained among the highest in the state of Ohio.
Table 8.8: Benefit Expenditures as a Percentage of Total Funding Unit Expenditures Selected Ohio 4-Year Institutions - Main Campuses Only Fiscal Years 2008 - 2012
institution 2008 2009 2010 2011 2012
University of Akron 15.0% 15.7% 16.2% 16.1% 15.9%Bowling Green State University 12.8% 13.2% 12.7% 13.0% 14.4%University of Cincinnati 14.6% 13.5% 15.0% 15.4% 16.2%cleveland state University 15.4% 15.5% 15.7% 15.7% 15.1%Central State University 24.9% 27.4% 27.0% 27.3% 25.6%Kent State University 12.0% 11.8% 12.1% 12.4% 12.5%Medical University of Ohio 15.9% NA NA NA NAMiami University 16.8% 17.4% 17.1% 18.9% 17.8%Ohio State University 24.2% 23.7% 22.5% 23.6% 26.6%Ohio University 26.3% 25.7% 27.3% 26.2% 23.5%Shawnee State University 25.8% 25.7% 28.4% 27.1% 25.5%University of Toledo 15.4% 15.4% 17.0% 17.3% 17.5%Wright State University 13.8% 14.3% 15.5% 14.8% 12.0%Youngstown State University 21.1% 19.3% 21.3% 20.9% 23.0%Totals 19.1% 18.9% 19.1% 19.6% 20.5%
source: The Ohio Board of Regents HEI Funding Unit Expenditures (FX) queries. Rundate: July 24, 2013. Note: Percentage equals the expenditures for benefits during the fiscal year divided by total funding unit expenditures.

Cleveland State University / 2013 Book of Trends172
Table 8.9: Scholarship & Fellowship Expenditures as a Percentage of Total Expenditures Selected Ohio 4-Year Institutions - Main Campuses Only Fiscal Years 2008 - 2012
institution 2008 2009 2010 2011 2012
University of Akron 9.1% 10.0% 13.6% 15.5% 14.7%Bowling Green State University 20.3% 19.5% 20.1% 22.1% 20.0%University of Cincinnati 11.5% 11.7% 12.8% 13.4% 13.4%cleveland state University 10.1% 9.8% 12.7% 13.0% 12.6%Central State University 16.6% 18.2% 21.1% 24.0% 22.5%Kent State University 12.0% 12.6% 16.2% 17.8% 17.2%Medical University of Ohio 0.4% NA NA NA NAMiami University 9.5% 11.4% 12.9% 14.6% 15.8%Ohio State University 5.0% 5.0% 5.6% 5.7% 5.8%Ohio University 9.9% 10.6% 12.7% 13.7% 12.4%Shawnee State University 20.8% 22.7% 25.3% 26.8% 26.4%University of Toledo 14.1% 8.9% 10.9% 12.3% 11.9%Wright State University 10.7% 11.9% 14.3% 15.6% 14.2%Youngstown State University 16.6% 17.7% 20.4% 20.6% 20.7%Totals 8.6% 8.9% 10.3% 11.0% 10.8%source:The Ohio Board of Regents HEI Current Fund Expenditures (CF) queries. Run Date: July 26, 2013.
Note: Percentage equals the expenditures for scholarships and fellowships divided by total expenditures.
Finance
Cleveland State University’s Financial Aid ProgramsFinancial aid is money that is provided to help bridge the gap between students’ own resources and the amount of money needed to pay the cost of attending college. Approximately 71 percent of Cleveland State’s students receive some form of financial assistance. The University participates in or administers all of the major federal and state grant and loan programs. In addition, Cleveland State provides University grants and scholarships.
Table 8.10: Financial Aid Awards to Undergraduate Students by Full-Time/Part-Time Status, Average Aid Package and Academic Year
academic Year percent change
2008-09 2009-10 2010-11 2011-12 2012-13 1 year 5 year
Full-time students with Financial aid: Enrollment 5,185 5,666 6,580 6,647 6,434 -3% 24%Average Aid Package $8,136 $8,565 $8,950 $8,755 $8,821 1% 8% part-time students with Financial aid: Enrollment 862 1,017 1,111 1,292 1,631 26% 89%Average Aid Package $6,231 $6,528 $6,955 $6,652 $5,896 -11% -5%
source: Common Data Set, H2-row D and row J
Financial aid reported reflects awards to undergraduates enrolled in the fall term of the academic year. Although the university awards a substantial amount of financial aid to additional students, this data reflects a particular point in time by using standard figures as defined by IPEDS (http://nces.ed.gov/ipeds/) and the Common Data Set (www.commondataset.org).
Financial Aid Office
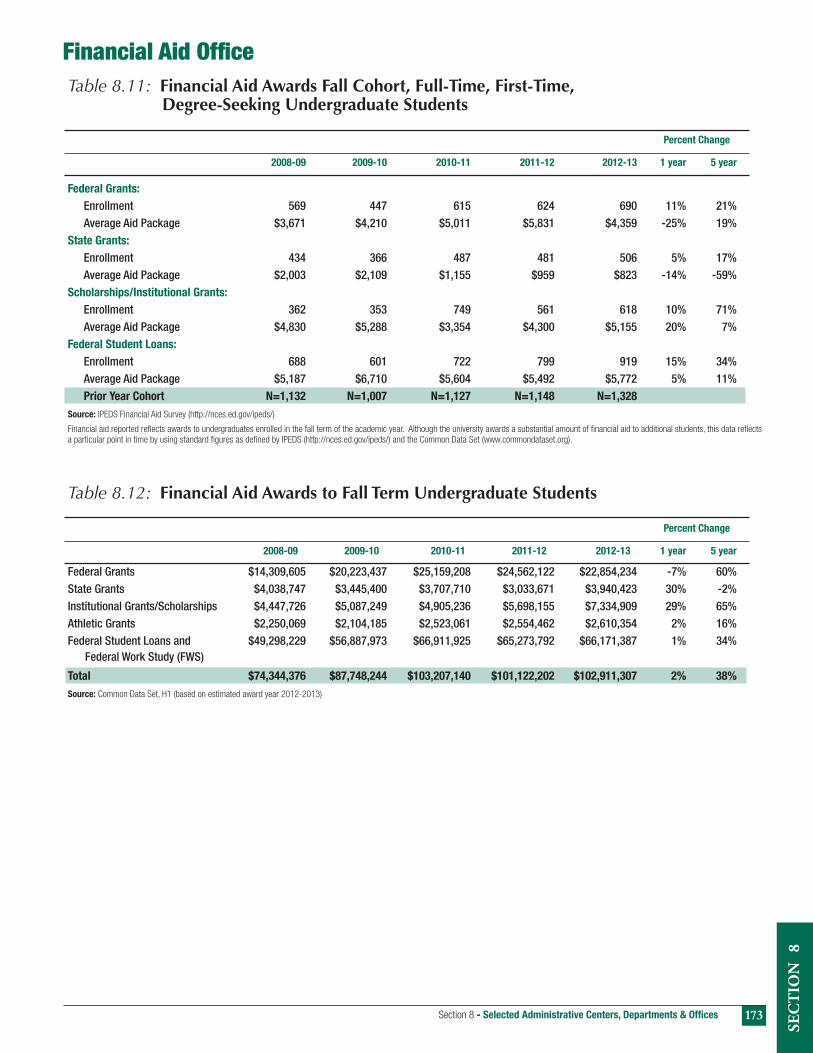
173Section 8 - Selected Administrative Centers, Departments & Offices
Sec
tio
n
8
Table 8.11: Financial Aid Awards Fall Cohort, Full-Time, First-Time, Degree-Seeking Undergraduate Students
percent change
2008-09 2009-10 2010-11 2011-12 2012-13 1 year 5 year
Federal grants: Enrollment 569 447 615 624 690 11% 21% Average Aid Package $3,671 $4,210 $5,011 $5,831 $4,359 -25% 19%state grants: Enrollment 434 366 487 481 506 5% 17% Average Aid Package $2,003 $2,109 $1,155 $959 $823 -14% -59%scholarships/institutional grants: Enrollment 362 353 749 561 618 10% 71% Average Aid Package $4,830 $5,288 $3,354 $4,300 $5,155 20% 7%Federal student loans: Enrollment 688 601 722 799 919 15% 34% Average Aid Package $5,187 $6,710 $5,604 $5,492 $5,772 5% 11% prior Year cohort N=1,132 N=1,007 N=1,127 N=1,148 N=1,328 source: IPEDS Financial Aid Survey (http://nces.ed.gov/ipeds/)
Financial aid reported reflects awards to undergraduates enrolled in the fall term of the academic year. Although the university awards a substantial amount of financial aid to additional students, this data reflects a particular point in time by using standard figures as defined by IPEDS (http://nces.ed.gov/ipeds/) and the Common Data Set (www.commondataset.org).
Table 8.12: Financial Aid Awards to Fall Term Undergraduate Students
percent change
2008-09 2009-10 2010-11 2011-12 2012-13 1 year 5 year
Federal Grants $14,309,605 $20,223,437 $25,159,208 $24,562,122 $22,854,234 -7% 60%State Grants $4,038,747 $3,445,400 $3,707,710 $3,033,671 $3,940,423 30% -2%Institutional Grants/Scholarships $4,447,726 $5,087,249 $4,905,236 $5,698,155 $7,334,909 29% 65%Athletic Grants $2,250,069 $2,104,185 $2,523,061 $2,554,462 $2,610,354 2% 16%Federal Student Loans and $49,298,229 $56,887,973 $66,911,925 $65,273,792 $66,171,387 1% 34% Federal Work Study (FWS)
Total $74,344,376 $87,748,244 $103,207,140 $101,122,202 $102,911,307 2% 38%source: Common Data Set, H1 (based on estimated award year 2012-2013)
Financial Aid Office

Cleveland State University / 2013 Book of Trends174
Table 8.13: Graduate Student Financial Aid Awards by Full-Time/Part-Time Status and Average Aid Package
percent change
2007-08 2008-09 2009-10 2010-11 2011-12 1 year 5 year
Full-time students with Financial aid: Enrollment 442 459 531 528 593 12.3% 34.2% Average Aid Package $18,423 $17,804 $18,993 $18,708 $20,106 7.5% 9.1%part-time students with Financial aid: Enrollment 1406 1615 1783 2044 2033 -0.5% 44.6% Average Aid Package $14,207 $14,956 $14,720 $15,220 $15,089 -0.9% 6.2%
source: CSU Financial Aid Office
Table 8.14: Graduate Student Financial Aid Awards by Types of Financial Aid Fall 2008 - 2012
percent change
Types of Financial aid 2007-08 2008-09 2009-10 2010-11 2011-12 1 year 5 year
State Fellowship $21,000 $42,530 $95,734 $134,297 $92,439 -31.2% 340.2%Scholarships/Institutional Grants $3,371,126 $3,415,556 $3,421,145 $4,454,489 $4,300,000 -3.5% 27.6%Non-Institutional Assistance $277,806 $266,696 $325,532 $411,982 $315,577 -23.4% 13.6%Federal Student Loans and $24,449,124 $28,619,640 $32,505,934 $35,861,289 $37,801,004 5.4% 54.6% Federal Work Study (FWS)source: CSU Financial Aid Office
Table 8.15: Law Student Financial Aid Awards Full-Time/Part-Time Status and Average Aid Package
percent change
2007-08 2008-09 2009-10 2010-11 2011-12 1 year 5 year
Full-time students with Financial aid: Enrollment 452 425 435 420 391 -6.9% -13.5% Average Aid Package $24,656 $26,026 $28,369 $29,734 $31,387 5.6% 27.3%part-time students with Financial aid: Enrollment 161 160 128 133 122 -8.3% -24.2% Average Aid Package $18,870 $21,753 $22,714 $23,378 $24,353 4.2% 29.1%source: CSU Financial Aid Office
See notes at the end of Financial Aid Section
Table 8.16: Law Student Financial Aid Awards by Types of Financial Aid Fall 2008 - 2012
percent change
Types of Financial aid 2007-08 2008-09 2009-10 2010-11 2011-12 1 year 5 year
State Fellowship $0 $0 $0 0 0 - -Scholarships/Institutional Grants $1,397,029 $1,481,970 $1,875,318 1,941,719 1,959,025 0.9% 40.2%Non-Institutional Assistance $235,963 $268,645 $251,051 88,912 66,819 -24.8% -71.7%Federal Student Loans and $12,549,770 $12,790,953 $13,121,684 13,567,000 13,217,639 -2.6% 5.3% Federal Work Study (FWS)
source: CSU Financial Aid Office
See notes at the end of Financial Aid Section
Financial Aid Office

175Section 8 - Selected Administrative Centers, Departments & Offices
Sec
tio
n
8
Table 8.17: Undergraduate Cost of Attendance (COA)
academic Year
2007-08 2008-09 2009-10 2010-11 2011-12 2012-13
Tuition/Fees $7,920 $7,970 $7,970 $8,660 $9,002 $9,316Books and Supplies $800 $800 $800 $800 $800 $800Room/Board $8,098 $8,700 $9,230 $9,470 $11,842 $11,662Personal/Miscellaneous $2,500 $2,500 $2,500 $2,500 $2,500 $1,700Transportation $1,400 $1,800 $1,800 $1,800 $1,800 $1,460Loan Fees $0 $0 $0 $0 $0 $0Total $20,718 $21,770 $22,300 $23,230 $25,944 $24,938source: CSU Financial Aid Office
Table 8.18: Annualized Full-Time Undergraduate Tuition & Fees for Selected Main Campuses of Ohio 4-Year Institutions 2012 - 2013*
University Main campuses in-state out-of-state
Bowling Green State University $10,394 $17,702
cleveland state University $9,314 $12,436
Kent State University $9,672 $17,632
Miami University $13,523 $29,087
Ohio State University $10,037 $25,445
Ohio University $10,282 $19,246
University of Akron $9,862 $18,063
University of Cincinnati $10,784 $25,816
University of Toledo $9,196 $18,316
Youngstown State University $7,712 $10,467
source: Data from Ohio Board of Regents Fall 2012 Survey of Student Charges for Academic Year 2012-2013
http://www.ohiohighered.org/files/uploads/financial/Fall_12_SurveryofChanges.pdf
Financial Aid Office

Cleveland State University / 2013 Book of Trends176
Financial Aid OfficeTable 8.19: Award of Financial Aid at Ohio’s Public Title lV Postsecondary Institutions Percent of First-Time, Full-Time, Degree-Seeking Students Receiving Aid Average Award Amounts, Academic Year 2010 - 2011
any grant Federal grants state grants institutions grants Federal and other loans
institution any aid % % avg. grant $ % avg. grant $ % avg. grant $ % avg. grant $ % avg. grant $
Bowling Green State University 96% 88% $6,201 41% $4,580 26% $1,119 75% $4,410 73% $6,630
Central State University 97% 93% $8,156 85% $5,610 NC NC 79% $3,571 90% $6,840
cleveland state University 92% 80% $7,063 54% $5,831 42% $959 49% $4,300 70% $5,888
Kent State University 90% 74% $6,053 40% $4,944 27% $1,068 57% $3,850 71% $6,940
Miami University 75% 70% $7,211 21% $5,478 10% $861 67% $5,702 47% $6,719
Ohio State University 82% 70% $7,543 20% $4,618 12% $1,434 69% $6,075 44% $6,662
Ohio University 89% 60% $6,171 30% $4,768 18% $1,334 58% $3,588 70% $6,575
Shawnee State University 94% 81% $4,966 65% $4,431 50% $574 32% $2,781 74% $5,772
University of Akron 91% 75% $6,002 50% $4,689 37% $860 36% $5,152 71% $6,560
University of Cincinnati 83% 58% $7,287 24% $5,101 15% $952 53% $5,471 62% $5,743
University of Toledo 99% 97% $7,334 52% $5,117 37% $1,022 87% $4,703 69% $6,304
Wright State University 89% 71% $5,939 48% $4,893 37% $1,090 53% $2,664 71% $6,593
Youngstown State University 96% 75% $6,490 60% $4,921 50% $1,015 35% $4,069 71% $6,241
University Main campuses 89% 74% $6,674 39% $4,912 26% $1,032 59% $4,726 64% $6,473
source: https://www.ohiohighered.org/sites/ohiohighered.org/files/Finaid_2010-11_report.pdf

177Section 8 - Selected Administrative Centers, Departments & Offices
Sec
tio
n
8
NotesThe undergraduate financial aid reported reflects awards to undergraduate students enrolled in the fall semester of the academic year. The university awards financial aid on a continuous basis throughout the academic year. However, this data reflects a specific point and time as defined by IPEDS http://nces.ed.gov/ipeds/datacenter and the Common Data Set (www.commondataset.org), generally accepted as the 15th day of fall semester.
For financial aid calculations; full-time undergraduate, graduate and law students are those enrolled for 12 or more credit hours. Part-time undergraduate students are enrolled for 11 or fewer credit hours. Part-time graduate and law student enrollment ranges from 6 to 11 credit hours.
The “Cost of Attendance” tables reflect the estimated average cost of attendance for a full-time, in-state student attending CSU for two (2) semesters during the academic year, and includes estimated tuition and fee charges, books, allowances for room and board, transportation and personal/miscellaneous.
Types of Financial AidFederal grants: Pell Grant, Supplemental Opportunity Educational Grant (SEOG). TEACH Grant.
state grants for Undergraduates: Ohio College Opportunity Grant (OCOG) and Other State tuition grant programs.
state aid for graduate/law students: Graduate and Professional Fellowship.
scholarship/institutional grants for Undergraduates: Refer to http://www.csuohio.edu/enrollmentservices/financialaid/scholarships.
scholarship/institutional grants for graduate/law students: Includes Graduate Assistantships, Tuition Waiver and Scholarships.
Non-institutional aid: Assistance awarded from external agencies.
Federal student loans: Stafford subsidized/unsubsidized and Federal Perkins loans.
Fws: A federally-funded student employment program established to assist students through part-time, on-campus positions or off-campus community service positions.
Financial Aid Office

Cleveland State University / 2013 Book of Trends178
Center for International Services & Programs
International ServicesThe Center for International Services & Programs (CISP) seeks to build a globally oriented, metropolitan university community where students, faculty and staff gain and share international knowledge and experience. Established in 1996 as a separate university entity and now a part of the Division of Enrollment Services, the Center provides CSU international students and visitors with a wide array of support services to help them achieve a positive learning experience while in the United States and Ohio. A second focus of the Center is supporting and facilitating education abroad opportunities for CSU students. This is accomplished by supporting Faculty-led (short term) courses and programs, assisting students in identifying education abroad options, administering scholarships and other related education abroad initiatives. A third area of focus is to facilitate, develop, and support international academic initiatives within each department and college, including faculty Fulbright Program participation.
A full description of Center services and programs can be found at: http://www.csuohio.edu/offices/international.
Year scholar countries/regions Visited
1973-1989 14 1990-1991 1 Portugal1992-1993 2 Hungary, Czechoslovakia1993-1994 3 India, Ethiopia, China1994-1995 2 Salvador, Ethiopia1995-1996 1 China1997-1998 4 Kenya, Nigeria, Japan, Lithuania1998-1999 5 Kenya, Nigeria, Russia, Germany, Norway1999-2000 4 Kyrgyzstan, India, Germany2000-2001 3 Sri Lanka, Germany, Brazil2001-2002 1 Israel2002-2003 6 Botswana, Zambia, Uganda, India, Nepal, Russia2003-2004 4 Croatia, Guatemala, South Africa2004-2005 2 Bulgaria, United Arab Emirates2005-2006 6 Morocco, South Africa, Zambia, Latvia, Taiwan2006-2007 1 Kyrgyzstan2007-2008 2 Nepal, Sri Lanka2008-2009 4 Argentina, Chile, Nepal, Slovakia2009-2010 2 Australia, Nigeria2010-2011 7 Costa Rica, Finland, India, Kenya, Taiwan, Turkey2011-2012 2 Columbia, Turkey2012-2013 6 Azerbaijan, South Africa, Montenegro, India, Taiwan, TurkeyToTal 82
Source: Center for International Services & Programs
Table 8.20: CSU Fulbright Scholar Awards 1973-2013
Center for International Services & Programs

179Section 8 - Selected Administrative Centers, Departments & Offices
Sec
tio
n
8
college academic initiatives activities
Table 8.21: Cleveland State University International Academic Initiatives
Liberal Arts & Social Sciences (CLASS)
Business
Business & CLASS
Education & Human Services
Engineering
Law
Sciences & HealthProfessions
Middle Eastern Studies Program
Masters Program in Global Interactions
Modern Languages
Interdisciplinary Studies
Expand international business education and outreach services in Northeast Ohio
Faculty Led Short Programs
Confucius Institute
New Academic Program
Indian Certification
China Joint Degrees
Presently developing a Study Abroad option which will include language and culture studies. Have applied for a Fulbright Scholar in residence grant.
Prepares students for a career in a global environment through an interdisciplinary set of courses. International Relations majors will concentrate in an in-depth study of one of the following areas: International Business and Economics, Asia Studies, Central and Post-Soviet States, Africa and the Middle East, or Latin America and the Caribbean.
Arabic courses, Chinese courses, English Translations of Foreign Literature (ENF) courses, French (B.A.), German (B.A. - suspended) minor, Greek courses, Italian courses, Japanese courses, Latin courses, Modern Language (culture; or languages such as Portuguese, Russian, or Quechua) courses, Spanish (B.A.).
Slovenian Studies Center is created in conjunction with the government of Slovenia, CSU, LCC, KSU, BGSU. Courses will be offered in Slovenian culture and language. Global Trade Scholar program; Provide market research, international trade and investment assistance; Improve credit transfer between community colleges and CSU for international business degree programs. Recently signed agreements with Friedrich Alexander University, University of Lubjana School of Economics.
Study Tour of Chile Language and Culture in Mexico Study Tour of German Language and Culture in Costa Rica Study Tour of Paris Study in Spain Explore the Auvergne Region and Paris International Marketing and Business Research in England Study trip to Japan, they have also added trips to Abu Dhabia and China
Providing programming in Chinese Language K-12 Instruction throughout the greater Cleveland area. Special Program to China for Students of Leadership Academy and Cleveland Heights School District. They continue to develop a Chinese as a Second Language Certificate
Developed a 3+1+1 academic program in Electrical Engineering, Applied Biomedical Engineering and Software Engineering with Bahcesehir University in Turkey. A group of students have done Engineers without Borders to Belize.
CSU Law School Degree recognized in India.
Shenyang Pharmaceutical, Three Gorges University, Guangxi Teacher Education,and Guangxi University

Cleveland State University / 2013 Book of Trends180
Table 8.22: Study Abroad Student Headcount by Academic Year (Summer, Fall & Spring) and Program Type
percent change
program Type 2008-09 2009-10 2010-11 2011-12 2012-13 1 year 5 year
Faculty Led 117 119 146 167 168 1% 44%Exchange 5 4 4 4 3 -25% -40%Internship 2 5 7 4 4 0% 100%Independent 41 23 33 28 18 -36% -56%Law Institute* - - - - - ToTal 165 151 190 203 193 -5% 17%*No longer administered through Cleveland State (moved to the University of Arkansas summer 2007)
Table 8.23: Study Abroad Student Headcount by Academic Year (Summer, Fall & Spring) and College
percent change
college 2008-09 2009-10 2010-11 2011-12 2012-13 1 year 5 year
Business 80 83 96 131 122 -7% 53%CLASS 60 37 53 41 51 24% -15%Science 10 10 6 8 17 113% 70%Education 4 13 23 11 4 -64% 0%Engineering - 2 - 5 2 -60% #DIV/0!Urban 2 1 5 4 2 -50% 0%Law 12 6 9 5 - -100% -100%ToTal 168 152 192 205 198 -3% 18% Note: Includes duplicate counts for students who were double majors across two different colleges.
Table 8.24: Study Abroad Student Headcount by Academic Year (Summer, Fall & Spring) and Course Level
percent change
course level 2008-09 2009-10 2010-11 2011-12 2012-13 1 year 5 year
Undergraduate 97 80 104 77 114 48% 18%Graduate 56 65 77 121 79 -35% 41%Law 12 6 9 5 0 -100% -100%ToTal 165 151 190 203 193 -5% 17%source: Center for International Services & Programs
Note: 1 Project 60 student not included by level; 1 student earning both JD and MPA
Center for International Services & Programs

181Section 8 - Selected Administrative Centers, Departments & Offices
Sec
tio
n
8
country institution Year introduced
GERMANY.........................................................................................Weingarten ...........................................................................................................1976UNITED KINGDOM ............................................................................Buckinghamshire College .....................................................................................1978GERMANY.........................................................................................Berufsakadamie Heidenheim (www.ba-heidenheim.de) .....................................1980BOTSWANA ......................................................................................University of Botswana (www.ub.bw/) .................................................................1985TAIWAN ............................................................................................Chung Yuan Christian University ...........................................................................1986FRANCE ............................................................................................Clermont-Ferrand (www.univ-bpclermont.fr) ......................................................1994KOREA ..............................................................................................Chung Ang University (www.cau.ac.kr) ...............................................................1997INDIA ................................................................................................Loyola University Kerala State .............................................................................1998UNITED KINGDOM ............................................................................Sunderland University (www.sunderland.ac.uk) .................................................1998ZAMBIA ............................................................................................Copperbelt University ..........................................................................................1998CROATIA ...........................................................................................University of Rijeka ..............................................................................................2000NIGERIA ............................................................................................Bayero University .................................................................................................2000MEXICO ...........................................................................................Center for Bilingual Multicultural Studies: Cuernavaca .......................................2001CHILE ...............................................................................................Universidad de Concepcion .................................................................................2002CHINA ...............................................................................................Dalian University ...................................................................................................2003FRANCE ............................................................................................Groupe ESSCA .....................................................................................................2003SWEDEN ...........................................................................................UMEA University ...................................................................................................2003CHINA ...............................................................................................East China Normal University ...............................................................................2005TURKEY ............................................................................................Anadolu University ................................................................................................2006CHINA ...............................................................................................Tsinghua University ..............................................................................................2007GERMANY.........................................................................................Zeppelin University ...............................................................................................2007INDIA ................................................................................................Gayatri Vidya Parishad College of Engineering .....................................................2007INDIA ................................................................................................International Institute of Info Tech Pune ...............................................................2007KOREA ..............................................................................................Honan University ..................................................................................................2007CHINA ...............................................................................................Capital University of Business and Economics ....................................................2008CHINA ...............................................................................................Chongqing Institute of Technology ......................................................................2008NEPAL ..............................................................................................Kathmandu University ..........................................................................................2008TURKEY ............................................................................................Bahcesehir University ...........................................................................................2008FRANCE ............................................................................................University of Rouen ..............................................................................................2009POLAND ...........................................................................................Bialystok Technical University ..............................................................................2009SLOVENIA .........................................................................................Government of Slovenia .......................................................................................2009
GERMANY.........................................................................................Hochshule Offenburg ............................................................................................2010
GERMANY.........................................................................................Freidrich Alexander University ..............................................................................2010
SERBIA .............................................................................................University of Belgrade ..........................................................................................2010
CHINA ...............................................................................................GuangXi University ...............................................................................................2010
CHINA ...............................................................................................Shenyang Pharmaceutical ....................................................................................2010
CHINA ...............................................................................................Chongqing Three Gorges ......................................................................................2010
POLAND ...........................................................................................University of Warsaw ............................................................................................2011
HUNGARY .........................................................................................University of Szedeg .............................................................................................2011
ITALY ................................................................................................University of Vicenza ............................................................................................2011
source: Center for International Services and Programs.
Table 8.25: Key International Links
Center for International Services & Programs

Cleveland State University / 2013 Book of Trends182
Office of Space Management
Notes building code building Year acquired Total gross square Feet
AA Advance Manufacturing Annex 1993 9,800 AC Parker Hannifin Administration Center 2007 37,500[3], [5] AG Art Gallery 2012 17,515 BU Business College 1998 126,245 CB Chester Building 1970 109,728 [5] CE Cole Center - *New Campus International School 1990 56,653 CG Central Garage 1979 269,594[5] CM CAMP Building 1994 82,470 CS Campus Safety 2004 25,056 EA Eaton Place 2009 4,474[3], [5] EC Euclid Commons Complex Buildings 1-4 2010 225,811 EG East Garage 2006 124,300 FL Field Locker Building 1985 2,194 FS Field Service Building 1985 1,305 FT Fenn Tower 1964 188,746 HS Health Sciences 1998 23,654 JH Julka Hall 2010 104,747[3] KB Keith Building 2003 36,688 LB Law Building 1977 118,438 LL Law Library 1997 111,870[3], [5] MB Middough Building 2011 303,845 MC Main Classroom Building 1970 386,489 MM Mather Mansion 1967 43,938 MU Music & Communication Building 1988 151,533 PA Plant Annex Building 1985 8,579 PE Physical Education 1973 201,860[3] PG Prospect Garage 2010 97,489 PH Parker Hannifin Hall 1984 27,252[5], [6] PR Shaker Residence 2002 4,440 PS Plant Services 1970 134,590 RC Recreation Center 2006 135,167 RT Rhodes Tower 1971 493,968[1] RW Rhodes West --- SC Student Center 2010 160,677 [3], [5] SG South Garage 2010 208,000 SH Stilwell Hall 1964 195,779 SI Science Building 1969 171,242 SR Science and Research Center 1978 142,479[2], [5] UN Union Building 2011 84,515 UR Urban College 2000 87,792[3] WA Wallingford 2008 8,916 WG University West Garage 1996 199,599 WO Wolstein Center 1989 289,000[3] WST West Center Campus Extension 2003 12,068[7] grand Total 5,226,005
Table 8.26 Cleveland State University Fall 2012 Building Inventory
Source: Office of University Architect Notes:
[1] RW - Rhodes West designation is used for way finding.
This space is included in Rhodes Tower totals.
[2] Vacant-Planned Construction/Renovation.
[3] Leased spaces
[5] May include Non-Institutional Uses
[6] Building Name Change
[7]Total does not include Heritage Apartments,
Langston Apartments, Viking Hall or Kinkos

183
AccreditationCleveland State University is accredited by the Higher Learning Commission, a commission of the North Central Association of Colleges and Schools (NCA).
college
business
education and
Human services
engineering
law
liberal arts and
social sciences
Nursing
sciences and Health professions
Urban
Bachelor of Business Administration
Master of Business Administration
Doctor of Business Administration
Master of Labor Relations & Human Resources
Accounting (undergraduate & graduate)
College of Education and Human Services
Community Agency Counseling and School Counseling
Master of Public Health
Doctor of Urban Education in Counseling Psychology
Chemical, Civil, Computer, Electrical, Industrial, and Mechanical Engineering (undergraduate)
Electronic Engineering Technology
Law
Music
Bachelor of Social Work
Master of Social Work
Nursing (undergraduate)
Nursing (graduate)
Chemistry (undergraduate)
Doctor of Clinical/ Bioanalytical Chemistry
Master of Occupational Therapy
Doctor of Physical Therapy
Psychology Specialist (School Psychology)
Master of Speech Pathology and Audiology
Master of Public Administration
Master of Urban Planning, Design, and Development
AACSB International, The Association to Advance Collegiate Schools of Business
AACSB International, The Association to Advance Collegiate Schools of Business
The National Council for the Accreditation of Teacher Education (NCATE) and approved by the Ohio Department of Education
Council for Accreditation of Counseling and Related Educational Programs (CACREP)
Council on Education for Public Health (CEPH)
American Psychological Association (APA)
Engineering Accreditation Commission of the Accreditation Board for Engineering and Technology (EAC/ABET)
Technology Accreditation Commission of the Accreditation Board for Engineering and Technology (TAC/ABET)
American Bar Association and member of the Association of American Law Schools
National Association of Schools of Music
Council of Social Work Education (CSWE)
Commission on Collegiate Nursing Education (CCNE) and approved by the Ohio Board of Nursing
Commission on Collegiate Nursing Education (CCNE)
American Chemical Society
Commission on Accreditation in Clinical Chemistry (ComACC)
Accreditation Council for Occupational Therapy Education
Commission on Accreditation in Physical Therapy Education
National Association of School Psychologists (NASP) and NCATE
American Speech-Language-Hearing Association (ASHA)
Council on Academic Accreditation (CAA)
National Association of Schools of Public Affairs and Administration (NASPAA)
Planning Accreditation Board
degree/program accreditation

Cleveland State University / 2013 Book of Trends184
List of College Acronyms and Abbreviations
Monte Ahuja College of Business Administration: College of Business, Business, Bus
College of Education and Human Services: COEHS, College of Education, Education, Edu
Fenn College of Engineering: College of Engineering, Engineering, Egr
College of Graduate Studies: Graduate Studies
Cleveland-Marshall College of Law: Law
College of Liberal Arts and Social Sciences: CLASS
School of Nursing: Nursing
College of Sciences and Health Professions: COSHP, Science
Maxine Goodman Levin College of Urban Affairs: College of Urban Affairs, Urban Affairs, Urban
Other Acronyms and Abbreviations
CIP: Classification of Instructional Program
EEO6: Equal Employment Opportunity
FTE: Full-Time Equivalent (Student Credit Hour/15)
GPA: Grade Point Average
IPEDS: Integrated Postsecondary Education Data System
N/A: Not applicable or Not available
OBOR: Ohio Board of Regents
SCH: Student Credit Hour

185
Book of Trends 2013http://www.csuohio.edu/offices/iraa/bot/BOT_13.pdf
The Book of Trends (BOT) 2013 represents the continuing commitment of the Office of Institutional Research and Analysis (IRA) to present updated information about Cleveland State University (CSU). A variety of tables and charts provide trend information over a five-year period as well as some key attributes and characteristics of the University for the most recently completed academic year.
The purpose of this publication is to provide readers with frequently requested statistical information used in planning, reporting, and assessment. In order to serve the campus community more effectively, we welcome suggestions and comments.
1. The student information presented in the Book of Trends 2013 is based on the End of Semester files used for Ohio Board of Regents (OBOR) reports unless specifically noted from a different data source.
2. Students exclusively enrolled in English as a Second Language, Study Abroad or other zero credit hour courses are included in the Book of Trends for years 2006-10.
3. The various Deans’ offices provided IRA with a set of grant/highlight information used to produce Table 4.13. IRA limited these selections in order to meet space requirements. This table is not intended to be a comprehensive listing, but merely to reflect some of the interesting activities of our faculty, staff and students.
4. Each year we attempt to provide comparative data to other colleges and universities in Ohio. These comparisons are typically centered on information available from the Ohio Board of Regents’ Higher Education Information System (HEI) http://regents.ohio.gov/hei/index.php. At the time of publication a few of the tables normally presented here were not available due to some schools updating prior years’ data, or changes to the HEI system. Please be aware that the HEI tables presented in this year’s book represent various states of completion:
a. The data may be complete for the reporting year and can be used accordingly.b. The data may be complete for most institutions, but a few may be unfinalized, in which case only finalized ones are reported or in
some cases unfinalized numbers are included but footnoted as such.c. In some cases many schools had unfinalized the type of data being reviewed and in those cases we have simply reproduced the prior
year’s data with appropriate titles and footnotes.
Note: Based on feedback received from the campus community, we have removed some selected tables from the Book of Trends. If you require data from any of these missing tables, please contact our office and we can provide you with the requisite information.
Please direct questions and/or suggestions to 216-687-4700. The entire Book of Trends series is available online on the IRA website (http://www.csuohio.edu/iraa/bot/bookoftrends.html).
We encourage you to reference the web version of the Book of Trends because we can easily make changes/updates if necessary. By the same token, if a URL is provided in the book such as the ones linked to Research Centers & Institutes, the Ohio Board of Regents, etc., we encourage you to refer to the linked site for the most up-to-date information.
We would like to take this opportunity to thank all members of the campus community as well as our graduate assistants for their support and contributions to this publication.
Office of Institutional Research and Analysis

Notes

Notes

Notes

Affirmative Action StatementCleveland State University is committed to the principle ofequal opportunity in employment and education. No personat the university will be denied opportunity for employmentor education or be subject to discrimination in any project,program, or activity because of race, color, religion, nationalorigin, sex, age, genetic information, sexual orientation,disability, disabled veteran, Vietnam-era veteran or otherprotected veteran status.