Embed Size (px)
Citation preview

Cleaner Production in Ceramic Sector
A strategy for Pollution Prevention
Gujarat Cleaner Production Centre (Established by Industries & Mines Department, Government of Gujarat)
Prepared by:
March, 2016

© Gujarat Cleaner Production Centre (GCPC), 2016 This publication may be reproduced in whole or in part and in any form for educational or non-profit purposes without special permission from the copyright holder, provided acknowledgement of the source is made. GCPC would appreciate receiving a copy of any publication that uses this publication as a source. No use of this publication may be made for resale or for any other commercial purpose whatsoever without prior permission in writing from the GCPC. Readers please note that the document is a Draft copy of the findings at spot in the industries while conducting the assessment by the dedicated team. Results obtained and documented may vary actually depending upon physical conditions. The document is intended to provide guidance to the Industries in developing approaches for Cleaner Production. Compliance with environmental regulations is the responsibility of each individual business and is not the focus of this document. Any use made of this report, or reliance on, or any decision to be made based on it, is the responsibility of such user. The GCPC accepts no responsibility for damages, if any, suffered by any third party as a result of decisions made or actions taken based on this document. Title: Cleaner Production in Ceramic Sector – A strategy of Pollution Prevention Published in: March 2016 Publishing Committee:
Dr. Bharat Jain, Member Secretary
Mr. P. R. Rathod, Senior Project Engineer
Mr. Paras Gojiya, Assistant Project Engineer
Mr. Abhi Patel, Assistant Project Engineer
Mr. K. D. Sanghavi, External Ceramic Expert
Gujarat Cleaner Production Centre (Established by: Industries & Mines Department, Govt. of Gujarat) 3rd Floor, Block No. 11, 12 Udhyog Bhavan, Sector – 11 Gandhinagar, Gujarat – 382017 Tel: +91 79 232 44147 Email: [email protected] Website: www.gcpcgujarat.org.in

Contents:
1. Optimizing combustion efficiency of kiln…..1
2. Optimizing combustion efficiency of Spray Dryer
Furnace…..15
3. Modifying kiln cars for efficient use of heat…..24
4. 100% Reuse of waste water and sludge…..37
5. Options for saving electricity…..44
6. Improvement in kiln insulation…..52

1
Optimization of
Combustion Efficiency:
Kilns and Dryers

2
3
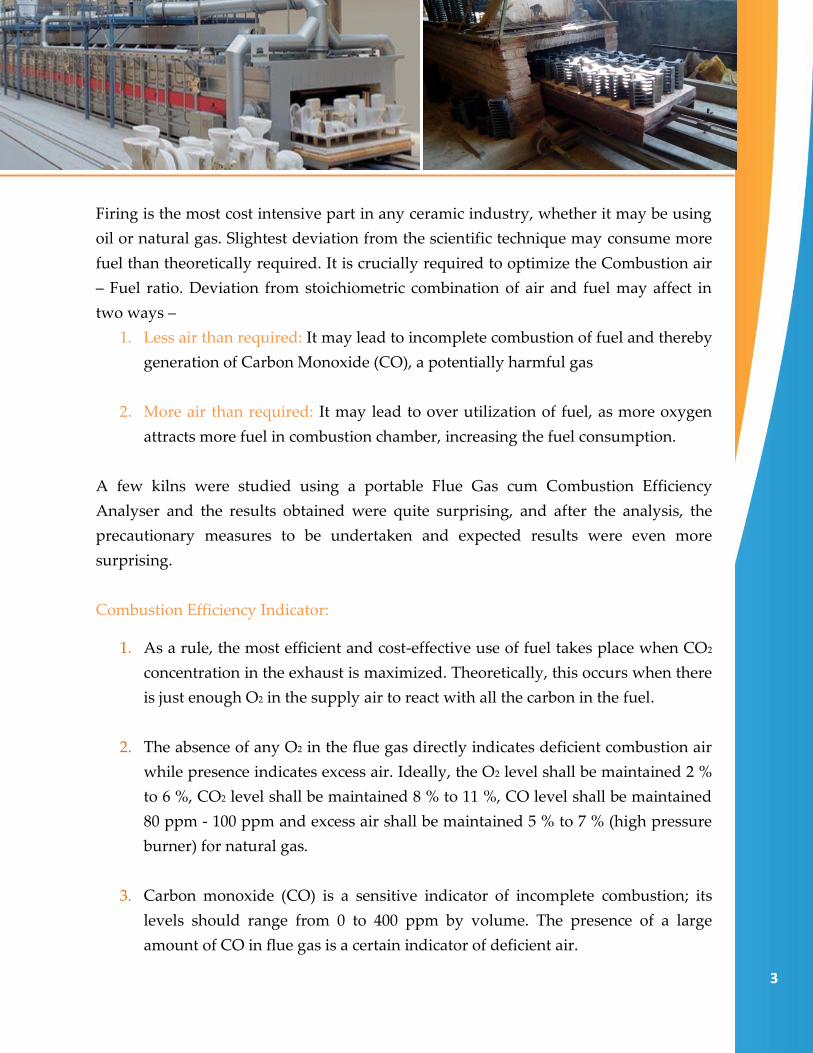
Firing is the most cost intensive part in any ceramic industry, whether it may be using
oil or natural gas. Slightest deviation from the scientific technique may consume more
fuel than theoretically required. It is crucially required to optimize the Combustion air
– Fuel ratio. Deviation from stoichiometric combination of air and fuel may affect in
two ways –
1. Less air than required: It may lead to incomplete combustion of fuel and thereby
generation of Carbon Monoxide (CO), a potentially harmful gas
2. More air than required: It may lead to over utilization of fuel, as more oxygen
attracts more fuel in combustion chamber, increasing the fuel consumption.
A few kilns were studied using a portable Flue Gas cum Combustion Efficiency
Analyser and the results obtained were quite surprising, and after the analysis, the
precautionary measures to be undertaken and expected results were even more
surprising.
Combustion Efficiency Indicator:
1. As a rule, the most efficient and cost-effective use of fuel takes place when CO2
concentration in the exhaust is maximized. Theoretically, this occurs when there
is just enough O2 in the supply air to react with all the carbon in the fuel.
2. The absence of any O2 in the flue gas directly indicates deficient combustion air
while presence indicates excess air. Ideally, the O2 level shall be maintained 2 %
to 6 %, CO2 level shall be maintained 8 % to 11 %, CO level shall be maintained
80 ppm - 100 ppm and excess air shall be maintained 5 % to 7 % (high pressure
burner) for natural gas.
3. Carbon monoxide (CO) is a sensitive indicator of incomplete combustion; its
levels should range from 0 to 400 ppm by volume. The presence of a large
amount of CO in flue gas is a certain indicator of deficient air.
4
The same can be maintained by regular monitoring of flue gas sample with the help of
a portable flue gas analyser or by installing O2 sensor at the furnace exhaust for flue
gases and a modulating motorized damper or RPM of combustion air blower through
VFD for combustion air control. The sensor will provide constant feedback of O2% to
the damper / VFD which will in turn regulate the flow of combustion air to maintain
the combustion efficiency at optimum level of 80 - 90% (Achievable combustion
efficiency).
Case Study – 1 Wall and Floor Tiles manufacturing industry with roller kilns and
horizontal and vertical roller dryers (Fuel: Natural Gas)
Implementing
the technology
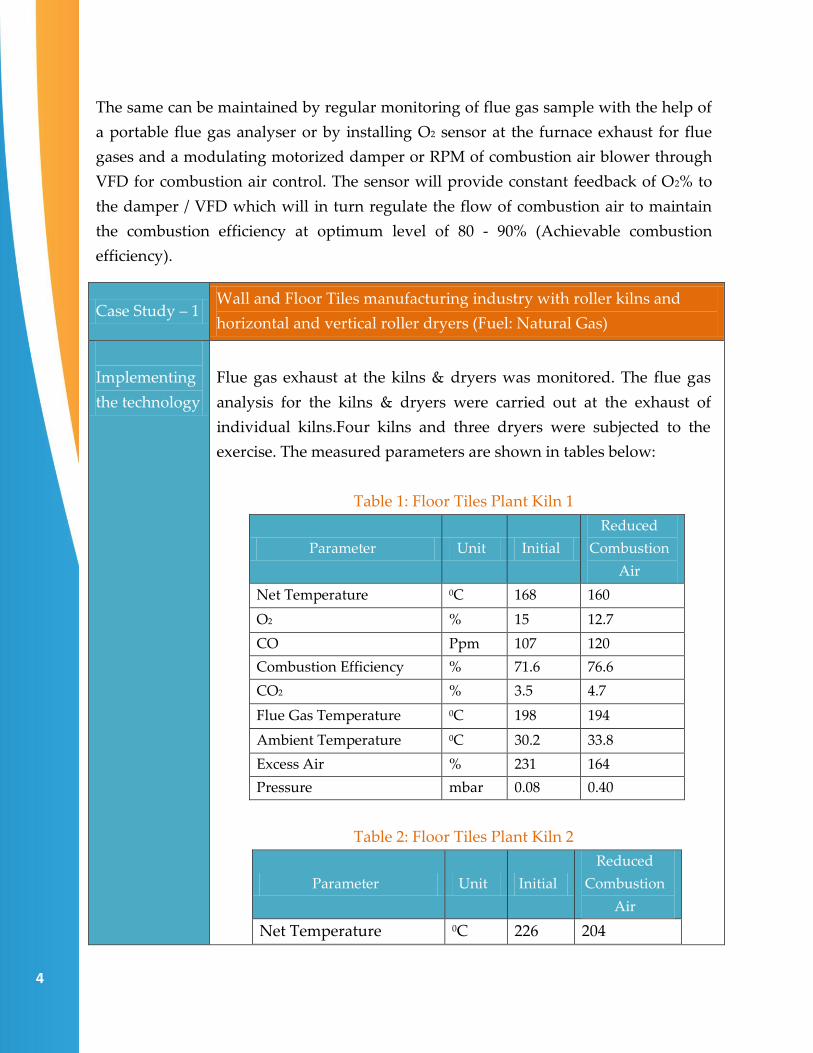
Flue gas exhaust at the kilns & dryers was monitored. The flue gas
analysis for the kilns & dryers were carried out at the exhaust of
individual kilns.Four kilns and three dryers were subjected to the
exercise. The measured parameters are shown in tables below:
Table 1: Floor Tiles Plant Kiln 1
Parameter Unit Initial
Reduced
Combustion
Air
Net Temperature 0C 168 160
O2 % 15 12.7
CO Ppm 107 120
Combustion Efficiency % 71.6 76.6
CO2 % 3.5 4.7
Flue Gas Temperature 0C 198 194
Ambient Temperature 0C 30.2 33.8
Excess Air % 231 164
Pressure mbar 0.08 0.40
Table 2: Floor Tiles Plant Kiln 2
Parameter Unit Initial
Reduced
Combustion
Air
Net Temperature 0C 226 204

5
O2 % 17.2 14.5
CO ppm 79 180
Combustion Efficiency % 50.2 68.2
CO2 % 2.0 3.6
Flue Gas Temperature 0C 255 237
Ambient Temperature 0C 29.5 33
Excess Air % 480.5 221.5
Pressure mbar 0.07 0.37
Table 3: Wall Tiles Plant Biscuit Kiln
Parameter Unit Initial Dilution
Blower Off
Net Temperature 0C 246 260
O2 % 17.1 16.7
CO ppm 29 32
Combustion Efficiency % 46.7 49.5
CO2 % 2.1 2.4
Flue Gas Temperature 0C 279 274
Ambient Temperature 0C 32.6 32.6
Excess Air % 464.8 397.6
Pressure mbar 0.29 0.28
Table 4: Wall Tiles Plant Glost Kiln
Parameter Unit Initial
Net Temperature 0C 150
O2 % 15.3
CO ppm 86
Combustion Efficiency % 72.3
CO2 % 3.2
Flue Gas Temperature 0C 181
Ambient Temperature 0C 82.4
Excess Air % 273.2
Pressure mbar 0.22

6
Table 5: Horizontal Dryer 1
Parameter Unit Initial
Reduced
Combustion
Air
Net Temperature 0C 88 88
O2 % 19.9 19.7
CO ppm 22 24
Combustion Efficiency % 37.9 44.7
CO2 % 0.6 0.7
Flue Gas Temperature 0C 119 120
Ambient Temperature 0C 30.7 31
Excess Air % 1990 1642
Pressure mbar 0.04 0.05
Table 6: Horizontal Dryer 2
Parameter Unit Initial
Net Temperature 0C 144
O2 % 19.2
CO ppm 1
Combustion Efficiency % 38.4
CO2 % 1.0
Flue Gas Temperature 0C 177
Ambient Temperature 0C 33.1
Excess Air % 1061
Pressure mbar 0.29
Table 7: Vertical Dryer
Parameter Unit Initial
Net Temperature 0C 127
O2 % 17.9
CO ppm 37
Combustion Efficiency % 62.7
CO2 % 1.7
Flue Gas Temperature 0C 161
7
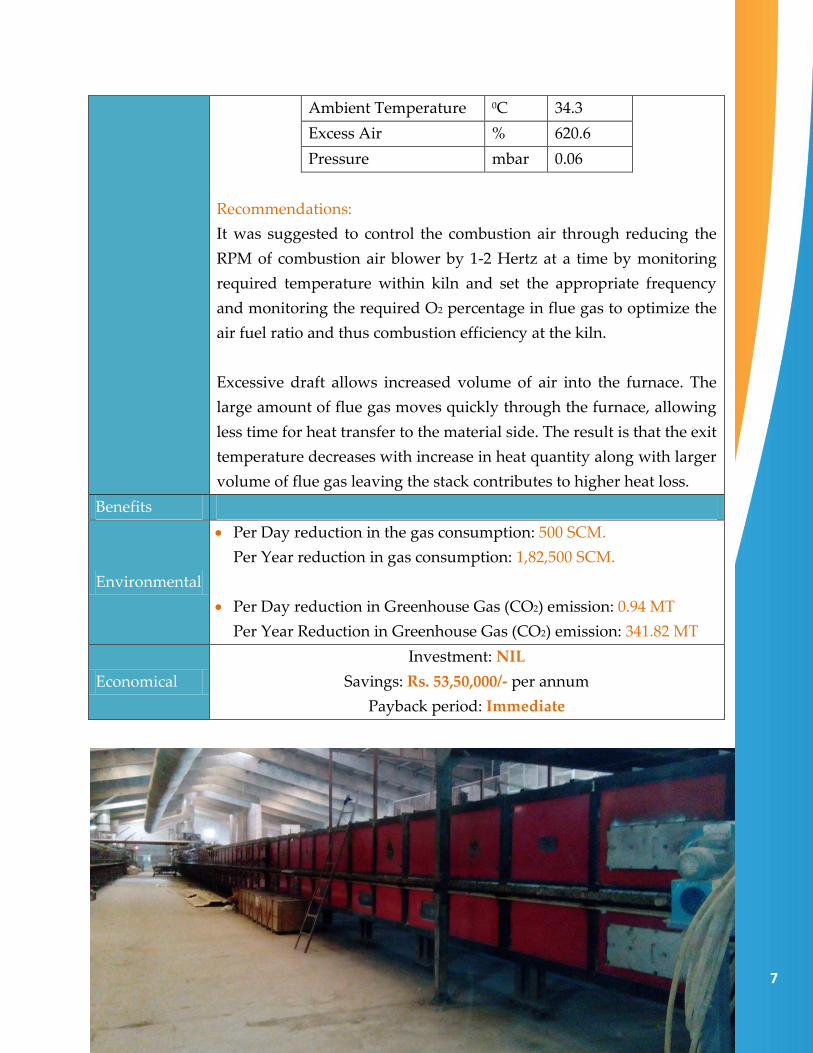
Ambient Temperature 0C 34.3
Excess Air % 620.6
Pressure mbar 0.06
Recommendations:
It was suggested to control the combustion air through reducing the
RPM of combustion air blower by 1-2 Hertz at a time by monitoring
required temperature within kiln and set the appropriate frequency
and monitoring the required O2 percentage in flue gas to optimize the
air fuel ratio and thus combustion efficiency at the kiln.
Excessive draft allows increased volume of air into the furnace. The
large amount of flue gas moves quickly through the furnace, allowing
less time for heat transfer to the material side. The result is that the exit
temperature decreases with increase in heat quantity along with larger
volume of flue gas leaving the stack contributes to higher heat loss.
Benefits
Environmental
Per Day reduction in the gas consumption: 500 SCM.
Per Year reduction in gas consumption: 1,82,500 SCM.
Per Day reduction in Greenhouse Gas (CO2) emission: 0.94 MT
Per Year Reduction in Greenhouse Gas (CO2) emission: 341.82 MT
Economical
Investment: NIL
Savings: Rs. 53,50,000/- per annum
Payback period: Immediate

8
Case Study – 2 Low Tension Ceramic Insulators manufacturing industry having
tunnel kiln (Fuel: Natural Gas)
Implementing
the technology
Flue gas exhaust at the tunnel kiln was monitored. %O2 in flue gas
varies from 5.1% to 15.6%.
Parameter Unit Exhaust (Flue Gas) Firing
Zone
O2 % 14.1 12.0 20.3
CO ppm 1266 1137 20
Combustion
Efficiency % 45.2 57.5 O2> 20%
CO2 % 3.01 5.0 O2> 20%
Excess Air % 344.6 137.5 O2> 20%
Pressure mbar 0.05 0.08 0.24
The Carbon Monoxide (CO) level is alarmingly high. The reason is No
Proper Mixing of Combustion air and the fuel, most possibly due to
Not Cleaning the burners for 8 – 10 years and possible damage to the
burner tip.
The same can be maintained by regular monitoring of flue gas sample
with the help of a portable flue gas analyzer or by installing O2sensor
at the furnace exhaust for flue gases and a modulating motorized
damper for combustion air control.
Recommendations:
It is suggested to control the combustion air through reducing the
RPM of combustion air blower by 1-2 Hertz at a time by monitoring
required temperature within kiln and set the appropriate frequency
and monitoring the required O2 percentage in flue gas to optimize the
air fuel ratio and thus combustion efficiency at the kiln.
The proper control of air to fuel ratio can result in combustion
efficiency more than 75 % with old burners as well. Thus increase in
15% combustion efficiency will result in saving of approximately
85,540 SCM gas per annum.

9
Benefit
Environmental Per Day reduction in the gas consumption: 234 SCM.
Per Year reduction in gas consumption: 85,540 SCM.
Per Day reduction in GHG (CO2) emission: 489 Kg
Per Year Reduction in GHG (CO2) emission: 160 MT
Economical Investment: Rs. 20,000/- (For VFD)
Annual Savings: Rs. 16,25,000/- per annum
Payback Period: Immediate
10
Case Study – 3 Low Tension Ceramic Insulators manufacturing industry having
tunnel kiln (Fuel: Natural Gas)
Implementing
the technology
Flue gas exhaust at the tunnel kiln furnace was monitored. %O2 in flue
gas varies from 5.1% to 15.6%.
Flue gas temperature also varies from169oC to 200oC.% O2 in flue
gases should be between 2 – 6%.
Parameters At Kiln Exhaust At Firing Zone
O2 (%) 17.3 10.2
CO (ppm) 131 65
CO2 (%) 2.4 6.1
Efficiency (%) 67.5 64.1
Excess Air (%) 364.3 95.3
Pressure (mbar) 0.12 0.20
Recommendations:
It is suggested to control the combustion air through reducing the
RPM of combustion air blower by 1-2 Hertz at a time by monitoring
required temperature within kiln and set the appropriate frequency
and monitoring the required O2 percentage in flue gas to optimize the
air fuel ratio and thus combustion efficiency at the kiln.
The proper control of air to fuel ratio can result in combustion
efficiency more than 75 % with old burners as well. Thus increase in 10
% combustion efficiency will result in saving of approximately 12,971
SCM gas per annum.
Benefits
Environmental Per Day reduction in the gas consumption: 35.5 SCM.
Per Year reduction in gas consumption: 12,971 SCM.
Per Day reduction in Greenhouse Gas (CO2) emission: 65 Kg
Per Year Reduction in Greenhouse Gas (CO2) emission: 24.3 MT
Economical Investment: NIL
Annual Savings: Rs. 4,21,000/- per annum
Payback Period: Immediate

11
Case Study – 4 Tableware manufacturing industry having tunnel kiln (Fuel: Natural
Gas)
Implementing
the technology
Flue gas exhaust at the tunnel kiln furnace & decoration kiln was
monitored. % O2 in flue gas is more than 11 % in tunnel kiln and more
9 % in decoration kiln.
% O2 in flue gases should be between 2 – 6%. The same can be
maintained by regular monitoring of flue gas sample with the help of a
portable flue gas analyzer or by installing O2sensor at the furnace
exhaust for flue gases and a modulating motorized damper or RPM of
combustion air blower through VFD for combustion air control.
The sensor will provide constant feedback of O2% to the damper / VFD
which will in turn regulate the flow of combustion air to maintain the
combustion efficiency at optimum level of 80 - 90% (Achievable
combustion efficiency).
Table: Flue Gas Monitoring Parameters at Tunnel Kiln
Parameter Unit At Kiln
Exhaust
Firing
Zone
Net Temperature 0C 215 482
O2 % 14.2 11.9
CO ppm 11 53
Combustion Efficiency % 69 55.2
CO2 % 3.9 5.2
Flue Gas Temperature 0C 233 507
Ambient Temperature 0C 20.6 25
Excess Air % 198.5 127.1
Pressure mbar 0.06 0.29
12
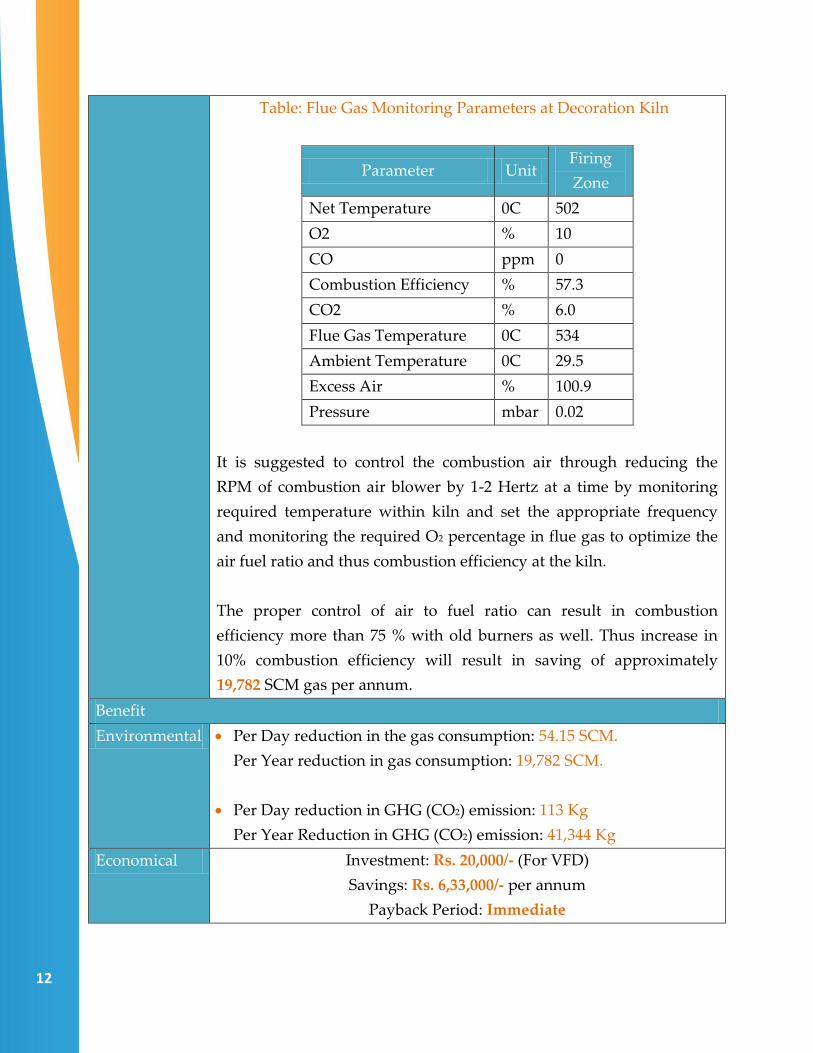
Table: Flue Gas Monitoring Parameters at Decoration Kiln
Parameter Unit Firing
Zone
Net Temperature 0C 502
O2 % 10
CO ppm 0
Combustion Efficiency % 57.3
CO2 % 6.0
Flue Gas Temperature 0C 534
Ambient Temperature 0C 29.5
Excess Air % 100.9
Pressure mbar 0.02
It is suggested to control the combustion air through reducing the
RPM of combustion air blower by 1-2 Hertz at a time by monitoring
required temperature within kiln and set the appropriate frequency
and monitoring the required O2 percentage in flue gas to optimize the
air fuel ratio and thus combustion efficiency at the kiln.
The proper control of air to fuel ratio can result in combustion
efficiency more than 75 % with old burners as well. Thus increase in
10% combustion efficiency will result in saving of approximately
19,782 SCM gas per annum.
Benefit
Environmental Per Day reduction in the gas consumption: 54.15 SCM.
Per Year reduction in gas consumption: 19,782 SCM.
Per Day reduction in GHG (CO2) emission: 113 Kg
Per Year Reduction in GHG (CO2) emission: 41,344 Kg
Economical Investment: Rs. 20,000/- (For VFD)
Savings: Rs. 6,33,000/- per annum
Payback Period: Immediate
13
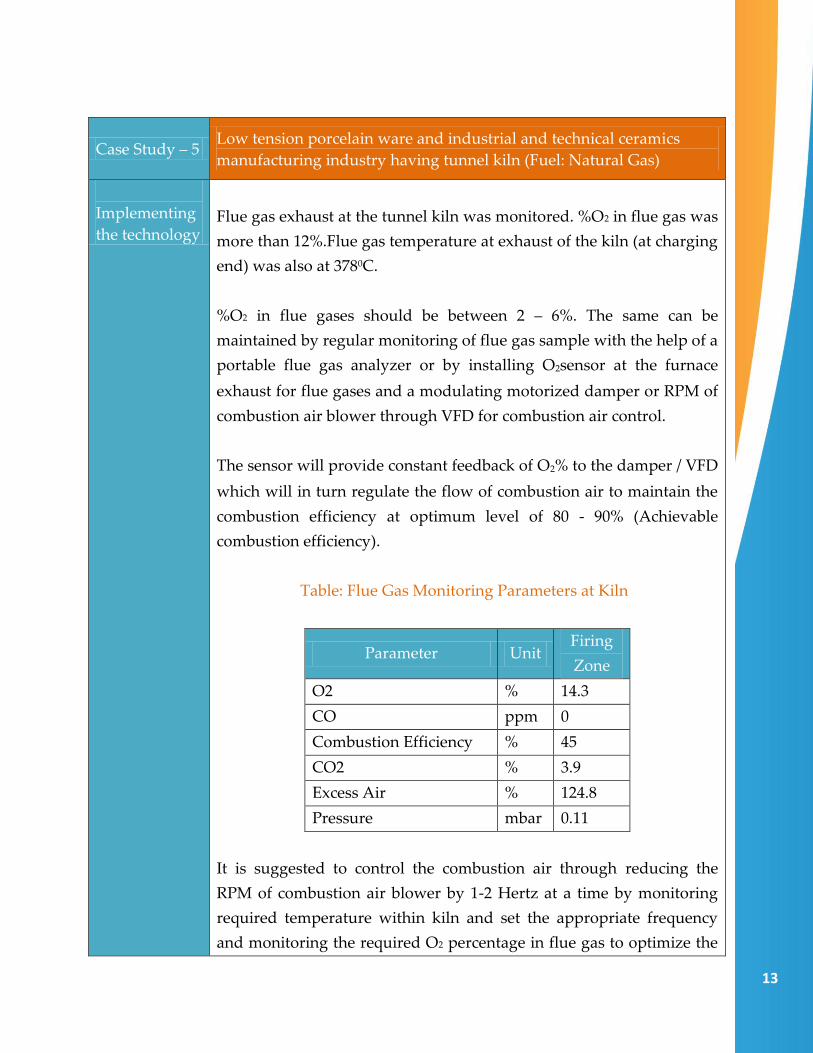
Case Study – 5 Low tension porcelain ware and industrial and technical ceramics
manufacturing industry having tunnel kiln (Fuel: Natural Gas)
Implementing
the technology
Flue gas exhaust at the tunnel kiln was monitored. %O2 in flue gas was
more than 12%.Flue gas temperature at exhaust of the kiln (at charging
end) was also at 3780C.
%O2 in flue gases should be between 2 – 6%. The same can be
maintained by regular monitoring of flue gas sample with the help of a
portable flue gas analyzer or by installing O2sensor at the furnace
exhaust for flue gases and a modulating motorized damper or RPM of
combustion air blower through VFD for combustion air control.
The sensor will provide constant feedback of O2% to the damper / VFD
which will in turn regulate the flow of combustion air to maintain the
combustion efficiency at optimum level of 80 - 90% (Achievable
combustion efficiency).
Table: Flue Gas Monitoring Parameters at Kiln
Parameter Unit Firing
Zone
O2 % 14.3
CO ppm 0
Combustion Efficiency % 45
CO2 % 3.9
Excess Air % 124.8
Pressure mbar 0.11
It is suggested to control the combustion air through reducing the
RPM of combustion air blower by 1-2 Hertz at a time by monitoring
required temperature within kiln and set the appropriate frequency
and monitoring the required O2 percentage in flue gas to optimize the
14
air fuel ratio and thus combustion efficiency at the kiln.
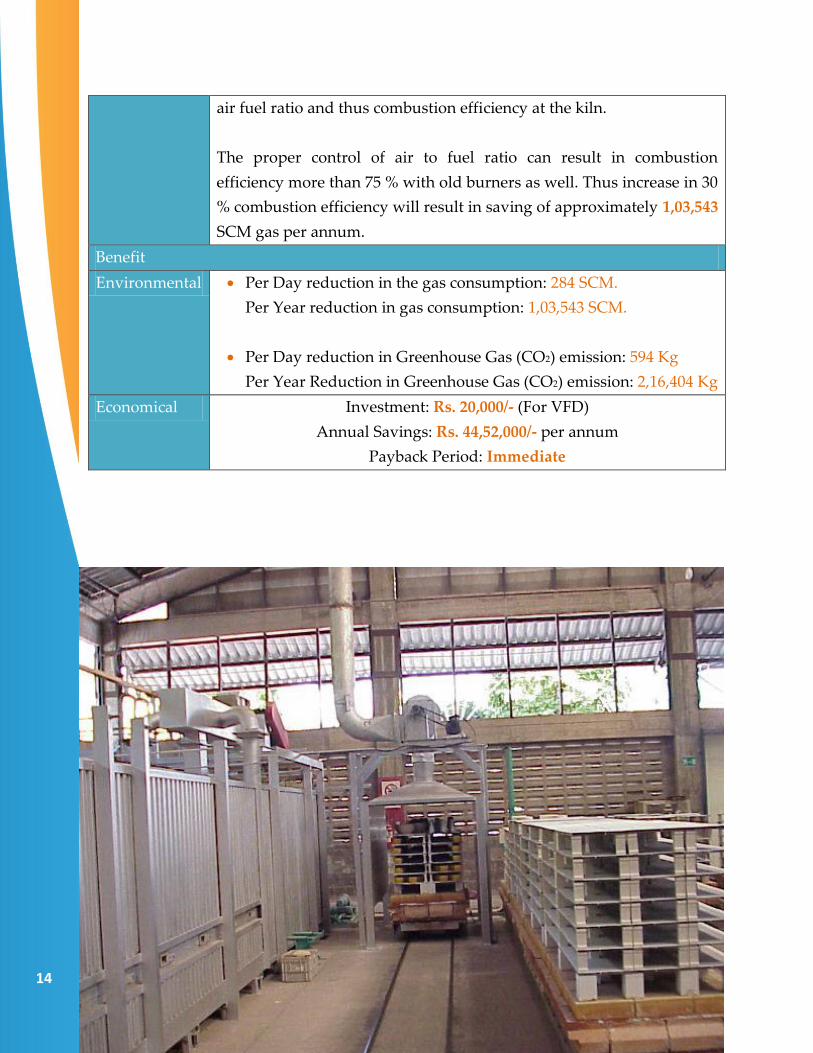
The proper control of air to fuel ratio can result in combustion
efficiency more than 75 % with old burners as well. Thus increase in 30
% combustion efficiency will result in saving of approximately 1,03,543
SCM gas per annum.
Benefit
Environmental Per Day reduction in the gas consumption: 284 SCM.
Per Year reduction in gas consumption: 1,03,543 SCM.
Per Day reduction in Greenhouse Gas (CO2) emission: 594 Kg
Per Year Reduction in Greenhouse Gas (CO2) emission: 2,16,404 Kg
Economical Investment: Rs. 20,000/- (For VFD)
Annual Savings: Rs. 44,52,000/- per annum
Payback Period: Immediate

15
Optimization of
Combustion Efficiency of
Spray Dryer Furnace

16
17
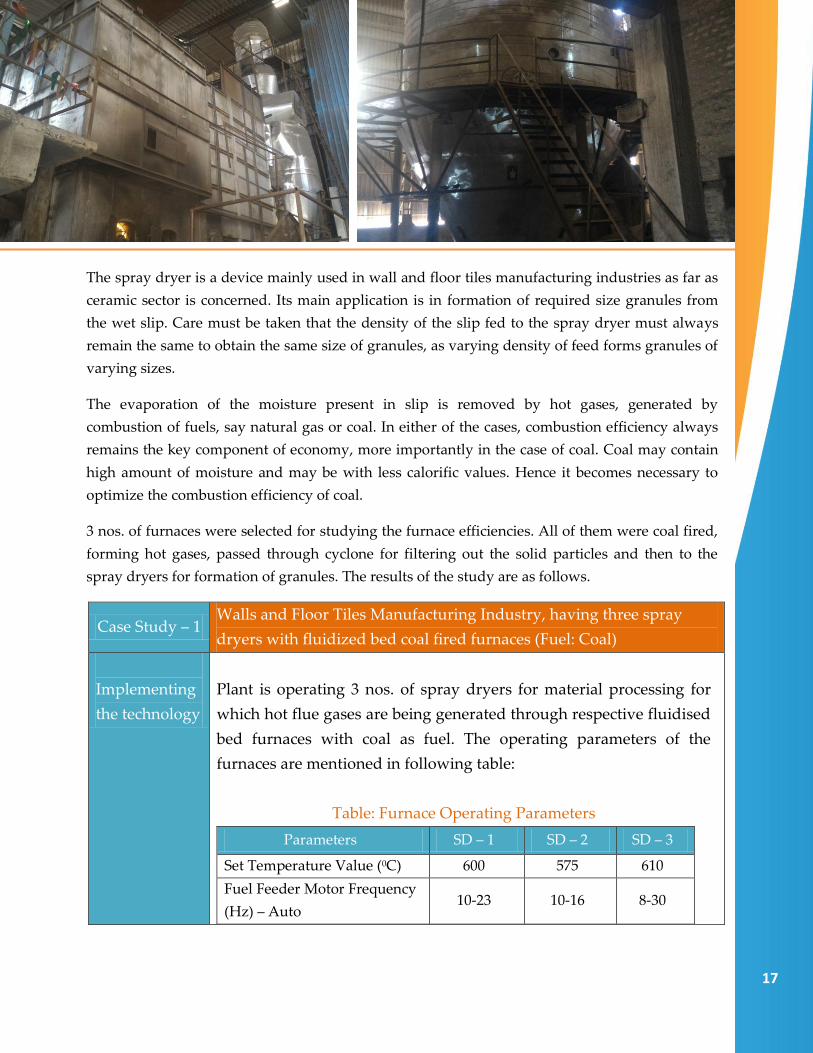
The spray dryer is a device mainly used in wall and floor tiles manufacturing industries as far as
ceramic sector is concerned. Its main application is in formation of required size granules from
the wet slip. Care must be taken that the density of the slip fed to the spray dryer must always
remain the same to obtain the same size of granules, as varying density of feed forms granules of
varying sizes.
The evaporation of the moisture present in slip is removed by hot gases, generated by
combustion of fuels, say natural gas or coal. In either of the cases, combustion efficiency always
remains the key component of economy, more importantly in the case of coal. Coal may contain
high amount of moisture and may be with less calorific values. Hence it becomes necessary to
optimize the combustion efficiency of coal.
3 nos. of furnaces were selected for studying the furnace efficiencies. All of them were coal fired,
forming hot gases, passed through cyclone for filtering out the solid particles and then to the
spray dryers for formation of granules. The results of the study are as follows.
Case Study – 1 Walls and Floor Tiles Manufacturing Industry, having three spray
dryers with fluidized bed coal fired furnaces (Fuel: Coal)
Implementing
the technology
Plant is operating 3 nos. of spray dryers for material processing for
which hot flue gases are being generated through respective fluidised
bed furnaces with coal as fuel. The operating parameters of the
furnaces are mentioned in following table:
Table: Furnace Operating Parameters
Parameters SD – 1 SD – 2 SD – 3
Set Temperature Value (0C) 600 575 610
Fuel Feeder Motor Frequency
(Hz) – Auto 10-23 10-16 8-30
18
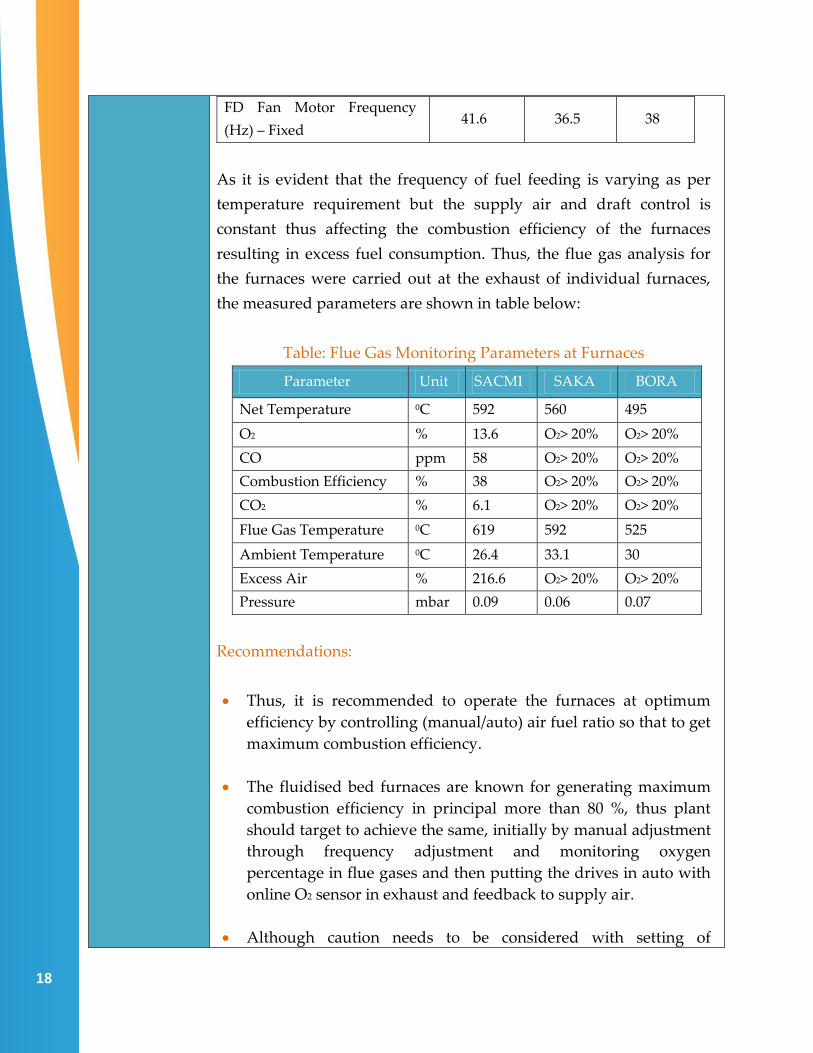
FD Fan Motor Frequency
(Hz) – Fixed 41.6 36.5 38
As it is evident that the frequency of fuel feeding is varying as per
temperature requirement but the supply air and draft control is
constant thus affecting the combustion efficiency of the furnaces
resulting in excess fuel consumption. Thus, the flue gas analysis for
the furnaces were carried out at the exhaust of individual furnaces,
the measured parameters are shown in table below:
Table: Flue Gas Monitoring Parameters at Furnaces
Parameter Unit SACMI SAKA BORA
Net Temperature 0C 592 560 495
O2 % 13.6 O2> 20% O2> 20%
CO ppm 58 O2> 20% O2> 20%
Combustion Efficiency % 38 O2> 20% O2> 20%
CO2 % 6.1 O2> 20% O2> 20%
Flue Gas Temperature 0C 619 592 525
Ambient Temperature 0C 26.4 33.1 30
Excess Air % 216.6 O2> 20% O2> 20%
Pressure mbar 0.09 0.06 0.07
Recommendations:
Thus, it is recommended to operate the furnaces at optimum
efficiency by controlling (manual/auto) air fuel ratio so that to get
maximum combustion efficiency.
The fluidised bed furnaces are known for generating maximum
combustion efficiency in principal more than 80 %, thus plant
should target to achieve the same, initially by manual adjustment
through frequency adjustment and monitoring oxygen
percentage in flue gases and then putting the drives in auto with
online O2 sensor in exhaust and feedback to supply air.
Although caution needs to be considered with setting of

19
minimum air requirement for bed generation within furnace, if
the required bed height is not achieved after reduction in air
supply and there is still less combustion efficiency achieved, then
the design of furnace needs to be modified accordingly.
Benefits
Environmental
Per Day reduction in the Coal consumption: 14.5 Tons
Per Year reduction in Coal consumption: 5,289 Tons
For the sub-bituminous coal:
Per Day reduction in Greenhouse Gas (CO2) emission: 40 Tons
Per Year Reduction in Greenhouse Gas (CO2) emission: 14,545 Tons
Economical
Investment: Rs. 75,00,000/- (O2 Sensors for 3 furnaces)
Savings: Rs. 2,38,00,000/- per annum
Payback period: 4 months
Case Study – 2 Removing the moisture contents of coal using solar drying
Implementing
the technology
A wall and floor tiles industry uses spray dryers for the formation of
granules. The hot gases to the spray dryers are supplied by the
combustion of ‘sub-bituminous’ coal in box furnaces.
It was found during the field visit that the coal had moisture of 30% –
35%, (varying according to seasons). Most of the time, the coal had
moisture more than 35%. There was no facility for preheating of coal.
The coal storage area was open to environment which led to increase
in the moisture especially in winter and monsoon seasons.
The moisture content of the coal is a serious issue as far as the
combustion efficiency is concerned.
The average annual consumption of coal of the industry happens to be
20,307 MT. With 30% moisture in coal at average, the water content in
the coal would be 6,100 MT.
It means that the industry has to use energy equivalent to 1870 MT of
coal annually just to evaporate the moisture from that coal itself.
Also, the purpose of the hot gases are to take up the moisture of the slip in

20
the spray dryer, however, the hot gases themselves are moist, hence they
also decreases the efficiency of Spray Drying operation.
Ultimately, it invites an extra expense of Rs. 85 Lacs annually to the
industry, excluding the efficiency loss of spray drying.
Also the loss due to wind flow is significant. There was a huge hole in
the back side wall of the yard, leading to the loss of coal by wind, also
generating air borne particles, polluting the air.
Recommendations
The most appropriate suggestible option for removal of moisture
from coal, without using any type of fuel for heat generation, is by
‘Solar Drying’, by an application of Solar Glass House along with a
Churning machine for regular and even mixing of newer and older
coal.
India is a subtropical country. The average incidence of solar
radiations on earth on an average sunny day in subtropical areas
like India is around 800 – 1000 W/M2 (especially in regions like
Gujarat, which falls on ‘Tropic of Cancer’
The energy obtained from the Sun in form of radiations can be

21
utilized for drying purpose. The space allotted for coal storage can
be modified in the form of Solar Glass House by building a storage
yard made up of High Emissivity Tempered Glass as depicted in
the following graphics.
The arrangement contains, as shown in the graphics, a tempered
glass house with a churning machine inside to evenly distribute
the coal in a layer of fixed thickness. Fans are arranged at the inlet
side of the drying area to provide draft to the moist air. An exhaust
chimney is provided for creating a suction draft inside the drying
area.
The drying principle is based on four factors:
1. Temperature: It is directly proportional with the rate of drying.
More the temperature of drying area, rapid will be the drying.
Here, sufficient temperature will be available due to the combined
effect created by the plastic sheets and solar radiations.
2. Air draft velocity: It is also directly proportional with the rate of
drying. More the velocity of wind/drying air, faster will be the
drying. In this case, it will be provided using small fans from inlet
side of drying area.
Solar Radiations
Flow of draft
22
3. Moisture: It is inversely proportional with the rate of drying. In
this case, we have to decrease the moisture from 30% to 5%
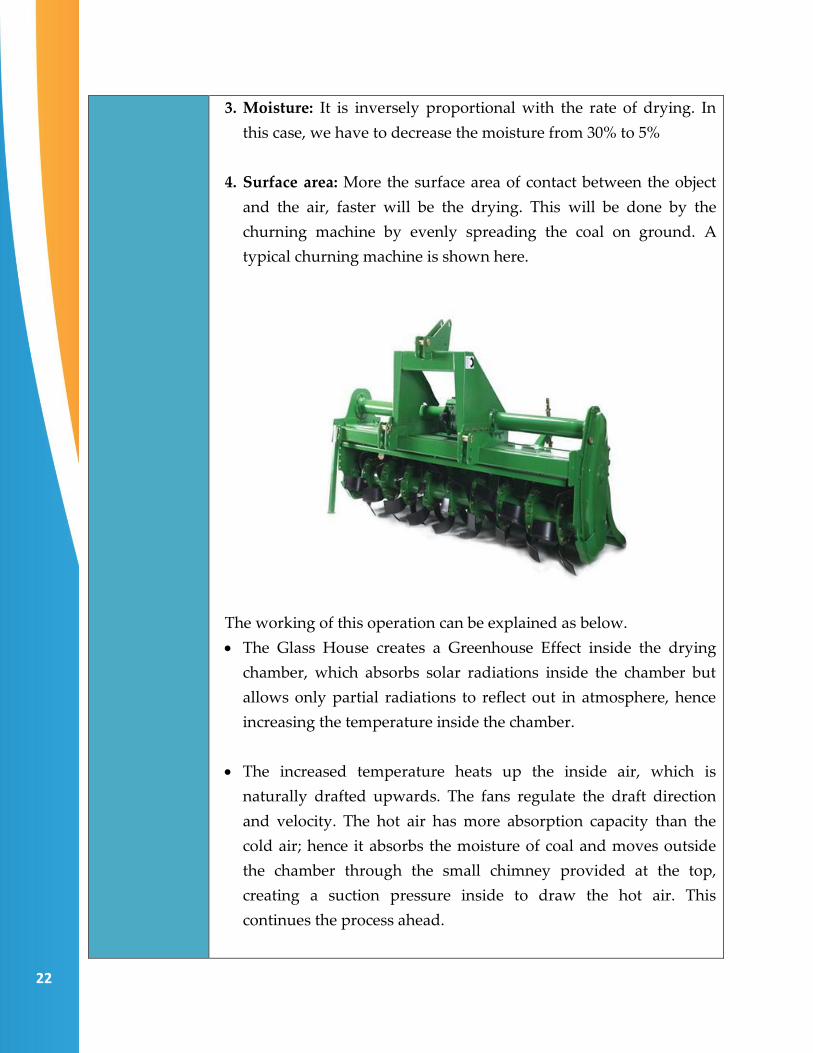
4. Surface area: More the surface area of contact between the object
and the air, faster will be the drying. This will be done by the
churning machine by evenly spreading the coal on ground. A
typical churning machine is shown here.
The working of this operation can be explained as below.
The Glass House creates a Greenhouse Effect inside the drying
chamber, which absorbs solar radiations inside the chamber but
allows only partial radiations to reflect out in atmosphere, hence
increasing the temperature inside the chamber.
The increased temperature heats up the inside air, which is
naturally drafted upwards. The fans regulate the draft direction
and velocity. The hot air has more absorption capacity than the
cold air; hence it absorbs the moisture of coal and moves outside
the chamber through the small chimney provided at the top,
creating a suction pressure inside to draw the hot air. This
continues the process ahead.

23
The objective of the dryer is to supply the coal with more heat than
is available under ambient conditions, thereby increasing
sufficiently the vapour pressure of the moisture held within the
drying area and decreasing significantly the relative humidity of
air and thereby increasing its moisture carrying capacity and
ensuring sufficiently low equilibrium moisture content of coal.
Benefit
Environmental Without using any type of combustion or heat utility, moisture of coal
can be decreased from 30% to less than 5%. The dried coal gives a
more efficient combustion than a moist coal, thereby leading to
complete combustion of coal. The direct benefit to the environment
would be –
Decrease in annual requirement of coal by 1560 MT.
Reduction in emission of Green House Gas by 2500 MT.
Economic Investment: Rs. 25 Lacs
(For setting up the glass house and churning machine)
Savings: Rs. 70 Lacs per annum
Payback Period: 5 months
Note:
Industry may save initial capital investment by not installing the
churning machine, however, it would then be much necessary to
engage sufficient manpower to continuously rearrange and
redistribute the coal evenly on the ground, so as to maximize the
contact time between the coal and solar radiations.
It is also recommended to use the technique of Solar Glass House Drying in all kinds of industries, for
drying any kind of material in fact any material whose moisture needs to be removed. This has dual
advantage of drying faster and after removal of moisture, requiring less fuel to bake in firing stage.

24
Modifying Kiln Cars for
Efficient Use of Heat
(Low Thermal Mass)

25

26
The heavier the material on kiln car more will be the gas consumption of the kiln. The
heavier the furniture material, more the heat is utilized to heat up the car, which is of no
use. The only useful heat is what absorbed by the product loaded on the car.
Furniture of the car consists of the shelves for loading the moulded pieces, supports to
withstand the shelves and refractory bricks platform to withstand the whole assembly.
This kind of arrangement makes the kiln car very heavy, aiding to heat absorption and
increase the gas consumption.
Case Study – 1
Modification in kiln car furniture by replacing ‘Solid Cordierite Kiln
Car Shelves (Saggers)’ with ‘Extruded Batts’, thereby reducing the
weight of kiln car (Low Thermal Mass Kiln)
Implementing
the technology
The diagrammatic representation of kiln car before modification at a
porcelain ware industry is shown here.
The size of the kiln 104’ (31.69 meters) approx.
Car capacity of kiln 27 Cars
Dimensions of the kiln
car (46” * 20” * 30”) (L * W * H)
Cycle time 40 Min

27
Material of car furniture
The shelves are made of Pressed Cordierite
and the platform is made up of heavy
refractory bricks with ceramic fibre as filling
Dimension of cordierite
plates 11” * 10” * 1” (280mm * 254 mm * 25mm)
Loaded product per kiln
car 150 Kg
No. of layers of sagger
per car 4 to 6 (depending upon size of product)
Gas consumption 287.35 SCM/Ton of product
A typical cordierite plate is shown here (For Symbolic reference only)
Recommendations:
As per the thumb rule, the gas consumption will be reduced
dramatically by reducing the weight of the kiln car. The option to
reduce the kiln car weight is by changing the design of shelves in the
kiln car
It is highly recommended to replace the Solid Cordierite Shelves with
light weight ‘Extruded Cordierite Batts’. The structure can be
visualized in the picture given below.
28
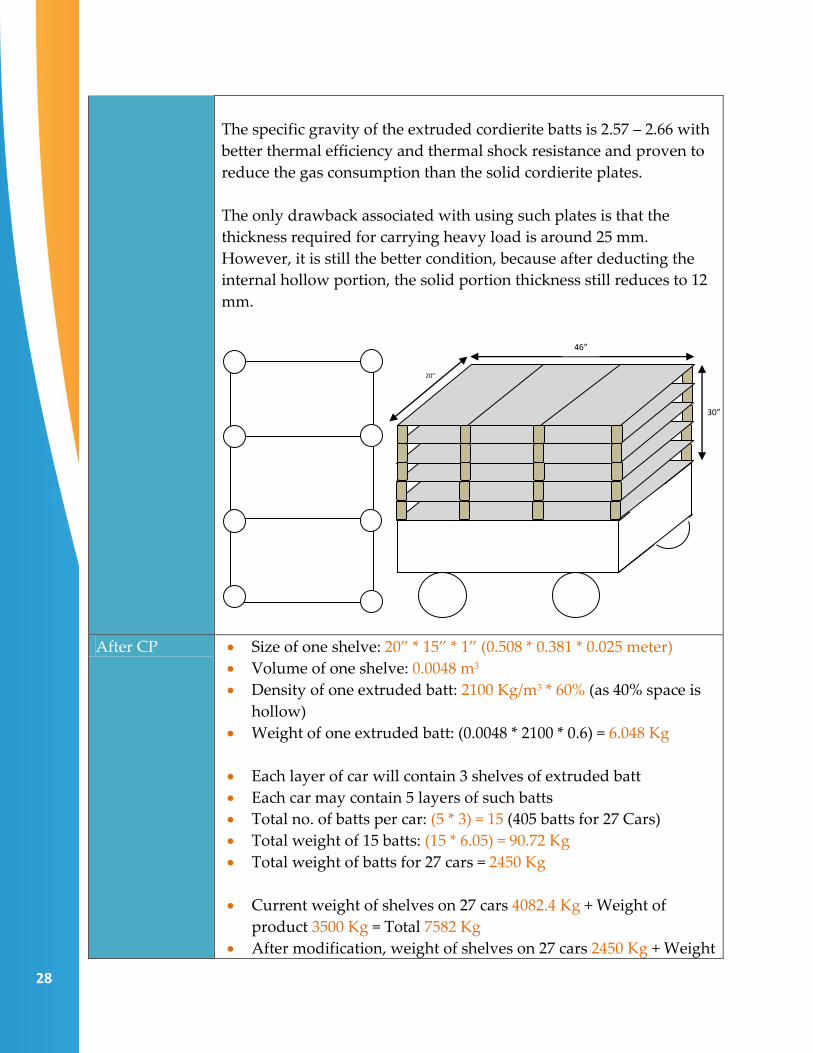
The specific gravity of the extruded cordierite batts is 2.57 – 2.66 with
better thermal efficiency and thermal shock resistance and proven to
reduce the gas consumption than the solid cordierite plates.
The only drawback associated with using such plates is that the
thickness required for carrying heavy load is around 25 mm.
However, it is still the better condition, because after deducting the
internal hollow portion, the solid portion thickness still reduces to 12
mm.
After CP Size of one shelve: 20” * 15” * 1” (0.508 * 0.381 * 0.025 meter)
Volume of one shelve: 0.0048 m3
Density of one extruded batt: 2100 Kg/m3 * 60% (as 40% space is
hollow)
Weight of one extruded batt: (0.0048 * 2100 * 0.6) = 6.048 Kg
Each layer of car will contain 3 shelves of extruded batt
Each car may contain 5 layers of such batts
Total no. of batts per car: (5 * 3) = 15 (405 batts for 27 Cars)
Total weight of 15 batts: (15 * 6.05) = 90.72 Kg
Total weight of batts for 27 cars = 2450 Kg
Current weight of shelves on 27 cars 4082.4 Kg + Weight of
product 3500 Kg = Total 7582 Kg
After modification, weight of shelves on 27 cars 2450 Kg + Weight
46”
30”
20”
29
of product 3500 Kg = Total 5950 Kg
Reduction in weight of cars: (7582 – 5950) = 1632 Kg
% Reduction in weight: 22%
% Reduction in Gas Consumption: 22% approx.
Savings in Gas Consumption per annum: 1,20,860 SCM
Benefit
Environmental
Per Day reduction in the gas consumption: 335.72 SCM.
Per Year reduction in gas consumption: 1,20,860 SCM.
Per Day reduction in Greenhouse Gas (CO2) emission: 0.63 MT
Per Year Reduction in Greenhouse Gas (CO2) emission: 226 MT
Economic
Investment: Rs. 4,90,000/- (for 405 batts @ Rs. 200/Kg of batt)
Expected Savings: Rs. 22,80,000/- per annum
Simple Payback Period: 3 Month
Case Study – 2
Modification in kiln car furniture by replacing ‘Solid Cordierite Kiln
Car Shelves (Saggers)’ with ‘Oxide Bonded Silicon Carbide (SiC)
Shelve’
Implementing
the technology
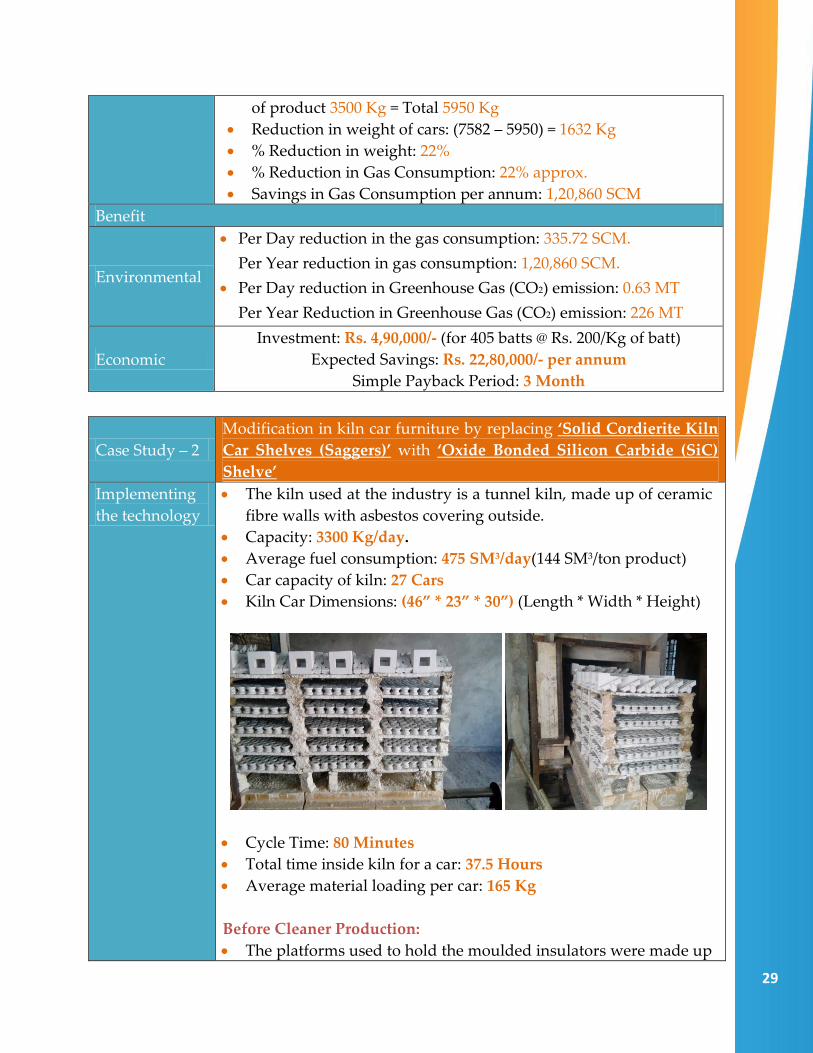
The kiln used at the industry is a tunnel kiln, made up of ceramic
fibre walls with asbestos covering outside.
Capacity: 3300 Kg/day.
Average fuel consumption: 475 SM3/day(144 SM3/ton product)
Car capacity of kiln: 27 Cars
Kiln Car Dimensions: (46” * 23” * 30”) (Length * Width * Height)
Cycle Time: 80 Minutes
Total time inside kiln for a car: 37.5 Hours
Average material loading per car: 165 Kg
Before Cleaner Production:
The platforms used to hold the moulded insulators were made up
30
of ‘Cordierite’
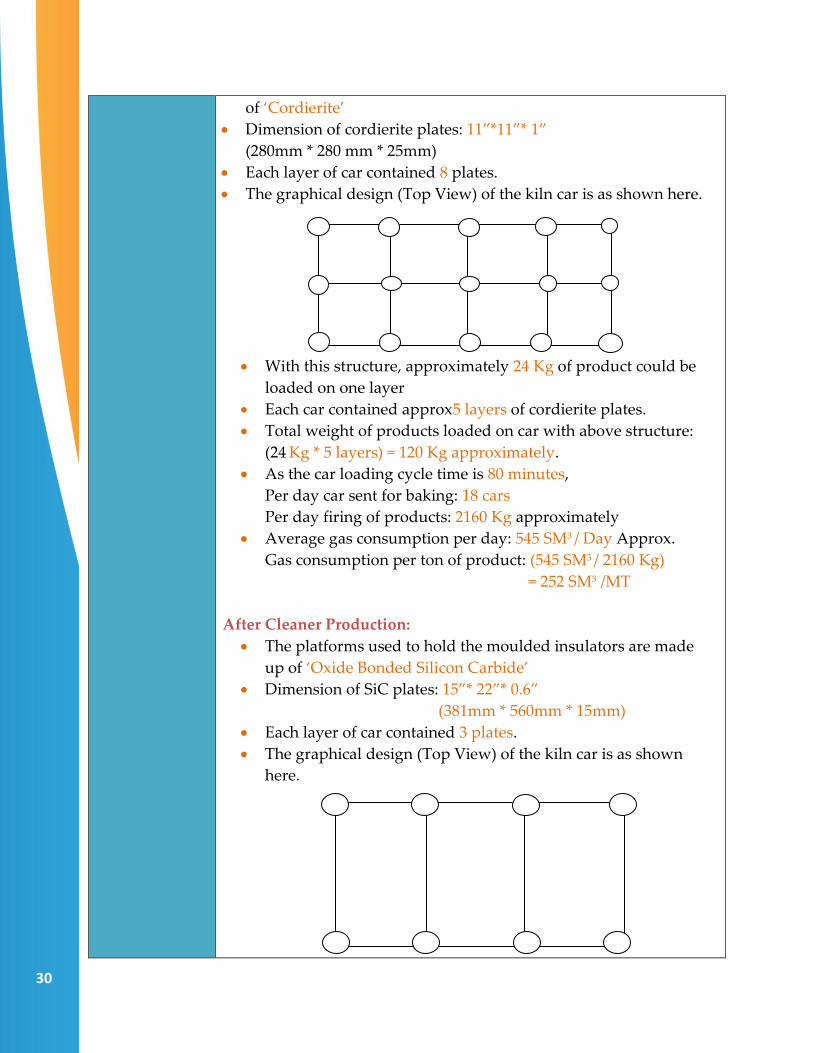
Dimension of cordierite plates: 11”*11”* 1”
(280mm * 280 mm * 25mm)
Each layer of car contained 8 plates.
The graphical design (Top View) of the kiln car is as shown here.
With this structure, approximately 24 Kg of product could be
loaded on one layer
Each car contained approx5 layers of cordierite plates.
Total weight of products loaded on car with above structure:
(24 Kg * 5 layers) = 120 Kg approximately.
As the car loading cycle time is 80 minutes,
Per day car sent for baking: 18 cars
Per day firing of products: 2160 Kg approximately
Average gas consumption per day: 545 SM3 / Day Approx.
Gas consumption per ton of product: (545 SM3 / 2160 Kg)
= 252 SM3 /MT
After Cleaner Production:
The platforms used to hold the moulded insulators are made
up of ‘Oxide Bonded Silicon Carbide’
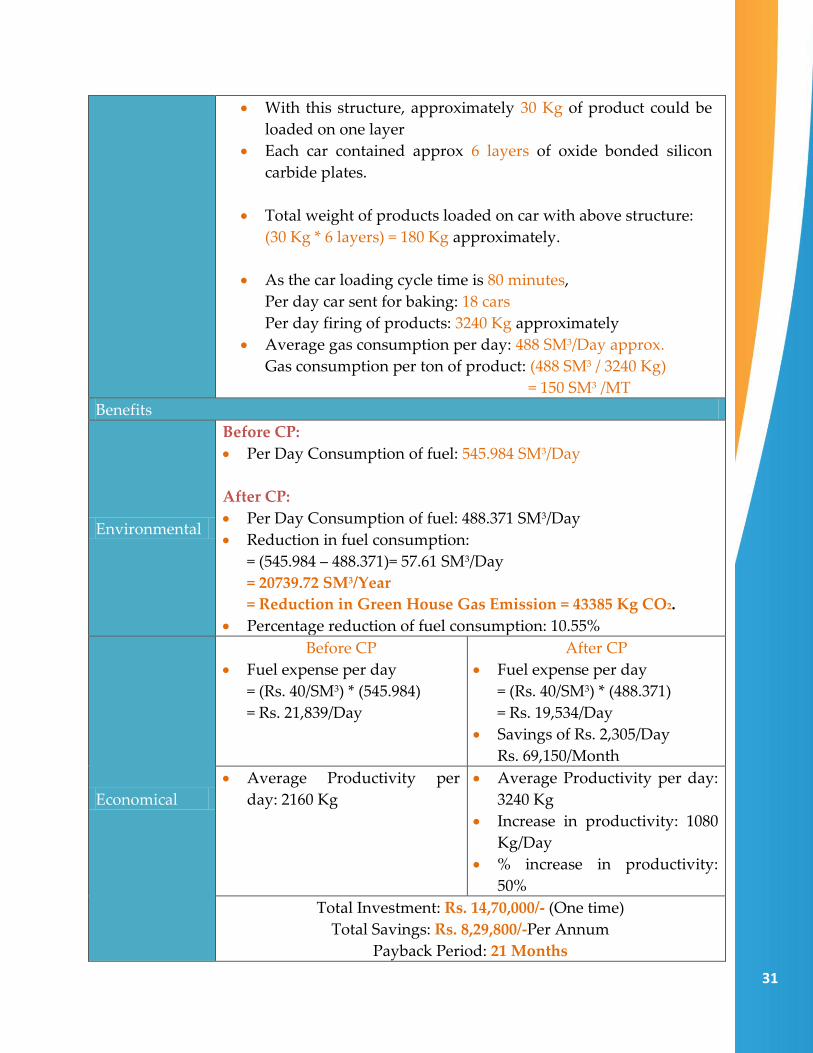
Dimension of SiC plates: 15”* 22”* 0.6”
(381mm * 560mm * 15mm)
Each layer of car contained 3 plates.
The graphical design (Top View) of the kiln car is as shown
here.
31
With this structure, approximately 30 Kg of product could be
loaded on one layer
Each car contained approx 6 layers of oxide bonded silicon
carbide plates.
Total weight of products loaded on car with above structure:
(30 Kg * 6 layers) = 180 Kg approximately.
As the car loading cycle time is 80 minutes,
Per day car sent for baking: 18 cars
Per day firing of products: 3240 Kg approximately
Average gas consumption per day: 488 SM3/Day approx.
Gas consumption per ton of product: (488 SM3 / 3240 Kg)
= 150 SM3 /MT
Benefits
Environmental
Before CP:
Per Day Consumption of fuel: 545.984 SM3/Day
After CP:
Per Day Consumption of fuel: 488.371 SM3/Day
Reduction in fuel consumption:
= (545.984 – 488.371)= 57.61 SM3/Day
= 20739.72 SM3/Year
= Reduction in Green House Gas Emission = 43385 Kg CO2.
Percentage reduction of fuel consumption: 10.55%
Economical
Before CP
Fuel expense per day
= (Rs. 40/SM3) * (545.984)
= Rs. 21,839/Day
After CP
Fuel expense per day
= (Rs. 40/SM3) * (488.371)
= Rs. 19,534/Day
Savings of Rs. 2,305/Day
Rs. 69,150/Month
Average Productivity per
day: 2160 Kg
Average Productivity per day:
3240 Kg
Increase in productivity: 1080
Kg/Day
% increase in productivity:
50%
Total Investment: Rs. 14,70,000/- (One time)
Total Savings: Rs. 8,29,800/-Per Annum
Payback Period: 21 Months
32
Case Study – 3 Tableware Industry – Replacing high weight HFK refractories with
light weight low density UltraliteTM filling material for kiln cars
Implementing
the technology
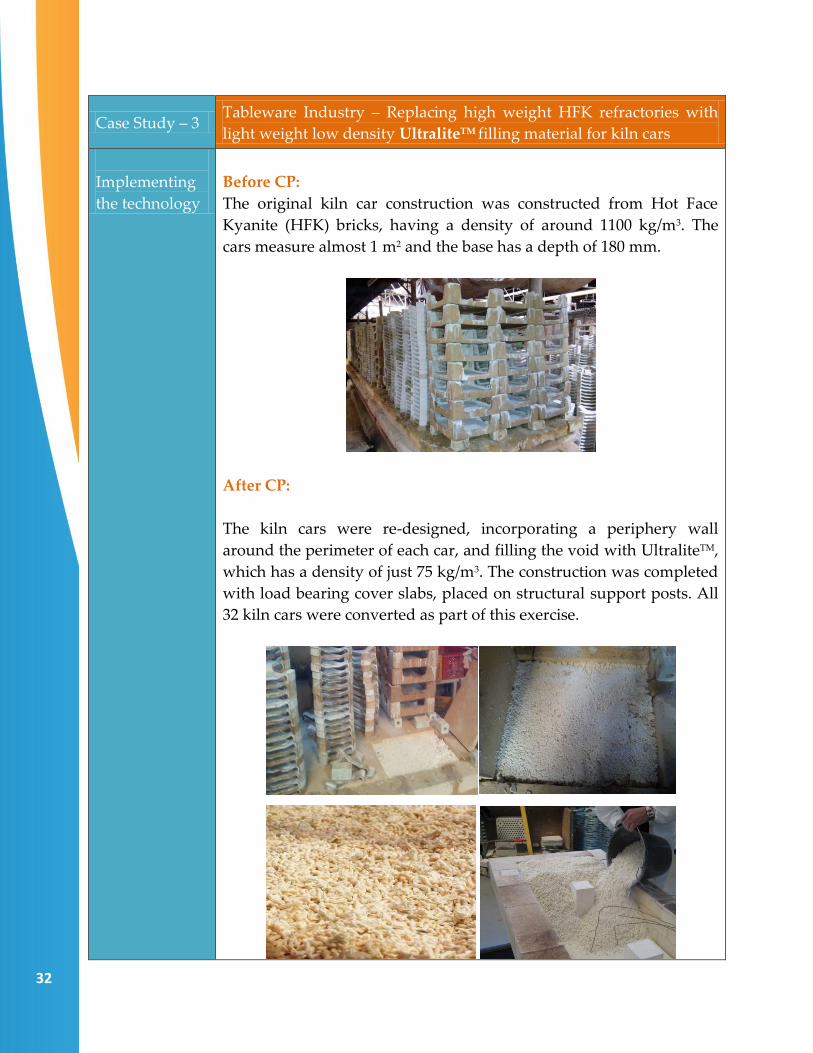
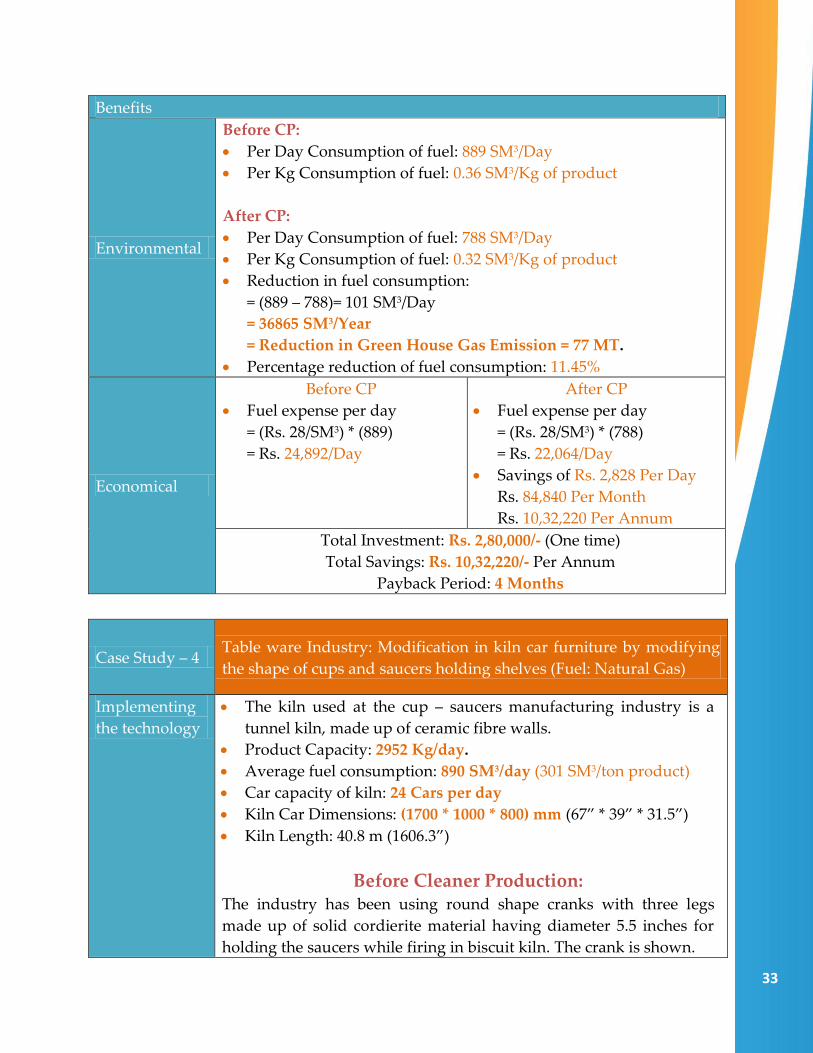
Before CP:
The original kiln car construction was constructed from Hot Face
Kyanite (HFK) bricks, having a density of around 1100 kg/m3. The
cars measure almost 1 m2 and the base has a depth of 180 mm.
After CP:
The kiln cars were re-designed, incorporating a periphery wall
around the perimeter of each car, and filling the void with UltraliteTM,
which has a density of just 75 kg/m3. The construction was completed
with load bearing cover slabs, placed on structural support posts. All
32 kiln cars were converted as part of this exercise.
33
Benefits
Environmental
Before CP:
Per Day Consumption of fuel: 889 SM3/Day
Per Kg Consumption of fuel: 0.36 SM3/Kg of product
After CP:
Per Day Consumption of fuel: 788 SM3/Day
Per Kg Consumption of fuel: 0.32 SM3/Kg of product
Reduction in fuel consumption:
= (889 – 788)= 101 SM3/Day
= 36865 SM3/Year
= Reduction in Green House Gas Emission = 77 MT.
Percentage reduction of fuel consumption: 11.45%
Economical
Before CP
Fuel expense per day
= (Rs. 28/SM3) * (889)
= Rs. 24,892/Day
After CP
Fuel expense per day
= (Rs. 28/SM3) * (788)
= Rs. 22,064/Day
Savings of Rs. 2,828 Per Day
Rs. 84,840 Per Month
Rs. 10,32,220 Per Annum
Total Investment: Rs. 2,80,000/- (One time)
Total Savings: Rs. 10,32,220/- Per Annum
Payback Period: 4 Months
Case Study – 4 Table ware Industry: Modification in kiln car furniture by modifying
the shape of cups and saucers holding shelves (Fuel: Natural Gas)
Implementing
the technology
The kiln used at the cup – saucers manufacturing industry is a
tunnel kiln, made up of ceramic fibre walls.
Product Capacity: 2952 Kg/day.
Average fuel consumption: 890 SM3/day (301 SM3/ton product)
Car capacity of kiln: 24 Cars per day
Kiln Car Dimensions: (1700 * 1000 * 800) mm (67” * 39” * 31.5”)
Kiln Length: 40.8 m (1606.3”)
Before Cleaner Production: The industry has been using round shape cranks with three legs
made up of solid cordierite material having diameter 5.5 inches for
holding the saucers while firing in biscuit kiln. The crank is shown.
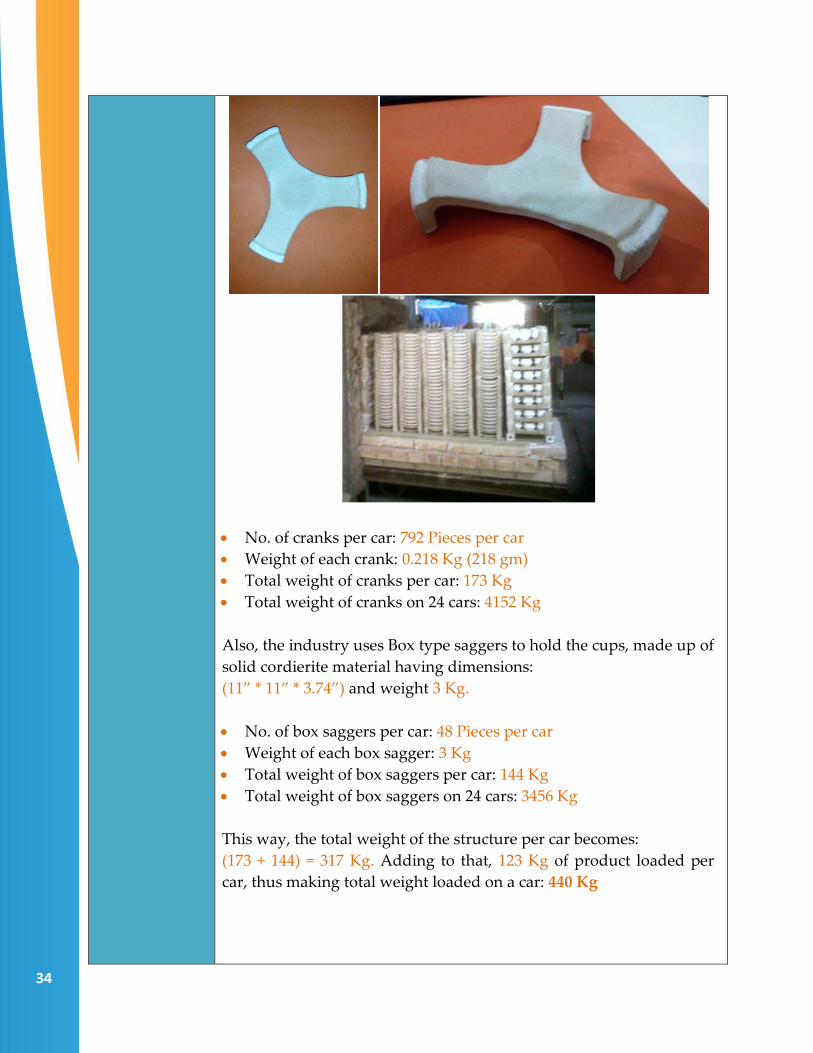
34
No. of cranks per car: 792 Pieces per car
Weight of each crank: 0.218 Kg (218 gm)
Total weight of cranks per car: 173 Kg
Total weight of cranks on 24 cars: 4152 Kg
Also, the industry uses Box type saggers to hold the cups, made up of
solid cordierite material having dimensions:
(11” * 11” * 3.74”) and weight 3 Kg.
No. of box saggers per car: 48 Pieces per car
Weight of each box sagger: 3 Kg
Total weight of box saggers per car: 144 Kg
Total weight of box saggers on 24 cars: 3456 Kg
This way, the total weight of the structure per car becomes:
(173 + 144) = 317 Kg. Adding to that, 123 Kg of product loaded per
car, thus making total weight loaded on a car: 440 Kg
35
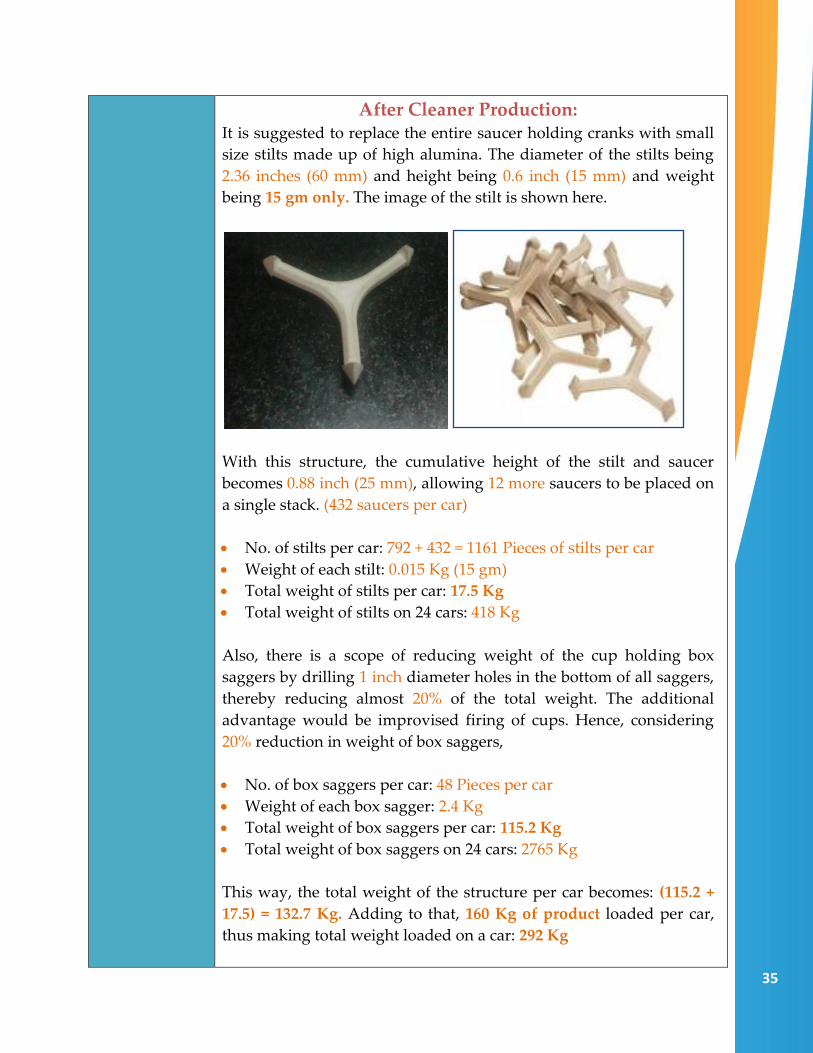
After Cleaner Production: It is suggested to replace the entire saucer holding cranks with small
size stilts made up of high alumina. The diameter of the stilts being
2.36 inches (60 mm) and height being 0.6 inch (15 mm) and weight
being 15 gm only. The image of the stilt is shown here.
With this structure, the cumulative height of the stilt and saucer
becomes 0.88 inch (25 mm), allowing 12 more saucers to be placed on
a single stack. (432 saucers per car)
No. of stilts per car: 792 + 432 = 1161 Pieces of stilts per car
Weight of each stilt: 0.015 Kg (15 gm)
Total weight of stilts per car: 17.5 Kg
Total weight of stilts on 24 cars: 418 Kg
Also, there is a scope of reducing weight of the cup holding box
saggers by drilling 1 inch diameter holes in the bottom of all saggers,
thereby reducing almost 20% of the total weight. The additional
advantage would be improvised firing of cups. Hence, considering
20% reduction in weight of box saggers,
No. of box saggers per car: 48 Pieces per car
Weight of each box sagger: 2.4 Kg
Total weight of box saggers per car: 115.2 Kg
Total weight of box saggers on 24 cars: 2765 Kg
This way, the total weight of the structure per car becomes: (115.2 +
17.5) = 132.7 Kg. Adding to that, 160 Kg of product loaded per car,
thus making total weight loaded on a car: 292 Kg

36
This whole structure will reduce (440 – 292) = 148 Kg of weight per
car, with an increased productivity due to addition of more space on
the top of car.
Reduction in the weight of car = 148 Kg
% Reduction in the weight of a car = 33.6%
Benefits
Environmental
Before CP:
Per Day Consumption of fuel: 890 SM3/Day
After CP:
Reduction in fuel consumption: 33.6%
Per Day Consumption of fuel: 590 SM3/Day
Per Day savings of fuel: (890 – 590) = 300 SM3/Day
Annual savings of fuel: 1,08,000 SM3/Day
Reduction in Green House Gas Emission = 202 MT CO2.
Economical
Before CP
Fuel expense per day
= (Rs. 28/SM3) * (890)
= Rs. 24,920/Day
After CP
Fuel expense per day
= (Rs. 28/SM3) * (590)
= Rs. 16,520/Day
Savings:
Rs. 8,400/Day
Rs. 30,24,000 per annum
Total Investment: Rs. 2,40,000/- (For purchasing stilts for 24 cars)
Total Savings: Rs. 30,24,000/- Per Annum
Payback Period: 1 Month

37
100% Reuse of Water &
Sludge in the Process
(Zero Liquid Discharge)

38
39
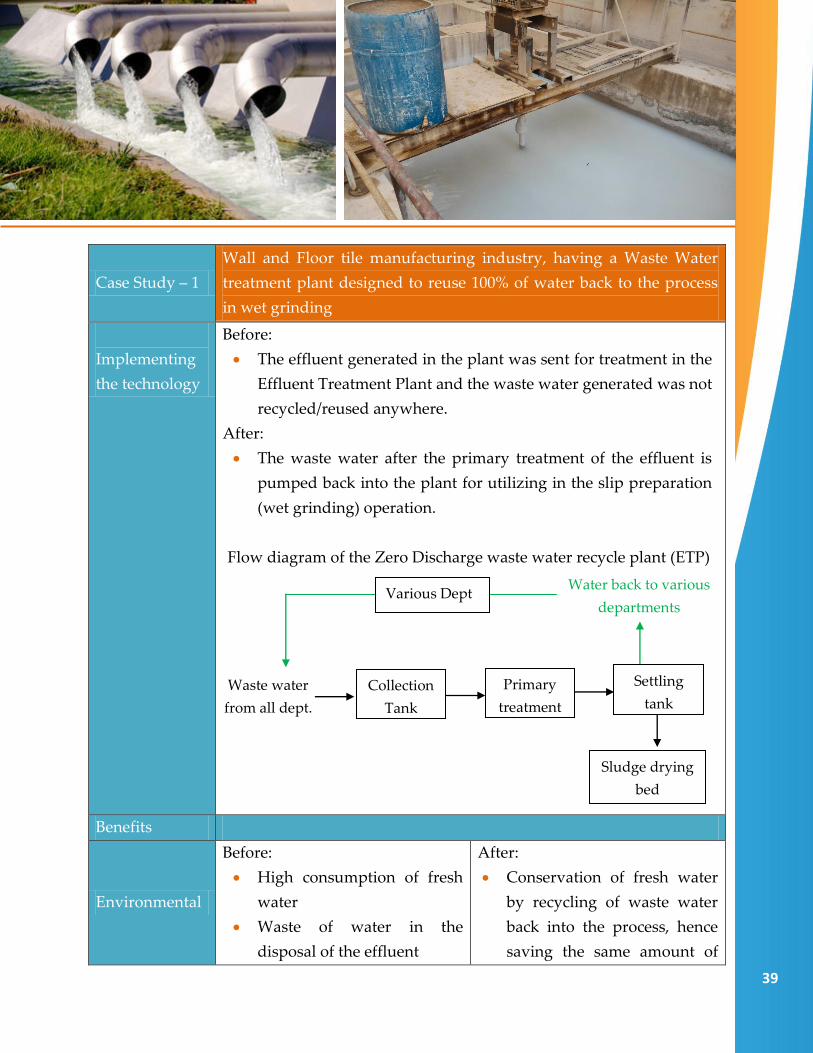
Case Study – 1
Wall and Floor tile manufacturing industry, having a Waste Water
treatment plant designed to reuse 100% of water back to the process
in wet grinding
Implementing
the technology
Before:
The effluent generated in the plant was sent for treatment in the
Effluent Treatment Plant and the waste water generated was not
recycled/reused anywhere.
After:
The waste water after the primary treatment of the effluent is
pumped back into the plant for utilizing in the slip preparation
(wet grinding) operation.
Flow diagram of the Zero Discharge waste water recycle plant (ETP)
Benefits
Environmental
Before:
High consumption of fresh
water
Waste of water in the
disposal of the effluent
After:
Conservation of fresh water
by recycling of waste water
back into the process, hence
saving the same amount of
Collection
Tank
Waste water
from all dept.
Primary
treatment
Settling
tank
Sludge drying
bed
Water back to various
departments Various Dept
40
fresh water
Zero discharge of liquid from
the industry
Economical
Industry had to buy more
amount of water from the GIDC
water supply system.
Reduced amount of purchase for
fresh water due to recycling
134.13 KL/Day of waste water.
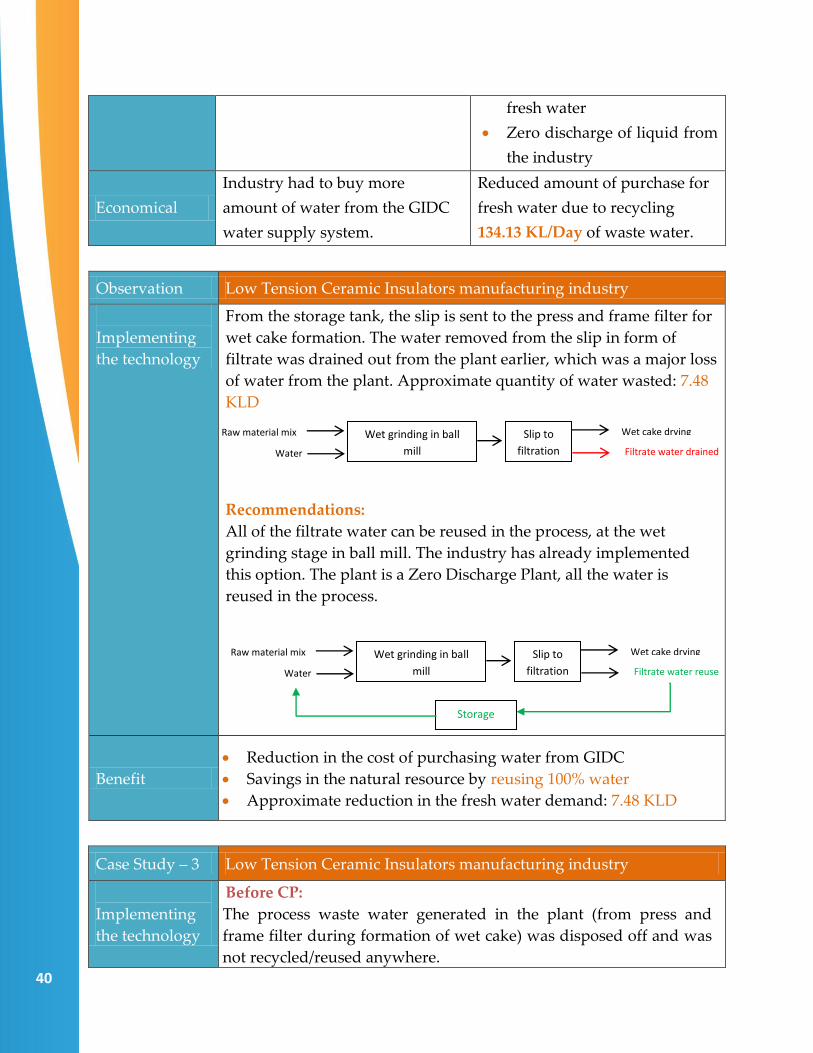
Observation Low Tension Ceramic Insulators manufacturing industry
Implementing
the technology
From the storage tank, the slip is sent to the press and frame filter for
wet cake formation. The water removed from the slip in form of
filtrate was drained out from the plant earlier, which was a major loss
of water from the plant. Approximate quantity of water wasted: 7.48
KLD
Recommendations:
All of the filtrate water can be reused in the process, at the wet
grinding stage in ball mill. The industry has already implemented
this option. The plant is a Zero Discharge Plant, all the water is
reused in the process.
Benefit
Reduction in the cost of purchasing water from GIDC
Savings in the natural resource by reusing 100% water
Approximate reduction in the fresh water demand: 7.48 KLD
Case Study – 3 Low Tension Ceramic Insulators manufacturing industry
Implementing
the technology
Before CP:
The process waste water generated in the plant (from press and
frame filter during formation of wet cake) was disposed off and was
not recycled/reused anywhere.
Raw material mix
Water
Wet grinding in ball
mill
Wet cake drying
Filtrate water drained
Slip to
filtration
Raw material mix
Water
Wet grinding in ball
mill
Wet cake drying
Filtrate water reuse
Slip to
filtration
Storage

41
The waste water also contained processed raw material filtered from
the press filter machine, which was also a considerable loss to the
industry.
After CP:
Industry has built two waste water storing and settling tanks in
which all the waste water from the press and filter section is stored.
After settling of the solid particles/sludge, 100% of water from the
tank is pumped back to the ball mill, in the wet grinding operation,
leading to Zero discharge of water.
Also, the sludge remained after the settling of solid particles, is
removed from the tank regularly and is used along with the fresh
raw material in wet grinding operation.
Benefits
Environmental
Before CP:
Wastage of water in the
drainage
Wastage of solid material
along with the drained water
After CP:
Recycle of 100% of waste
water and sludge into the
process, conserving 3 KL/Day
of water and 7 MT/month of
sludge.
Case Study – 4 Wall and Floor tile manufacturing industry, reusing 100% of sludge
generated in wet grinding operation for tiles body
Implementing
the technology
Before:
The effluent generated in the plant was sent for treatment in
the Effluent Treatment Plant and the sludge generated after
42
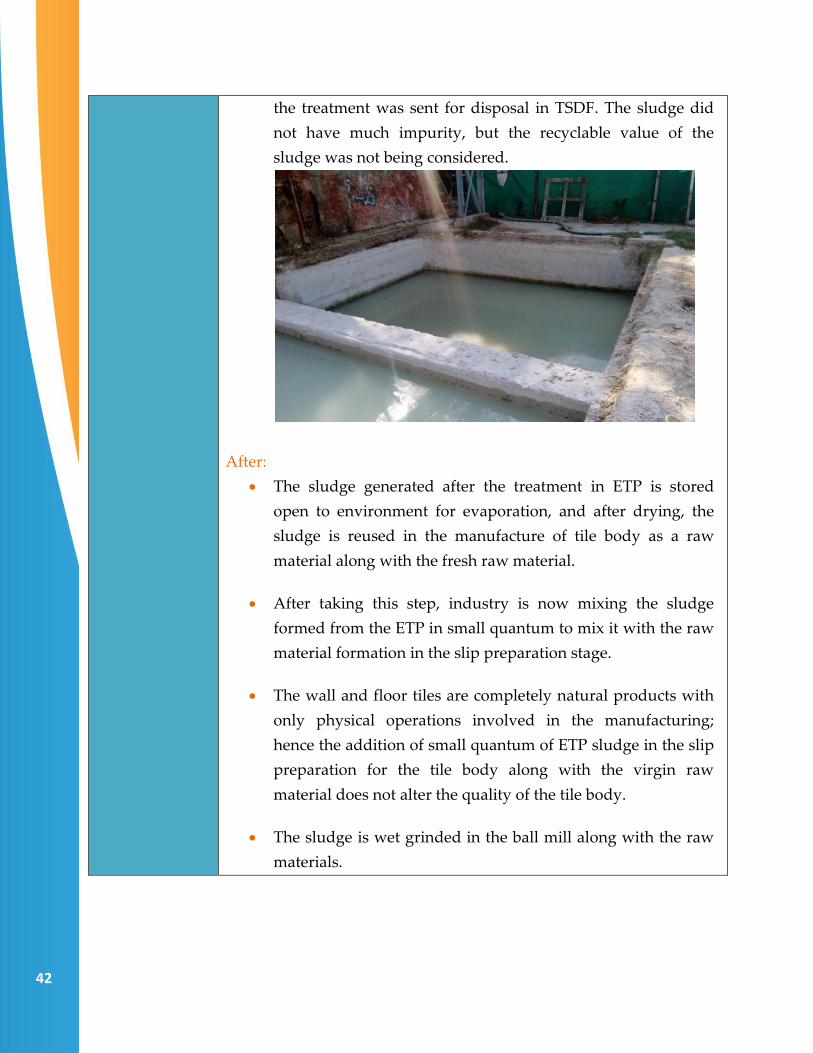
the treatment was sent for disposal in TSDF. The sludge did
not have much impurity, but the recyclable value of the
sludge was not being considered.
After:
The sludge generated after the treatment in ETP is stored
open to environment for evaporation, and after drying, the
sludge is reused in the manufacture of tile body as a raw
material along with the fresh raw material.
After taking this step, industry is now mixing the sludge
formed from the ETP in small quantum to mix it with the raw
material formation in the slip preparation stage.
The wall and floor tiles are completely natural products with
only physical operations involved in the manufacturing;
hence the addition of small quantum of ETP sludge in the slip
preparation for the tile body along with the virgin raw
material does not alter the quality of the tile body.
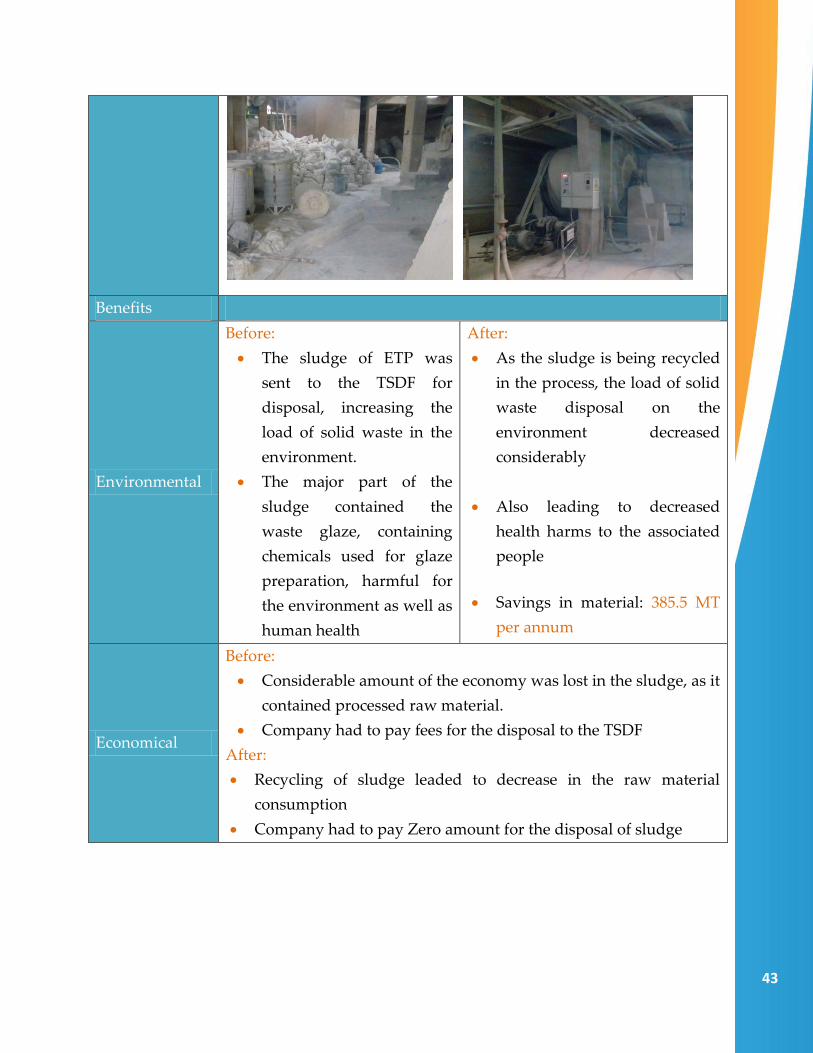
The sludge is wet grinded in the ball mill along with the raw
materials.
43
Benefits
Environmental
Before:
The sludge of ETP was
sent to the TSDF for
disposal, increasing the
load of solid waste in the
environment.
The major part of the
sludge contained the
waste glaze, containing
chemicals used for glaze
preparation, harmful for
the environment as well as
human health
After:
As the sludge is being recycled
in the process, the load of solid
waste disposal on the
environment decreased
considerably
Also leading to decreased
health harms to the associated
people
Savings in material: 385.5 MT
per annum
Economical
Before:
Considerable amount of the economy was lost in the sludge, as it
contained processed raw material.
Company had to pay fees for the disposal to the TSDF
After:
Recycling of sludge leaded to decrease in the raw material
consumption
Company had to pay Zero amount for the disposal of sludge

44
Options for Saving
Electricity

45
46
Electricity is equally the important and costlier utility in any plant like the natural gas, coal
and oil. There are many ways for saving electricity; some of them are very cheaper and
some are a little costlier, but every expense made as a return of investment. Saving
electricity does not only help the industry economically, but also helps reducing the
Carbon Footprint from the environment. Following are some of the proven case studies.
Case Study –1 Power factor improvement to unity through installation of capacitors
Before CP The source of outside power for the plant is from UGVCL (Uttar
Gujarat Vij Company Ltd.) grid at 11 kV. The 11 kV supply is stepped
down through common Discom transformer and supplied to the plant
at 420 V. For the type of connection plant has UGVCL do not have
clause for power factor penalty or rebate, but UGVCL charges Rs. 0.10
per kVArh which is recorded due to low power factor maintained
within plant.
The total amount paid to UGVCL against reactive power consumption
by the plant during January 2015 to December 2015 was Rs. 32,190
After CP Through power factor maintained near to unity, plant can reduce the
reactive power consumption which will save additional charges in
electricity bill. Power factor is improved by the installation
ofcapacitors and replacement of the de-rated existing capacitors.
Benefit
Economical Investment: Rs. 25,000/- (for capacitors) Approx.
Annual Savings: Rs. 32,000/- per annum
Payback Period: 10 months
Case Study – 2 Installation of Variable Frequency Drive (VFD) In Ball Mill Motor
Before CP
Plant is operating 5 nos. ball mills, with common connection to single
30 HP motor. The motor load test conducted while operating all 5 nos.
ball mill simultaneously is shown in table below:
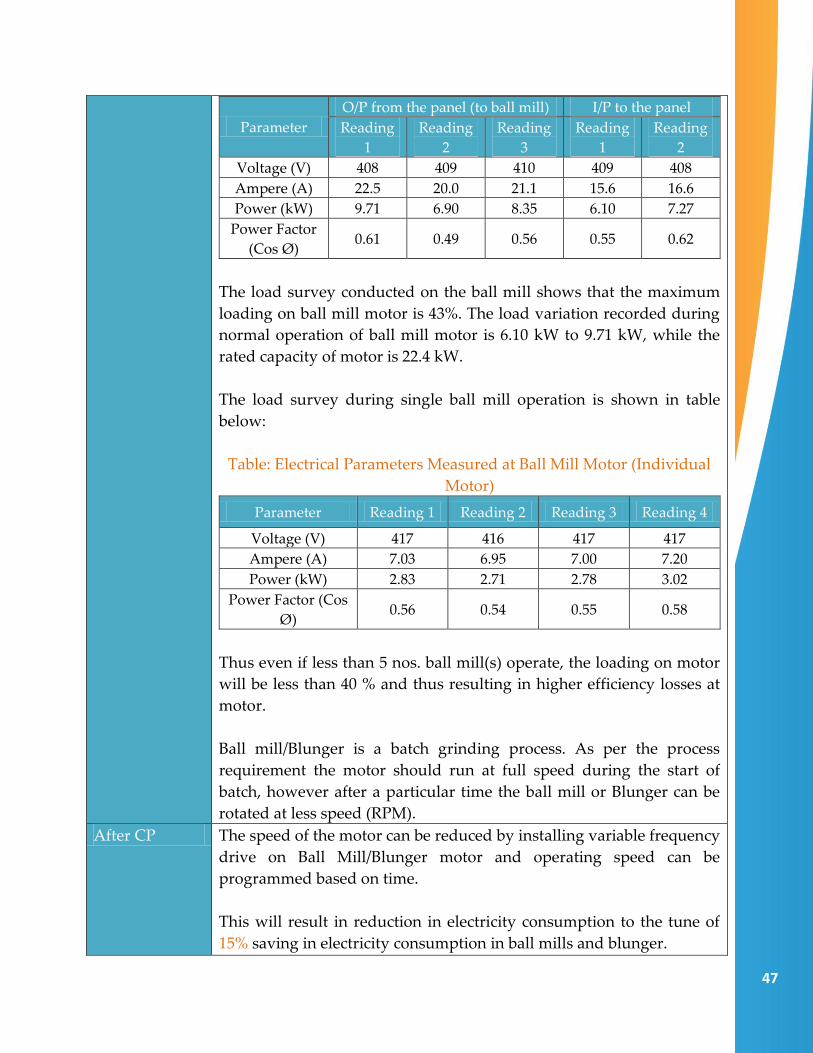
Table: Electrical Parameters Measured at Ball Mill Motor (5 Ball Mills
to single motor)
47
Parameter
O/P from the panel (to ball mill) I/P to the panel
Reading
1
Reading
2
Reading
3
Reading
1
Reading
2
Voltage (V) 408 409 410 409 408
Ampere (A) 22.5 20.0 21.1 15.6 16.6
Power (kW) 9.71 6.90 8.35 6.10 7.27
Power Factor
(Cos Ø) 0.61 0.49 0.56 0.55 0.62
The load survey conducted on the ball mill shows that the maximum
loading on ball mill motor is 43%. The load variation recorded during
normal operation of ball mill motor is 6.10 kW to 9.71 kW, while the
rated capacity of motor is 22.4 kW.
The load survey during single ball mill operation is shown in table
below:
Table: Electrical Parameters Measured at Ball Mill Motor (Individual
Motor)
Parameter Reading 1 Reading 2 Reading 3 Reading 4
Voltage (V) 417 416 417 417
Ampere (A) 7.03 6.95 7.00 7.20
Power (kW) 2.83 2.71 2.78 3.02
Power Factor (Cos
Ø) 0.56 0.54 0.55 0.58
Thus even if less than 5 nos. ball mill(s) operate, the loading on motor
will be less than 40 % and thus resulting in higher efficiency losses at
motor.
Ball mill/Blunger is a batch grinding process. As per the process
requirement the motor should run at full speed during the start of
batch, however after a particular time the ball mill or Blunger can be
rotated at less speed (RPM).
After CP The speed of the motor can be reduced by installing variable frequency
drive on Ball Mill/Blunger motor and operating speed can be
programmed based on time.
This will result in reduction in electricity consumption to the tune of
15% saving in electricity consumption in ball mills and blunger.
48
Benefit
Environmental Reduction in the electricity consumption by 5500 units per year,
ultimately reducing the carbon footprints to the environment.
Economical Investment: Rs. 40,000/- (for 40 HP VFD) Approx.
Annual Savings: Rs. 41,300/- per annum
Payback Period: 12 months
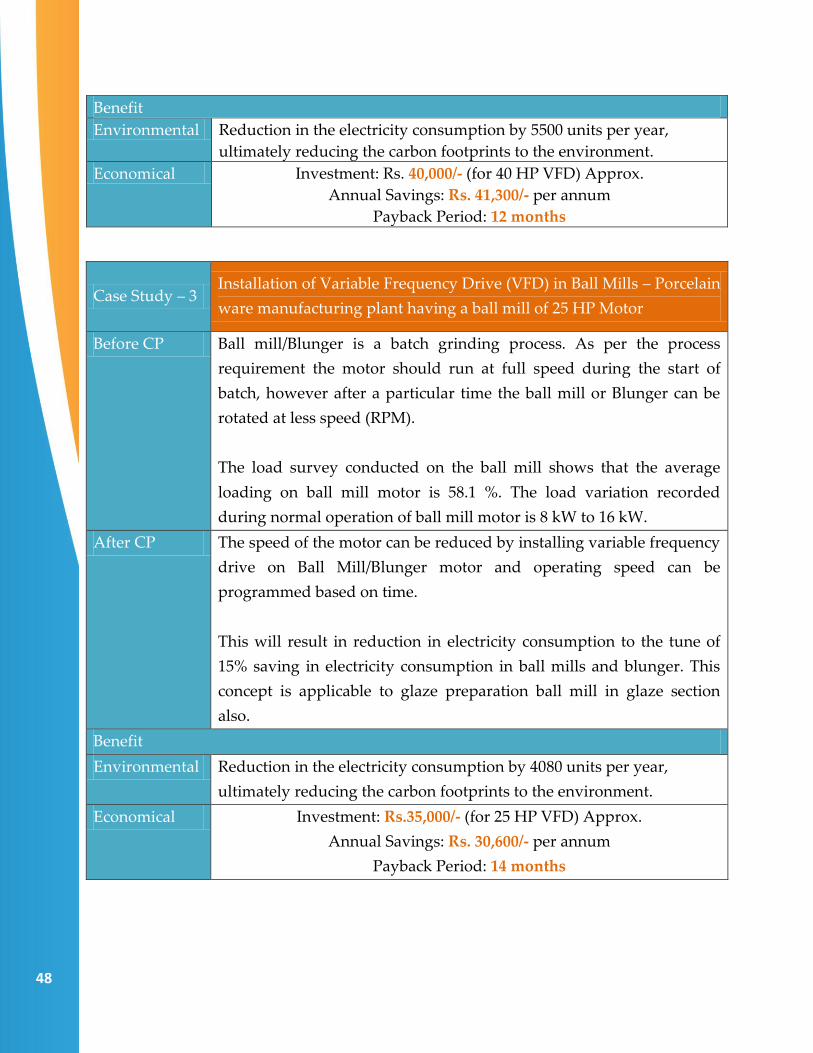
Case Study – 3 Installation of Variable Frequency Drive (VFD) in Ball Mills – Porcelain
ware manufacturing plant having a ball mill of 25 HP Motor
Before CP Ball mill/Blunger is a batch grinding process. As per the process
requirement the motor should run at full speed during the start of
batch, however after a particular time the ball mill or Blunger can be
rotated at less speed (RPM).
The load survey conducted on the ball mill shows that the average
loading on ball mill motor is 58.1 %. The load variation recorded
during normal operation of ball mill motor is 8 kW to 16 kW.
After CP The speed of the motor can be reduced by installing variable frequency
drive on Ball Mill/Blunger motor and operating speed can be
programmed based on time.
This will result in reduction in electricity consumption to the tune of
15% saving in electricity consumption in ball mills and blunger. This
concept is applicable to glaze preparation ball mill in glaze section
also.
Benefit
Environmental Reduction in the electricity consumption by 4080 units per year,
ultimately reducing the carbon footprints to the environment.
Economical Investment: Rs.35,000/- (for 25 HP VFD) Approx.
Annual Savings: Rs. 30,600/- per annum
Payback Period: 14 months
49
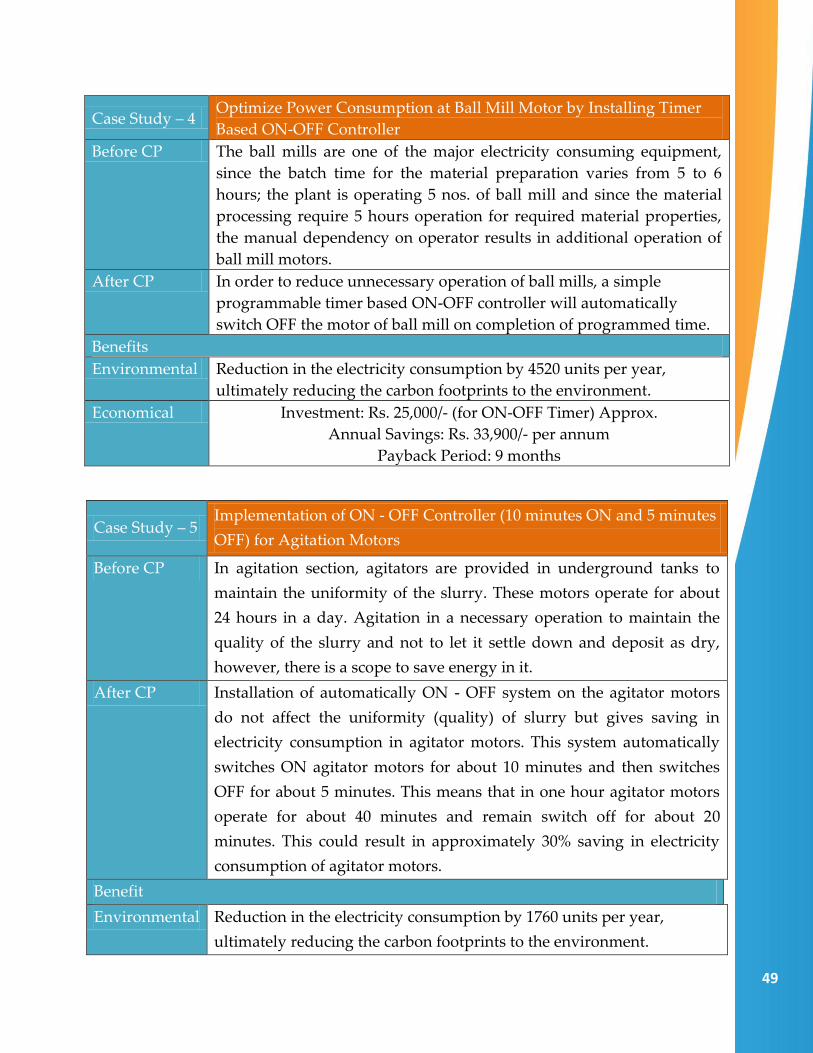
Case Study – 4 Optimize Power Consumption at Ball Mill Motor by Installing Timer
Based ON-OFF Controller
Before CP The ball mills are one of the major electricity consuming equipment,
since the batch time for the material preparation varies from 5 to 6
hours; the plant is operating 5 nos. of ball mill and since the material
processing require 5 hours operation for required material properties,
the manual dependency on operator results in additional operation of
ball mill motors.
After CP In order to reduce unnecessary operation of ball mills, a simple
programmable timer based ON-OFF controller will automatically
switch OFF the motor of ball mill on completion of programmed time.
Benefits
Environmental Reduction in the electricity consumption by 4520 units per year,
ultimately reducing the carbon footprints to the environment.
Economical Investment: Rs. 25,000/- (for ON-OFF Timer) Approx.
Annual Savings: Rs. 33,900/- per annum
Payback Period: 9 months
Case Study – 5 Implementation of ON - OFF Controller (10 minutes ON and 5 minutes
OFF) for Agitation Motors
Before CP In agitation section, agitators are provided in underground tanks to
maintain the uniformity of the slurry. These motors operate for about
24 hours in a day. Agitation in a necessary operation to maintain the
quality of the slurry and not to let it settle down and deposit as dry,
however, there is a scope to save energy in it.
After CP Installation of automatically ON - OFF system on the agitator motors
do not affect the uniformity (quality) of slurry but gives saving in
electricity consumption in agitator motors. This system automatically
switches ON agitator motors for about 10 minutes and then switches
OFF for about 5 minutes. This means that in one hour agitator motors
operate for about 40 minutes and remain switch off for about 20
minutes. This could result in approximately 30% saving in electricity
consumption of agitator motors.
Benefit
Environmental Reduction in the electricity consumption by 1760 units per year,
ultimately reducing the carbon footprints to the environment.

50
Economical Investment: Rs.8,000/- (for timer based ON-OFF controller) Approx.
Savings: Rs. 13,200/- per annum
Payback Period: 8 months
Case Study – 6 Avoid Compressed air usage for cleaning purposes from direct open
hose pipe
Before CP During the visit of all the industries, it was observed that compressed
air was used for cleaning purposes at all workstations to clean the
components with an open hose of 5 mm diameter and at 6 kg/cm²g
pressure.
After CP Usually, cleaning can be done at lower pressure (around 2-3 kg/cm²g).
So, the first step would be to reduce the pressure and energy saving
would be around 8% at drop of each bar for that hose if generated
separately. From our past experience the company can save Rs. 21,000
per year (from one workplace) by installing compressed air saving
gun.
The compressed air is a costly utility and the less critical purposes like
cleaning can be achieved by installing air saver nozzles at the tip of
these cleaning devices or shall be replaced with new one.
The special design of these improved cleaning nozzles allows ambient
air to get entrained in the path due to vacuum created by compressed
air and delivers the air with similar velocity and thrust giving to
desired cleaning effect.
However, the amount of compressed air uses is only 20-25% which
reduces the compressed air requirement and thus resulting in energy
savings. In addition, these nozzles also reduce the noise level.

51
Strong Recommendations for Efficient Working of Compressor:
The Compressor must be located in a cool and dry area.
Avoid moist air near the compressor area, as Hot and Moist air
cannot be compressed efficiently and the equipment starts using
more electricity day by day.
The heat generated from the compressor motor must be removed
from the surrounding of the compressor in case of a closed room;
however, it is NOT advised to install air cooler to cool the area, as
cooled will aid the moisture in the air, which is not recommended.
Environmental Reduction in the electricity consumption to generate the compressed
air, with that, also reducing Noise Pollution of the surrounding,
making the site easy to work
Economical Investment: 3,000/- per gun
Annual Savings: Rs. 21,000/- per station
Payback Period: 3 months

52
Improvement in Kiln
Insulation
53
Improvement in Kiln Insulation using PCPF Wall Blocks
Generally used insulation in ceramic industries is Ceramic Fiber. However, there are
many drawbacks associated with it, such as –
It shrinks on prolonged use at higher temperature
Loses its insulation properties after 2 – 3 years, as it starts absorbing moisture
It develops huge gaps in-between the insulation, adding to the heat losses
The broken pieces of fiber fall on the product, damaging the product quality
Kiln undergoes maintenance every now and then
Most important of all, its non – precautionary use may lead to increased chances of
diseases like cancer
In European countries, there is legislation on using the ceramic fiber – it is
considered as Category – 1 B Carcinogenic and needs to carry a Danger sign on its
packing.
It is recommended to insulate the Kiln Walls using ‘Pre-Cast Pre-Fired (PCPF) Hollow
Wall Blocks. Its technical parameters are as follows.
As all the industries Steel, Cement, Non metal, petroleum, all engineering industries
progressed in more and more sophisticated, their requirement for precision and
durability increased. The need for better, stronger, stable at extreme conditions of
pressure or temperature or abrasion material increased.
The conventional Pressed Refractory fired at high temperature were found wanting in
such critical situation. Newer system of manufacturing, newer material stronger and
fired at low temperature for the ease of Transportation and movement, far more stable
were found. The unique ability to be formed in any shape you want, gave the designer a
vastly improved area of working. These are pre cast, and pre fired to the precision
required. The use of Hydraulic and Ceramic bonding simultaneous make these a
unique material.
Historically, all the kilns were lined by pressed, standard sized bricks in all the cases in
9" or 12” series. So the wall thickness in all the kilns and furnaces were either 12-18 or 24
inches thick, irrespective of its requirement. Anything less than 9" long was not
available and hence they will use only this. Material like The Ceramic Fibre, the
ULTRALITE, the Vermiculite got discovered in the last ten to twenty years.
54
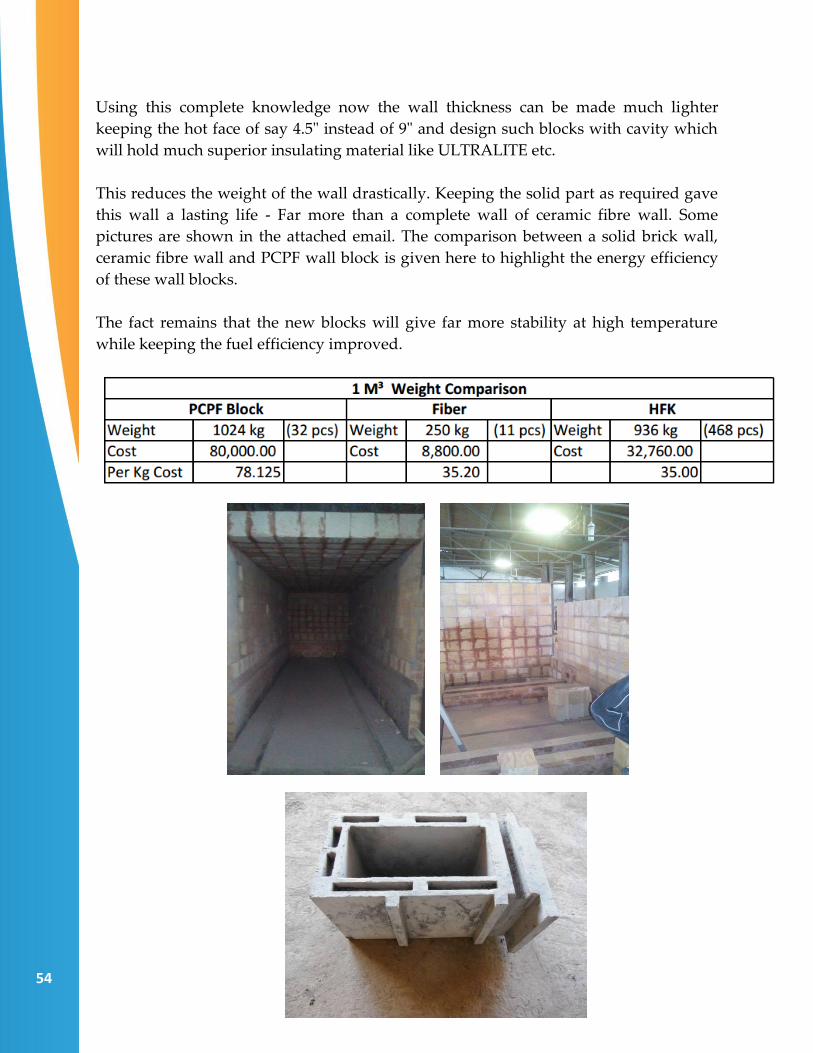
Using this complete knowledge now the wall thickness can be made much lighter
keeping the hot face of say 4.5" instead of 9" and design such blocks with cavity which
will hold much superior insulating material like ULTRALITE etc.
This reduces the weight of the wall drastically. Keeping the solid part as required gave
this wall a lasting life - Far more than a complete wall of ceramic fibre wall. Some
pictures are shown in the attached email. The comparison between a solid brick wall,
ceramic fibre wall and PCPF wall block is given here to highlight the energy efficiency
of these wall blocks.
The fact remains that the new blocks will give far more stability at high temperature
while keeping the fuel efficiency improved.

For More Details:
Gujarat Cleaner Production Centre
(Established by Industries & Mines Department, Government of Gujarat)
Block No: 11-12, 3rd Floor, Udhyog Bhavan, Gandhinagar
Phone: + 91 79 2324 4147 Email: [email protected] Web: www.gcpcgujarat.org.in