Embed Size (px)
Citation preview
CDM-SSC-PDD (version 02)
CDM – Executive Board page 1
CLEAN DEVELOPMENT MECHANISM
SIMPLIFIED PROJECT DESIGN DOCUMENT
FOR SMALL-SCALE PROJECT ACTIVITIES (SSC-CDM-PDD)
Version 02
CONTENTS
A. General description of the small-scale project activity B. Baseline methodology C. Duration of the project activity / Crediting period D. Monitoring methodology and plan E. Calculation of GHG emission reductions by sources F. Environmental impacts G. Stakeholders comments
Annexes
Annex 1: Information on participants in the project activity Annex 2: Information regarding public funding Annex 3: Information regarding monitoring plan Annex 4: Cash flow analysis
CDM-SSC-PDD (version 02)
CDM – Executive Board page 2
Revision history of this document
Version
Number
Date Description and reason of revision
01 21 January 2003
Initial adoption
02 8 July 2005 • The Board agreed to revise the CDM SSC PDD to reflect guidance and clarifications provided by the Board since version 01 of this document.
• As a consequence, the guidelines for completing CDM SSC PDD have been revised accordingly to version 2. The latest version can be found at <http://cdm.unfccc.int/Reference/Documents>.
CDM-SSC-PDD (version 02)
CDM – Executive Board page 3
SECTION A. General description of the small-scale project activity
A.1. Title of the small-scale project activity:
- Title of the project activity: “Fuel oil to natural gas switching at Votorantim Cimentos Cubatão”. - Version number of the document: 02 - Date of the document: 17 July 2006
A.2. Description of the small-scale project activity:
The purpose of the project activity is switching fuel oil to natural gas in the blast furnace slag dryer, at Votorantim Cimentos in the plant of Cubatão, São Paulo, Brazil that produces cement. In the baseline scenario, fuel oil would otherwise continue to be used during the crediting period. Cement is made by heating limestone with small quantities of other materials, such as clay, to 1,450°C in a kiln. The resulting hard substance, called clinker, is then ground into a powder, in cement mills, with a small amount of gypsum to make the Ordinary Portland Cement (OPC), the first produced type of cement. Other materials can be used in substitution of clinker in the grinding phase of the fabrication, producing the so-called blended cement. Blast furnace slag is one of these alternative materials, resulting in the production of the Portland Blast Furnace Slag cement (PBFS). The blast furnace slag is a residue of pig iron production similar to sand, that has properties near to clinker and that can be used, under certain conditions, as clinker substitute. In the project activity the slag is used in the grinding phase of cement production chain, i.e. slag replaces clinker in the cement mills avoiding, then, clinker production in the kilns. It is important to highlight that the cement industry plays a significant role in Climate Change. First because the cement manufacture is an energy intensive process, demanding large amounts of fuel and electricity in the whole process chain. In addition, the chemical process of producing clinker (calcination of limestone) produces non-renewable CO2. These two factors results in that the cement industry is responsible for a significant portion of global man-made CO2 emissions. It is estimated that 50% of the cement industry GHG emissions derive from the chemical process, and 40% from burning fuel. The remainder is split between electricity and transport uses. Knowledgeable of that, back in 1999, worldwide cement industry launched the Cement Sustainability Initiative. Among other reasons, the Initiative was launched in response to international concerns about the role of the cement industry in Climate Change. The objective of the Initiative was to develop studies and to propose an agenda towards the sustainability of the cement industry. In the Climate Change chapter, the agenda proposed some important actions including: innovation in improving the energy efficiency of processes and equipment; switching to lower carbon fuels; using alternative raw materials to reduce limestone use; developing CO2 capture and sequestration techniques; and taking advantage of market mechanisms such as emissions trading and voluntary initiatives. Votorantim Cimentos is signatory of the Cement Industry Initiative and started to define strategies in order to meet the Initiative agenda, including the implementation of this project activity.
CDM-SSC-PDD (version 02)
CDM – Executive Board page 4
Grupo Votorantim is among the largest business groups in Brazil. It participates in several markets in the country, including cement, cellulose, paper, aluminum, zinc, nickel, long steel, polypropylene bioriented films, chemical specialties and orange juice. It also has an important share in the financial sector through Banco Votorantim. In the cement, lime, mortar and concrete businesses, in Brazil and abroad, the group is represented by Votorantim Cimentos. In Brazil, Votorantim Cimentos leads both the cement market and the hydrated and industrial lime markets, and also holds a distinguished position in the mortar market. Abroad, through the operation of St. Marys, it has a 10% share of the Canadian market and about 2% of the U.S. cement market. The project activity contributes to sustainable development for several reasons:
- Natural gas reduces criteria air pollutants emissions, especially particulate matter, sulphur oxides and carbon monoxide.
- Natural gas use also contributes to the mitigation of greenhouse gases emissions as it is less
carbon intensive when compared to other fossil fuels, like fuel oil. - Additionally, the transportation of natural gas to the site is safer and more environmentally
friendly than fuel oil because it avoids the use of road trucks carrying fuel oil.
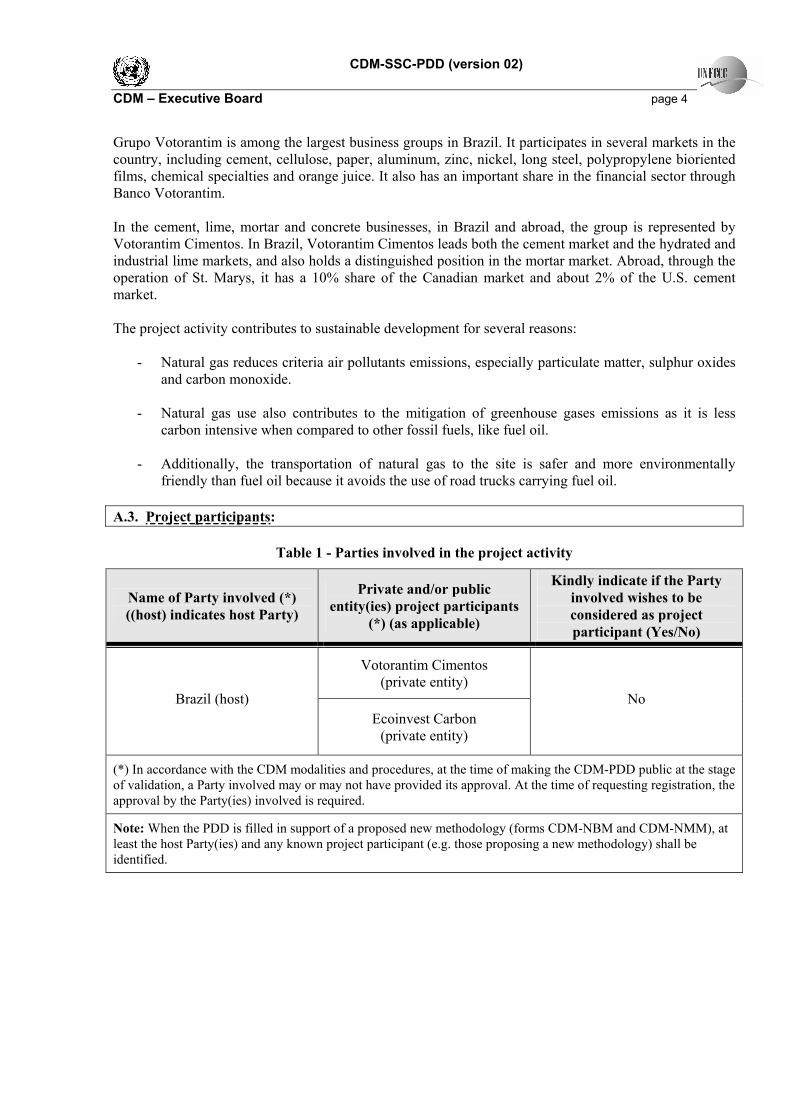
A.3. Project participants:
Table 1 - Parties involved in the project activity
Name of Party involved (*)
((host) indicates host Party)
Private and/or public
entity(ies) project participants
(*) (as applicable)
Kindly indicate if the Party
involved wishes to be
considered as project
participant (Yes/No)
Votorantim Cimentos (private entity)
Brazil (host)
Ecoinvest Carbon (private entity)
No
(*) In accordance with the CDM modalities and procedures, at the time of making the CDM-PDD public at the stage
of validation, a Party involved may or may not have provided its approval. At the time of requesting registration, the
approval by the Party(ies) involved is required.
Note: When the PDD is filled in support of a proposed new methodology (forms CDM-NBM and CDM-NMM), at
least the host Party(ies) and any known project participant (e.g. those proposing a new methodology) shall be
identified.
CDM-SSC-PDD (version 02)
CDM – Executive Board page 5
A.4. Technical description of the small-scale project activity:
A.4.1. Location of the small-scale project activity:
A.4.1.1. Host Party(ies):
Brazil.
A.4.1.2. Region/State/Province etc.:
São Paulo.
A.4.1.3. City/Town/Community etc:
Cubatão.
A.4.1.4. Detail of physical location, including information allowing the unique identification of this
small-scale project activity(ies):
Project activity is located at:
Votorantim Cimentos – Unidade Cubatão Rodovia Cônego Domênico Rangoni, s/n – km 62 – Vila Parise Cubatão - São Paulo Brazil Phone: (+55 13) 3361-1187
A.4.2. Type and category(ies) and technology of the small-scale project activity:
Votorantim Cimentos project is under “Type III – Other project activities”, “Category III.B – Switching fossil fuels”, May 12th, 2006, version 8. The project activity involved the retrofitting of the existing dryer. Blast furnace slag is a residue of pig iron production similar to sand. It has chemical properties that allow it to be used, under certain conditions, as clinker substitute. Before being used to produce cement, the blast furnace slag must be dried. Before the project activity the dryer used fuel oil as energy source. After the project implementation, the dryer started to burn natural gas.
A.4.3. Brief explanation of how the anthropogenic emissions of anthropogenic greenhouse gas
(GHGs) by sources are to be reduced by the proposed small-scale project activity, including why
the emission reductions would not occur in the absence of the proposed small-scale project activity,
taking into account national and/or sectoral policies and circumstances:
The emission reductions of Votorantim Cimentos Cubatão project will be achieved through using natural gas, a fuel with lower carbon emission factor than the previously used fuel, fuel oil. Natural gas is the less carbon intensive from among all fossil fuels. The emissions reductions for Votorantim Cimentos Cubatão project rely on this fact.
CDM-SSC-PDD (version 02)
CDM – Executive Board page 6
In the absence of the CDM incentives the project activity would not happen and the emissions would be greater than that of the project scenario, because fuel oil would be used instead of natural gas. The additionality assessment conducted in Section B.3 presents with further details the additionality of the project. There are no national and/or sectoral policies and circumstances that influence the decisions or impose obligations to the proposed project activity. The use of fuel oil and natural gas are not restricted nor demanded by any local legislation. Also, no sectoral policies incentive the use of natural gas or disincentive the use of fuel oil. Therefore, no sectoral policies and circumstances would make the project activity preferred, rather than the baseline scenario. The only national circumstance that foments the new technology is the participation of Brazil in the Kyoto Protocol, which allows the project to benefit from the CDM incentives.
A.4.3.1 Estimated amount of emission reductions over the chosen crediting period:
Table 2 accounts for the estimated amount of emissions reduction based on the forecasted natural gas consumption. The crediting period is 7 years, starting in 2004.
Table 2 – Estimated emission reductions
Years
Annual estimation of emission
reductions
[tCO2]
2004 (26-may-04 – 31-dec-2004) 1,202
2005 2,074
2006 2,074
2007 2,074
2008 2,074
2009 2,074
2010 2,074
2011 (1-jan-2011 – 25-may-2011) 872
Total estimated reductions (tCO2eq) 14,517
Total number of crediting years 7
Annual average over the crediting period of estimated reductions (tCO2eq)
2,074
A.4.4. Public funding of the small-scale project activity:
There is no public funding involved in the project activity.
A.4.5. Confirmation that the small-scale project activity is not a debundled component of a larger
project activity:
CDM-SSC-PDD (version 02)
CDM – Executive Board page 7
A proposed small-scale project activity shall be deemed to be a debundled component of a large project activity if there is a registered small-scale CDM project activity or an application to register another small-scale CDM project activity:
(1) With the same project participants; (2) In the same project category and technology/measure; (3) Registered within the previous 2 years; and (4) Whose project boundary is within 1 km of the project boundary of the proposed small-scale
activity at the closest point. There is no other project activity with the same project participants, in the same project category and technology/measure, registered within the previous 2 years and whose project boundary is within 1 km of the project boundary of the proposed small-scale activity at the closest point. Therefore this small scale project activity is not a debundled component of a large project activity.
SECTION B. Application of a baseline methodology:
B.1. Title and reference of the approved baseline methodology applied to the small-scale project
activity:
Simplified methodology “AMS.III-B – Switching fossil fuels”, May 12th, 2006, version 8.
B.2 Project category applicable to the small-scale project activity:
Project category III.B. Category III.B comprises fossil fuel switching in existing industrial, residential, commercial, institutional or electricity generation applications. This project activity is a fossil fuel switch (from fuel oil to natural gas) in an existing industrial facility (cement plant). Fuel switching may change efficiency as well. If the project activity primarily aims at reducing emissions through fuel switching, it falls into this category. If fuel switching is part of a project activity focused primarily on energy efficiency, the project activity falls in category II.D or II.E. This project activity does not aim at energy efficiency and is not part of a project activity focused on energy efficiency. Measures shall both reduce anthropogenic emissions by sources and directly emit less than 15,000 tonnes of carbon dioxide equivalent annually. Project emissions of this project activity are below 15,000 tCO2/year as estimated in Section E. This category is applicable for project activities resulting in annual emission reductions lower than 25,000 ton CO2e. If the emission reduction of a project activity exceeds the reference value of 25,000 ton CO2e in any year of the crediting period, the annual emission reduction for that particular year is capped at 25,000 ton CO2e. The emissions reductions of this project activity are below 25,000 tCO2/year as estimated in Section E.
B.3. Description of how the anthropogenic emissions of GHG by sources are reduced below those
that would have occurred in the absence of the registered small-scale CDM project activity:
CDM-SSC-PDD (version 02)
CDM – Executive Board page 8
Anthropogenic emissions of GHG are reduced below those that would have occurred in the absence of the CDM incentives because the scenario would be the continued use of fuel oil in the existing facility. Additionality is assessed below as indicated in Attachment A to Appendix B of the simplified modalities and procedures for small-scale CDM project activities.
Preliminary screening based on the starting date of the project activity
Project participants wish to have the crediting period starting prior to the registration of the project activity. For this reasons it is provided below:
(a) Evidence that the starting date of the CDM project activity falls between 1 January 2000 and the date of the registration of a first CDM project activity
The implementation of the project activity started on 2002 with the development of basic engineering and contract discussion with natural gas company. Project started operation in May 26th 2004. Adequate evidence is available at the project site.
(b) Evidence that the incentive from the CDM was seriously considered in the decision to proceed
with the project activity.
Votorantim Cimentos is signatory of the Cement Industry Initiative and since the beginning of the Initiative the company started to define strategies in order to meet its agenda. Back in 1999 worldwide cement industry launched the Cement Sustainability Initiative. Among other reasons, the Initiative was launched in response to international concerns about the role of the cement industry in Sustainable Development and Climate Change. The objective of the Initiative was to develop studies and to propose a positive agenda towards the sustainability of the cement industry. In the Climate Change chapter, the agenda proposed some important actions including: innovation in improving the energy efficiency of processes and equipment; switching to lower carbon fuels; using alternative raw materials to reduce limestone use; developing CO2 capture and sequestration techniques; and taking advantage of market mechanisms such as emissions trading to meet the agenda. The implementation of this project activity is one of the efforts towards the reduction of conventional raw material and reduction of greenhouse gases emissions in the manufacturing process. Further information on the Cement Sustainability Initiative can be found in the internet website www.wbcsdcement.org.
Regulations/programs related to the project activity
As stated before, there are no regulations/programs, either in the Federal, State or Municipal levels that constrain the facility from using fuel oil, nor policies that foment the use of natural gas instead of other fossil fuels.
Trends of natural and fuel oil consumption in the region and sector
During the 1990’s, important changes were introduced in the Brazilian energy sector, aiming to diversify Brazilian energy matrix. In the petroleum and gas sector, the Law # 9478/97, known as Petroleum’s Law,
CDM-SSC-PDD (version 02)
CDM – Executive Board page 9
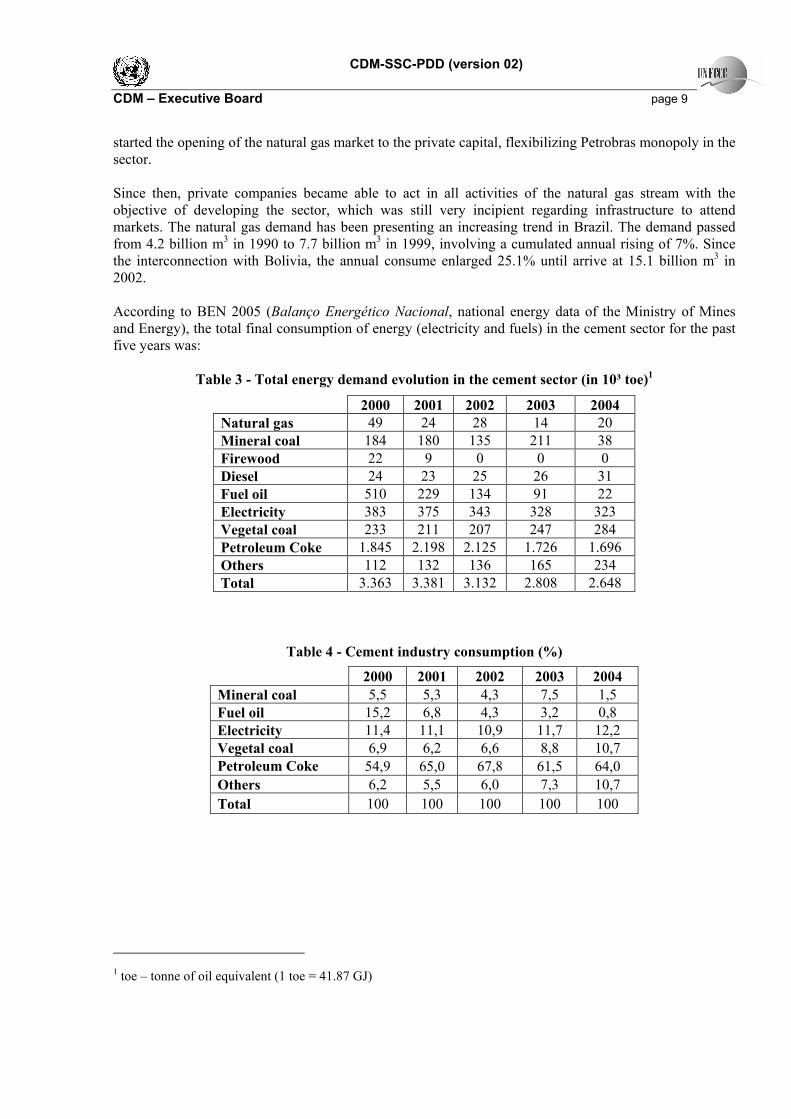
started the opening of the natural gas market to the private capital, flexibilizing Petrobras monopoly in the sector. Since then, private companies became able to act in all activities of the natural gas stream with the objective of developing the sector, which was still very incipient regarding infrastructure to attend markets. The natural gas demand has been presenting an increasing trend in Brazil. The demand passed from 4.2 billion m3 in 1990 to 7.7 billion m3 in 1999, involving a cumulated annual rising of 7%. Since the interconnection with Bolivia, the annual consume enlarged 25.1% until arrive at 15.1 billion m3 in 2002. According to BEN 2005 (Balanço Energético Nacional, national energy data of the Ministry of Mines and Energy), the total final consumption of energy (electricity and fuels) in the cement sector for the past five years was:
Table 3 - Total energy demand evolution in the cement sector (in 10³ toe)1
2000 2001 2002 2003 2004
Natural gas 49 24 28 14 20
Mineral coal 184 180 135 211 38
Firewood 22 9 0 0 0
Diesel 24 23 25 26 31
Fuel oil 510 229 134 91 22
Electricity 383 375 343 328 323
Vegetal coal 233 211 207 247 284
Petroleum Coke 1.845 2.198 2.125 1.726 1.696
Others 112 132 136 165 234
Total 3.363 3.381 3.132 2.808 2.648
Table 4 - Cement industry consumption (%)
2000 2001 2002 2003 2004
Mineral coal 5,5 5,3 4,3 7,5 1,5
Fuel oil 15,2 6,8 4,3 3,2 0,8
Electricity 11,4 11,1 10,9 11,7 12,2
Vegetal coal 6,9 6,2 6,6 8,8 10,7
Petroleum Coke 54,9 65,0 67,8 61,5 64,0
Others 6,2 5,5 6,0 7,3 10,7
Total 100 100 100 100 100
1 toe – tonne of oil equivalent (1 toe = 41.87 GJ)
CDM-SSC-PDD (version 02)
CDM – Executive Board page 10
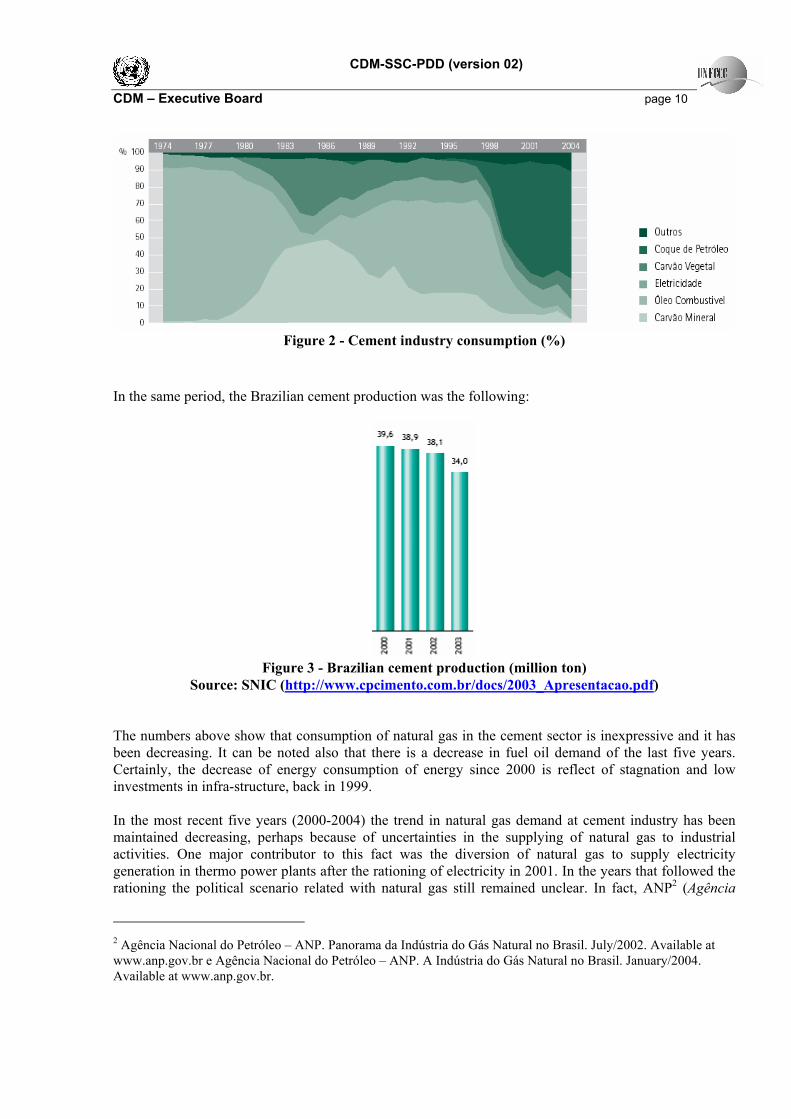
Figure 2 - Cement industry consumption (%)
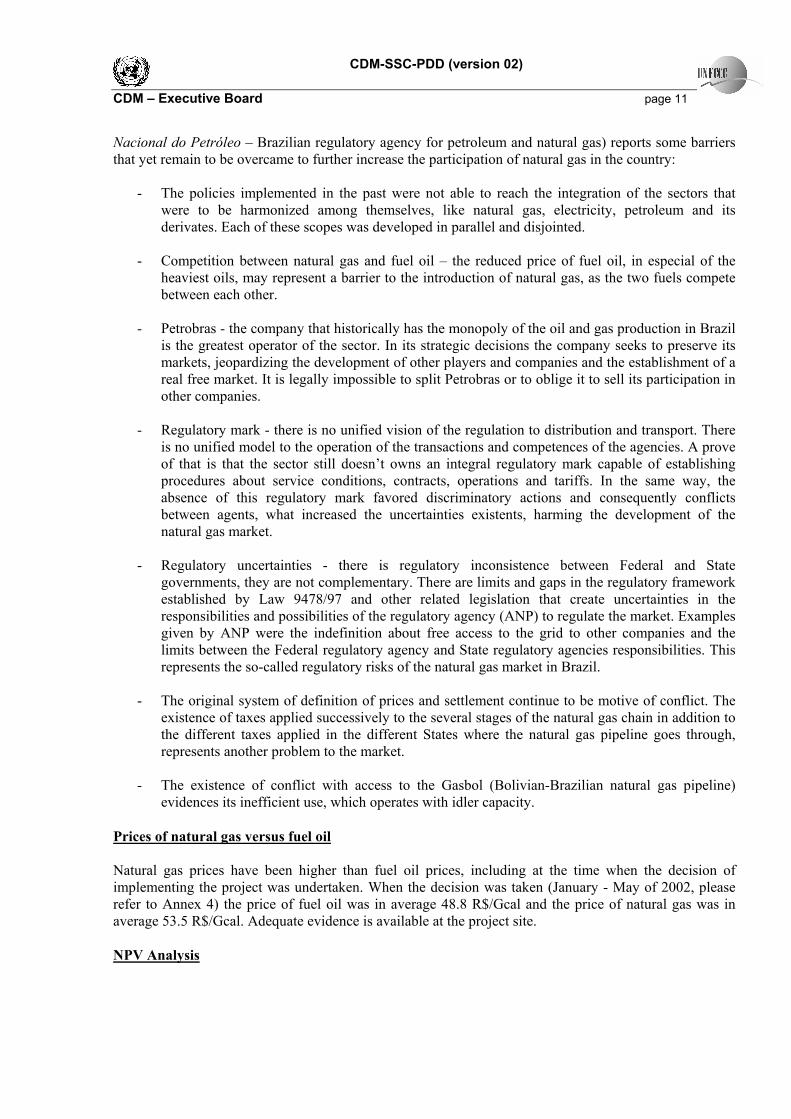
In the same period, the Brazilian cement production was the following:
Figure 3 - Brazilian cement production (million ton)
Source: SNIC (http://www.cpcimento.com.br/docs/2003_Apresentacao.pdf)
The numbers above show that consumption of natural gas in the cement sector is inexpressive and it has been decreasing. It can be noted also that there is a decrease in fuel oil demand of the last five years. Certainly, the decrease of energy consumption of energy since 2000 is reflect of stagnation and low investments in infra-structure, back in 1999. In the most recent five years (2000-2004) the trend in natural gas demand at cement industry has been maintained decreasing, perhaps because of uncertainties in the supplying of natural gas to industrial activities. One major contributor to this fact was the diversion of natural gas to supply electricity generation in thermo power plants after the rationing of electricity in 2001. In the years that followed the rationing the political scenario related with natural gas still remained unclear. In fact, ANP2 (Agência
2 Agência Nacional do Petróleo – ANP. Panorama da Indústria do Gás Natural no Brasil. July/2002. Available at
www.anp.gov.br e Agência Nacional do Petróleo – ANP. A Indústria do Gás Natural no Brasil. January/2004.
Available at www.anp.gov.br.
CDM-SSC-PDD (version 02)
CDM – Executive Board page 11
Nacional do Petróleo – Brazilian regulatory agency for petroleum and natural gas) reports some barriers that yet remain to be overcame to further increase the participation of natural gas in the country:
- The policies implemented in the past were not able to reach the integration of the sectors that were to be harmonized among themselves, like natural gas, electricity, petroleum and its derivates. Each of these scopes was developed in parallel and disjointed.
- Competition between natural gas and fuel oil – the reduced price of fuel oil, in especial of the
heaviest oils, may represent a barrier to the introduction of natural gas, as the two fuels compete between each other.
- Petrobras - the company that historically has the monopoly of the oil and gas production in Brazil
is the greatest operator of the sector. In its strategic decisions the company seeks to preserve its markets, jeopardizing the development of other players and companies and the establishment of a real free market. It is legally impossible to split Petrobras or to oblige it to sell its participation in other companies.
- Regulatory mark - there is no unified vision of the regulation to distribution and transport. There
is no unified model to the operation of the transactions and competences of the agencies. A prove of that is that the sector still doesn’t owns an integral regulatory mark capable of establishing procedures about service conditions, contracts, operations and tariffs. In the same way, the absence of this regulatory mark favored discriminatory actions and consequently conflicts between agents, what increased the uncertainties existents, harming the development of the natural gas market.
- Regulatory uncertainties - there is regulatory inconsistence between Federal and State
governments, they are not complementary. There are limits and gaps in the regulatory framework established by Law 9478/97 and other related legislation that create uncertainties in the responsibilities and possibilities of the regulatory agency (ANP) to regulate the market. Examples given by ANP were the indefinition about free access to the grid to other companies and the limits between the Federal regulatory agency and State regulatory agencies responsibilities. This represents the so-called regulatory risks of the natural gas market in Brazil.
- The original system of definition of prices and settlement continue to be motive of conflict. The
existence of taxes applied successively to the several stages of the natural gas chain in addition to the different taxes applied in the different States where the natural gas pipeline goes through, represents another problem to the market.
- The existence of conflict with access to the Gasbol (Bolivian-Brazilian natural gas pipeline)
evidences its inefficient use, which operates with idler capacity.
Prices of natural gas versus fuel oil
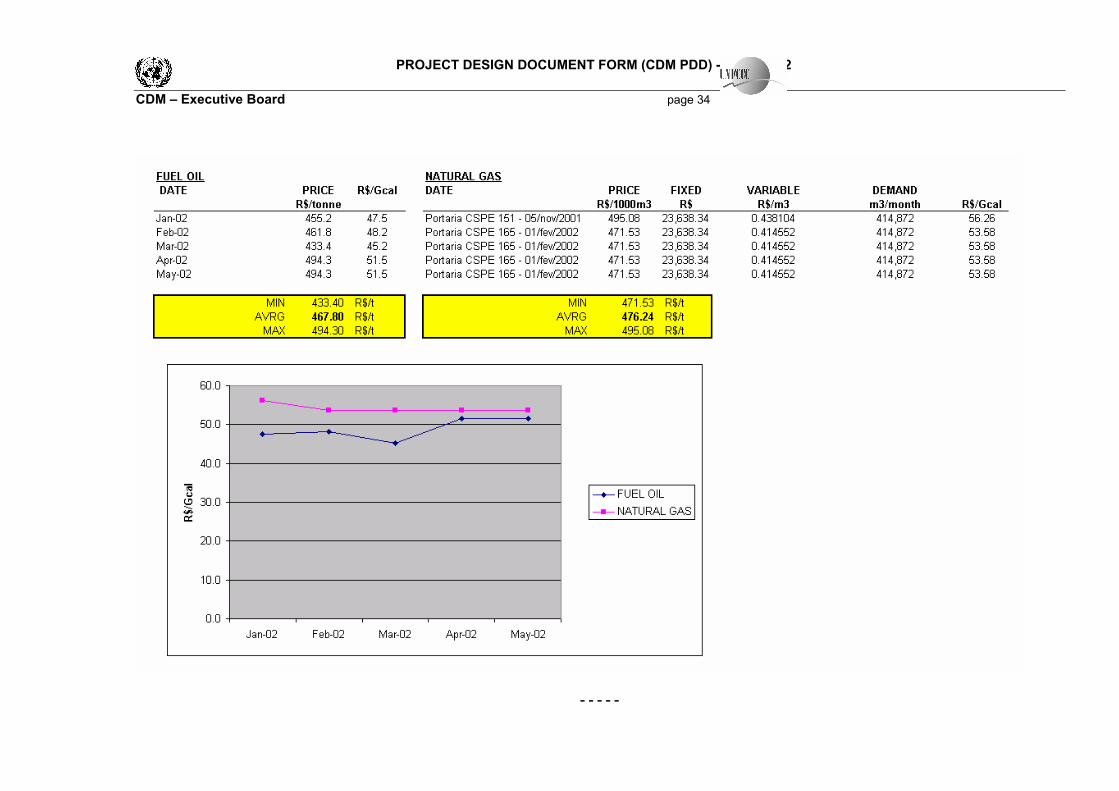
Natural gas prices have been higher than fuel oil prices, including at the time when the decision of implementing the project was undertaken. When the decision was taken (January - May of 2002, please refer to Annex 4) the price of fuel oil was in average 48.8 R$/Gcal and the price of natural gas was in average 53.5 R$/Gcal. Adequate evidence is available at the project site.
NPV Analysis
CDM-SSC-PDD (version 02)
CDM – Executive Board page 12
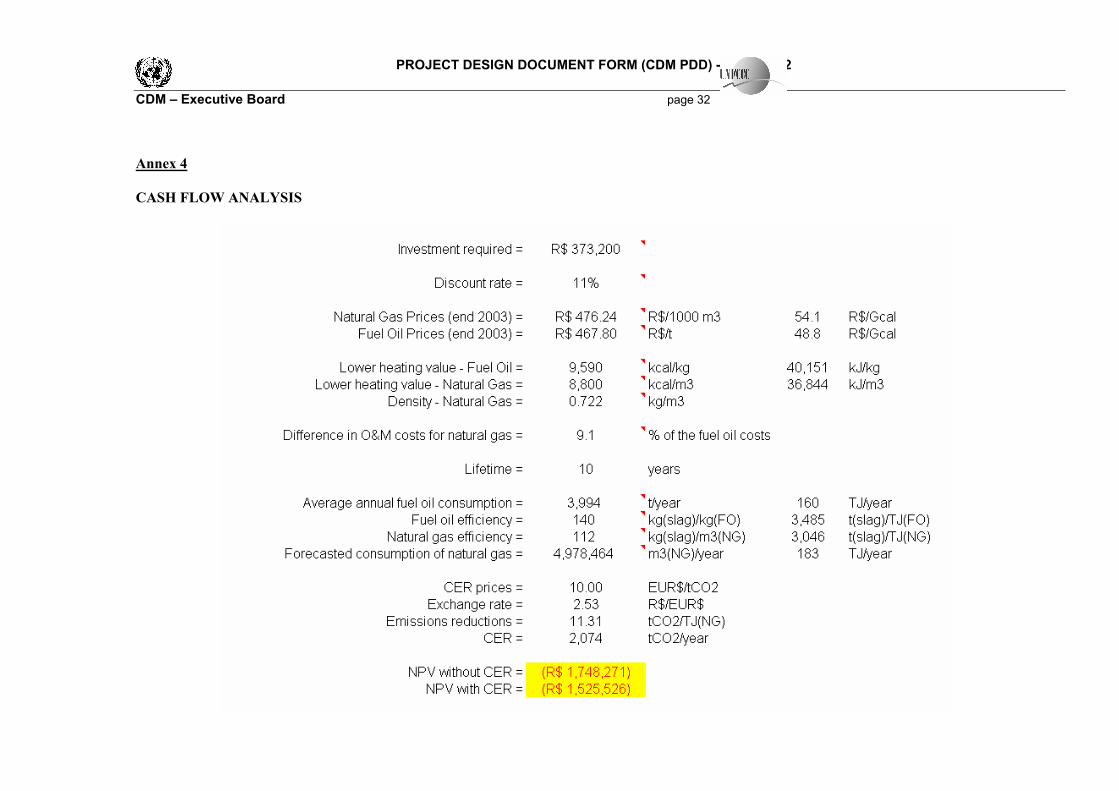
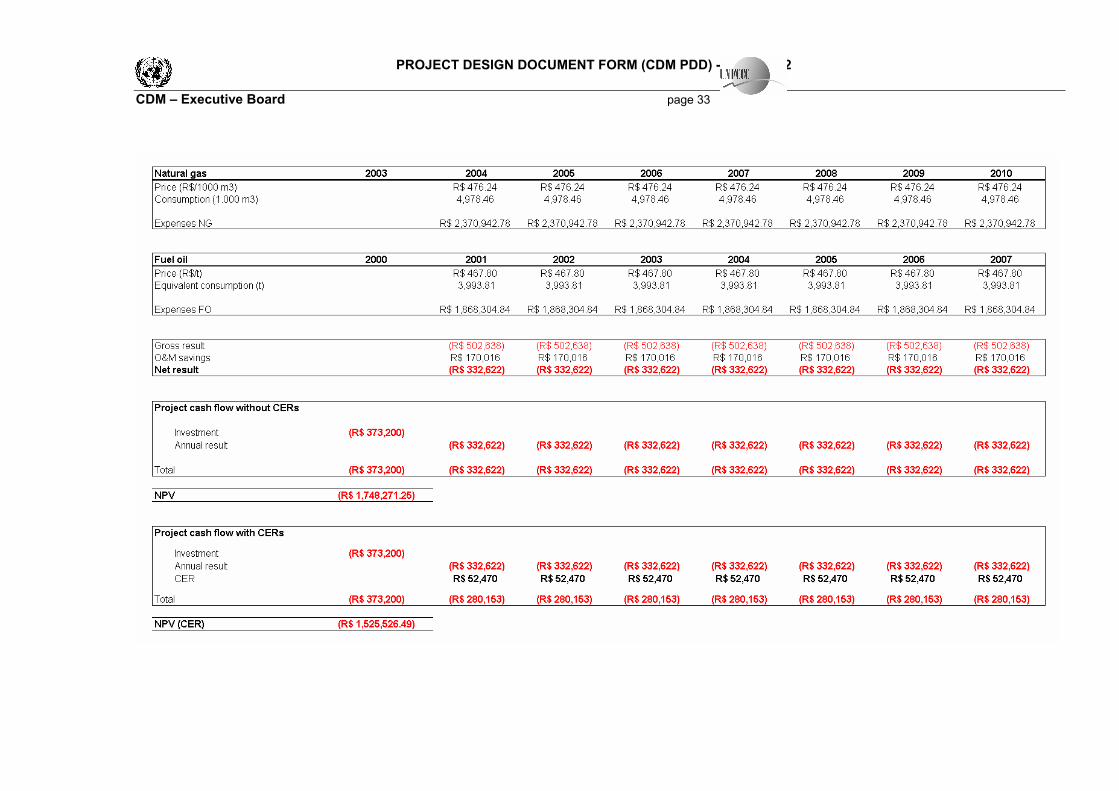
The methodology requires that an economic investment analysis, using the net present value (NPV) of the project, is conducted. The detailed information about the cash flow analysis and NPV calculation is
included in Annex 4. The result is NPV = –R$ 1,748,271. Then, as the NPV of the project activity without CERs is negative, project is additional.
B.4. Description of how the definition of the project boundary related to the baseline methodology
selected is applied to the small-scale project activity:
The project boundary is the physical, geographical site where the fuel combustion affected by the fuel-switching measure occurs.
Project boundary encompasses the cement dryer of the Votorantim Cimentos Cubatão facility.
B.5. Details of the baseline and its development:
Date of baseline completion: 27/12/2005. Contact information: Ecoinvest Carbon Rua Padre João Manoel 222 São Paulo – SP Cep 01411-000 Brasil Mr. Rodrigo Marcelo Leme Phone: (+55 11) 3063-9068 Fax: (+55 11) 3063-9069
SECTION C. Duration of the project activity / Crediting period:
C.1. Duration of the small-scale project activity:
C.1.1. Starting date of the small-scale project activity:
Starting date of the project activity (project design): 01/07/2002.
C.1.2. Expected operational lifetime of the small-scale project activity:
Expected operational lifetime of the project activity 30 years.
C.2. Choice of crediting period and related information:
C.2.1. Renewable crediting period:
C.2.1.1. Starting date of the first crediting period:
CDM-SSC-PDD (version 02)
CDM – Executive Board page 13
Starting date of the crediting period: 26/05/2004.
C.2.1.2. Length of the first crediting period:
The length of the crediting period is 7 years.
C.2.2. Fixed crediting period:
C.2.2.1. Starting date:
Not applicable.
C.2.2.2. Length:
Not applicable.
SECTION D. Application of a monitoring methodology and plan:
D.1. Name and reference of approved monitoring methodology applied to the small-scale project
activity:
Simplified methodology “AMS.III-B – Switching fossil fuels”, May 12th, 2006, version 8.
D.2. Justification of the choice of the methodology and why it is applicable to the small-scale
project activity:
Please, refer to Section B.2.
CDM-SSC-PDD (version 02)
CDM – Executive Board page 14
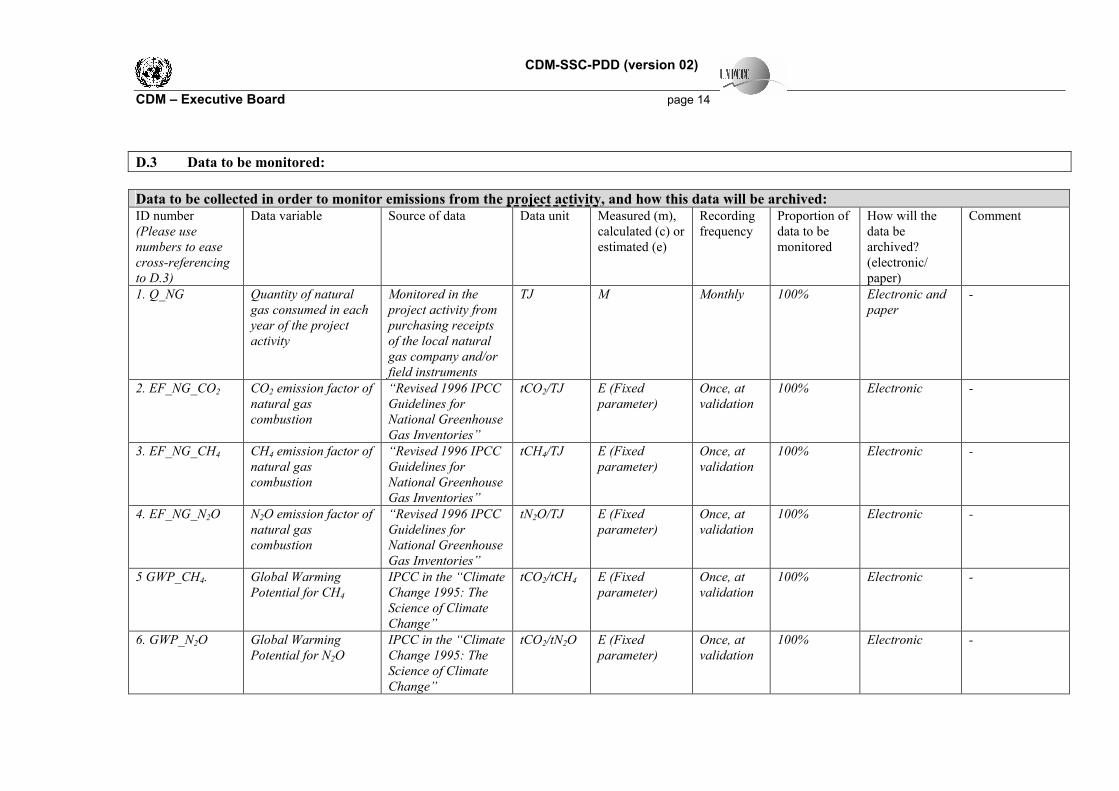
D.3 Data to be monitored:
Data to be collected in order to monitor emissions from the project activity, and how this data will be archived: ID number
(Please use
numbers to ease
cross-referencing
to D.3)
Data variable Source of data Data unit
Measured (m),
calculated (c) or
estimated (e)
Recording
frequency
Proportion of
data to be
monitored
How will the
data be
archived?
(electronic/
paper)
Comment
1. Q_NG Quantity of natural
gas consumed in each
year of the project
activity
Monitored in the
project activity from
purchasing receipts
of the local natural
gas company and/or
field instruments
TJ M Monthly 100% Electronic and
paper
-
2. EF_NG_CO2 CO2 emission factor of
natural gas
combustion
“Revised 1996 IPCC
Guidelines for
National Greenhouse
Gas Inventories”
tCO2/TJ E (Fixed
parameter)
Once, at
validation
100% Electronic -
3. EF_NG_CH4 CH4 emission factor of
natural gas
combustion
“Revised 1996 IPCC
Guidelines for
National Greenhouse
Gas Inventories”
tCH4/TJ E (Fixed
parameter)
Once, at
validation
100% Electronic -
4. EF_NG_N2O N2O emission factor of
natural gas
combustion
“Revised 1996 IPCC
Guidelines for
National Greenhouse
Gas Inventories”
tN2O/TJ E (Fixed
parameter)
Once, at
validation
100% Electronic -
5 GWP_CH4. Global Warming
Potential for CH4
IPCC in the “Climate
Change 1995: The
Science of Climate
Change”
tCO2/tCH4 E (Fixed
parameter)
Once, at
validation
100% Electronic -
6. GWP_N2O Global Warming
Potential for N2O
IPCC in the “Climate
Change 1995: The
Science of Climate
Change”
tCO2/tN2O E (Fixed
parameter)
Once, at
validation
100% Electronic -
CDM-SSC-PDD (version 02)
CDM – Executive Board page 15
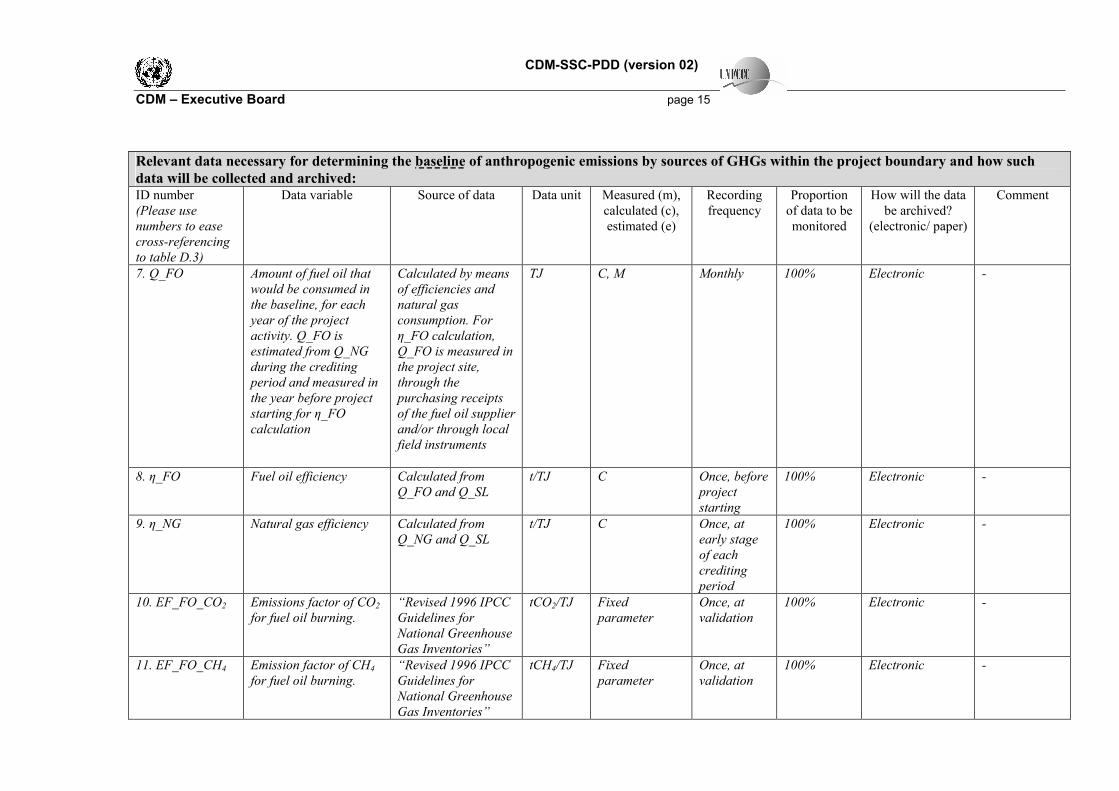
Relevant data necessary for determining the baseline of anthropogenic emissions by sources of GHGs within the project boundary and how such
data will be collected and archived: ID number
(Please use
numbers to ease
cross-referencing
to table D.3)
Data variable Source of data Data unit Measured (m),
calculated (c),
estimated (e)
Recording
frequency
Proportion
of data to be
monitored
How will the data
be archived?
(electronic/ paper)
Comment
7. Q_FO Amount of fuel oil that
would be consumed in
the baseline, for each
year of the project
activity. Q_FO is
estimated from Q_NG
during the crediting
period and measured in
the year before project
starting for η_FO
calculation
Calculated by means
of efficiencies and
natural gas
consumption. For
η_FO calculation,
Q_FO is measured in
the project site,
through the
purchasing receipts
of the fuel oil supplier
and/or through local
field instruments
TJ C, M Monthly 100% Electronic -
8. η_FO Fuel oil efficiency Calculated from
Q_FO and Q_SL
t/TJ C Once, before
project
starting
100% Electronic -
9. η_NG Natural gas efficiency Calculated from
Q_NG and Q_SL
t/TJ C Once, at
early stage
of each
crediting
period
100% Electronic -
10. EF_FO_CO2 Emissions factor of CO2
for fuel oil burning.
“Revised 1996 IPCC
Guidelines for
National Greenhouse
Gas Inventories”
tCO2/TJ Fixed
parameter
Once, at
validation
100% Electronic -
11. EF_FO_CH4 Emission factor of CH4
for fuel oil burning.
“Revised 1996 IPCC
Guidelines for
National Greenhouse
Gas Inventories”
tCH4/TJ Fixed
parameter
Once, at
validation
100% Electronic -
CDM-SSC-PDD (version 02)
CDM – Executive Board page 16
12. EF_FO_N2O Emission factor of N2O
for fuel oil burning.
“Revised 1996 IPCC
Guidelines for
National Greenhouse
Gas Inventories”
tN2O/TJ Fixed
parameter
Once, at
validation
100% Electronic -
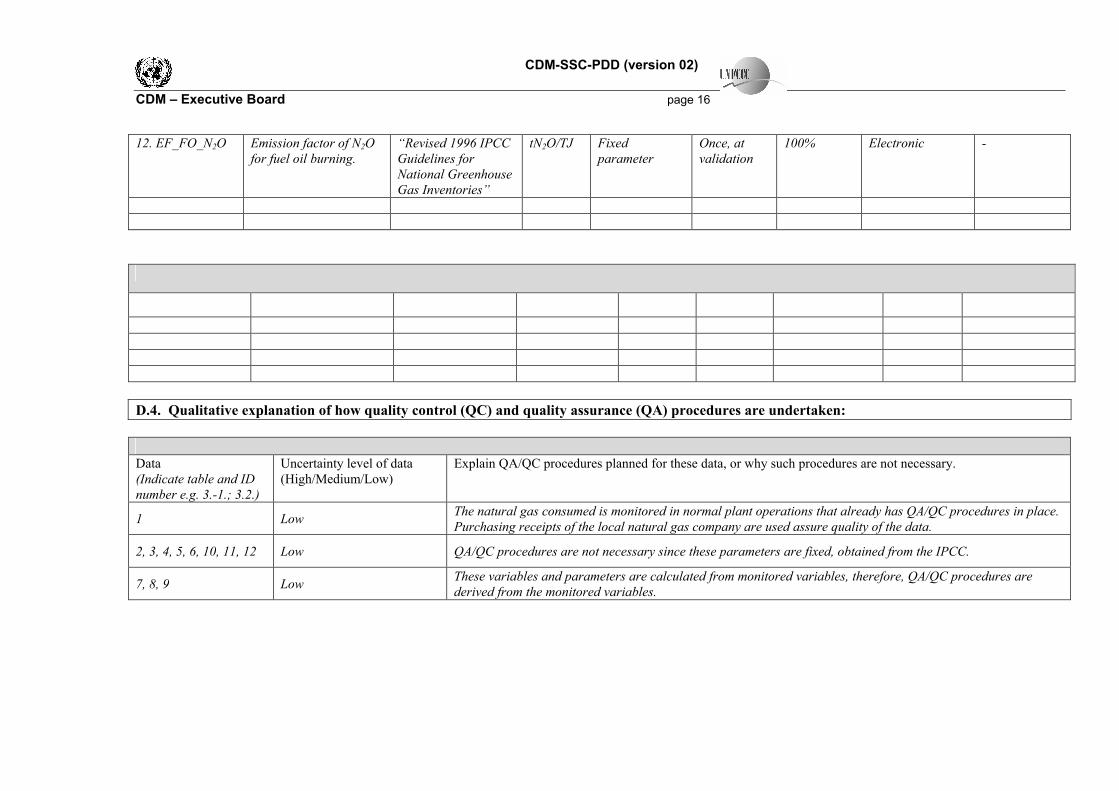
D.4. Qualitative explanation of how quality control (QC) and quality assurance (QA) procedures are undertaken:
Data
(Indicate table and ID
number e.g. 3.-1.; 3.2.)
Uncertainty level of data
(High/Medium/Low)
Explain QA/QC procedures planned for these data, or why such procedures are not necessary.
1 Low The natural gas consumed is monitored in normal plant operations that already has QA/QC procedures in place.
Purchasing receipts of the local natural gas company are used assure quality of the data.
2, 3, 4, 5, 6, 10, 11, 12 Low QA/QC procedures are not necessary since these parameters are fixed, obtained from the IPCC.
7, 8, 9 Low These variables and parameters are calculated from monitored variables, therefore, QA/QC procedures are
derived from the monitored variables.
CDM-SSC-PDD (version 02)
CDM – Executive Board page 17
D.5. Please describe briefly the operational and management structure that the project
participant(s) will implement in order to monitor emission reductions and any leakage effects
generated by the project activity:
The monitoring methodology, according “AMS.III-B – Switching fossil fuels”, May 12th, 2006, version 8, involves: (a) Monitoring of the fuel use and output for an appropriate period (e.g., a few years, but records of fuel use may be used) prior to the fuel switch being implemented - e.g. coal use and heat output by a district heating plant, liquid fuel oil use and electricity generated by a generating unit (records of fuel used and output can be used in lieu of actual monitoring); (b) Monitoring fuel use and output after the fuel switch has been implemented - e.g. gas use and heat output by a district heating plant, gas use and electricity generated by a generating unit. Project operator and manager is Votorantim Cimentos. Votorantim Cimentos has, due to company policies and engineering best practices, a complete set of maintenance and operations procedures, which include the monitoring of process variables, instruments calibration and quality control. For this reason, no major changes in monitoring and QA/QC procedures will be required for the CDM project activity related variables and parameters. The detailed monitoring plan is presented in Annex 3.
D.6. Name of person/entity determining the monitoring methodology:
Contact information: Ecoinvest Carbon Rua Padre João Manoel 222 São Paulo – SP Cep 01411-000 Brasil Phone: (+55 11) 3063-9068 Fax: (+55 11) 3063-9069
SECTION E.: Estimation of GHG emissions by sources:
E.1. Formulae used:
E.1.1 Selected formulae as provided in appendix B:
Not applicable.
E.1.2 Description of formulae when not provided in appendix B:
E.1.2.1 Describe the formulae used to estimate anthropogenic emissions by sources of GHGs due to
the project activity within the project boundary:
CDM-SSC-PDD (version 02)
CDM – Executive Board page 18
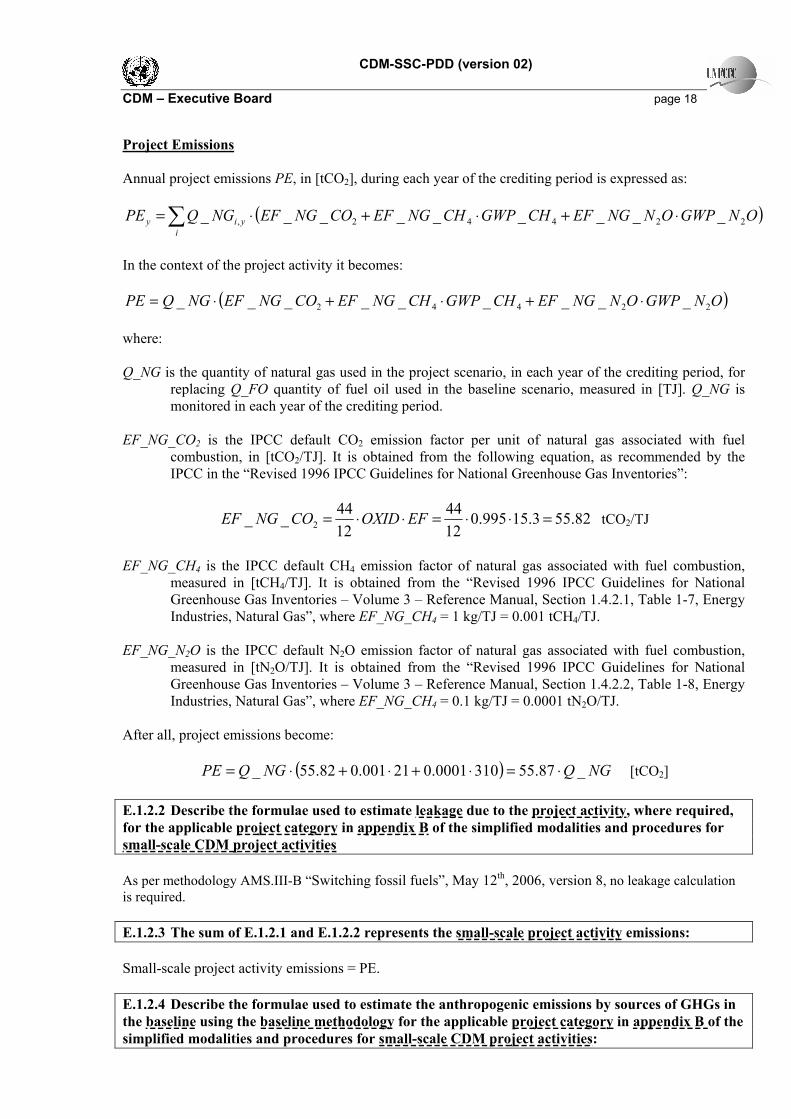
Project Emissions
Annual project emissions PE, in [tCO2], during each year of the crediting period is expressed as:
( )∑ ⋅+⋅+⋅=i
yiy ONGWPONNGEFCHGWPCHNGEFCONGEFNGQPE 22442, _________
In the context of the project activity it becomes:
( )ONGWPONNGEFCHGWPCHNGEFCONGEFNGQPE 22442 _________ ⋅+⋅+⋅=
where:
Q_NG is the quantity of natural gas used in the project scenario, in each year of the crediting period, for replacing Q_FO quantity of fuel oil used in the baseline scenario, measured in [TJ]. Q_NG is monitored in each year of the crediting period.
EF_NG_CO2 is the IPCC default CO2 emission factor per unit of natural gas associated with fuel
combustion, in [tCO2/TJ]. It is obtained from the following equation, as recommended by the IPCC in the “Revised 1996 IPCC Guidelines for National Greenhouse Gas Inventories”:
82.553.15995.012
44
12
44__ 2 =⋅⋅=⋅⋅= EFOXIDCONGEF tCO2/TJ
EF_NG_CH4 is the IPCC default CH4 emission factor of natural gas associated with fuel combustion,
measured in [tCH4/TJ]. It is obtained from the “Revised 1996 IPCC Guidelines for National Greenhouse Gas Inventories – Volume 3 – Reference Manual, Section 1.4.2.1, Table 1-7, Energy Industries, Natural Gas”, where EF_NG_CH4 = 1 kg/TJ = 0.001 tCH4/TJ.
EF_NG_N2O is the IPCC default N2O emission factor of natural gas associated with fuel combustion,
measured in [tN2O/TJ]. It is obtained from the “Revised 1996 IPCC Guidelines for National Greenhouse Gas Inventories – Volume 3 – Reference Manual, Section 1.4.2.2, Table 1-8, Energy Industries, Natural Gas”, where EF_NG_CH4 = 0.1 kg/TJ = 0.0001 tN2O/TJ.
After all, project emissions become:
( ) NGQNGQPE _87.553100001.021001.082.55_ ⋅=⋅+⋅+⋅= [tCO2]
E.1.2.2 Describe the formulae used to estimate leakage due to the project activity, where required,
for the applicable project category in appendix B of the simplified modalities and procedures for
small-scale CDM project activities
As per methodology AMS.III-B “Switching fossil fuels”, May 12th, 2006, version 8, no leakage calculation is required.
E.1.2.3 The sum of E.1.2.1 and E.1.2.2 represents the small-scale project activity emissions:
Small-scale project activity emissions = PE.
E.1.2.4 Describe the formulae used to estimate the anthropogenic emissions by sources of GHGs in
the baseline using the baseline methodology for the applicable project category in appendix B of the
simplified modalities and procedures for small-scale CDM project activities:
CDM-SSC-PDD (version 02)
CDM – Executive Board page 19
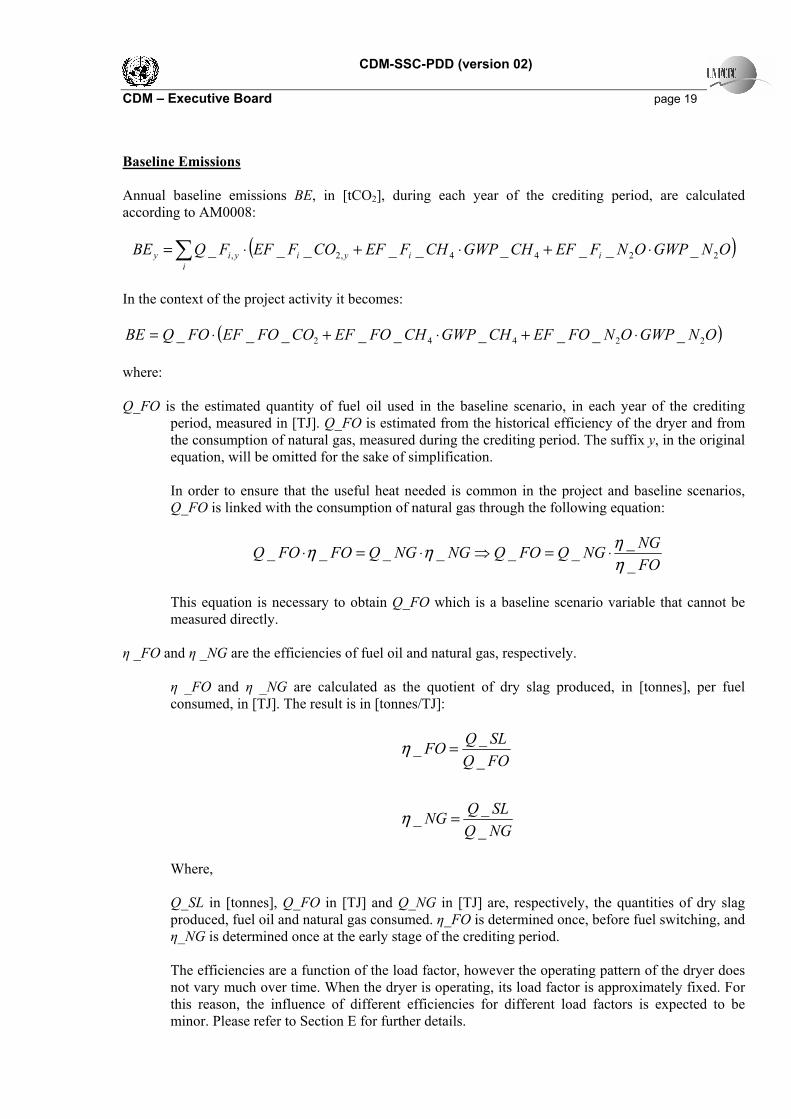
Baseline Emissions
Annual baseline emissions BE, in [tCO2], during each year of the crediting period, are calculated according to AM0008:
( )∑ ⋅+⋅+⋅=i
iiyiyiy ONGWPONFEFCHGWPCHFEFCOFEFFQBE 2244,2, _________
In the context of the project activity it becomes:
( )ONGWPONFOEFCHGWPCHFOEFCOFOEFFOQBE 22442 _________ ⋅+⋅+⋅=
where: Q_FO is the estimated quantity of fuel oil used in the baseline scenario, in each year of the crediting
period, measured in [TJ]. Q_FO is estimated from the historical efficiency of the dryer and from the consumption of natural gas, measured during the crediting period. The suffix y, in the original equation, will be omitted for the sake of simplification. In order to ensure that the useful heat needed is common in the project and baseline scenarios, Q_FO is linked with the consumption of natural gas through the following equation:
FO
NGNGQFOQNGNGQFOFOQ
_
_______
η
ηηη ⋅=⇒⋅=⋅
This equation is necessary to obtain Q_FO which is a baseline scenario variable that cannot be measured directly.
η _FO and η _NG are the efficiencies of fuel oil and natural gas, respectively. η _FO and η _NG are calculated as the quotient of dry slag produced, in [tonnes], per fuel consumed, in [TJ]. The result is in [tonnes/TJ]:
NGQ
SLQNG
FOQ
SLQFO
_
__
_
__
=
=
η
η
Where,
Q_SL in [tonnes], Q_FO in [TJ] and Q_NG in [TJ] are, respectively, the quantities of dry slag produced, fuel oil and natural gas consumed. η_FO is determined once, before fuel switching, and η_NG is determined once at the early stage of the crediting period. The efficiencies are a function of the load factor, however the operating pattern of the dryer does not vary much over time. When the dryer is operating, its load factor is approximately fixed. For this reason, the influence of different efficiencies for different load factors is expected to be minor. Please refer to Section E for further details.
CDM-SSC-PDD (version 02)
CDM – Executive Board page 20
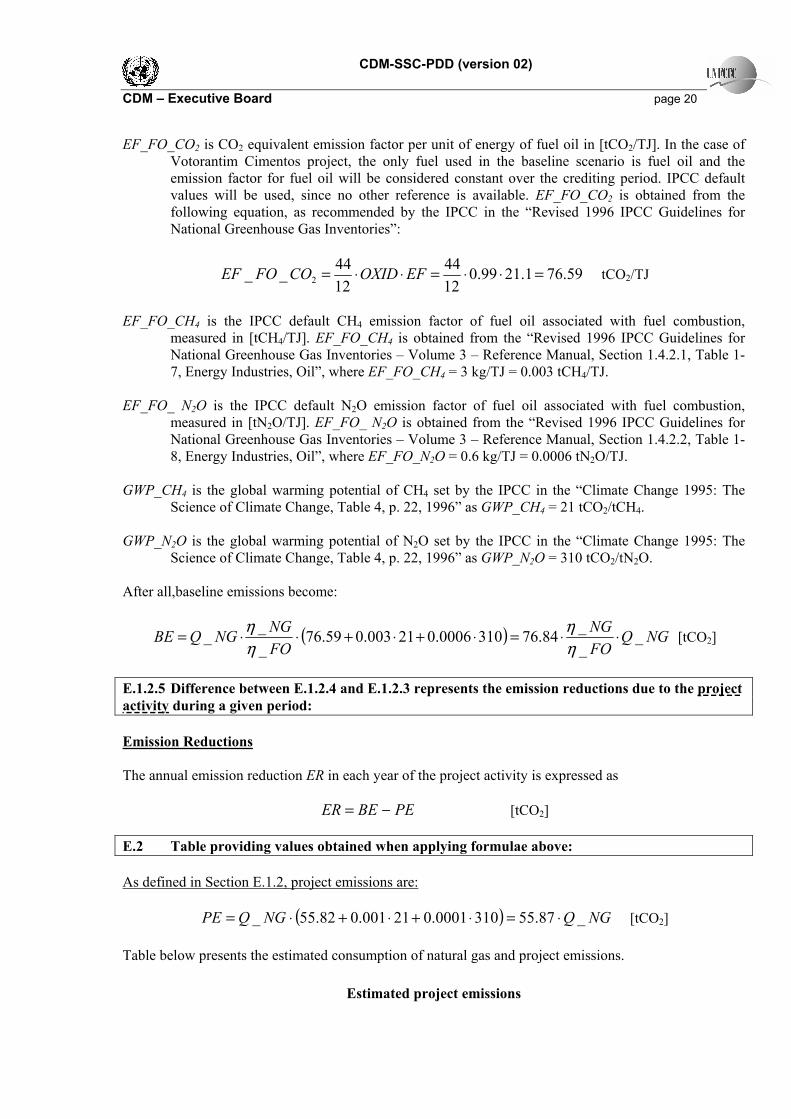
EF_FO_CO2 is CO2 equivalent emission factor per unit of energy of fuel oil in [tCO2/TJ]. In the case of Votorantim Cimentos project, the only fuel used in the baseline scenario is fuel oil and the emission factor for fuel oil will be considered constant over the crediting period. IPCC default values will be used, since no other reference is available. EF_FO_CO2 is obtained from the following equation, as recommended by the IPCC in the “Revised 1996 IPCC Guidelines for National Greenhouse Gas Inventories”:
59.761.2199.012
44
12
44__ 2 =⋅⋅=⋅⋅= EFOXIDCOFOEF tCO2/TJ
EF_FO_CH4 is the IPCC default CH4 emission factor of fuel oil associated with fuel combustion,
measured in [tCH4/TJ]. EF_FO_CH4 is obtained from the “Revised 1996 IPCC Guidelines for National Greenhouse Gas Inventories – Volume 3 – Reference Manual, Section 1.4.2.1, Table 1-7, Energy Industries, Oil”, where EF_FO_CH4 = 3 kg/TJ = 0.003 tCH4/TJ.
EF_FO_ N2O is the IPCC default N2O emission factor of fuel oil associated with fuel combustion,
measured in [tN2O/TJ]. EF_FO_ N2O is obtained from the “Revised 1996 IPCC Guidelines for National Greenhouse Gas Inventories – Volume 3 – Reference Manual, Section 1.4.2.2, Table 1-8, Energy Industries, Oil”, where EF_FO_N2O = 0.6 kg/TJ = 0.0006 tN2O/TJ.
GWP_CH4 is the global warming potential of CH4 set by the IPCC in the “Climate Change 1995: The
Science of Climate Change, Table 4, p. 22, 1996” as GWP_CH4 = 21 tCO2/tCH4. GWP_N2O is the global warming potential of N2O set by the IPCC in the “Climate Change 1995: The
Science of Climate Change, Table 4, p. 22, 1996” as GWP_N2O = 310 tCO2/tN2O. After all,baseline emissions become:
( ) NGQFO
NG
FO
NGNGQBE _
_
_84.763100006.021003.059.76
_
__ ⋅⋅=⋅+⋅+⋅⋅=
η
η
η
η [tCO2]
E.1.2.5 Difference between E.1.2.4 and E.1.2.3 represents the emission reductions due to the project
activity during a given period:
Emission Reductions
The annual emission reduction ER in each year of the project activity is expressed as
PEBEER −= [tCO2]
E.2 Table providing values obtained when applying formulae above:
As defined in Section E.1.2, project emissions are:
( ) NGQNGQPE _87.553100001.021001.082.55_ ⋅=⋅+⋅+⋅= [tCO2]
Table below presents the estimated consumption of natural gas and project emissions.
Estimated project emissions
CDM-SSC-PDD (version 02)
CDM – Executive Board page 21
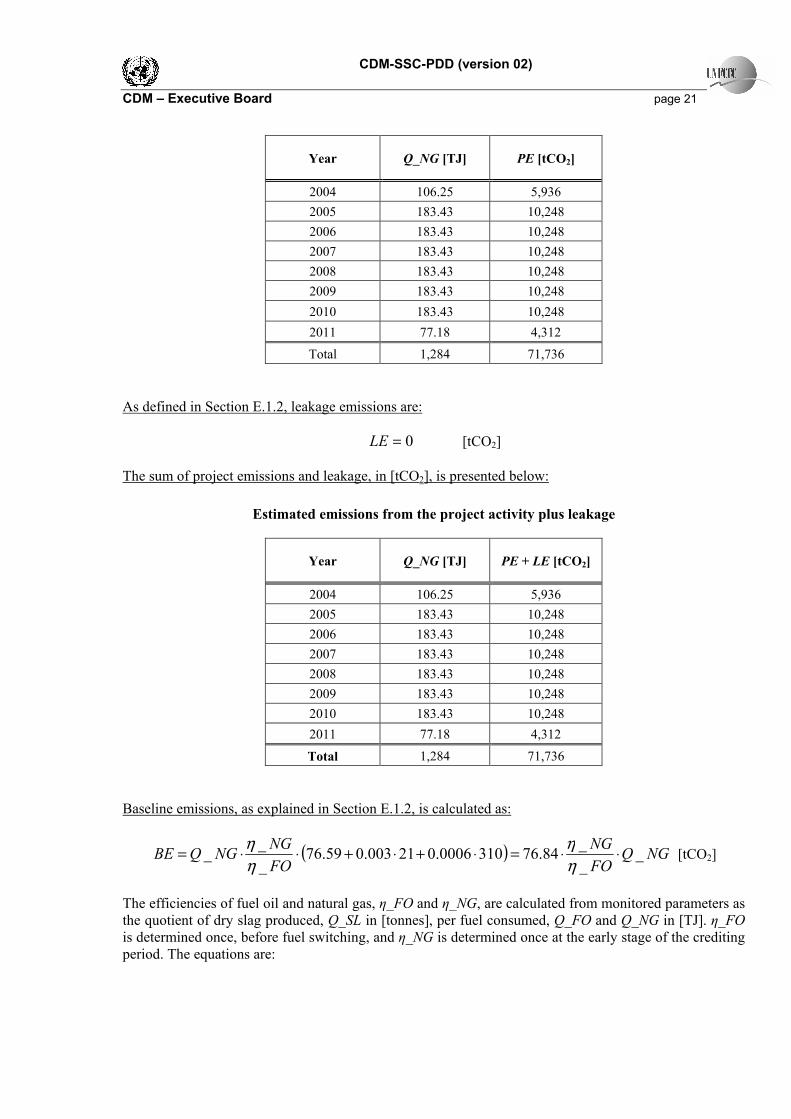
Year Q_NG [TJ] PE [tCO2]
2004 106.25 5,936
2005 183.43 10,248
2006 183.43 10,248
2007 183.43 10,248
2008 183.43 10,248
2009 183.43 10,248
2010 183.43 10,248
2011 77.18 4,312
Total 1,284 71,736
As defined in Section E.1.2, leakage emissions are:
0=LE [tCO2]
The sum of project emissions and leakage, in [tCO2], is presented below:
Estimated emissions from the project activity plus leakage
Year Q_NG [TJ] PE + LE [tCO2]
2004 106.25 5,936
2005 183.43 10,248
2006 183.43 10,248
2007 183.43 10,248
2008 183.43 10,248
2009 183.43 10,248
2010 183.43 10,248
2011 77.18 4,312
Total 1,284 71,736
Baseline emissions, as explained in Section E.1.2, is calculated as:
( ) NGQFO
NG
FO
NGNGQBE _
_
_84.763100006.021003.059.76
_
__ ⋅⋅=⋅+⋅+⋅⋅=
η
η
η
η [tCO2]
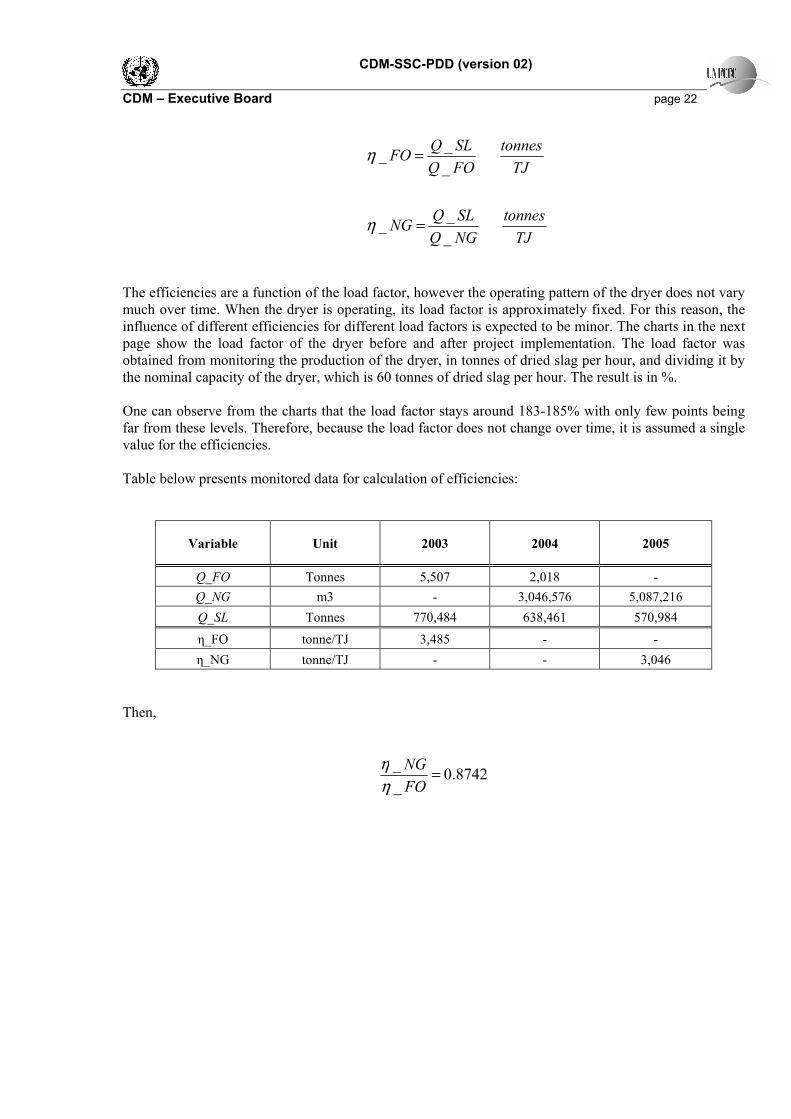
The efficiencies of fuel oil and natural gas, η_FO and η_NG, are calculated from monitored parameters as the quotient of dry slag produced, Q_SL in [tonnes], per fuel consumed, Q_FO and Q_NG in [TJ]. η_FO is determined once, before fuel switching, and η_NG is determined once at the early stage of the crediting period. The equations are:
CDM-SSC-PDD (version 02)
CDM – Executive Board page 22
TJ
tonnes
NGQ
SLQNG
TJ
tonnes
FOQ
SLQFO
_
__
_
__
=
=
η
η
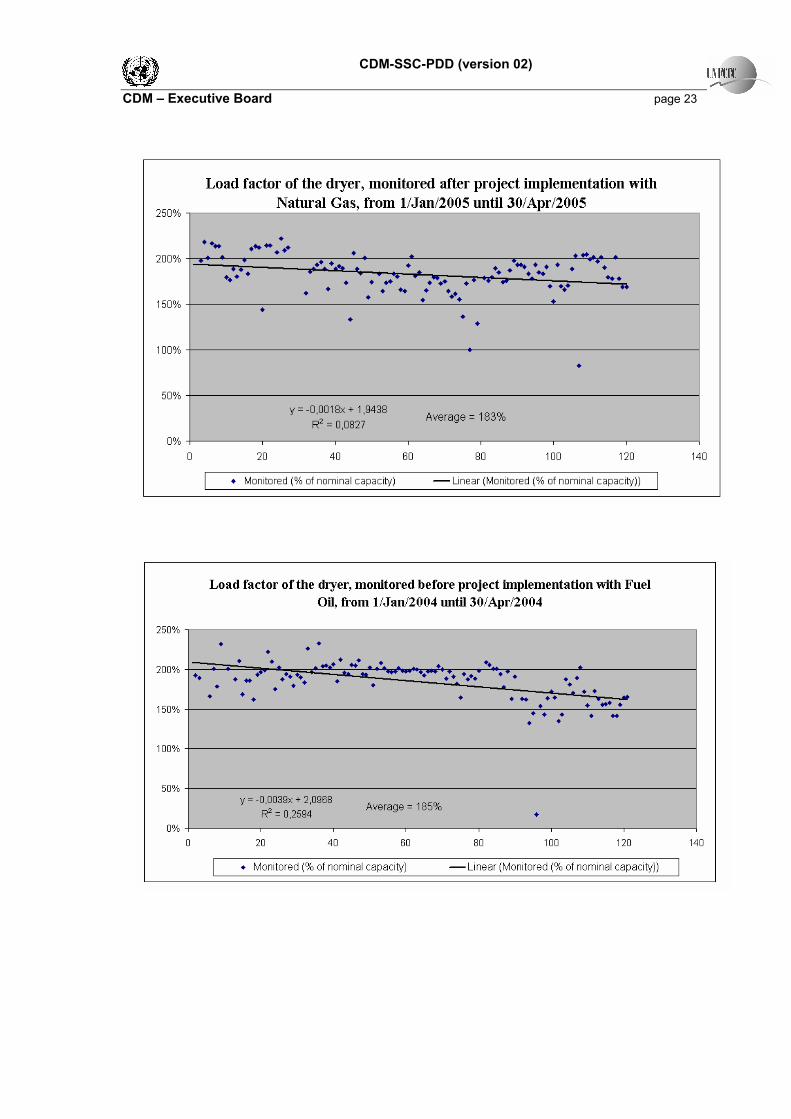
The efficiencies are a function of the load factor, however the operating pattern of the dryer does not vary much over time. When the dryer is operating, its load factor is approximately fixed. For this reason, the influence of different efficiencies for different load factors is expected to be minor. The charts in the next page show the load factor of the dryer before and after project implementation. The load factor was obtained from monitoring the production of the dryer, in tonnes of dried slag per hour, and dividing it by the nominal capacity of the dryer, which is 60 tonnes of dried slag per hour. The result is in %. One can observe from the charts that the load factor stays around 183-185% with only few points being far from these levels. Therefore, because the load factor does not change over time, it is assumed a single value for the efficiencies. Table below presents monitored data for calculation of efficiencies:
Variable Unit 2003 2004 2005
Q_FO Tonnes 5,507 2,018 -
Q_NG m3 - 3,046,576 5,087,216
Q_SL Tonnes 770,484 638,461 570,984
η_FO tonne/TJ 3,485 - -
η_NG tonne/TJ - - 3,046
Then,
8742.0_
_=
FO
NG
η
η
CDM-SSC-PDD (version 02)
CDM – Executive Board page 23
CDM-SSC-PDD (version 02)
CDM – Executive Board page 24
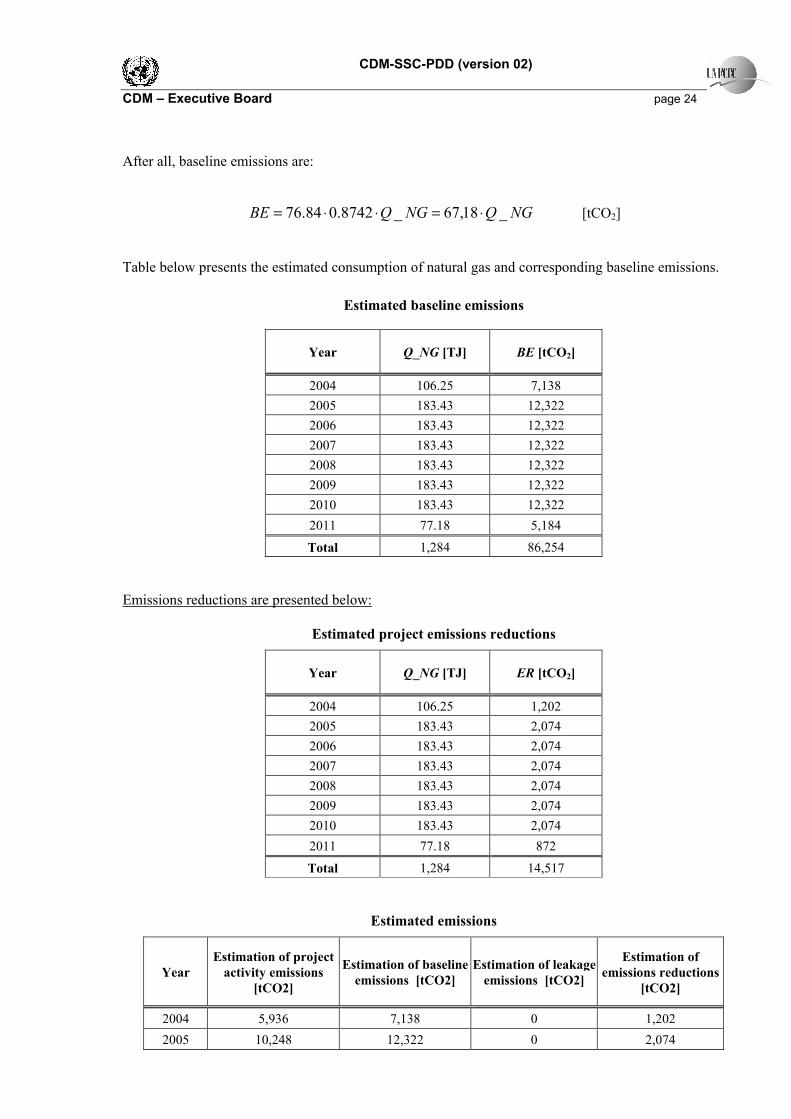
After all, baseline emissions are:
NGQNGQBE _18,67_8742.084.76 ⋅=⋅⋅= [tCO2]
Table below presents the estimated consumption of natural gas and corresponding baseline emissions.
Estimated baseline emissions
Year Q_NG [TJ] BE [tCO2]
2004 106.25 7,138
2005 183.43 12,322
2006 183.43 12,322
2007 183.43 12,322
2008 183.43 12,322
2009 183.43 12,322
2010 183.43 12,322
2011 77.18 5,184
Total 1,284 86,254
Emissions reductions are presented below:
Estimated project emissions reductions
Year Q_NG [TJ] ER [tCO2]
2004 106.25 1,202
2005 183.43 2,074
2006 183.43 2,074
2007 183.43 2,074
2008 183.43 2,074
2009 183.43 2,074
2010 183.43 2,074
2011 77.18 872
Total 1,284 14,517
Estimated emissions
Year
Estimation of project
activity emissions
[tCO2]
Estimation of baseline
emissions [tCO2]
Estimation of leakage
emissions [tCO2]
Estimation of
emissions reductions
[tCO2]
2004 5,936 7,138 0 1,202
2005 10,248 12,322 0 2,074

CDM-SSC-PDD (version 02)
CDM – Executive Board page 25
2006 10,248 12,322 0 2,074
2007 10,248 12,322 0 2,074
2008 10,248 12,322 0 2,074
2009 10,248 12,322 0 2,074
2010 10,248 12,322 0 2,074
2011 4,312 5,184 0 872
Total 71,736 86,254 0 14,517
PROJECT DESIGN DOCUMENT FORM (CDM PDD) - Version 02
CDM – Executive Board page 26
SECTION F.: Environmental impacts:
F.1. If required by the host Party, documentation on the analysis of the environmental impacts of
the project activity:
Votorantim Cimentos required the environmental licenses for the dryer from the State environmental agency CETESB. The licenses are available under request. Votorantim Cimentos developed the MCE (Memorial de Caracterização do Empreendimento) to obtain the licenses. The MCE is a simplified document that characterizes the projects in terms of its environmental impacts. This document is demanded by the State environmental agency in order to verify if the project activity needs to carry out a more detailed study (RAP – Relatório Ambiental Preliminar) to obtain the license. The RAP was not necessary, as the dryer retrofitting presented no major environmental impacts. The MCE is available for further consultation in the project site and with CETESB. No significant environmental impacts are expected for this project activity. The non-requirement of RAP nor EIA/RIMA by the State environmental agency confirms this fact. The verification of project atmospheric emissions, wastewater generation and management and solid residues final disposal was approved by the environmental agency as of the issuance of the license. Additionally, Votorantim Cimentos Cubatão has emergency preparedness procedures for the whole plant, which includes the natural gas installations and the dryer. The procedures are available at the project site. Actually, some benefits can be observed after project implementation. The substitution of fuel oil by natural gas reduces emissions of criteria air pollutants (please refer to Section A.2).
SECTION G. Stakeholders’ comments:
G.1. Brief description of how comments by local stakeholders have been invited and compiled:
Brazilian environmental legislation requests the public announcement and invitation for comments in the event of the environmental license request. The public announcement and public comments request were made in the local state official journal (Diário Oficial do Estado) and in the regional newspaper. No objections and comments were raised about the project.
The Brazilian Designated National Authority for the CDM requires the compulsory invitation of selected stakeholders to comment the PDD sent to validation in order to provide the letter of approval. Votorantim and Ecoinvest invited the comments from local stakeholders when validation started. The invited local stakeholders are listed below:
- City Hall of Cubatão - City Council of Cubatão - State Environmental Agency - Local Environmental Agency - Local ONG - State Public Attorney

PROJECT DESIGN DOCUMENT FORM (CDM PDD) - Version 02
CDM – Executive Board page 27
- FBOMS (Representative of Brazilian Environmental ONGs)
G.2. Summary of the comments received:
No comments were received from local stakeholders.
G.3. Report on how due account was taken of any comments received:
No comments were received from local stakeholders.
PROJECT DESIGN DOCUMENT FORM (CDM PDD) - Version 02
CDM – Executive Board page 28
Annex 1
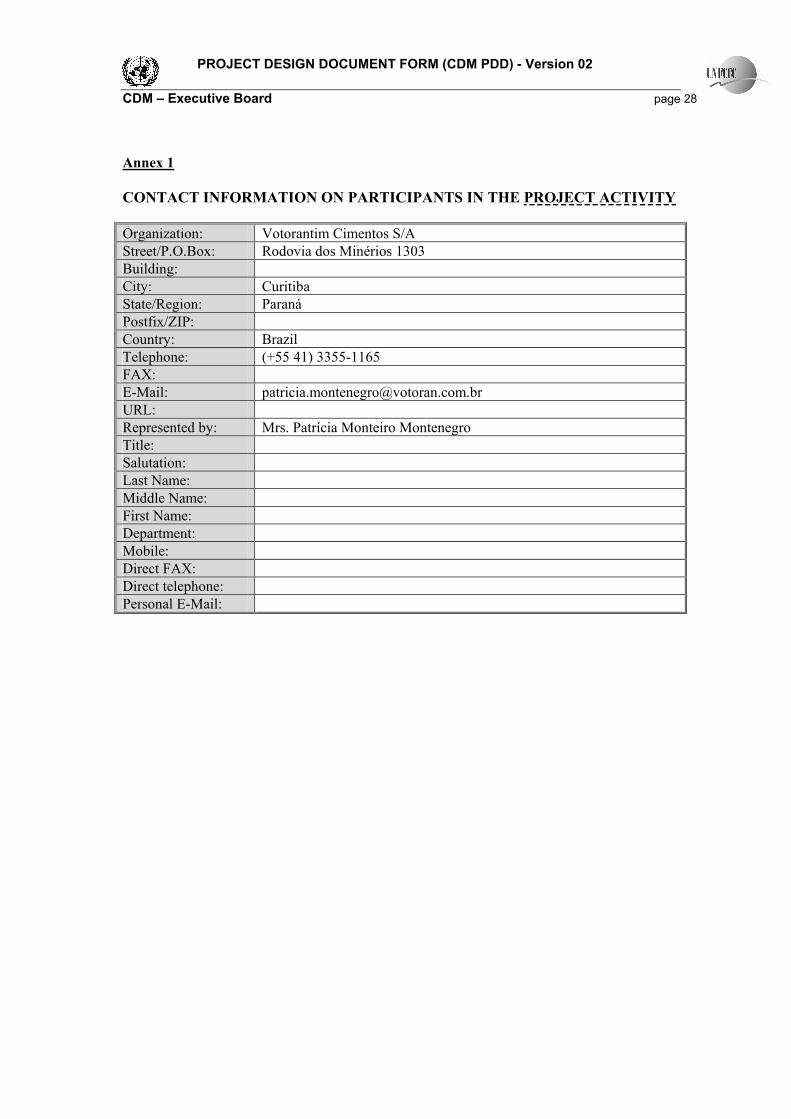
CONTACT INFORMATION ON PARTICIPANTS IN THE PROJECT ACTIVITY
Organization: Votorantim Cimentos S/A
Street/P.O.Box: Rodovia dos Minérios 1303
Building:
City: Curitiba
State/Region: Paraná
Postfix/ZIP:
Country: Brazil
Telephone: (+55 41) 3355-1165
FAX:
E-Mail: [email protected]
URL:
Represented by: Mrs. Patrícia Monteiro Montenegro
Title:
Salutation:
Last Name:
Middle Name:
First Name:
Department:
Mobile:
Direct FAX:
Direct telephone:
Personal E-Mail:
PROJECT DESIGN DOCUMENT FORM (CDM PDD) - Version 02
CDM – Executive Board page 29
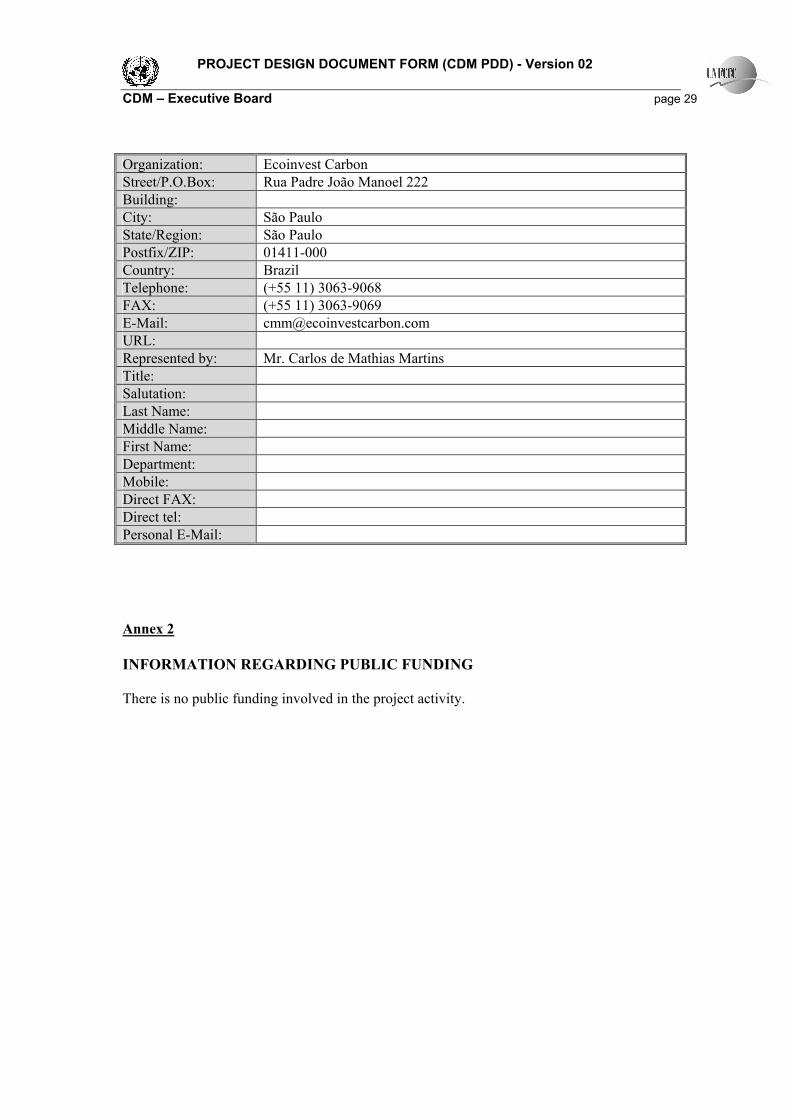
Organization: Ecoinvest Carbon
Street/P.O.Box: Rua Padre João Manoel 222
Building:
City: São Paulo
State/Region: São Paulo
Postfix/ZIP: 01411-000
Country: Brazil
Telephone: (+55 11) 3063-9068
FAX: (+55 11) 3063-9069
E-Mail: [email protected]
URL:
Represented by: Mr. Carlos de Mathias Martins
Title:
Salutation:
Last Name:
Middle Name:
First Name:
Department:
Mobile:
Direct FAX:
Direct tel:
Personal E-Mail:
Annex 2
INFORMATION REGARDING PUBLIC FUNDING There is no public funding involved in the project activity.
PROJECT DESIGN DOCUMENT FORM (CDM PDD) - Version 02
CDM – Executive Board page 30
Annex 3
INFORMATION REGARDING MONITORING PLAN
Monitoring Procedure for CDM Project
Fuel oil to natural gas switch at Votorantim Cimentos
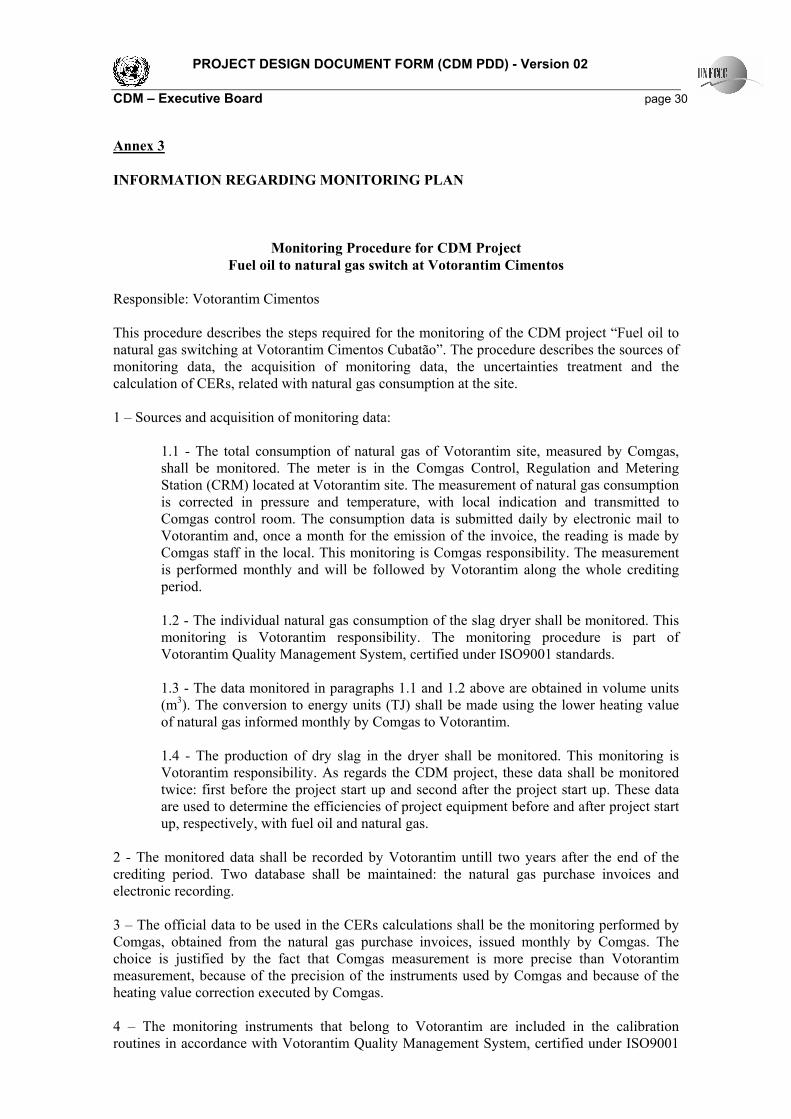
Responsible: Votorantim Cimentos This procedure describes the steps required for the monitoring of the CDM project “Fuel oil to natural gas switching at Votorantim Cimentos Cubatão”. The procedure describes the sources of monitoring data, the acquisition of monitoring data, the uncertainties treatment and the calculation of CERs, related with natural gas consumption at the site. 1 – Sources and acquisition of monitoring data:
1.1 - The total consumption of natural gas of Votorantim site, measured by Comgas, shall be monitored. The meter is in the Comgas Control, Regulation and Metering Station (CRM) located at Votorantim site. The measurement of natural gas consumption is corrected in pressure and temperature, with local indication and transmitted to Comgas control room. The consumption data is submitted daily by electronic mail to Votorantim and, once a month for the emission of the invoice, the reading is made by Comgas staff in the local. This monitoring is Comgas responsibility. The measurement is performed monthly and will be followed by Votorantim along the whole crediting period. 1.2 - The individual natural gas consumption of the slag dryer shall be monitored. This monitoring is Votorantim responsibility. The monitoring procedure is part of Votorantim Quality Management System, certified under ISO9001 standards. 1.3 - The data monitored in paragraphs 1.1 and 1.2 above are obtained in volume units (m3). The conversion to energy units (TJ) shall be made using the lower heating value of natural gas informed monthly by Comgas to Votorantim.
1.4 - The production of dry slag in the dryer shall be monitored. This monitoring is Votorantim responsibility. As regards the CDM project, these data shall be monitored twice: first before the project start up and second after the project start up. These data are used to determine the efficiencies of project equipment before and after project start up, respectively, with fuel oil and natural gas.
2 - The monitored data shall be recorded by Votorantim untill two years after the end of the crediting period. Two database shall be maintained: the natural gas purchase invoices and electronic recording. 3 – The official data to be used in the CERs calculations shall be the monitoring performed by Comgas, obtained from the natural gas purchase invoices, issued monthly by Comgas. The choice is justified by the fact that Comgas measurement is more precise than Votorantim measurement, because of the precision of the instruments used by Comgas and because of the heating value correction executed by Comgas. 4 – The monitoring instruments that belong to Votorantim are included in the calibration routines in accordance with Votorantim Quality Management System, certified under ISO9001
PROJECT DESIGN DOCUMENT FORM (CDM PDD) - Version 02
CDM – Executive Board page 31
standards. The monitoring instruments that belong to Comgas are calibrated in accordance with Comgas procedures. The calibration certificates will be supplied to Votorantim by Comgas as requested. 5 – The natural gas consumption data monitored by Comgas shall be verified monthly to avoid that measurement errors and/or unintended emissions may cause errors in the CERs calculations. Votorantim shall verify Comgas monitoring through the comparison with its own monitoring data. 6 – Natural gas consumption data shall be inserted in the file “Votorantim Cubatão NG - CERs.xls”, available at the site. In this file the calculations of the amount of CERs are made as described in the project PDD. 7 – The monitoring of project environmental impacts, mainly atmospheric emissions, is made according to the requirements of the State environmental agency, Cetesb. In special, Cetesb requires Votorantim to monitor emissions of particulate matter and sulphur oxides each four months.
PROJECT DESIGN DOCUMENT FORM (CDM PDD) - Version 02
CDM – Executive Board page 32
Annex 4
CASH FLOW ANALYSIS
PROJECT DESIGN DOCUMENT FORM (CDM PDD) - Version 02
CDM – Executive Board page 33
PROJECT DESIGN DOCUMENT FORM (CDM PDD) - Version 02
CDM – Executive Board page 34
- - - - -