Embed Size (px)
Citation preview
PROJECT DESIGN DOCUMENT FORM (CDM-SSC-PDD) - Version 03 CDM – Executive Board
1
CLEAN DEVELOPMENT MECHANISM PROJECT DESIGN DOCUMENT FORM (CDM-SSC-PDD)
Version 03 - in effect as of: 22 December 2006
CONTENTS A. General description of the small scale project activity B. Application of a baseline and monitoring methodology C. Duration of the project activity / crediting period D. Environmental impacts E. Stakeholders’ comments
Annexes Annex 1: Contact information on participants in the proposed small scale project activity Annex 2: Information regarding public funding Annex 3: Baseline information
Annex 4: Monitoring Information
Appendixes
Appendix 1: Abbreviations
Appendix 2: References
Enclosures
Enclosure 1: CER Calculations
PROJECT DESIGN DOCUMENT FORM (CDM-SSC-PDD) - Version 03 CDM – Executive Board
2
Revision history of this document Version Number
Date Description and reason of revision
01 21 January 2003
Initial adoption
02 8 July 2005 • The Board agreed to revise the CDM SSC PDD to reflect guidance and clarifications provided by the Board since version 01 of this document.
• As a consequence, the guidelines for completing CDM SSC PDD have been revised accordingly to version 2. The latest version can be found at <http://cdm.unfccc.int/Reference/Documents>.
03 22 December 2006
• The Board agreed to revise the CDM project design document for small-scale activities (CDM-SSC-PDD), taking into account CDM-PDD and CDM-NM.

PROJECT DESIGN DOCUMENT FORM (CDM-SSC-PDD) - Version 03 CDM – Executive Board
3
SECTION A. General description of small-scale project activity A.1 Title of the small-scale project activity: >> Implementation of energy conservation measure at Mannur, Kanchipuram district, Tamilnadu, India
Version 01
03/05/2007
A.2. Description of the small-scale project activity: >> The purpose of the project activity is to reduce the Green House Gas (GHG) emissions by recovering the
waste heat from DG set exhaust gas and reducing the electricity consumption of chillers.
D-TVS DSL’s CDM project activity involves the installation of one Vapour Absorption Machine (VAM)
of capacity 375 TR. D-TVS DSL has three nos. of 100 Tons of Refrigeration (TR) and two nos. of 72 TR
vapour compression chillers. The project activity will replace the existing two nos. of 100 TR and two nos.
of 72 TR vapour compression chillers. The electricity demand of D-TVS DSL is met by power imports
from Tamil Nadu Electricity Board (TNEB) and captive Diesel Generator (DG) sets.
Hot water would be produced by recovering waste heat from DG set exhaust gas. Hot water from Heat
Recovering Unit (HRU) will act as energy input to VAM which produces chilled water. As a result,
electricity consumed in vapour compressor chillers would be saved. And this reflects as reduced TNEB
power consumption leading to reduction in green house gas emissions.
Delphi-TVS Diesel Systems Limited (D-TVS DSL) is in the process of implementing energy conservation
measure at Mannur plant. D-TVS DSL is a joint venture between Delphi automotive systems, USA and
T.V. Sundram Iyengar & Sons, India. It manufactures Injection equipments for cars, multi and sports
utility vehicles, light commercial vehicles, tractors, single & two cylinder small engines.
Key indicators for sustainable development are socio-economic, environmental and technological benefits.
The contribution of project activity towards sustainable development of India is explained as follows.
1. Socio-economic benefits:
The project activity enhances business opportunities for local stakeholders such as consultants, suppliers,
manufacturers, contractors etc during implementation phase. The project activity would raise the short term
employment opportunities of the local people during the construction phase. The project activity will save
electricity consumption from TNEB grid, because of which it adds value to national economy.
2. Environmental benefits:
PROJECT DESIGN DOCUMENT FORM (CDM-SSC-PDD) - Version 03 CDM – Executive Board
4
The project activity would result in saving of electricity from southern regional grid. This will lead to
reduction in GHG emission due to the fossil fuel usage in grid connected power plants. Moreover, VAM is
Chloro Fluoro Carbon (CFC) free, which is an eco-friendly technology.
3. Technological benefits:
VAM has no moving parts and hence no noise and vibrations. VAM is efficient during part load
performance with automatic controls. VAM operates on waste heat recovered from DG exhaust and hence
low utility bills.
A.3. Project participants: >> Name of Party involved ((host)
indicates a host Party)
Private and/or public entity(ies)
project participants (*) (as
applicable)
Kindly indicate if the Party
involved wishes to be considered
as project participant (Yes/No)
India Delphi TVS Diesel Systems Ltd No
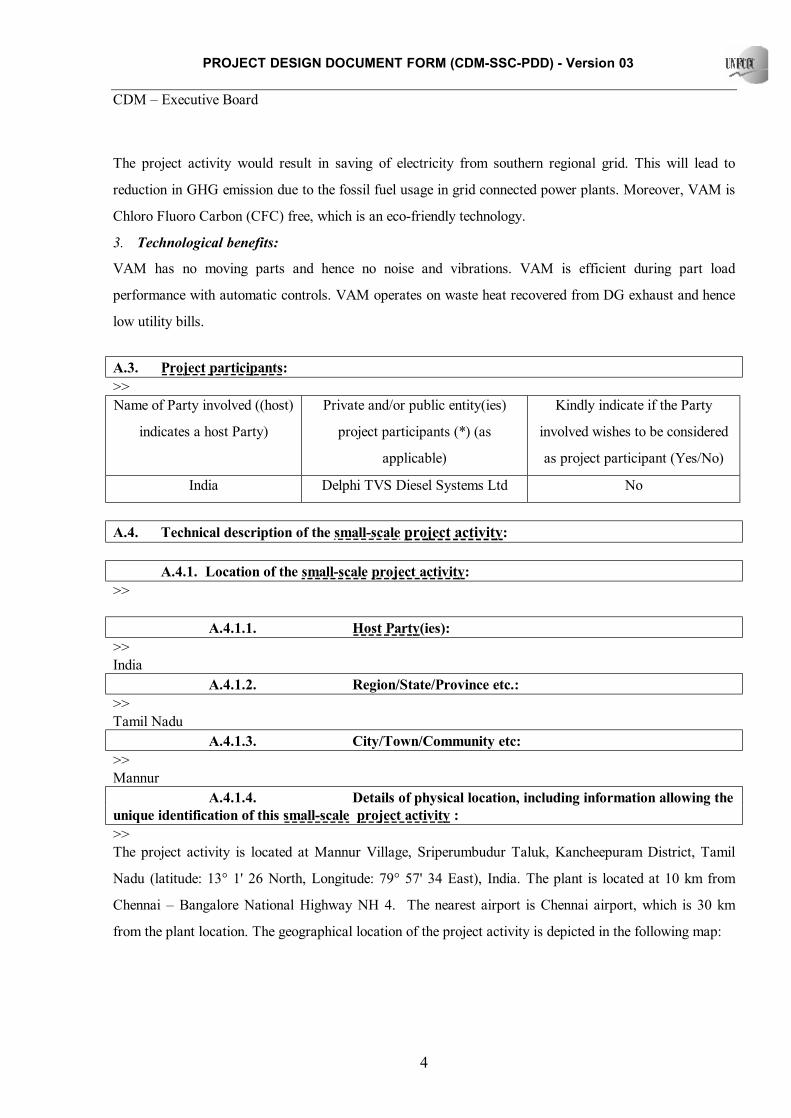
A.4. Technical description of the small-scale project activity: A.4.1. Location of the small-scale project activity: >> A.4.1.1. Host Party(ies): >> India A.4.1.2. Region/State/Province etc.: >> Tamil Nadu A.4.1.3. City/Town/Community etc: >> Mannur A.4.1.4. Details of physical location, including information allowing the unique identification of this small-scale project activity : >> The project activity is located at Mannur Village, Sriperumbudur Taluk, Kancheepuram District, Tamil
Nadu (latitude: 13° 1' 26 North, Longitude: 79° 57' 34 East), India. The plant is located at 10 km from
Chennai – Bangalore National Highway NH 4. The nearest airport is Chennai airport, which is 30 km
from the plant location. The geographical location of the project activity is depicted in the following map:
PROJECT DESIGN DOCUMENT FORM (CDM-SSC-PDD) - Version 03 CDM – Executive Board
5
PROJECT DESIGN DOCUMENT FORM (CDM-SSC-PDD) - Version 03 CDM – Executive Board
6
A.4.2. Type and category(ies) and technology/measure of the small-scale project activity: >> Type II – Energy Efficiency Improvement projects
Category D - Energy Efficiency and fuel switching measures for industrial facilities.
The approved baseline methodology has been referred from the Indicative simplified baseline and
monitoring methodologies for selected small-scale CDM project activity categories - version 8 -
23rd December 2006. From this reference, the following category is selected for the project activity:
Technology of the project activity:
The project activity comprises of one Heat Recovery Unit and one Vapour Absorption Machine.
Heat Recovery Unit: It recovers heat from DG set Exhaust gas to generate hot water. Technical
specifications of HRU are given below:
Operating Parameters:
a) Gas Side Data
Waste Heat Source : Exhaust gases
Exhaust gas Quantity : 13578 kg/hr
Exhaust gas inlet temp : 337 oC
Pressure Drop across HRU : 100 mmWC
b) Hot Water Side Data
Pressure Drop across HRU : 10 mlc
Losses considered : 3% radiation loss
Vapour absorption Machine: The absorption cycle used in a VAM, is a process by which refrigeration
effect is produced through the use of two fluids namely refrigerant and absorbent and some quantity of heat
input, rather than electrical input as in the more familiar vapor compression cycle. Heat supplied in the
generator section is added to a solution of LiBr-H2O. This heat causes the refrigerant (water), to be boiled
out of the solution in a distillation process. The water vapor that results passes into the condenser section
where a cooling medium is used to condense the vapour back to a liquid state. The water then flows down
to the evaporator section where it passes over tubes containing the fluid to be cooled. By maintaining a very
low pressure in the absorber-evaporator shell, the water boils at a very low temperature. This boiling
causes the water to absorb heat from the medium to be cooled, thus, lowering its temperature. The
evaporated water then passes into the absorber section where it is mixed with a LiBr-H2O solution that is
very low in water content. This strong solution (rich in LiBr) tends to absorb the vapour from the
PROJECT DESIGN DOCUMENT FORM (CDM-SSC-PDD) - Version 03 CDM – Executive Board
7
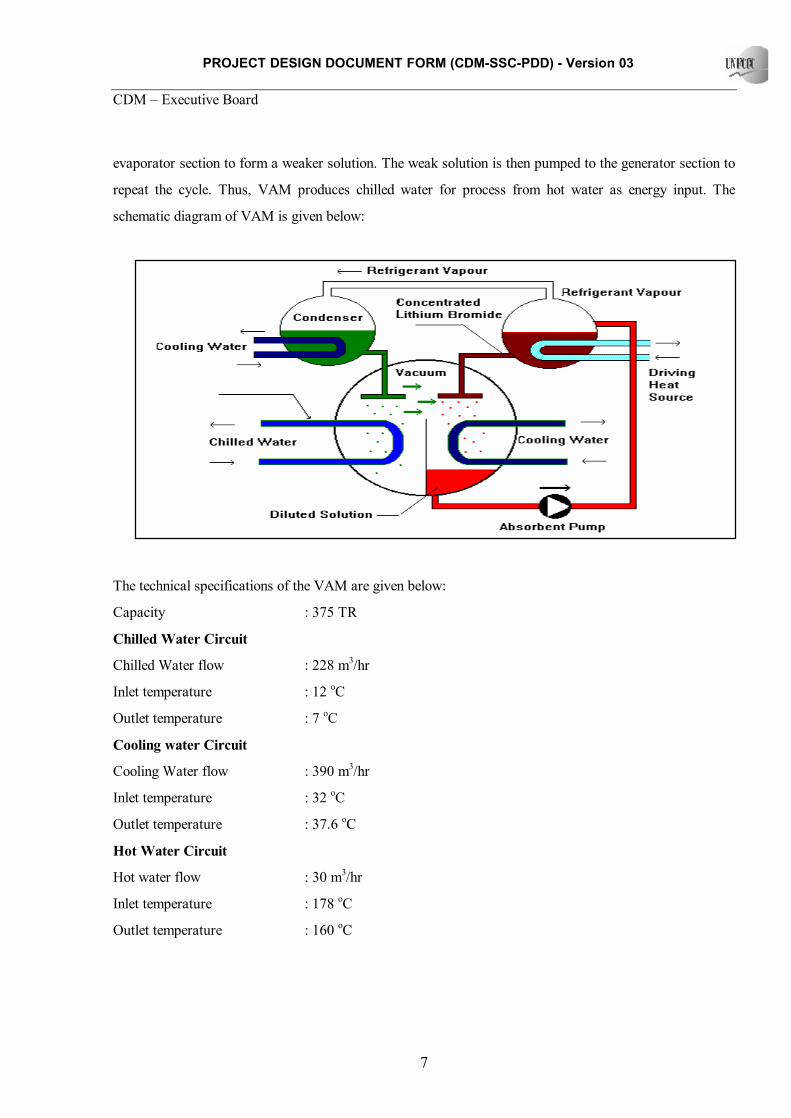
evaporator section to form a weaker solution. The weak solution is then pumped to the generator section to
repeat the cycle. Thus, VAM produces chilled water for process from hot water as energy input. The
schematic diagram of VAM is given below:
The technical specifications of the VAM are given below:
Capacity : 375 TR
Chilled Water Circuit
Chilled Water flow : 228 m3/hr
Inlet temperature : 12 oC
Outlet temperature : 7 oC
Cooling water Circuit
Cooling Water flow : 390 m3/hr
Inlet temperature : 32 oC
Outlet temperature : 37.6 oC
Hot Water Circuit
Hot water flow : 30 m3/hr
Inlet temperature : 178 oC
Outlet temperature : 160 oC
PROJECT DESIGN DOCUMENT FORM (CDM-SSC-PDD) - Version 03 CDM – Executive Board
8
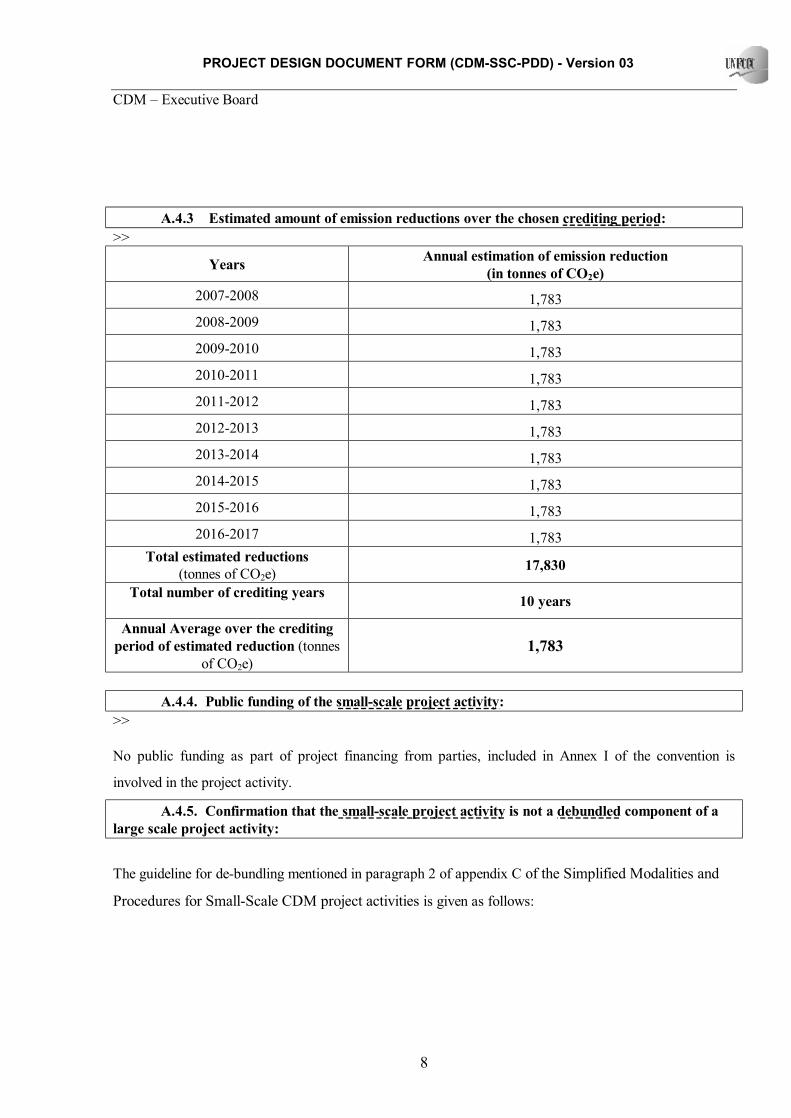
A.4.3 Estimated amount of emission reductions over the chosen crediting period: >>
Years Annual estimation of emission reduction (in tonnes of CO2e)
2007-2008 1,783 2008-2009 1,783 2009-2010 1,783 2010-2011 1,783 2011-2012 1,783 2012-2013 1,783 2013-2014 1,783 2014-2015 1,783 2015-2016 1,783 2016-2017 1,783
Total estimated reductions (tonnes of CO2e) 17,830
Total number of crediting years 10 years
Annual Average over the crediting period of estimated reduction (tonnes
of CO2e) 1,783
A.4.4. Public funding of the small-scale project activity: >> No public funding as part of project financing from parties, included in Annex I of the convention is
involved in the project activity.
A.4.5. Confirmation that the small-scale project activity is not a debundled component of a large scale project activity:
The guideline for de-bundling mentioned in paragraph 2 of appendix C of the Simplified Modalities and
Procedures for Small-Scale CDM project activities is given as follows:
PROJECT DESIGN DOCUMENT FORM (CDM-SSC-PDD) - Version 03 CDM – Executive Board
9
A proposed small scale project activity shall be deemed to be a de-bundled component of a large project
activity, if there is a registered small-scale CDM project activity or an application to register another
small-scale CDM project activity.
• With the same project participants;
• In the same project category and technology/measure; and
• Registered within the previous 2 years
• Whose project boundary is within 1 km of the project boundary of the proposed small-scale
activity at the closest point.
The project proponent is not promoting another small scale CDM project activity in the same category and
technology/measure. Therefore, the proposed project is not a de-bundled component of a large project
activity.
PROJECT DESIGN DOCUMENT FORM (CDM-SSC-PDD) - Version 03 CDM – Executive Board
10
SECTION B. Application of a baseline and monitoring methodology B.1. Title and reference of the approved baseline and monitoring methodology applied to the small-scale project activity: >> Title: Type II – Energy Efficiency Improvement projects
Category D - Energy Efficiency and fuel switching measures for industrial facilities.
Reference: The approved baseline methodology has been referred from the Indicative simplified baseline
and monitoring methodologies for selected small-scale CDM project activity categories - version 8 dated
23rd December 2006.
B.2 Justification of the choice of the project category: >> The basic criterion for a small scale CDM project activity of Type (ii) Energy Efficiency Improvement
projects is as follows:
• This category comprises any energy efficiency and fuel switching measure implemented
at a single industrial activity.
The project activity conserves electricity consumption of Vapour compression chiller by replacing them
with VAM. It is being implemented at a single industrial facility.
• The aggregate energy savings of a single project may not exceed the equivalent of 60 GWhe per
year.
Electricity consumption of vapour compressor chiller = 7450 kWh/day
Electricity consumption of VAM = 1632 kWh/day
Savings in electricity = 5822 kWh/day
= 5822 x 350 days/yr
= 20,36,300 kWh/yr
= 2.036 GWhe/yr The project activity clearly meets the criteria since the energy savings of the project activity is less than the
specified limit.
• The measures may replace, modify or retrofit existing facilities or be installed in a new
facility.

PROJECT DESIGN DOCUMENT FORM (CDM-SSC-PDD) - Version 03 CDM – Executive Board
11
The project activity replaces vapour compressor chiller at existing facility.
The project activity meets the eligibility criteria for small-scale CDM project activities set out in Indicative
simplified baseline and monitoring methodologies for selected small-scale CDM project activity categories
Type II Category D - version 8 - 23rd December 2006 and is not a de-bundled component of a larger
project activity.
The monitoring plan has been drawn as per the guidance provided in paragraph 13 of ‘Indicative simplified
baseline and monitoring methodologies for selected small-scale CDM project activity categories Type II -
Category 1.D - version 8 – 23rd December 2006’.
B.3. Description of the project boundary: >> As per the guidelines provided in the approved methodology, the project boundary is the physical,
geographical site of the industrial facility, processes or equipments that are affected by the project activity.
The project boundary covers the vapour compressor chillers, VAM, HRU and auxiliary boiler.
The schematic layout of project boundary is given below:
PROJECT DESIGN DOCUMENT FORM (CDM-SSC-PDD) - Version 03 CDM – Executive Board
12
B.4. Description of baseline and its development: >>
The baseline for the proposed project activity has been estimated by using the methodology specified in the
applicable project category for small-scale CDM project activities. The project activity conserves
electricity drawn from TNEB. The baseline is the product of annual electricity (in kWh) savings times the
southern grid emission factor of 0.86 kg CO2/kWh detailed in Annex 3.
Date of completion of the baseline: 03/05/2007
Name of person/entity determining the baseline: M/s Delphi TVS Diesel Systems Ltd
The detail of the project participant is enclosed in Annex 1 of this document. B.5. Description of how the anthropogenic emissions of GHG by sources are reduced below those that would have occurred in the absence of the registered small-scale CDM project activity: As per the ‘Attachment A’ to ‘Appendix B’, project participants need to provide an explanation to
demonstrate that the project activity would not have occurred anyway. It has been discussed in the
following paragraph that the project activity has associated barriers to its implementation and hence the
emission reductions due to project activity are additional.
Technological barrier:
Although VAM is environmentally sound technology, due to some technical intricacies, it displays
following barriers to implementation of the project activity.
Vacuum System: VAM is a vacuum system, which needs special care and maintenance. Otherwise
machine will stop frequently. Vacuum leakage is frequent with passage of time due to thousands of
expanded tubes with tube sheet joints. In the event of vacuum leakage, machine working becomes erratic.
During such circumstances, fault finding of machine is extremely time consuming. Further, Lithium
bromide (LiBr) circulated inside the tube is toxic. Skin contact with the anhydrous compound may lead to
burns as a result of substantial dehydration due to tube failure. It will absorb and react with moisture in the
skin, eyes and mucous membranes and can cause irritation. Inhalation or ingestion can cause vomiting,
nausea, diarrhea, drowsiness, muscular weakness, lack of coordination, skin eruptions or rashes. This is
huge risk due to the technology for the project activity.
Corrosion: Vacuum leaks are a serious problem adversely affecting the efficiency of the machine and
causes corrosion in the unit. Thus, VAM is highly susceptible to corrosion and therefore life can be limited
PROJECT DESIGN DOCUMENT FORM (CDM-SSC-PDD) - Version 03 CDM – Executive Board
13
if vacuum is not maintained properly. Expanded tube-to-tube sheet joints have tendency to leak
periodically. This will act as huge technological risk for the project activity.
High Maintenance cost: Due to corrosion tube repairs and replacement are frequent. Copper Nickel tubes
& Hermetic pumps are very expensive. Therefore tube replacement is very costly and hence maintenance
cost is very high.
High cooling tower capacity: VAM generates more heat compared to vapour compression chillers. Apart
from condenser, absorber also generates heat, therefore more water is required to dissipate the heat. Hence
VAM requires additional cooling tower capacities approximately 1.3 times greater than electric chillers of
the same size. Though an absorption chiller of the same size as an electric chiller can use the same cooling
tower, but its capacity and efficiency will be reduced. It leads to high initial cost for auxiliaries and high
pump operating cost as it handles large quantities of water.
Crystallization: LiBr tends to crystallise from the solution material due to overheating or overcooling of
solution. Crystallization occurs when the machine operates too close to the saturation temperature of the
LiBr solution and the LiBr begins to precipitate out of the solution. This is controlled by PLC. In case PLC
control fails, machine will stop and will start only after LiBr becomes liquid. It is a nuisance and usually
requires application of external heat to get the LiBr back into the solution. It requires additional
maintenance care to recrystallize the LiBr.
On-line and Off-line changeover: Online /Offline change over takes time due to dilution cycle. Because of
which, VAM would not be readily available when the system demands. It will take approximately 20 to 25
minutes time to align the VAM operation in line to the system. This characteristic due to the technology of
VAM will act as nuisance during the operation.
It is clear from the above paragraphs that, D-TVS DSL has to face various kinds of technological risks
during the operation of the project activity. In spite of these risks, project proponent has taken voluntary
initiative to take up this project with CDM consideration hoping that CDM revenue would help to mitigate
these risks.
Barrier due to Prevailing Practice:
Very few plants in India have installed VAM to generate chilled water. Among automobile sector in Tamil
Nadu, few installations have been made of capacity falls between 50 TR to 235 TR. Although, it is
environmentally sound technology, VAM technology is not well penetrated in this sector. D-TVS DSL is
the first to implement 375 TR VAM in automobile sector in Tamil Nadu. D-TVS DSL has taken voluntary
initiative to become the first automobile components manufacturing industry to implement VAM of this
PROJECT DESIGN DOCUMENT FORM (CDM-SSC-PDD) - Version 03 CDM – Executive Board
14
size. Equipment supplier has appreciated D-TVS DSL for their effort and initiative towards this project
activity.
Despite the above-mentioned barriers, the project proponent has taken up the project with consideration of
CDM, hoping that the carbon revenue would help in mitigating these risks. The monetary benefits expected
due to approval and registration of the project activity as a CDM activity would certainly improve the
sustainability of the project activity.

PROJECT DESIGN DOCUMENT FORM (CDM-SSC-PDD) - Version 03 CDM – Executive Board
15
B.6. Emission reductions:
B.6.1. Explanation of methodological choices: >> The methodology was selected as suggested by the Indicative Simplified Baseline & Monitoring
Methodologies for selected small-scale CDM project activity categories version 8 – 23rd December 2006.
The baseline scenario is determined by analyzing data from the electricity grid to which the project is
connected. The project is conserving electricity drawn from TNEB grid system which forms a part of the
Southern Regional Grid.
According to information from the Central Electricity Authority (CEA), the build margin and operating
margin according to ACM0002 is available for determining the emission factor and the baseline emissions.
For this project activity, latest CEA data released on 21st Dec 2006 was used.
The formula used for calculating emission reductions is given below:
yyyy LPEBEER −−=
Where,
BEy = baseline emissions
yyy EFTRSECBE ××=
Where
SECy – is the specific electricity consumption of baseline i.e. vapour compressor chillers, kWh/TR
EFy – is the CO2 baseline emission factor for the electricity displaced due to the project activity in tons
CO2/MWh.
TR – is the actual refrigeration effect of project activity in terms of Tonnes of refrigeration.
( )chwoutchwinchwchw TTCpMTR ,, −××=
Where
Mchw – Mass flow of chilled water, kg/hr
Cpchw– Specific heat of chilled water
Tin,chw– Inlet temperature of chilled water
PROJECT DESIGN DOCUMENT FORM (CDM-SSC-PDD) - Version 03 CDM – Executive Board
16
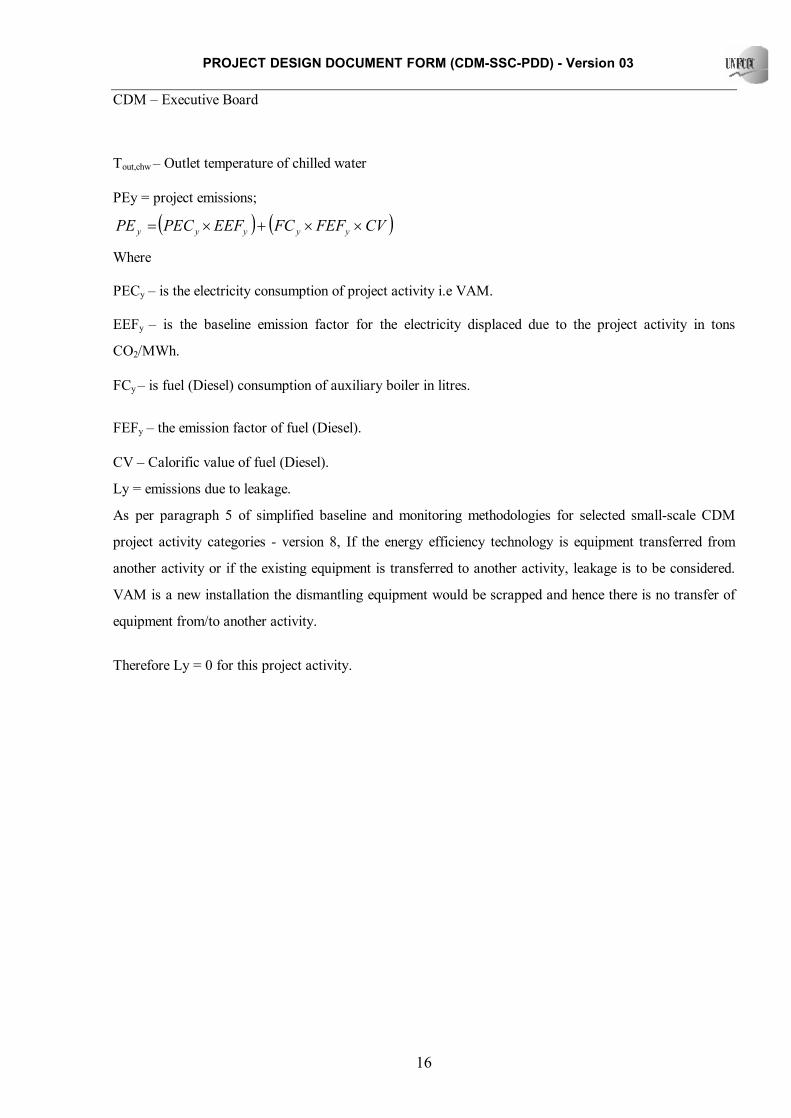
Tout,chw – Outlet temperature of chilled water
PEy = project emissions;
( ) ( )CVFEFFCEEFPECPE yyyyy ××+×=
Where
PECy – is the electricity consumption of project activity i.e VAM.
EEFy – is the baseline emission factor for the electricity displaced due to the project activity in tons
CO2/MWh.
FCy – is fuel (Diesel) consumption of auxiliary boiler in litres.
FEFy – the emission factor of fuel (Diesel).
CV – Calorific value of fuel (Diesel).
Ly = emissions due to leakage.
As per paragraph 5 of simplified baseline and monitoring methodologies for selected small-scale CDM
project activity categories - version 8, If the energy efficiency technology is equipment transferred from
another activity or if the existing equipment is transferred to another activity, leakage is to be considered.
VAM is a new installation the dismantling equipment would be scrapped and hence there is no transfer of
equipment from/to another activity.
Therefore Ly = 0 for this project activity.

PROJECT DESIGN DOCUMENT FORM (CDM-SSC-PDD) - Version 03 CDM – Executive Board
17
B.6.2. Data and parameters that are available at validation:
Data / Parameter: EEFy Data unit: Kg CO2/kWh Description: Baseline Emission Factor of the grid Source of data used: CO2 baseline database for Indian Power Sector provided by the Central
Electricity Authority (CEA)
Value applied: 0.86
Justification of the choice of data or description of measurement methods and procedures actually applied :
Calculated from data provided by the CEA in the CO2 baseline database for
Indian Power Sector
Any comment: Calculated as weighted sum of OM and BM emission factor
Data / Parameter: FEFy Data unit: Kg CO2/TJ Description: Emission Factor of fuel (diesel) Source of data used: Page 2.16, Table 2.2, Chapter 2, Volume 2, 2006 IPCC Guideline for National
Greenhouse gas inventories.
Value applied: 74,100
Justification of the choice of data or description of measurement methods and procedures actually applied :
Calculated from data provided by 2006 IPCC Guideline
Any comment: Constant value
Data / Parameter: SECy Data unit: kWh/TR Description: Specific electricity consumption of Vapour compressor chillers. This data is
quantitative. Source of data to be used:
Delphi TVS Diesel Systems Limited
Value applied 25.2 (Variable). Justification of the choice of data or description of measurement methods
100% of the data is to be monitored and measured online by using energy meter. The data will be archived on paper.
PROJECT DESIGN DOCUMENT FORM (CDM-SSC-PDD) - Version 03 CDM – Executive Board
18
and procedures actually applied : Any comment: Instrument used: Energy Meter, thermometer and flowmeter.
Data Type: Quantity
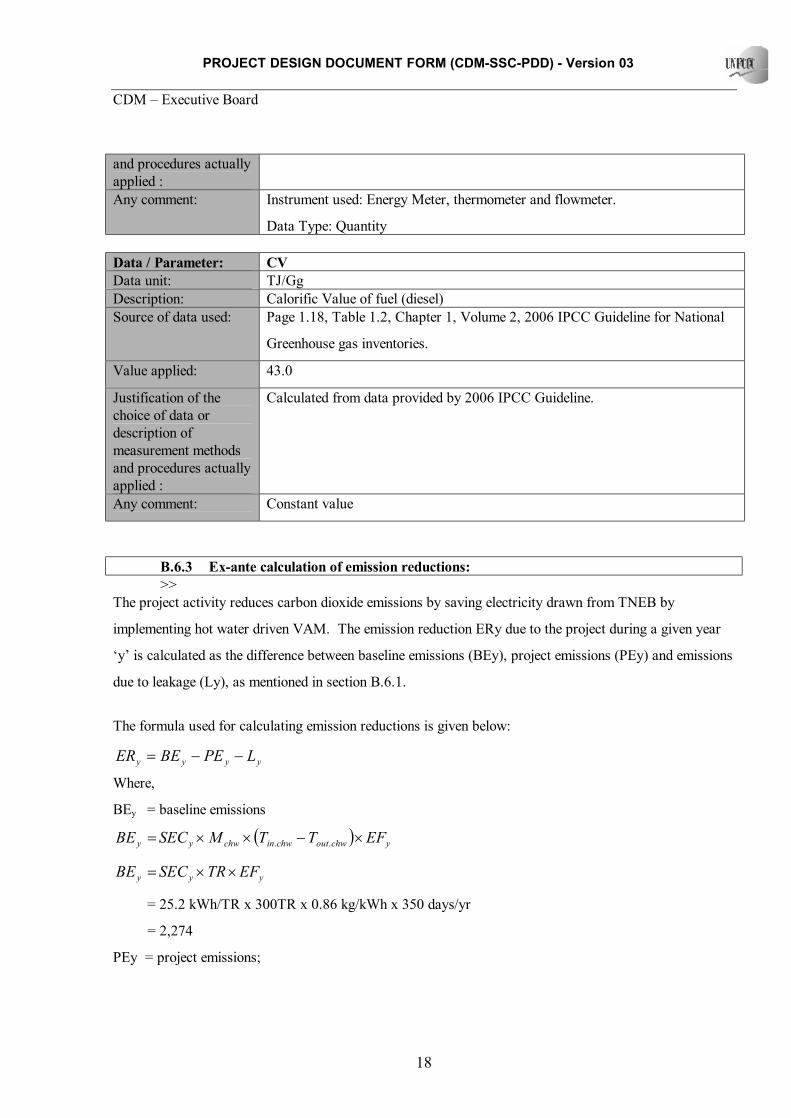
Data / Parameter: CV Data unit: TJ/Gg Description: Calorific Value of fuel (diesel) Source of data used: Page 1.18, Table 1.2, Chapter 1, Volume 2, 2006 IPCC Guideline for National
Greenhouse gas inventories.
Value applied: 43.0
Justification of the choice of data or description of measurement methods and procedures actually applied :
Calculated from data provided by 2006 IPCC Guideline.
Any comment: Constant value
B.6.3 Ex-ante calculation of emission reductions: >>
The project activity reduces carbon dioxide emissions by saving electricity drawn from TNEB by
implementing hot water driven VAM. The emission reduction ERy due to the project during a given year
‘y’ is calculated as the difference between baseline emissions (BEy), project emissions (PEy) and emissions
due to leakage (Ly), as mentioned in section B.6.1.
The formula used for calculating emission reductions is given below:
yyyy LPEBEER −−=
Where,
BEy = baseline emissions
( ) ychwoutchwinchwyy EFTTMSECBE ×−××= ..
yyy EFTRSECBE ××=
= 25.2 kWh/TR x 300TR x 0.86 kg/kWh x 350 days/yr
= 2,274
PEy = project emissions;
PROJECT DESIGN DOCUMENT FORM (CDM-SSC-PDD) - Version 03 CDM – Executive Board
19
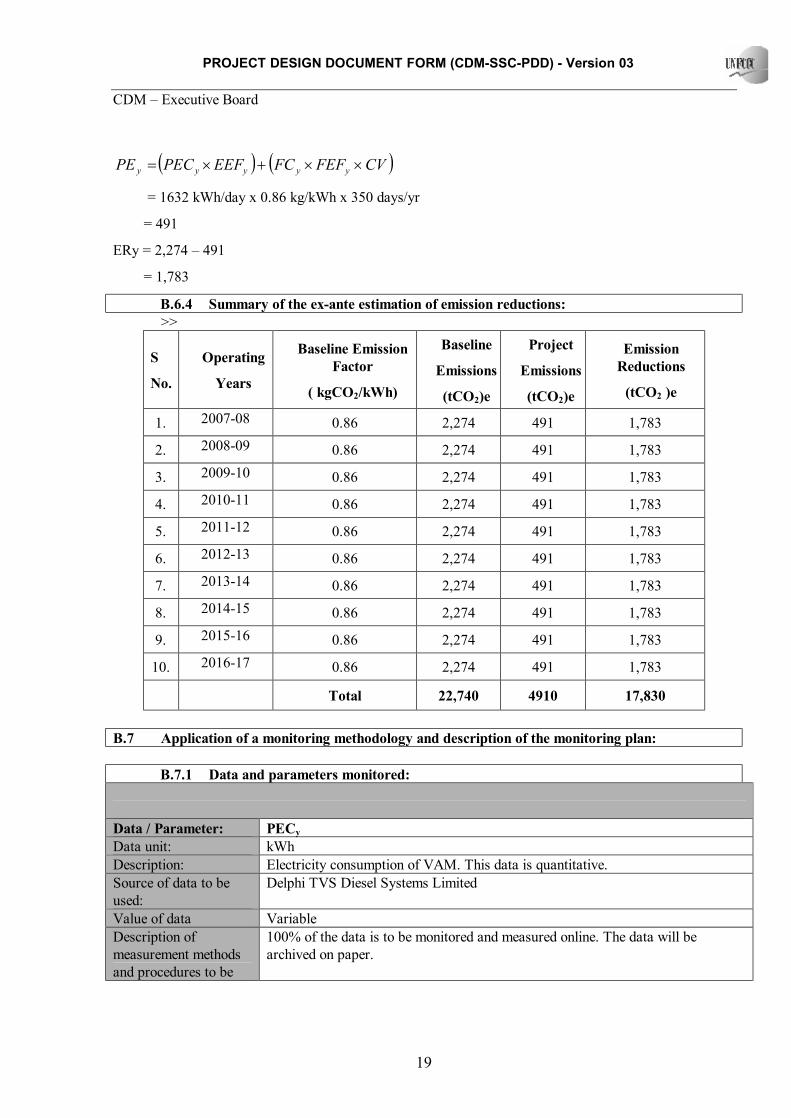
( ) ( )CVFEFFCEEFPECPE yyyyy ××+×=
= 1632 kWh/day x 0.86 kg/kWh x 350 days/yr
= 491
ERy = 2,274 – 491
= 1,783
B.6.4 Summary of the ex-ante estimation of emission reductions: >>
S
No.
Operating
Years
Baseline Emission Factor
( kgCO2/kWh)
Baseline
Emissions
(tCO2)e
Project
Emissions
(tCO2)e
Emission Reductions
(tCO2 )e
1. 2007-08 0.86 2,274 491 1,783
2. 2008-09 0.86 2,274 491 1,783
3. 2009-10 0.86 2,274 491 1,783
4. 2010-11 0.86 2,274 491 1,783
5. 2011-12 0.86 2,274 491 1,783
6. 2012-13 0.86 2,274 491 1,783
7. 2013-14 0.86 2,274 491 1,783
8. 2014-15 0.86 2,274 491 1,783
9. 2015-16 0.86 2,274 491 1,783
10. 2016-17 0.86 2,274 491 1,783
Total 22,740 4910 17,830 B.7 Application of a monitoring methodology and description of the monitoring plan:
B.7.1 Data and parameters monitored: Data / Parameter: PECy Data unit: kWh Description: Electricity consumption of VAM. This data is quantitative. Source of data to be used:
Delphi TVS Diesel Systems Limited
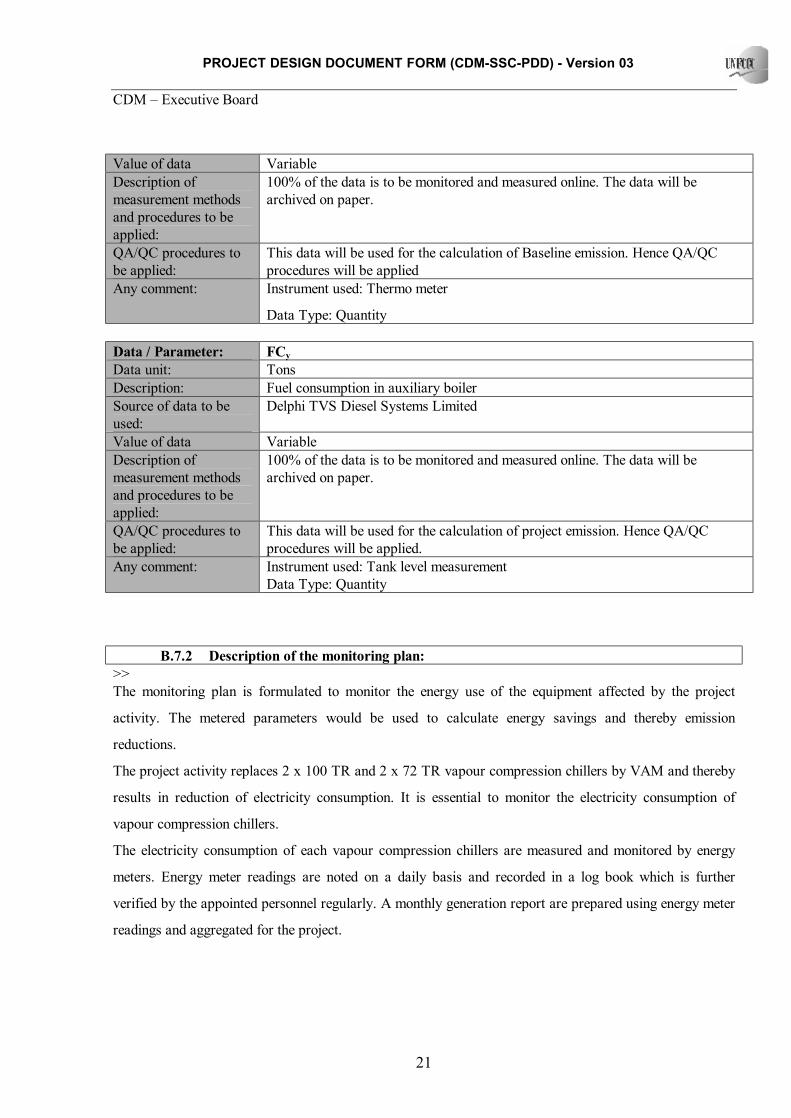
Value of data Variable Description of measurement methods and procedures to be
100% of the data is to be monitored and measured online. The data will be archived on paper.

PROJECT DESIGN DOCUMENT FORM (CDM-SSC-PDD) - Version 03 CDM – Executive Board
20
applied: QA/QC procedures to be applied:
This data will be used for the calculation of project emission. Hence QA/QC procedures will be applied.
Any comment: Instrument used: Energy Meter
Data Type: Quantity
Data / Parameter: Mchw Data unit: Kg/hr Description: Mass flow of chilled water of VAM. This data is quantitative. Source of data to be used:
Delphi TVS Diesel Systems Limited
Value of data Variable Description of measurement methods and procedures to be applied:
100% of the data is to be monitored and measured online. The data will be archived on paper.
QA/QC procedures to be applied:
This data will be used for the calculation of Baseline emission. Hence QA/QC procedures will be applied.
Any comment: Instrument used: Flow meter.
Data Type: Quantity
Data / Parameter: Tin,chw Data unit: oC Description: Inlet temperature of chilled water to VAM. This data is quantitative. Source of data to be used:
Delphi TVS Diesel Systems Limited
Value of data Variable Description of measurement methods and procedures to be applied:
100% of the data is to be monitored and measured online. The data will be archived on paper.
QA/QC procedures to be applied:
This data will be used for the calculation of Baseline emission. Hence QA/QC procedures will be applied.
Any comment: Instrument used: Thermo meter.
Data Type: Quantity
Data / Parameter: Tout,chw Data unit: oC Description: Outlet temperature of chilled water from VAM. This data is quantitative Source of data to be used:
Delphi TVS Diesel Systems Limited
PROJECT DESIGN DOCUMENT FORM (CDM-SSC-PDD) - Version 03 CDM – Executive Board
21
Value of data Variable Description of measurement methods and procedures to be applied:
100% of the data is to be monitored and measured online. The data will be archived on paper.
QA/QC procedures to be applied:
This data will be used for the calculation of Baseline emission. Hence QA/QC procedures will be applied
Any comment: Instrument used: Thermo meter
Data Type: Quantity
Data / Parameter: FCy Data unit: Tons Description: Fuel consumption in auxiliary boiler Source of data to be used:
Delphi TVS Diesel Systems Limited
Value of data Variable Description of measurement methods and procedures to be applied:
100% of the data is to be monitored and measured online. The data will be archived on paper.
QA/QC procedures to be applied:
This data will be used for the calculation of project emission. Hence QA/QC procedures will be applied.
Any comment: Instrument used: Tank level measurement Data Type: Quantity
B.7.2 Description of the monitoring plan: >> The monitoring plan is formulated to monitor the energy use of the equipment affected by the project
activity. The metered parameters would be used to calculate energy savings and thereby emission
reductions.
The project activity replaces 2 x 100 TR and 2 x 72 TR vapour compression chillers by VAM and thereby
results in reduction of electricity consumption. It is essential to monitor the electricity consumption of
vapour compression chillers.
The electricity consumption of each vapour compression chillers are measured and monitored by energy
meters. Energy meter readings are noted on a daily basis and recorded in a log book which is further
verified by the appointed personnel regularly. A monthly generation report are prepared using energy meter
readings and aggregated for the project.
PROJECT DESIGN DOCUMENT FORM (CDM-SSC-PDD) - Version 03 CDM – Executive Board
22
Diesel would be used in auxiliary boiler to generate hot water. Diesel consumption in auxiliary boiler
would be measured on daily basis by level measurement of the fuel tank and recorded in a log book which
is further verified by the stock register. Daily readings would be aggregated to monthly report.
Refrigeration effect of VAM would be monitored on daily basis by measuring flow and inlet & outlet
temperature of chilled water. It is further recorded in a log book on daily basis.
B.8 Date of completion of the application of the baseline and monitoring methodology and the name of the responsible person(s)/entity(ies) >> Date of completion and application of baseline and monitoring methodology: 03/05/2007
Contact Person:
Mr. M.N.Subramanian
Vice president – Finance & Secretary
Delphi TVS Diesel Systems Limited
Mannur, Thodukadu
Sriperumbudur Taluk
Kanchipuram District, Tamil Nadu, India.
PIN : 602 105
Tel: +91 98403 96959
Email: [email protected]
The entity is a project participant listed in Annex 1.
PROJECT DESIGN DOCUMENT FORM (CDM-SSC-PDD) - Version 03 CDM – Executive Board
23
SECTION C. Duration of the project activity / crediting period C.1 Duration of the project activity: C.1.1. Starting date of the project activity: >> 18/01/2007
C.1.2. Expected operational lifetime of the project activity: >> 25 years, 0 months C.2 Choice of the crediting period and related information:
The project activity would use a fixed ten years crediting period.
C.2.1. Renewable crediting period Not Applicable C.2.1.1. Starting date of the first crediting period: >> Not Applicable C.2.1.2. Length of the first crediting period: >> Not Applicable C.2.2. Fixed crediting period: C.2.2.1. Starting date: >> 09/11/2007 or upon registration of project activity with UNFCCC. C.2.2.2. Length: >> 10 years 0 months

PROJECT DESIGN DOCUMENT FORM (CDM-SSC-PDD) - Version 03 CDM – Executive Board
24
SECTION D. Environmental impacts >> D.1. If required by the host Party, documentation on the analysis of the environmental impacts of the project activity: >> Not applicable D.2. If environmental impacts are considered significant by the project participants or the host Party, please provide conclusions and all references to support documentation of an environmental impact assessment undertaken in accordance with the procedures as required by the host Party: >> As per the Environment Impact Assessment Notification S.O.60(E)1, dated 27/01/1994 (Amendment on
14th September 2006), this project activity does not fall under the purview of Environmental Impact
Assessment notification of the Ministry of Environment and Forests -Government of India.
1 Source: http://envfor.nic.in/legis/eia/so-60(e).html
PROJECT DESIGN DOCUMENT FORM (CDM-SSC-PDD) - Version 03 CDM – Executive Board
25
SECTION E. Stakeholders’ comments >> E.1. Brief description how comments by local stakeholders have been invited and compiled: >>
The following are the stakeholders identified for the project activity:
1. Employees
2. Tamil Nadu Electricity Board
3. NGOs
4. Equipment Suppliers
5. Consultants
D-TVS DSL invites concerned stakeholders for consultation process at Mannur with the objective to
inform about the environmental and social impacts of the project activity and discuss their concerns
regarding the project activity.
E.2. Summary of the comments received: >>
Employees: The employees have expressed their support on understanding the various benefits of project
activity. They appreciated that the project activity would not only result in savings in electricity but also
reduce GHG emissions. There were no major comments/concerns raised by the employees.
Tamil Nadu Electricity Board (TNEB): TNEB doesn`t have any concerns against the implementation of
project activity.
NGOs: NGO`s haven`t put forward any concerns against the project activity.
Equipment suppliers: The equipments would be supplied by the equipment supplier as per the
specifications finalized for the project and erection & commissioning of the equipments at the site would be
done. Equipment suppliers appreciate D-TVS DSL efforts to take up such project activity.
Consultants: Consultants would be involved in the project activity to take care of the various pre contracts
and post contract activities like preparation of basic and detailed engineering documents, preparation of
tender documents, selection of vendors / suppliers, supervision of project operation, implementation,
successful commissioning and trial run. Consultants doesn`t have any concerns regarding the project
activity.
PROJECT DESIGN DOCUMENT FORM (CDM-SSC-PDD) - Version 03 CDM – Executive Board
26
In summary, there is no negative concern raised by any of the stakeholders regarding this project activity.
E.3. Report on how due account was taken of any comments received: >> There are no comments or concerns raised during the consultation with stakeholders. Further, as required
by the CDM modalities and procedures, the PDD would be published at the DOE`s web site for global
stakeholder comments.

PROJECT DESIGN DOCUMENT FORM (CDM-SSC-PDD) - Version 03 CDM – Executive Board
27
Annex 1
CONTACT INFORMATION ON PARTICIPANTS IN THE PROJECT ACTIVITY
Organization: Delphi TVS Diesel Systems Limited Street/P.O.Box: Mannur, Thodukadu (Post), Sriperumbudur Taluk, Kancheepuram District, Building: City: State/Region: Tamil Nadu Postfix/ZIP: 602 105 Country: India Telephone: +91-44-2765 8454 FAX: +91-44-2765 9116 E-Mail: [email protected] URL: www.delphitvs.com Represented by: Title: Vice President Salutation: Mr Last Name: M.N Middle Name: First Name: Subramanian Department: Finance & Secretary Mobile: +91-98403 96959 Direct FAX: +91 44 – 27658351 Direct tel: +91 44 – 27658196 Personal E-Mail: [email protected]

PROJECT DESIGN DOCUMENT FORM (CDM-SSC-PDD) - Version 03 CDM – Executive Board
28
Annex 2
INFORMATION REGARDING PUBLIC FUNDING No public funding as part of project financing from parties included, in Annex I of the convention is
involved in the project activity.
PROJECT DESIGN DOCUMENT FORM (CDM-SSC-PDD) - Version 03 CDM – Executive Board
29
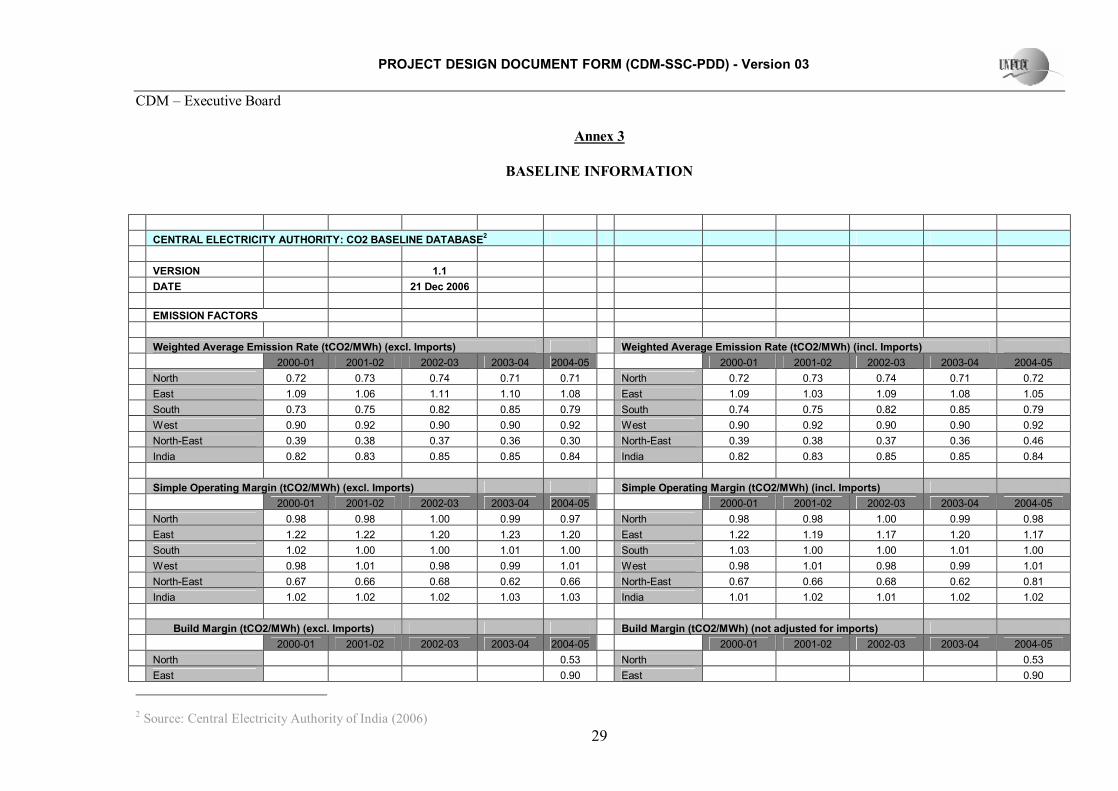
Annex 3
BASELINE INFORMATION
CENTRAL ELECTRICITY AUTHORITY: CO2 BASELINE DATABASE2 VERSION 1.1 DATE 21 Dec 2006 EMISSION FACTORS Weighted Average Emission Rate (tCO2/MWh) (excl. Imports) Weighted Average Emission Rate (tCO2/MWh) (incl. Imports) 2000-01 2001-02 2002-03 2003-04 2004-05 2000-01 2001-02 2002-03 2003-04 2004-05 North 0.72 0.73 0.74 0.71 0.71 North 0.72 0.73 0.74 0.71 0.72 East 1.09 1.06 1.11 1.10 1.08 East 1.09 1.03 1.09 1.08 1.05 South 0.73 0.75 0.82 0.85 0.79 South 0.74 0.75 0.82 0.85 0.79 West 0.90 0.92 0.90 0.90 0.92 West 0.90 0.92 0.90 0.90 0.92 North-East 0.39 0.38 0.37 0.36 0.30 North-East 0.39 0.38 0.37 0.36 0.46 India 0.82 0.83 0.85 0.85 0.84 India 0.82 0.83 0.85 0.85 0.84 Simple Operating Margin (tCO2/MWh) (excl. Imports) Simple Operating Margin (tCO2/MWh) (incl. Imports) 2000-01 2001-02 2002-03 2003-04 2004-05 2000-01 2001-02 2002-03 2003-04 2004-05 North 0.98 0.98 1.00 0.99 0.97 North 0.98 0.98 1.00 0.99 0.98 East 1.22 1.22 1.20 1.23 1.20 East 1.22 1.19 1.17 1.20 1.17 South 1.02 1.00 1.00 1.01 1.00 South 1.03 1.00 1.00 1.01 1.00 West 0.98 1.01 0.98 0.99 1.01 West 0.98 1.01 0.98 0.99 1.01 North-East 0.67 0.66 0.68 0.62 0.66 North-East 0.67 0.66 0.68 0.62 0.81 India 1.02 1.02 1.02 1.03 1.03 India 1.01 1.02 1.01 1.02 1.02 Build Margin (tCO2/MWh) (excl. Imports) Build Margin (tCO2/MWh) (not adjusted for imports) 2000-01 2001-02 2002-03 2003-04 2004-05 2000-01 2001-02 2002-03 2003-04 2004-05 North 0.53 North 0.53 East 0.90 East 0.90
2 Source: Central Electricity Authority of India (2006)

PROJECT DESIGN DOCUMENT FORM (CDM-SSC-PDD) - Version 03 CDM – Executive Board
30
South 0.72 South 0.72 West 0.78 West 0.78 North-East 0.10 North-East 0.10 India 0.70 India 0.70 Combined Margin (tCO2/MWh) (excl. Imports) Combined Margin in tCO2/MWh (incl. Imports) 2000-01 2001-02 2002-03 2003-04 2004-05 2000-01 2001-02 2002-03 2003-04 2004-05 North 0.76 0.76 0.77 0.76 0.75 North 0.76 0.76 0.77 0.76 0.75 East 1.06 1.06 1.05 1.07 1.05 East 1.06 1.05 1.04 1.05 1.04 South 0.87 0.86 0.86 0.86 0.86 South 0.87 0.86 0.86 0.86 0.86 West 0.88 0.89 0.88 0.88 0.90 West 0.88 0.89 0.88 0.88 0.89 North-East 0.39 0.38 0.39 0.36 0.38 North-East 0.39 0.38 0.39 0.36 0.45 India 0.86 0.86 0.86 0.86 0.86 India 0.86 0.86 0.86 0.86 0.86 GENERATION DATA EMISSION DATA Gross Generation Total (GWh) Absolute Emissions Total (tCO2) 2000-01 2001-02 2002-03 2003-04 2004-05 2000-01 2001-02 2002-03 2003-04 2004-05 North 144,292 151,185 155,385 165,735 168,438 North 97,863,848 102,743,113 106,777,065 109,980,786 112,199,697 East 58,936 64,048 66,257 75,374 85,776 East 58,025,890 61,436,757 66,595,529 75,515,998 83,956,860 South 128,983 131,902 136,916 138,299 144,086 South 88,728,956 92,484,478 104,180,940 108,406,007 105,960,087 West 162,329 165,805 177,399 172,682 183,955 West 135,147,507 141,597,621 148,313,340 144,127,175 157,781,065 North-East 5,314 5,292 5,811 5,880 7,904 North-East 2,009,681 1,976,535 2,090,087 2,088,985 2,294,430 India 499,854 518,231 541,766 557,970 590,158 India 381,775,882 400,238,503 427,956,961 440,118,951 462,192,140 Net Generation Total (GWh) Absolute Emissions OM (tCO2) 2000-01 2001-02 2002-03 2003-04 2004-05 2000-01 2001-02 2002-03 2003-04 2004-05 North 135,230 141,415 144,741 155,043 157,290 North 97,863,848 102,743,113 106,777,065 109,980,786 112,199,697 East 53,350 58,097 59,841 68,428 77,968 East 58,025,890 61,436,757 66,595,529 75,515,998 83,956,860 South 121,144 123,612 127,780 128,165 134,691 South 88,728,956 92,484,478 104,180,940 108,406,007 105,960,087 West 150,412 153,125 164,448 159,780 170,726 West 135,147,507 141,597,621 148,313,340 144,127,175 157,781,065 North-East 5,185 5,169 5,669 5,758 7,776 North-East 2,009,681 1,976,535 2,090,087 2,088,985 2,294,430 India 465,321 481,417 502,480 517,174 548,451 India 381,775,882 400,238,503 427,956,961 440,118,951 462,192,140 20% of Net Generation (GWh) Absolute Emissions BM (tCO2) 2000-01 2001-02 2002-03 2003-04 2004-05 2000-01 2001-02 2002-03 2003-04 2004-05 North 27,046 28,283 28,948 31,009 31,458 North 17,108,583

PROJECT DESIGN DOCUMENT FORM (CDM-SSC-PDD) - Version 03 CDM – Executive Board
31
East 10,670 11,619 11,968 13,686 15,594 East 14,303,611 South 24,229 24,722 25,556 25,633 26,938 South 19,525,581 West 30,082 30,625 32,890 31,956 34,145 West 26,881,491 North-East 1,037 1,034 1,134 1,152 1,555 North-East 206,514 India 93,064 96,283 100,496 103,435 109,690 India 78,025,780 Share of Must-Run (Hydro/Nuclear) (% of Net Generation) 2000-01 2001-02 2002-03 2003-04 2004-05 North 25.9% 25.7% 26.1% 28.1% 26.8% East 10.8% 13.4% 7.5% 10.3% 10.5% South 28.1% 25.5% 18.3% 16.2% 21.6% West 8.2% 8.5% 8.2% 9.1% 8.8% North-East 42.3% 42.1% 45.8% 41.8% 55.4% India 19.2% 18.9% 16.3% 17.1% 18.0% IMPORT DATA Net Generation in Operating Margin (GWh) Net Imports (GWh) - Net exporting grids are set to zero 2000-01 2001-02 2002-03 2003-04 2004-05 2000-01 2001-02 2002-03 2003-04 2004-05 North 100,189 105,076 106,940 111,449 115,151 North 0 0 0 0 3,616 East 47,570 50,308 55,377 61,378 69,746 East 489 555 357 1,689 0 South 87,100 92,085 104,441 107,396 105,584 South 1,162 1,357 518 0 0 West 138,071 140,173 150,889 145,264 155,731 West 321 0 797 962 285 North-East 2,992 2,995 3,071 3,350 3,469 North-East 0 0 0 0 2,099 India 375,923 390,638 420,718 428,838 449,681 Net Generation in Build Margin (GWh) Share of Net Imports (% of Net Generation) 2000-01 2001-02 2002-03 2003-04 2004-05 2000-01 2001-02 2002-03 2003-04 2004-05 North 32,067 North 0.0% 0.0% 0.0% 0.0% 2.3% East 15,818 East 0.9% 1.0% 0.6% 2.5% 0.0% South 27,195 South 1.0% 1.1% 0.4% 0.0% 0.0% West 34,587 West 0.2% 0.0% 0.5% 0.6% 0.2% North-East 2,052 North-East 0.0% 0.0% 0.0% 0.0% 27.0% India 111,718

PROJECT DESIGN DOCUMENT FORM (CDM-SSC-PDD) - Version 03 CDM – Executive Board
32
Annex 4
MONITORING INFORMATION The project proponent has a well defined project management structure for monitoring the project activity.
The monitoring plan is discussed in section B7.
PROJECT DESIGN DOCUMENT FORM (CDM-SSC-PDD) - Version 03 CDM – Executive Board
33
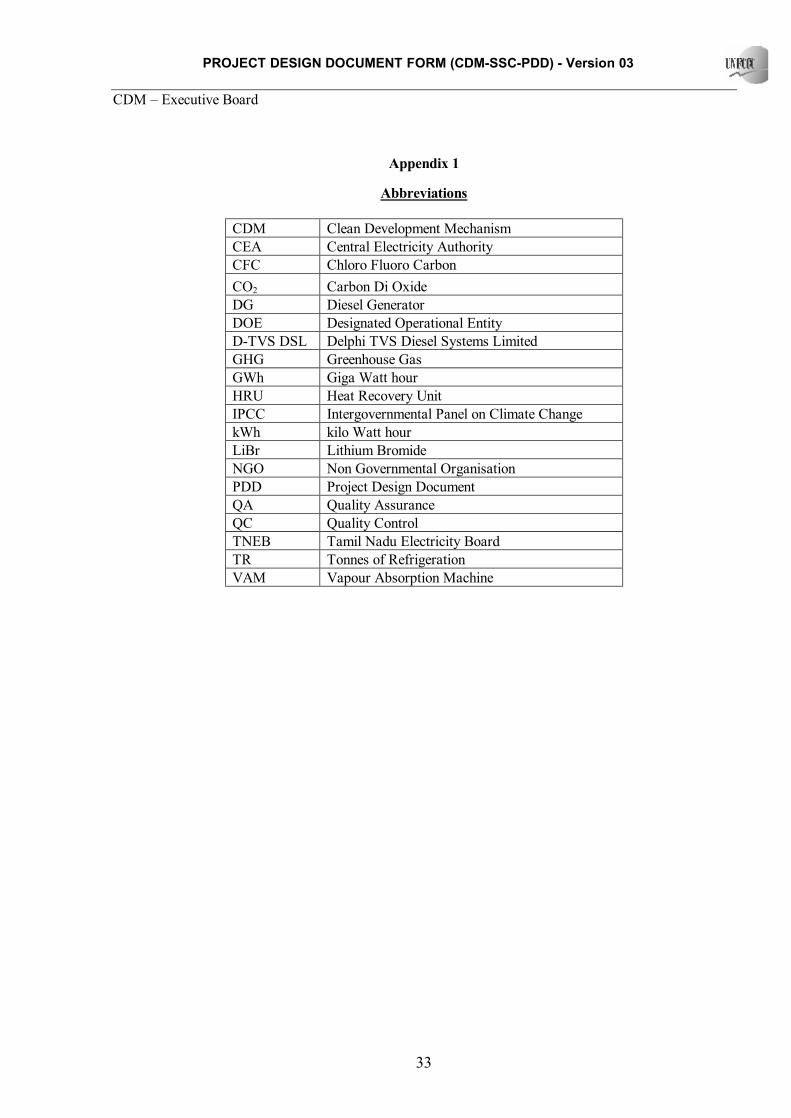
Appendix 1
Abbreviations
CDM Clean Development Mechanism CEA Central Electricity Authority CFC Chloro Fluoro Carbon CO2 Carbon Di Oxide DG Diesel Generator DOE Designated Operational Entity D-TVS DSL Delphi TVS Diesel Systems Limited GHG Greenhouse Gas GWh Giga Watt hour HRU Heat Recovery Unit IPCC Intergovernmental Panel on Climate Change kWh kilo Watt hour LiBr Lithium Bromide NGO Non Governmental Organisation PDD Project Design Document QA Quality Assurance QC Quality Control TNEB Tamil Nadu Electricity Board TR Tonnes of Refrigeration VAM Vapour Absorption Machine
PROJECT DESIGN DOCUMENT FORM (CDM-SSC-PDD) - Version 03 CDM – Executive Board
34
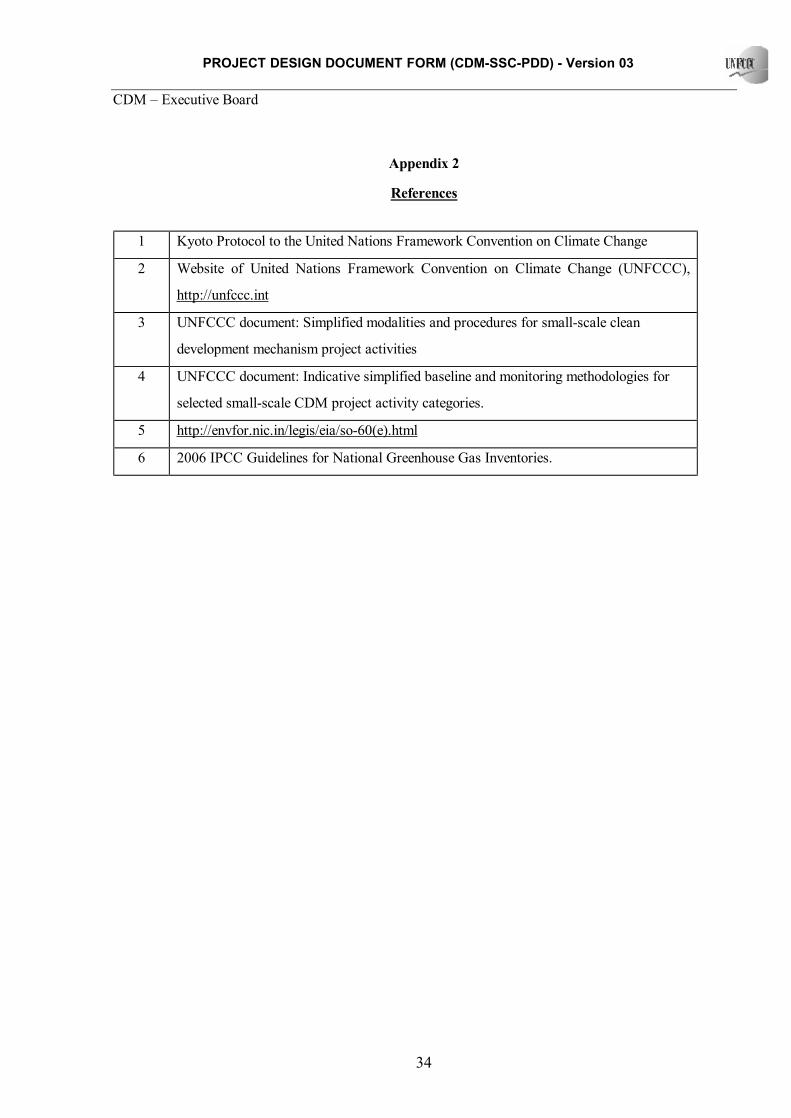
Appendix 2
References
1 Kyoto Protocol to the United Nations Framework Convention on Climate Change
2 Website of United Nations Framework Convention on Climate Change (UNFCCC),
http://unfccc.int
3 UNFCCC document: Simplified modalities and procedures for small-scale clean
development mechanism project activities
4 UNFCCC document: Indicative simplified baseline and monitoring methodologies for
selected small-scale CDM project activity categories.
5 http://envfor.nic.in/legis/eia/so-60(e).html
6 2006 IPCC Guidelines for National Greenhouse Gas Inventories.
PROJECT DESIGN DOCUMENT FORM (CDM-SSC-PDD) - Version 03 CDM – Executive Board
35
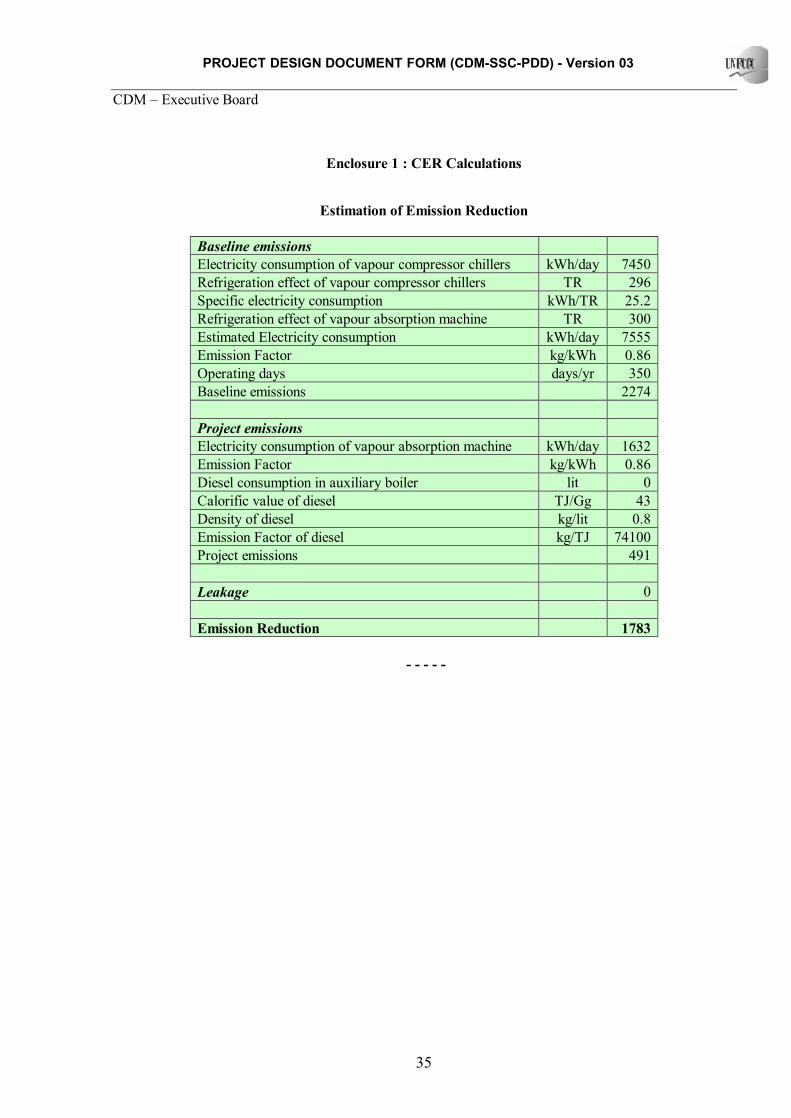
Enclosure 1 : CER Calculations
Estimation of Emission Reduction
Baseline emissions Electricity consumption of vapour compressor chillers kWh/day 7450 Refrigeration effect of vapour compressor chillers TR 296 Specific electricity consumption kWh/TR 25.2 Refrigeration effect of vapour absorption machine TR 300 Estimated Electricity consumption kWh/day 7555 Emission Factor kg/kWh 0.86 Operating days days/yr 350 Baseline emissions 2274 Project emissions Electricity consumption of vapour absorption machine kWh/day 1632 Emission Factor kg/kWh 0.86 Diesel consumption in auxiliary boiler lit 0 Calorific value of diesel TJ/Gg 43 Density of diesel kg/lit 0.8 Emission Factor of diesel kg/TJ 74100 Project emissions 491 Leakage 0 Emission Reduction 1783
- - - - -