Embed Size (px)
Citation preview

PROJECT DESIGN DOCUMENT FORM (CDM PDD) - Version 03.1. CDM – Executive Board page 1
CLEAN DEVELOPMENT MECHANISM PROJECT DESIGN DOCUMENT FORM (CDM-PDD)
Version 03 - in effect as of: 28 July 2006
CONTENTS A. General description of project activity B. Application of a baseline and monitoring methodology C. Duration of the project activity / crediting period D. Environmental impacts E. Stakeholders’ comments
Annexes Annex 1: Contact information on participants in the project activity Annex 2: Information regarding public funding Annex 3: Baseline information
Annex 4: Monitoring plan

PROJECT DESIGN DOCUMENT FORM (CDM PDD) - Version 03.1. CDM – Executive Board page 2 SECTION A. General description of project activity A.1 Title of the project activity: >> Use of alternate fuels in the manufacturing of Portland cement at Binani Cement Limited, Rajasthan, India. Version 01 11/12/2007
A.2. Description of the project activity: >> The project activity is the partial replacement of fossil fuels with alternate fuels, mainly biomass residues, (De oiled Cake (DOC), saw dust, mehandi, damaged wheat, rice husk, etc.) in cement manufacturing. The purpose of the project activity at Binani Cement Limited (BCL) is to reduce the CO2 emission in the cement production by using the biomass residues, which has resulted in reduced green house gas emission into the atmosphere.
The conventional practice in cement industry is to use fossil fuels such as coal, lignite, pet coke, etc. as thermal energy for clinker production. The purpose of the project activity is to utilize climate neutral biomass residues in Portland cement manufacturing. The project activity has led to less consumption of fossil fuel per ton of clinker production that has led to reduction of greenhouse gas emissions into the atmosphere. The project activity of BCL also leads to sustainable economic growth, conservation of natural resources and reduction in Greenhouse Gas (GHG) emission. Project’s Contribution to Sustainable Development Social Well-being: - The project has generated employment opportunities in the supply chain of biomass residues– i.e. the collection, sorting, and transportation of biomass residues. The project has led to employment opportunities for skilled and unskilled workers of the rural region and therefore is contributing social well being of the people. The project has helped uplifting the standard of living of farmers in nearby regions by making available an added source of revenue, biomass residues, which were earlier mainly burnt in open grounds and fetched no value. Economical Well-being: - The sourcing of biomass residues has led to business as well as employment opportunities for local people i.e farmers and small industries have got opportunity to supply the biomass residues to the project proponent and transportation opportunities have been made available to local logistics companies.

PROJECT DESIGN DOCUMENT FORM (CDM PDD) - Version 03.1. CDM – Executive Board page 3 Environmental Well-being: - Biomass residues are climate neutral, i.e. the CO2 generated by its combustion is sequestered by agriculture crops. Biomass residues are often wasted as there is hardly any other application. Utilization of biomass residues in calciner has helped project proponent reduce net GHG emissions related to cement production and also prevented uncontrolled burning of the same in the area. The project shows less dependence of project proponent on fossil fuels and better management of waste. This brings in related benefits for the company, the local community and the employees. Technology Well-being: - The technology to use biomass residues in the calciner and kiln is indigenously developed by the project proponent (BCL). The project activity would contribute to a better quality environment to the employees and surrounding community. Thus the implementation of project activity is a demonstration of a clean technology and would promote the use of alternate fuels in similar industries in the region.
A.3. Project participants: >> Name of Party involved ((host)
indicates a host Party)
Private and/or public entity(ies)
project participants (as
applicable)
Kindly indicate if the Party
involved wishes to be
considered as project
participant (Yes/No)
India (Host) Binani Cement Limited (BCL)
(Private entity)
No
A.4. Technical description of the project activity: A.4.1. Location of the project activity: >>

PROJECT DESIGN DOCUMENT FORM (CDM PDD) - Version 03.1. CDM – Executive Board page 4

PROJECT DESIGN DOCUMENT FORM (CDM PDD) - Version 03.1. CDM – Executive Board page 5 A.4.1.1. Host Party(ies): >> India A.4.1.2. Region/State/Province etc.: >> Rajasthan A.4.1.3. City/Town/Community etc: >> Binanigram, Tehsil :Pindwara, District: Sirohi A.4.1.4. Detail of physical location, including information allowing the unique identification of this project activity (maximum one page): >> Binani Cement is strategically located at Binanigram, district Sirohi in the state of Rajasthan. The site is advantageous for its easy accessibility to biomass waste from Palanpur, Siddhpur and Ahmedabad region. The plant is located near NH-14 (Ahmedabad – Delhi highway). The nearest railway station is Sirohi Road. The coordinates of the site are as follows: Latitude: 24°48’ - 24°51’ (North) Longitude: 73°4’ - 73°9’ (East) A.4.2. Category (ies) of project activity: >> The project activity is cement sector specific. The project activity may principally be categorized in Category 4: Manufacturing industries, according to sectoral scopes for accreditation of operational entities. A.4.3. Technology to be employed by the project activity: >> The technology employed for using of alternate fuels in cement production is indigenously developed by BCL. The project is undertaken by BCL with the objective to partially replace non-renewable fossil fuel with biomass residues. The BCL developed the system for transporting biomass from storage yard through a separate system, consisting of a 3 way divertor, belt conveyors and a storage bin, under the bin a belt weigh feeder delivering the alternative fuel to a belt conveyor. As per the given set points the weigh feeder has the feature to work in control/loop with the reference to given feed rate. The BCL developed the system to feed the alternative fuel through mechanized system. The belt conveyor is installed below the belt weigh. Feed delivers the alternative fuel into a feed chute connected to feed box and finally alternative fuel is fed to calciner, to take care of air ingress into calciner, a double flap pneumatically operated are installed and take

PROJECT DESIGN DOCUMENT FORM (CDM PDD) - Version 03.1. CDM – Executive Board page 6 care of fugitive dust emission at various transfer points. Jet pulse filter are installed and whole system is fully automatically operated from central control room through Distribution Control System (DCS). There is separate covered storage for individual fuels, two separate handling systems and a common feeding system to calciner for the use of the alternate fuels. The proposed fuel for project activity are DOC, saw dust, mehandi, damaged wheat, rice husk. All the fuels are directly fed into the process without any pre-processing at project site. The technology used for the project activity is environmentally friendly and results in reduced GHG emissions to the atmosphere by using carbon neutral fuels in the calciner.
A.4.4 Estimated amount of emission reductions over the chosen crediting period: >>
Table 1: Emissions Reductions, tones CO2
Year Estimation of emission reductions (tones of CO2e)
2008 (1st January to 31st December) 22232 2009 22232 2010 22232 2011 22232 2012 22232 2013 22232 2014 22232 2015 22232 2016 22232 2017 22232
Total estimated reductions (tCO2e) 222320 Total no of Crediting Years 10 years Annual average over the crediting period of estimated reductions (tones of CO2e)
22232
A.4.5. Public funding of the project activity: >> There is no public funding for this project.

PROJECT DESIGN DOCUMENT FORM (CDM PDD) - Version 03.1. CDM – Executive Board page 7 SECTION B. Application of a baseline and monitoring methodology B.1. Title and reference of the approved baseline and monitoring methodology applied to the project activity: >> Title: “Emission reduction through partial substitution of fossil fuels with alternative fuels or less carbon intensive fuels in cement manufacture” Reference: ACM003, Version 07 The methodology also refers to latest approved versions of:
• “Combined tool to identify the baseline scenario and demonstrate additionality”, version 2.1, (EB 28).
• “Tool to determine methane emissions avoided from dumping waste at a solid waste disposal site“, (EB 35, Annex 10).
• “Tool to calculate project or leakage CO2 emissions from fossil fuel combustion” (EB32, Annex 09).
• “Tool to calculate project emissions from electricity consumption, version 01 (EB 32, annex 10). B.2 Justification of the choice of the methodology and why it is applicable to the project activity: >> The project activity is the partial replacement of fossil fuels with biomass residues (De oiled Cake (DOC), saw dust, mehandi, damaged wheat, rice husk, etc.) in cement manufacturing. In the absence of the project activity, the current practice of using fossil fuels would have been followed for clinker production and the alternate fuels would have been burnt in an uncontrollable manner without utilizing its energy for useful purpose. The applicability of methodology is justified as following: Sr No Applicability Criteria 1. A significant investment is
required to enable the use of the alternative fuel(s) and/or the less carbon intensive fossil fuel(s)
Project proponent invested more than INR 13.233 million to proceed with the project activity.
2. During the last three years prior to the start of the project activity, no alternative fuels have been used in the project plant
Project proponent has been using carbon intensive fuels such as coal, lignite, pet coke, etc. for clinker production since inception and no alternative fuels have been used in the last 3 years prior to the start of project activity.
3. CO2 emissions reduction relates to CO2 emissions generated from fuel burning requirements only
For the estimation of CO2 emissions reduction, the reduced emissions due to fuel burning requirements are taken into account. The reduction in CO2 emissions of

PROJECT DESIGN DOCUMENT FORM (CDM PDD) - Version 03.1. CDM – Executive Board page 8
and is unrelated to the CO2 emissions from decarbonisation of raw materials (i.e. CaCO3 and MgCO3 bearing minerals)
clinkerisation process due to use of alternative fuels are not taken into account.
4. The methodology is applicable only for installed capacity (expressed in tonnes clinker/year) that exists by the time of validation of the project activity
The plant has consent for 2 MTPA clinker production. The project activity has not resulted in increasing the production and project proponent will not claim emission reduction based on production increase in excess of 2 MTPA (if any) in future. The emission reduction calculations are based on the clinker production capacity 1992762 tons clinker per year.
5. In case of project activities using biomass residues or renewable biomass, the biomass is not chemically processed (e.g. esterification to produce bio diesel, production of alcohols from biomass, etc) prior to combustion in the project plant but it may be processed mechanically or dried at the project site. Moreover, any processing of biomass, occurring before use in the project activity, does not cause other significant GHG emissions (such as, for example, methane emissions from anaerobic treatment of waste water or from charcoal production.
The biomass residues are directly transported to the project site without any chemical processing at the alternate fuel supply site and project site, which will lead to emission of greenhouse gas emissions.
6. Dedicated plantation for renewable biomass
The project proponent is not using any renewable biomass and dedicated plantation for the project activity. This condition is not relevant to the project activity.
B.3. Description of the sources and gases included in the project boundary >>
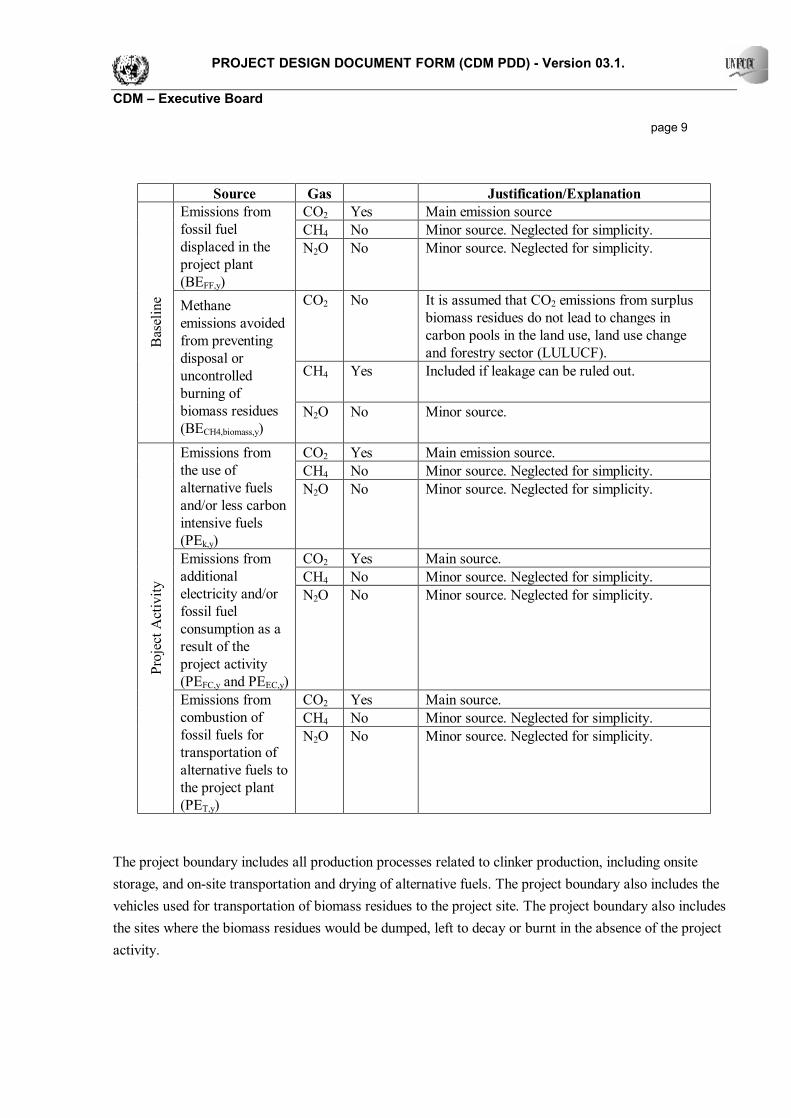
PROJECT DESIGN DOCUMENT FORM (CDM PDD) - Version 03.1. CDM – Executive Board page 9
Source Gas Justification/Explanation CO2 Yes Main emission source CH4 No Minor source. Neglected for simplicity.
Emissions from fossil fuel displaced in the project plant (BEFF,y)
N2O No Minor source. Neglected for simplicity.
CO2 No It is assumed that CO2 emissions from surplus biomass residues do not lead to changes in carbon pools in the land use, land use change and forestry sector (LULUCF).
CH4 Yes Included if leakage can be ruled out.
Bas
elin
e Methane emissions avoided from preventing disposal or uncontrolled burning of biomass residues (BECH4,biomass,y)
N2O No Minor source.
CO2 Yes Main emission source. CH4 No Minor source. Neglected for simplicity.
Emissions from the use of alternative fuels and/or less carbon intensive fuels (PEk,y)
N2O No Minor source. Neglected for simplicity.
CO2 Yes Main source. CH4 No Minor source. Neglected for simplicity.
Emissions from additional electricity and/or fossil fuel consumption as a result of the project activity (PEFC,y and PEEC,y)
N2O No Minor source. Neglected for simplicity.
CO2 Yes Main source. CH4 No Minor source. Neglected for simplicity.
Proj
ect A
ctiv
ity
Emissions from combustion of fossil fuels for transportation of alternative fuels to the project plant (PET,y)
N2O No Minor source. Neglected for simplicity.
The project boundary includes all production processes related to clinker production, including onsite storage, and on-site transportation and drying of alternative fuels. The project boundary also includes the vehicles used for transportation of biomass residues to the project site. The project boundary also includes the sites where the biomass residues would be dumped, left to decay or burnt in the absence of the project activity.

PROJECT DESIGN DOCUMENT FORM (CDM PDD) - Version 03.1. CDM – Executive Board page 10 B.4. Description of how the baseline scenario is identified and description of the identified baseline scenario: >> As per the approved methodology, ‘Combined tool to identify the baseline scenario and demonstrate additionality’ version 2.1 (EB 28) is used. Baseline Scenario Selection Step 1: Identification of alternative scenarios Step 1a: Define alternative scenarios to the proposed CDM project activity Scenario Description of the baseline scenario Applicability of the scenario F1 The proposed project activity not The use of alternate fuels not undertaken as a
Calciner and kiln of Cement manufacturing plant
Alternate fuel storage
Alternate fuel conveyor
Fossil Fuels
Transportation of alternate fuel from various sources
Project Boundary
Biomass residue burning site
Pre-Heater and pre-calciner
Input Material for Clinker Production

PROJECT DESIGN DOCUMENT FORM (CDM PDD) - Version 03.1. CDM – Executive Board page 11 Scenario Description of the baseline scenario Applicability of the scenario
undertaken as a CDM project activity (i.e. use of alternative fuels and/or less carbon intensive fossil fuels).
CDM project activity can be a baseline scenario. The scenario is discussed in detail below.
F2 Define a continuation of current practice scenario, i.e., a scenario in which the company continues cement production using the existing technology, materials and fuel mix. Quantify the amount of fossil fuel(s) that would be used for clinker production over the project period.
The project proponent has been successfully using the existing technology and fuel mix from the inception of the plant. In the absence of the proposed project activity, the project proponent would have continued the existing practice of coal, lignite and pet coke usage in the kiln, for clinker production without investing into alternative fuel firing system. This scenario can be a baseline scenario. The scenario is discussed in detail below.
F3 Define scenario(s) reflecting the likely evolving fuel mix portfolios, and relative prices of fuels available. The scenario(s) may be based on one fuel or a different mixes of fuels. Quantify the amount of fossil fuel(s) that is expected to be used for clinker production over the project period.
The evolving fuel mix scenarios in Indian industry include use of fuels like Natural gas, Oil, etc. Although use of different fuel is evolving, cement industry in particular does not use alternatives to fossil fuel as evident from Cement Manufacturer’s Association (CMA) statistics. Unavailability of gas in the region and lack of infrastructure like pipeline for transporting gas makes natural gas as not an obvious choice for firing in kilns. Recent trends in global oil prices shows large upward variations in the prices hence cannot be considered an economical alternative in absence of the project activity.
F4 The currently used fuels are partially substituted with alternative fuels and/or less carbon intensive fossil fuels other than those used in the CDM project activity and/or any other fuel types, without using the CDM. If relevant, develop different scenarios with
Project proponent is using biomass residues like DOC, saw dust, mehandi, damaged wheat, rice husk, etc. as alternate fuels. Other alternate fuels which are presently used in the cement industry are waste tires and municipal solid waste (MSW). The plants using waste tires or MSW as alternate fuels have also applied for CDM

PROJECT DESIGN DOCUMENT FORM (CDM PDD) - Version 03.1. CDM – Executive Board page 12 Scenario Description of the baseline scenario Applicability of the scenario
different mixes of alternative fuels or less carbon intensive fuels and varying degrees of fuel-switch from traditional to alternative fuels or less carbon intensive fuels.
registration, implying that the use of such fuels cannot be a baseline scenario. Moreover BCL also faces the issues of quality and availability with the use of these fuels.
F5 The construction and operation of a new cement plant.
This scenario is practically not possible therefore this is not applicable.
Waste originating from fossil sources as an alternative fuel The project proponent is not using any wastes from fossil sources as alternative fuel, so this scenario is not relevant. Biomass used as an alternate fuel B1 The biomass residues are dumped or
left to decay under mainly aerobic conditions. This applies, for example, to dumping and decay of biomass residues on fields.
In the absence of project activity the biomass residues might have been dumped or left to decay under mainly aerobic conditions, so this can be a possible alternate to the use of biomass residues for the project activity.
B2 The biomass residues are dumped or left to decay under clearly anaerobic conditions. This applies, for example, to deep landfills with more than 5 meters. This does not apply to biomass residues that are stock-piled or left to decay on fields.
In the absence of project activity the biomass residues might have been dumped or left to decay under clearly anaerobic conditions, so this can be a possible alternate to the use of biomass residues for the project activity.
B3 The biomass residues are burnt in an uncontrolled manner without utilizing them for energy purposes.
In the absence of the project activity, the biomass might be burnt in an uncontrolled manner without utilizing energy for useful purpose, so this can be a possible alternate to the project activity.
B4 The biomass residues are sold to other consumers in the market and used by these consumers, such as for heat and/or electricity generation, for the generation of biofuels, as feedstock in processes (e.g. the pulp and paper
As such there is no established market for biomass residues, and they are mainly not used for any useful applications. A small percentage of these biomass residues might have been used for heat or electricity generation or as a feedstock, but this cannot be called a common

PROJECT DESIGN DOCUMENT FORM (CDM PDD) - Version 03.1. CDM – Executive Board page 13 Scenario Description of the baseline scenario Applicability of the scenario
industry), as fertilizer, etc. practice in the region. So this cannot be an alternate to the project activity.
B5 The biomass residues are used for other purposes at the project site, such as for heat and/or electricity generation, for the generation of biofuels, as feedstock in processes (e.g. the pulp and paper industry), as fertilizer, etc.
The project proponent is not using biomass residues at the project site for any of the applications listed, except for use in kiln i.e the project activity. So this is not an alternative to the project activity.
B6 The proposed project activity, not undertaken as a CDM project activity, i.e. the use of the biomass residue in the project plant.
The proposed project activity cannot be taken without taken CDM, as this project activity facing barriers which is explained in barrier analysis.
Renewable biomass plantation No biomass is being planted for this project activity
R1 No establishment of a dedicated plantation and thus no generation of renewable biomass
There is no establishment of a dedicated plantation for this activity. Therefore other scenarios are not applicable. Only this scenario can be the plausible baseline scenario.
As discussed above, the plausible baseline scenarios for the project activity are, Scenario F1: Proposed project activity not undertaken as a CDM project activity Scenario F2: Continuation of current practice scenario and the plausible alternatives for the use of biomass residues are B1, B2 & B3. Being conservative, alternative B2 i.e. “the biomass residues are dumped or left to decay under clearly anaerobic conditions. This applies, for example, to deep landfills with more than 5 meters. This does not apply to biomass residues that are stock-piled or left to decay on fields”, is ruled out as this alternative will give highest baseline emissions for the project activity. As per the methodology, baseline emissions for the alternate B1 & B3 would be calculated assuming that the biomass residues would be burnt in an uncontrolled manner without utilizing them for energy purposes, so the plausible alternatives chosen are B1 and/or B3. Scenario Description: Scenario F1: Proposed project activity not undertaken as a CDM project activity

PROJECT DESIGN DOCUMENT FORM (CDM PDD) - Version 03.1. CDM – Executive Board page 14 This project is BCL’s voluntary initiative for green house gas reduction through utilization of biomass residues by taking into account relevant policies and regulations. There is no regulation or policies to use the alternative fuels in the cement manufacturing in the host country. The premier cement industry associations in India, such as Cement Manufacturers Association (CMA) and National Council for Cement and Building Materials (NCCBM) have not made it compulsory for cement industries in India to use biomass residue as fuel in cement kilns. The project proponent has proposed to implement the project over and above the national and sectoral requirements. The fuel mix expected during the crediting period is given below:
Table 2: Fossil fuel and alternative fuel proportion during the project period
Year Coal Pet coke Lignite Alternate Fuel 2008-09 85.6% 3.0% 3.4% 8.0% 2009-10 85.6% 3.0% 3.4% 8.0% 2010-11 85.6% 3.0% 3.4% 8.0% 2011-12 85.6% 3.0% 3.4% 8.0% 2012-13 85.6% 3.0% 3.4% 8.0% 2013-14 85.6% 3.0% 3.4% 8.0% 2014-15 85.6% 3.0% 3.4% 8.0% 2015-16 85.6% 3.0% 3.4% 8.0% 2016-17 85.6% 3.0% 3.4% 8.0% 2017-18 85.6% 3.0% 3.4% 8.0%
The expected fuel mix has been estimated using actual fuel consumption in the plant for the past 2 years i.e 2004-05 & 2005-06. Baseline scenario F2: Continuation of current practice scenario BCL was using the coal, lignite and pet coke in the cement manufacturing process before the project activity. The fuel feeding and clinker manufacturing system in the BCL was only capable to use fossil fuel. The BCL fuel consumption mix before the activity is provided below:
Table 3: Fuel mix in the Binani cement before the project activity
Year 2003-2004

PROJECT DESIGN DOCUMENT FORM (CDM PDD) - Version 03.1. CDM – Executive Board page 15
Coal used (ton) 199118
% Coal used 90.30%
Lignite used (ton) 1200
% Lignite used 0.5%
Pet coke used (ton) 20195
% Pet coke used 9.2%
In the absence of the project activity the BCL plant will consume the same fuel mix as in baseline scenario. The fuel mix projections in the crediting period are shown in table 4.
Table 4: Expected fossil fuel use in Binani cement during the crediting period
Year Coal Lignite Pet coke 2008-09 90.30% 0.5% 9.2% 2009-10 90.30% 0.5% 9.2% 2010-11 90.30% 0.5% 9.2% 2011-12 90.30% 0.5% 9.2% 2012-13 90.30% 0.5% 9.2% 2013-14 90.30% 0.5% 9.2% 2014-15 90.30% 0.5% 9.2% 2015-16 90.30% 0.5% 9.2% 2016-17 90.30% 0.5% 9.2% 2017-18 90.30% 0.5% 9.2%
Sub Step 1b: Consistency with mandatory applicable laws and regulations All the above alternatives are in line with the applicable legal and regulatory requirements. Step 2: Barrier Analysis Sub Step 2a: Identify barriers that would prevent the implementation of alternative scenarios The barrier identified for the alternatives are as below:

PROJECT DESIGN DOCUMENT FORM (CDM PDD) - Version 03.1. CDM – Executive Board page 16
Table 5: Barrier analysis Alternative scenario Investment
barriers Technological barriers
Barriers due to prevailing practices
Other barriers
Scenario F1 High capital investment.
A no of trials are required to streamline the project activity, loss of production.
The mindset of operators is a problem. The operators are not familiar with the alternate fuel feeding system and hence there are inhibitions to operate the plant. This scenario will also face the barriers due to prevailing practices.
No
Scenario F2 No initial capital investment required. In the absence of the project activity this is a most likely scenario.
No technological barriers. The plant will operate with this scenario in absence of the project activity.
This is the prevailing practice. No barriers.
No
Sub Step 2b: Eliminate alternative scenarios which are prevented by the identified barriers As discussed above, there are barriers to scenario F1, although not prohibitive in nature, and scenario F2 doesn’t face any barriers. Step3: Investment Analysis Identification of financial indicator: For conducting the investment analysis unit cost of service i.e cost per unit of energy supplied is chosen as the financial indicator. Both the alternatives don’t generate any

PROJECT DESIGN DOCUMENT FORM (CDM PDD) - Version 03.1. CDM – Executive Board page 17 revenue and one of the alternatives i.e. scenario F1 involves additional expenditure, so a simple fuel cost analysis has been done as per the guidance provided by the “combined tool to identify baseline scenario and demonstrate additionality”. The cost per unit of energy supplied will be calculated for fuel mix for current practice scenario and the proposed project activity, based on the calorific value and price per ton of fuel. Though the project proponent has incurred additional costs in terms of capital investment, administration expenses, etc. the same have not been included in the analysis. The average landed price of the fuel for 3 years i.e 2004-05 & 2005-06 have been used for the analysis. Similarly the calorific values used for analysis are the average for the same years. The simple cost analysis is shown as below: Scenario F1:
Particulars Units Value Fuel Mix
Coal % 85.60% Lignite % 3.40%
Pet Coke % 3.00% Alternate fuel % 8.00%
Calorific Value Coal Kcal/kg 6091
Lignite Kcal/kg 3605 Pet coke Kcal/kg 7931
Alternate fuel Kcal/kg 4032 Cost Rs/ton
Coal Rs/ton 3298 Lignite Rs/ton 1301
Pet Coke Rs/ton 3154 Alternate fuel Rs/ton 2185
Total Heat Supplied GJ/ton 24.7 Total Cost of Fuel Rs./ton 3137.0 Unit Cost of Energy Rs./GJ 127.1
Scenario F2:
Particulars Units 2003-04 Coal consumed for clinker production Tons 199118 Lignite consumed for clinker production Tons 1200

PROJECT DESIGN DOCUMENT FORM (CDM PDD) - Version 03.1. CDM – Executive Board page 18
Petcoke consumed for clinker production Tons 20195 Fuel Mix
Coal % 90.3% Lignite % 0.5%
Pet Coke % 9.2% Calorific Value
Coal Kcal/kg 6091 Lignite Kcal/kg 3605
Pet coke Kcal/kg 7931 Cost Rs/ton
Coal Rs/ton 3298 Lignite Rs/ton 1301
Pet Coke Rs/ton 3154 Total Heat Supplied GJ 5765793 Total Cost of fuel Rs. 722012886 Unit cost of energy Rs./GJ 125.2
As evident from above the unit cost of energy in scenario F1 is Rs. 127.1 per GJ as compared to Rs. 125.2 per GJ in case of scenario F2 i.e approximately 1.5% higher than scenario F2. Apart from incurring higher operational costs, the project proponent has incurred an expense of INR 13.23 million to install and commission alternate fuel feeding system. The project proponent also plans to build a storage shed for alternate fuel at a cost of approx INR 10 million. NPV (Net Present Value) analysis of the project activity will show a negative NPV, as compared to the current practice scenario, which will have zero capital investment and zero additional operating cost and hence zero NPV. Hence, scenario F2, i.e continuation of current practice scenario is the most economically attractive scenario and is chosen as the baseline scenario. The parameters and data source for the baseline scenario estimation is given in the table 6 below:
Table 6: Parameters required for baseline scenario
S. No. Parameter Data Source 1 Clinker production Manufacturing plant (BCL) 2 Fossil fuel consumption in the baseline year Manufacturing plant (BCL) 3 Fuel mix in baseline Calculated

PROJECT DESIGN DOCUMENT FORM (CDM PDD) - Version 03.1. CDM – Executive Board page 19 The last step i.e. common practice analysis, to demonstrate additionality of the project is being addressed in the following section. B.5. Description of how the anthropogenic emissions of GHG by sources are reduced below those that would have occurred in the absence of the registered CDM project activity (assessment and demonstration of additionality): >> >> Step 4: Common Practice Analysis
As already indicated in analysis that the use of biomass residues as alternate fuels is not the most common in Indian cement industry due to several reasons, there is less likelihood of getting such examples. The project is not a common practice in Indian Cement industry. Based on the CMA1 data currently no cement industry is using the alternative fuel. The cement industries which have started using alternate fuel have already applied for CDM registration. BCL is one of the few cement companies which has started the use of the alternate fuels.
It is evident that due to capital and operating additional costs, investment and technical barrier associated with the project activity, the project activity has less likelihood to happen without CDM registration. There is no incentive available from any association to use the alternative fuels in cement industry. BCL is one of the pioneers in cement industry to start the project activity. Therefore the project activity is not a common practice and is hence additional. B.6. Emission reductions: >>
B.6.1. Explanation of methodological choices: >>
1. Baseline emissions
The baseline emission of the project activity is calculated as follows:
ybiomassCHyFFy BEBEBE ,,4, += BEy = Baseline emissions in year y (tCO2) BEFF,y = Baseline emission from fossil fuels displaced by alternative fuels or less
carbon intensive fossil fuels in year y (tCO2) BECH4,biomass,y = Baseline methane emissions avoided during the year y from preventing disposal or uncontrolled burning of biomass residues (tCO2e)
Baseline emissions are determined in the following steps:
1 Cement Statistics 2005, Cement manufacturing association, India

PROJECT DESIGN DOCUMENT FORM (CDM PDD) - Version 03.1. CDM – Executive Board page 20 Step 1: Estimate the project specific “fuel penalty” Step 2: Calculate baseline emissions from the fossil fuels displaced by the alternative or less carbon intensive fuel(s) Step 3: Calculate baseline emissions from decay, dumping or burning of biomass residues Step 1: Estimation of project specific moisture penalty The project specific moisture will be calculated as follows:
)( ker,,ker,ker, BLClinyPJclinycliny SECSECPFP −×= FPy = Fuel penalty in year y (GJ) Pclinker,y = Production of clinker in year y (tons) SECclinker,PJ,y = Specific energy consumption of the project plant in year y (GJ/t clinker) SECclinker,BL = Specific energy consumption of the project plant in the absence of the project activity (GJ/t clinker) The specific energy consumption of the project plant is calculated as follows:
yclin
kjkykPJyiyiPJ
iyPJClin P
NCVFCNCVFCSEC
ker,
,,,,,,
,ker,
)()(( ∑∑ ×+×=
Where: SECclinker,PJ,y = Specific energy consumption of the project plant in year y (GJ/t clinker) FCPJ,i,y = Quantity of fossil fuel type i fired in the project plant in year y (tons) NCVi,y = Net calorific value of the fossil fuel type i in year y (GJ/ton) FCPJ,k,y = Quantity of alternative fuel or less carbon intensive fossil fuel type k used in the project plant in year y (tons) NCVk,y = Net calorific value of the alternative or less carbon intensive fuel type k in year y (GJ/tonne) Pclinker,y = Production of clinker in year y (tons) k = Alternative fuel types and less carbon intensive fossil fuel types used in the project plant in year y i = Fossil fuel types used in the project plant in year y that are not less carbon intensive fossil fuel types On conservative basis, the baseline will be calculated by taking the least value of the annual average specific energy consumption for the last three years

PROJECT DESIGN DOCUMENT FORM (CDM PDD) - Version 03.1. CDM – Executive Board page 21
Where: SECclinker,BL = Specific energy consumption of the project plant in the absence of the project activity (GJ/t clinker) HGx = Heat generated from fuel combustion in the project plant in the historical year x (GJ) FCi,x = Quantity of fossil fuel type i used in the project plant in year x (tons) NCVi = Net calorific value of the fossil fuel type i (GJ/ton) Pclinker,x = Production of clinker in year x (tons) x = Year prior to the start of the project activity i = Fossil fuel types used in the project plant in the last three years prior to the start of the project activity Step 2: Calculation of baseline emissions from the fossil fuels displaced by the alternative or less carbon intensive fuel(s)
Where: BEFF,y = Baseline emission from fossil fuels displaced by alternative fuels or less carbon intensive fossil fuels in year y (tCO2) FCPJ,k,y = Quantity of alternative fuel or less carbon intensive fossil fuel type k used in the project plant in year y (tons) NCVk,y = Net calorific value of the alternative or less carbon intensive fuel type k in year y (GJ/tonne) FPy = Fuel penalty in year y (GJ)
=
−
−
−
−
2ker,
2
1ker,
1
ker,ker, ,,
xclin
x
xclin
x
xclin
xBLclin P
HGP
HGP
HGMINSEC
ii
xiX NCVFCHG ×= ∑ ,
yBLCOyykk
ykPJyFF EFFPNCVFCBE ,,2,,,, )( ×
−×= ∑

PROJECT DESIGN DOCUMENT FORM (CDM PDD) - Version 03.1. CDM – Executive Board page 22 EFCO2,BL,y = Carbon dioxide emissions factor for the fossil fuels displaced by the use of alternative fuels or less carbon intensive fossil fuels in the project plant in year y (tCO2/GJ) k = Alternative fuel types and less carbon intensive fossil fuel types used in the project plant in year y The emission factor will be calculated using the following two equations and lowest value will be considered for the calculation. Equation no: 1
ii
xixixi
iFFCOii
xixixi
yCOBLNCVFCFCFC
EFNCVFCFCFCEF
×++
×++=
∑
∑
−−
×−−
)(
)((
,1,2,
,,2,1,2,
,2,
EFCO2,BL,y = Carbon dioxide emissions factor for the fossil fuels displaced by the use of alternative fuels or less carbon intensive fossil fuels in the project plant in year y (tCO2/GJ) FCi,x = Quantity of fossil fuel type i used in the project plant in year x (tons) NCVi = Net calorific value of the fossil fuel type i (GJ/ton) EFCO2,FF,i CO2 emission factor for fossil fuel type i (tCO2/GJ) x = Year prior to the start of the project activity i = Fossil fuel types used in the project plant in the last three years prior to the start of the project activity Equation no: 2
ii
yiPJ
iFFCOii
yiPJ
yCOBL NCVFC
EFNCVFCEF
×
××=
∑
∑
,,
,,2,,
,2,
(
Where: EFCO2,BL,y = Carbon dioxide emissions factor for the fossil fuels displaced by the use of alternative fuels or less carbon intensive fossil fuels in the project plant in year y (tCO2/GJ) FCPJ,i,y = Quantity of fossil fuel type i fired in the project plant in year y (tons) NCVi,y = Net calorific value of the fossil fuel type i in year y (GJ/ton)

PROJECT DESIGN DOCUMENT FORM (CDM PDD) - Version 03.1. CDM – Executive Board page 23 EFCO2,FF,i,y = Carbon dioxide emission factor for fossil fuel type i in year y (tCO2/GJ) i = Fossil fuel types used in the project plant in year y that are not less carbon intensive fossil fuel types Step 3: Calculation of baseline emission from decay, dumping or burning of biomass residues The baseline methane emission will be calculated as follows:
yBCHyBBCHybiomassCH BEBEBE ,2,4,3/1,4,,4 += BECH4,biomass,y = Baseline methane emissions avoided during the year y from preventing disposal or uncontrolled burning of biomass residues (tCO2e) BECH4,B1/B3,y = Baseline methane emissions avoided during the year y from aerobic decay and/or uncontrolled burning of biomass residues (tCO2e) BECH4,B2,y = Baseline methane emissions avoided during the year y from anaerobic decay of biomass residues at a solid waste disposal site (tCO2e) Emission due to uncontrolled burning will be calculated using the following calculation
ykCHburningk
ykPJCHyBBCH EFFCGWPBE ,,4,,,4,3/1,4 ×= ∑×
BECH4,B1/B3,y = Baseline methane emissions avoided during the year y from aerobic decay and/or uncontrolled burning of biomass residues (tCO2e) GWPCH4 = Global Warming Potential of methane valid for the commitment period (tCO2e/tCH4) FCPJ,k,y = Quantity of alternative fuel or less carbon intensive fossil fuel type k used in the project plant in year y (tons) EFburning,CH4,k,y = CH4 emission factor for uncontrolled burning of the biomass residue type k during the year y (tCH4/tonne) K = Types of biomass residues used as alternative fuel in the project plant in year y for which the identified baseline scenario is B1 or B3 and for which leakage effects could be ruled out with one of the approaches L1, L2 or L3 described in the leakage section Anaerobic decay of the biomass residues is not considered for the project activity since it is not applicable.

PROJECT DESIGN DOCUMENT FORM (CDM PDD) - Version 03.1. CDM – Executive Board page 24 Project Emissions
yBCyTyECyFCyky PEPEPEPEPEPE ,,,,, ++++= PEy = Project emissions during the year y (tCO2e) PEk,y = Project emissions from combustion of alternative fuels and/or less carbon intensive fossil fuels in the project plant in year y (tCO2) PEFC,y = Project emissions from additional fossil fuel combustion as a result of the project activity in year y (tCO2) PEEC,y = Project emissions from additional electricity consumption as a result of the project activity in year y (tCO2) PET,y = CO2 emissions during the year y due to transport of alternative fuels to the project plant (tCO2) PEBC,y = Project emissions from the cultivation of renewable biomass at the dedicated plantation in year y (tCO2e) Step1: Project emissions due to the burning of alternate fuels
PEk,y = Project emissions from combustion of alternative fuels and/or less carbon intensive fossil fuels in the project plant in year y (tCO2) FCPJ,k,y = Quantity of alternative fuel or less carbon intensive fossil fuel type k used in the project plant in year y (tons) EFCO2,k,y = Carbon dioxide emissions factor for alternative or less carbon intensive fossil fuels type k in year y (tCO2/GJ) NCVk,y = Net calorific value of the alternative or less carbon intensive fossil fuel type k in year y (GJ/tonne) k = Alternative fuel types and less carbon intensive fossil fuel types used in the project plant in year y
ykCOykk
ykPJyk EFNCVFCPE ,,2,,,, ×
×= ∑

PROJECT DESIGN DOCUMENT FORM (CDM PDD) - Version 03.1. CDM – Executive Board page 25 Step 2: Project emissions due to additional electricity consumption/fossil fuel consumption The emissions will be calculated based on the additional electricity consumption and fossil fuel consumption in the plant multiplied with corresponding emission factor. Step 3: Project emission due to transportation of alternative fuels
PET,y = CO2 emissions during the year y due to transport of alternative fuels to the project plant (tCO2/yr) Ny = No. of truck trips AVDy = Average return trip distance of the alternate fuel site to the project site (km) EFCO2,FF,i,y = CO2 emission factor for fossil fuel type i in year y (tCO2/km) i = Fossil fuel types used for transportation of alternative fuels to the project plant in year y Step 4: Project emission due to dedicated plantations This is not applicable to the project activity. Hence the same is not considered for project emission calculation 3. Leakage Emissions The project proponent will use one of the approaches (L1, L2 & L3), mentioned in the leakage section of the chosen methodology, to rule out leakage. In case the leakage cannot be ruled out the emission due to leakage will be calculated as
yFFyBRy LEPELE ,, += LEy = Leakage emissions during the year y (tCO2e/yr) LEBR,y = Leakage emissions related to the use of biomass residues during the year y (tCO2) LEFF,upstream,y = Upstream leakage emissions from fossil fuel use in year y (tCO2e) Where
yiFFCOyyyT EFAVDNPE ,,,2, ××=

PROJECT DESIGN DOCUMENT FORM (CDM PDD) - Version 03.1. CDM – Executive Board page 26
∑ ××=k
ykykPJLECOyBR NCVFCEFLE ,,,,2,
LEBR,y = Leakage emissions during the year y (tCO2/yr) EFCO2,LE = CO2 emission factor of the most carbon intensive fuel used in the country (tCO2/GJ) FCPJ,k,y = Quantity of biomass residue type k used in the project plant in year y (tons) NCVk,y = Net calorific value of the biomass residue type k in year y (GJ/ton of dry matter) k = Types of biomass residues for which leakage effects could not be ruled out with one of the approaches L1, L2 or L3 above Leakage due to upstream emissions is not applicable to this project activity, therefore it is not considered for emission reduction calculation.
B.6.2. Data and parameters that are available at validation: Data / Parameter: FCi,x, FCi,x-1 and FCi,x-2 Data unit: Tons Description: Quantity of fossil fuel of type I used in the project plant in year x, x-1 and x-2
where x is the year prior to the start of the project activity and i are the fossil fuel types used in the project plant in the last three years prior to the start of the project activity
Source of data used: Three years data from fuel consumption data logs at the project site Value applied: Particulars Units 2001-02 2002-03 2003-04
Coal Tons 207046 215585 199118 Lignite Tons 5309 5756 1200 Pet coke Tons 0 0 20195
Justification of the choice of data or description of measurement methods and procedures actually applied :
The data is based on online measurements & cross checked with fuel purchase records & stock changes.
Any comment: - Data / Parameter: Pclinker,x, Pclinker,x-1, Pclinker,x-2 Data unit: Tons Description: Production of clinker in year x, x-1, and x-2 where x is the year prior to the start
of the project activity
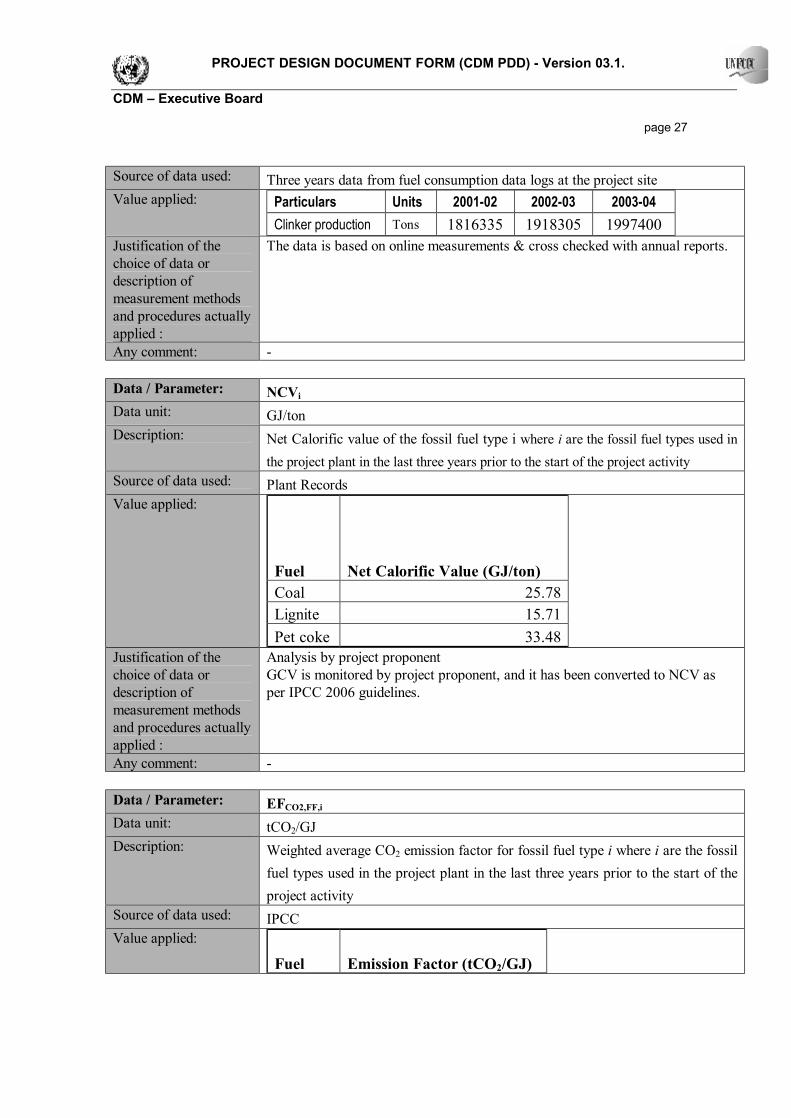
PROJECT DESIGN DOCUMENT FORM (CDM PDD) - Version 03.1. CDM – Executive Board page 27 Source of data used: Three years data from fuel consumption data logs at the project site Value applied: Particulars Units 2001-02 2002-03 2003-04
Clinker production Tons 1816335 1918305 1997400 Justification of the choice of data or description of measurement methods and procedures actually applied :
The data is based on online measurements & cross checked with annual reports.
Any comment: - Data / Parameter: NCVi Data unit: GJ/ton Description: Net Calorific value of the fossil fuel type i where i are the fossil fuel types used in
the project plant in the last three years prior to the start of the project activity Source of data used: Plant Records Value applied:
Fuel Net Calorific Value (GJ/ton) Coal 25.78 Lignite 15.71 Pet coke 33.48
Justification of the choice of data or description of measurement methods and procedures actually applied :
Analysis by project proponent GCV is monitored by project proponent, and it has been converted to NCV as per IPCC 2006 guidelines.
Any comment: - Data / Parameter: EFCO2,FF,i Data unit: tCO2/GJ Description: Weighted average CO2 emission factor for fossil fuel type i where i are the fossil
fuel types used in the project plant in the last three years prior to the start of the project activity
Source of data used: IPCC Value applied:
Fuel Emission Factor (tCO2/GJ)

PROJECT DESIGN DOCUMENT FORM (CDM PDD) - Version 03.1. CDM – Executive Board page 28
Coal 0.096 Lignite 0.101 Pet coke 0.975
Justification of the choice of data or description of measurement methods and procedures actually applied :
Default value from IPCC used for calculation of weighted average for the fossil fuels.
Any comment: - B.6.3 Ex-ante calculation of emission reductions:
>> Baseline Information
Fuel Net Calorific value (GJ/tonne)
Emission Factor (tCO2/GJ)
Baseline emission factor (tCO2/GJ)
Coal 25.78 0.096 Lignite 15.71 0.101 Pet coke 33.48 0.098 0.09621
S. No. Parameter Unit 2003-04 2002-03 2001-02 1 Clinker Production Ton 1997400 1918305 1816335 2 Fossil fuel used Coal Ton 199118 215585 207046 Lignite Ton 1200 5756 5309 Pet coke Ton 20195 0 0 Total Ton 220513 221341 212355 3 Heat generated GJ 5827623 5647523 5420387 4 Specific energy consumption GJ/t clinker 2.92 2.94 2.98 5 Specific energy consumption GJ/t clinker 2.92
Emission Reduction Calculations Parameter Unit Clinker production Tonnes/yr 1992762

PROJECT DESIGN DOCUMENT FORM (CDM PDD) - Version 03.1. CDM – Executive Board page 29 Baseline Emissions tCO2/yr 23352 Monitoring of emissions related to the use of alternative
fuels in kilns during the crediting period (for each type of fuels)
Quantity of alternative fuel used Biomass residue consumption Tonnes/yr 24000 NCV alternate fuel GJ/ton 16.89 NCV alternate fuel Kcal/kg 4034 Specific heat consumption using i% alternative fuel
GJ/ton 3.00
Specific heat consumption using fossil fuel only
GJ/ton 2.92
Total fuel penalty GJ/yr 172882 Baseline GHG emissions from fossil fuels displaced by the alternative fuels tCO2/yr 22359 Monitoring of emissions due to burning of biomass in the
field in the baseline scenario Biomass fuel which would have been burnt in absence of the project
Tonnes/yr
24000 Carbon released as CH4 in open air burning
tCH4/tonne
0.001971 GHG emissions due to biomass that would be burnt in the absence of the project
tCO2/yr
993 Project Emissions tCO2/yr 1121
Monitoring of emissions related additional fossil fuel & electricity consumption (on-site transportation and
drying of alternative fuels) Transportation of fuel used on-
site kg
NA Emission factor g CO2/kg NA Emission factor g CH4/kg NA Emission factor g N2O/kg NA
Electricity used for transportation of alternative fuel
kWh 256680
Emission factor of electricity used kg CO2/kwh 0.75
Fuel used for any drying of alternative fuels
Kg NA
Heating value for fuel used for drying alt. fuels
TJ/tonne NA
Emission factor for the fuel used for drying
tCO2/TJ NA

PROJECT DESIGN DOCUMENT FORM (CDM PDD) - Version 03.1. CDM – Executive Board page 30
Emissions from onsite transportation and drying
tCO2/yr 194
Monitoring of emissions due to off-site transport of fuels No of truck trips No 2400 Average distance for transport of alternative fuels
Km/truck 352
Emission factor tCO2 eq/ km 0.001097
Leakage resulting from transport of alternative fuels (tCO2/yr)
tCO2/yr 927
Leakage from transport of alternative fuel less leakage due to reduced transport of fossil fuel
tCO2/yr
927 Emission reduction tCO2/yr 22232
B.6.4 Summary of the ex-ante estimation of emission reductions: >>
Year Baseline Emissions (tCO2)
Project Emissions (tCO2)
Emission Reductions (tCO2)
2008 23353 1121 22232
2009 23353 1121 22232 2010 23353 1121 22232 2011 23353 1121 22232 2012 23353 1121 22232 2013 23353 1121 22232 2014 23353 1121 22232
2015 23353 1121 22232 2016 23353 1121 22232 2017 23353 1121 22232 Total 233530 11210 222320 Total No of Crediting Years 10
Average Annual Emission Reduction (tCO2)
22232
B.7 Application of the monitoring methodology and description of the monitoring plan:

PROJECT DESIGN DOCUMENT FORM (CDM PDD) - Version 03.1. CDM – Executive Board page 31
B.7.1 Data and parameters monitored:
Data / Parameter: FCPJ,k,y, FCPJ,i,y Data unit: Ton Description: Type & quantity of alternative fuels of type k and fossil fuels of type i used in the
project plant in year y Source of data to be used:
Plant records
Value of data applied for the purpose of calculating expected emission reductions in section B.5
Particulars Units Coal Tons 256800 Lignite Tons 10200 Pet coke Tons 9000 Alternate fuel Tons 24000
Description of measurement methods and procedures to be applied:
Data type: Measured Recording frequency: Monitored daily & reported monthly Data archiving policy: Paper/ Electronic Monitoring procedure: Online Flow meter and cross checked with purchase records & stock changes, third party audited records. Calibration frequency: annually
QA/QC procedures to be applied:
As per ISO 9001 or similar quality systems
Any comment: -
Data / Parameter: EFCO2,k,,y and EFCO2,FF,i,y Data unit: tCO2/GJ Description: Weighted average CO2 emission factor for alternative fuel of type k and fossil fuel
type i in year y Source of data to be used:
Local available data/ IPCC
Value of data applied for the purpose of calculating expected emission reductions in section B.5 Fuel
Emission Factor (tCO2/GJ)
Coal 0.096 Lignite 0.101 Pet coke 0.975 Alternate fuel 0
Description of measurement methods and procedures to be
Data type: Calculated Recording frequency: Annually Data archiving policy: Paper/ Electronic

PROJECT DESIGN DOCUMENT FORM (CDM PDD) - Version 03.1. CDM – Executive Board page 32 applied: Monitoring procedure: The weighted average will be calculated based on the
individual emission factors and the quantity of fuels consumed in the year. Individual emission factors will be obtained from published sources.
QA/QC procedures to be applied:
As per ISO 9001 or similar quality system.
Any comment: -
Data / Parameter: NCVk,,y, NCVi,,y Data unit: GJ/ton Description: Net calorific value of the alternate fuels of type k & fossil fuels of type i in year y Source of data to be used:
Local available data/ IPCC
Value of data applied for the purpose of calculating expected emission reductions in section B.5 Fuel
Net Calorific value (GJ/ton)
Coal 25.78 Lignite 15.71 Pet coke 33.48 Alternate Fuel 16.89
Description of measurement methods and procedures to be applied:
Data type: Measured/ Estimated Recording frequency: Annually Data archiving policy: Paper/ Electronic Monitoring procedure: The data will be obtained from Government authorised laboratory. In case the data is not available IPCC values will be used.
QA/QC procedures to be applied:
NABL certified laboratory will do the analysis.
Any comment: - Data / Parameter: PEFC,y Data unit: tCO2 Description: Project emissions from additional fossil fuel combustion as a result of the project
activity in year y Source of data to be used:
Calculated
Value of data applied for the purpose of calculating expected emission reductions in section B.5
0
Description of measurement methods
Data type: Calculated Recording frequency: Annually

PROJECT DESIGN DOCUMENT FORM (CDM PDD) - Version 03.1. CDM – Executive Board page 33 and procedures to be applied:
Data archiving policy: Paper/ Electronic Monitoring procedure: The parameter will be calculated from additional fossil fuel consumption, NCV & emission factor of the fossil fuel used.
QA/QC procedures to be applied:
As per ISO 9001 or similar quality system
Any comment: - Data / Parameter: PEEC,y Data unit: tCO2 Description: Project emissions from additional electricity consumption as a result of the project
activity in year y. Source of data to be used:
Calculated
Value of data applied for the purpose of calculating expected emission reductions in section B.5
194
Description of measurement methods and procedures to be applied:
Data type: Calculated Recording frequency: Annually Data archiving policy: Paper/ Electronic Monitoring procedure: The parameter will be calculated as per ‘Tool to calculate project emissions from electricity consumption’.
QA/QC procedures to be applied:
As per ISO 9001 or similar quality system.
Any comment: - Data / Parameter: EElect,y Data unit: kWh Description: Additional electricity consumption as a result of project activity for on site
transportation, drying, etc. in year y Source of data to be used:
Plant Records & electricity bill
Value of data applied for the purpose of calculating expected emission reductions in section B.5
256680
Description of measurement methods and procedures to be applied:
Data type: Measured/ Estimated Recording frequency: Continuously and reported annually. Data archiving policy: Paper/ Electronic Monitoring procedure: Online measurements for the equipments involved. In case direct monitoring is not possible the value will be estimated based on the equipment rating & operating hours.

PROJECT DESIGN DOCUMENT FORM (CDM PDD) - Version 03.1. CDM – Executive Board page 34
Calibration frequency: annually QA/QC procedures to be applied:
As per ISO 9001 or similar quality system
Any comment: - Data / Parameter: EFElect,y Data unit: kgCO2/kWh Description: Electricity combined emission factor Source of data to be used:
Published data
Value of data applied for the purpose of calculating expected emission reductions in section B.5
0.75
Description of measurement methods and procedures to be applied:
Data type: Estimated Recording frequency: Annually. Data archiving policy: Paper/ Electronic Monitoring procedure: Published literature by a third party like Central Electricity Agency, etc. will be used.
QA/QC procedures to be applied:
-
Any comment: - Data / Parameter: Ny Data unit: Dimensionless Description: Number of truck trips during the year y Source of data to be used:
Transportation data logs
Value of data applied for the purpose of calculating expected emission reductions in section B.5
2400
Description of measurement methods and procedures to be applied:
Data type: Measured/ Estimated Recording frequency: Continuously and summarized annually. Data archiving policy: Paper/ Electronic Monitoring procedure: As per transportation logs
QA/QC procedures to be applied:
-
Any comment: - Data / Parameter: AVDy

PROJECT DESIGN DOCUMENT FORM (CDM PDD) - Version 03.1. CDM – Executive Board page 35 Data unit: Km Description: Average round trip distance (from and to) between the alternative fuel supply sites and
the site of the project plant during the year y. Source of data to be used:
Transportation data logs
Value of data applied for the purpose of calculating expected emission reductions in section B.5
352
Description of measurement methods and procedures to be applied:
Data type: Measured/ Estimated Recording frequency: Continuously and summarized annually. Data archiving policy: Paper/ Electronic Monitoring procedure: Calculated based on distance provided by individual supplier and transportation logs.
QA/QC procedures to be applied:
Consistency of distance records provided by the truckers will be compared with recorded distances with other information from other sources (e.g. maps).
Any comment: - Data / Parameter: EFkm,CO2,,y Data unit: tCO2/km Description: Average CO2 emission factor for the truck measured during year y Source of data to be used:
Calculated using sample measurement of the fuel type, fuel consumption by the trucks and distance travelled by the trucks. National/ IPCC default values for NCV and emission factor for fuel type will be used. Alternatively, emission factors applicable for the truck types used from the literature in a conservative manner (i.e. the higher end within a plausible range) will be used.
Value of data applied for the purpose of calculating expected emission reductions in section B.5
0.001097
Description of measurement methods and procedures to be applied:
Data type: Estimated Recording frequency: Annually. Data archiving policy: Paper/ Electronic Monitoring procedure: As per above.
QA/QC procedures to be applied:
Cross check with published literature.
Any comment: - Data / Parameter: AFT,k,,y Data unit: Ton/year

PROJECT DESIGN DOCUMENT FORM (CDM PDD) - Version 03.1. CDM – Executive Board page 36 Description: Quantity of alternative fuel type k that has been transported to the project site during
the year y. Source of data to be used:
Transportation data logs
Value of data applied for the purpose of calculating expected emission reductions in section B.5
24000
Description of measurement methods and procedures to be applied:
Data type: Measured/ Estimated Recording frequency: Continuously and summarized annually. Data archiving policy: Paper/ Electronic Monitoring procedure: Base on online measurements and cross checked with purchase records and stock changes.
QA/QC procedures to be applied:
As per ISO 9001 or similar quality system.
Any comment: - Data / Parameter: Pclinker,y Data unit: Ton/year Description: Production of clinker in year y Source of data to be used:
Production data logs at the project site.
Value of data applied for the purpose of calculating expected emission reductions in section B.5
1992762
Description of measurement methods and procedures to be applied:
Data type: Measured/ Estimated Recording frequency: Continuously and summarized annually. Data archiving policy: Paper/ Electronic Monitoring procedure: Online measurement from weighing feeders & cross checked with annual reports. Calibration frequency: Annually
QA/QC procedures to be applied:
As per ISO 9001 or similar quality system.
Any comment: - Data / Parameter: EFCO2,BL,y Data unit: tCO2/GJ Description: Carbon dioxide emissions factor for the fossil fuels displaced by the use of alternative
fuels or less carbon intensive fossil fuels in the project plant Source of data to be used:
Calculated as follows as the lowest of the following CO2 emission factors: - the weighted average annual CO2 emission factor for the fossil fuel(s) consumed and

PROJECT DESIGN DOCUMENT FORM (CDM PDD) - Version 03.1. CDM – Executive Board page 37
monitored ex ante during the most recent three years before the start of the project activity; - the weighted average annual CO2 emission factor of the fossil fuel(s) consumed in the project plant in year y that are not less carbon intensive fossil fuels, -the weighted average annual CO2 emission factor for the fossil fuel(s) that would have been consumed according to fuel mix determined in “Procedure for the selection of the most plausible baseline scenario” above.
Value of data applied for the purpose of calculating expected emission reductions in section B.5
0.09621
Description of measurement methods and procedures to be applied:
Data type: Calculated Recording frequency: Annually. Data archiving policy: Paper/ Electronic Monitoring procedure: As per the procedure mentioned above.
QA/QC procedures to be applied:
As per ISO 9001 or similar quality system.
Any comment: - Data / Parameter: EFCCO2,LE Data unit: tCO2/GJ Description: Carbon dioxide emission factor of the most carbon intensive fuel used in the country. Source of data to be used:
National Communication/ literature sources/ IPCC
Value of data applied for the purpose of calculating expected emission reductions in section B.5
-
Description of measurement methods and procedures to be applied:
Reviewed annually.
QA/QC procedures to be applied:
Data type: Measured/ Estimated Recording frequency: Continuously and summarized annually. Data archiving policy: Paper/ Electronic Monitoring procedure: As per published literature
Any comment: Will be monitored in case leakage is not ruled out by any of the scenarios L1, L2 or L3.
Data / Parameter: FCBL,I,y Data unit: Ton

PROJECT DESIGN DOCUMENT FORM (CDM PDD) - Version 03.1. CDM – Executive Board page 38 Description: Quantity of fossil fuel type i displaced in the project plant as a result of the project
activity in year y. Source of data to be used:
The quantities and types of fossil fuels i that are displaced as a result of the project activity (FCBL,i,y) will be determined consistent with the guidance on the determination of the baseline CO2 emission factor (EFCO2,BL,y).
Value of data applied for the purpose of calculating expected emission reductions in section B.5
16957
Description of measurement methods and procedures to be applied:
Data type: Measured/ Estimated Recording frequency: Annually. Data archiving policy: Paper/ Electronic Monitoring procedure: As per the guidance provided by the methodology.
QA/QC procedures to be applied:
-
Any comment: - Data / Parameter: - Data unit: - Description: Demonstration that the biomass residue type k from a specific source would continue
not to be collected or utilized, e.g. by an assessment whether a market has emerged for that type of biomass residue (if yes, leakage is assumed not be ruled out) or by showing that it would still not be feasible to utilize the biomass residues for any purposes.
Source of data to be used:
Information from the site where the biomass is generated
Value of data applied for the purpose of calculating expected emission reductions in section B.5
-
Description of measurement methods and procedures to be applied:
Data type: Estimated Recording frequency: Annually. Data archiving policy: Paper/ Electronic Monitoring procedure: Independent surveys
QA/QC procedures to be applied:
-
Any comment: Monitoring of this parameter is applicable if approach L1 is used to rule out leakage Data / Parameter: - Data unit: Ton Description: Quantity of biomass residues of type k that are utilized (e.g. for energy generation or
as feedstock) in the defined geographical region Source of data to be Surveys or statistics

PROJECT DESIGN DOCUMENT FORM (CDM PDD) - Version 03.1. CDM – Executive Board page 39 used: Value of data applied for the purpose of calculating expected emission reductions in section B.5
-
Description of measurement methods and procedures to be applied:
Data type: Estimated Recording frequency: Annually. Data archiving policy: Paper/ Electronic Monitoring procedure: Based on independent survey or published statistics
QA/QC procedures to be applied:
-
Any comment: Monitoring of this parameter is applicable if approach L2 is used to rule out leakage Data / Parameter: - Data unit: Ton Description: Quantity of available biomass residues of type k in the region Source of data to be used:
Surveys or statistics
Value of data applied for the purpose of calculating expected emission reductions in section B.5
-
Description of measurement methods and procedures to be applied:
Data type: Estimated Recording frequency: Annually. Data archiving policy: Paper/ Electronic Monitoring procedure: Based on independent survey or published statistics
QA/QC procedures to be applied:
-
Any comment: Monitoring of this parameter is applicable if approach L2 is used to rule out leakage Data / Parameter: - Data unit: - Description: Availability of a surplus of biomass residue type k (which can not be sold or utilized)
at the ultimate supplier to the project and a representative sample of other suppliers in the defined geographical region.
Source of data to be used:
Surveys
Value of data applied for the purpose of calculating expected emission reductions in section B.5
-

PROJECT DESIGN DOCUMENT FORM (CDM PDD) - Version 03.1. CDM – Executive Board page 40 Description of measurement methods and procedures to be applied:
Data type: Estimated Recording frequency: Annually. Data archiving policy: Paper/ Electronic Monitoring procedure: Based on independent surveys.
QA/QC procedures to be applied:
-
Any comment: Monitoring of this parameter is applicable if approach L3 is used to rule out leakage Data / Parameter: EFburning,CH4,k,y Data unit: tCH4/ton of biomass Description: CH4 emission factor for uncontrolled burning of the biomass residue type k during the
year y Source of data to be used:
Measurements or referenced and reliable default values (e.g. IPCC)
Value of data applied for the purpose of calculating expected emission reductions in section B.5
0.0027
Description of measurement methods and procedures to be applied:
Data type: Estimated Recording frequency: Annually. Data archiving policy: Paper/ Electronic Monitoring procedure: As per the methodology.
QA/QC procedures to be applied:
Cross-check the results of any measurements with IPCC default values. If there is a significant difference, check the measurement method and increase the number of measurements in order to verify the results.
Any comment: -
B.7.2 Description of the monitoring plan: >> Emission monitoring and calculation procedure will follow the following organisational structure. All data and calculation formula required to proceed is given in the section B in PDD.
Organisational structure for monitoring plan
Vice President Operation
Dy. Manager Production

PROJECT DESIGN DOCUMENT FORM (CDM PDD) - Version 03.1. CDM – Executive Board page 41
Table 7: Monitoring and calculation activities and responsibility Monitoring and calculation activities
Procedure and responsibility
Data source and collection Data is taken from the purchase, materials and accounting system. Most of the data is available in ISO 9001 quality management system.
Frequency Monitoring frequency should be as per section B.7 of PDD. Review All received data is reviewed by the engineers in the technical cell. Data compilation All the data is compiled and stored in technical cell. Emission calculation Emission reduction calculations will be done annual based on the
data collected. Engineers of technical cell will do the calculations Review Dy. Manager will review the calculation. Emission data review Final calculations is reviewed and approved by VP operation. Record keeping All calculation and data record will be kept with the technical cell. B.8 Date of completion of the application of the baseline study and monitoring methodology and the name of the responsible person(s)/entity(ies) >> Date of completing the final draft of this baseline and monitoring methodology: 11/12/07 Name of person/entity determining the baseline: Binani Cement Limited and its associated consultants.
Monitoring Engineers (Technical Cell)

PROJECT DESIGN DOCUMENT FORM (CDM PDD) - Version 03.1. CDM – Executive Board page 42 SECTION C. Duration of the project activity / crediting period C.1 Duration of the project activity: C.1.1. Starting date of the project activity: >> 20/02/2004 C.1.2. Expected operational lifetime of the project activity: >> 20 years 0 months C.2 Choice of the crediting period and related information: C.2.1. Renewable crediting period >> Not applicable C.2.1.1. Starting date of the first crediting period: >> Not applicable C.2.1.2. Length of the first crediting period: >> Not applicable C.2.2. Fixed crediting period: C.2.2.1. Starting date: >> The starting date of crediting period will be the date of registration of the project activity. For calculation purposes 01/01/2008 is taken as date of starting of crediting period. C.2.2.2. Length: >> 10 years 0 months

PROJECT DESIGN DOCUMENT FORM (CDM PDD) - Version 03.1. CDM – Executive Board page 43 SECTION D. Environmental impacts >> D.1. Documentation on the analysis of the environmental impacts, including transboundary impacts: >> As per the Ministry of Environment and Forests (MoEF), Government of India, under the Environment Impact Assessment Notification (EIA) vide S.O. 1533 dated 14/09/062, the project under consideration does not require any EIA to be conducted. The BCL’s CDM project activity ensures maximum global and local benefits in relation to certain environmental and social issues and is a small step towards sustainable development. The project activity does not have any significant negative environmental impact at the site. The GHG emission reduction from project activity benefits the global environment. D.2. If environmental impacts are considered significant by the project participants or the host Party, please provide conclusions and all references to support documentation of an environmental impact assessment undertaken in accordance with the procedures as required by the host Party: >> Project activity does not lead to any significant negative environmental impact. Neither does the host country require EIA study to be conducted for this kind of projects. Unmanaged use of alternative fuel may lead to some dust emissions. BCL has installed proper fuel handling system for avoiding the dust emissions. The materials department ensures that the alternative fuel is transported in closed trucks or bags. The fuel transportation system is automated and covered and there is no chance for emissions. To ensure dust free operation, BCL has already installed bag filter in transfer point of alternate fuel feeding system and hence project activity has considered safeguards for environment and doesn’t cause any significant environmental impacts.
2 http://envfor.nic.in/legis/eia/so1533.pdf

PROJECT DESIGN DOCUMENT FORM (CDM PDD) - Version 03.1. CDM – Executive Board page 44
SECTION E. Stakeholders’ comments >> E.1. Brief description how comments by local stakeholders have been invited and compiled: >> The project activity by BCL is at their cement plant in Rajasthan. The project activity will use eco- friendly biomass residue as fuel. The various stakeholders identified for the project are as under. Ø Body of representatives administering the local area Ø Alternate fuel suppliers Ø Consultants Ø Plant employees Ø Equipment suppliers
BCL involved the concerned stakeholders and sought their comments for the project activity during the meeting held on 15.01.05 and minutes of meeting were duly recorded by the project proponent. E.2. Summary of the comments received: >> The project activity is environment friendly and creates business opportunity. The project activity has provided the proper waste utilisation system in developing country like India. The project proponent has not received any negative comment from any stakeholder. Local population stressed on the closed transportation of the alternate fuel from outside. The detailed minutes of meeting will be provided to the DOE at the time of validation. E.3. Report on how due account was taken of any comments received: >> There is no negative comment on the project activity.

PROJECT DESIGN DOCUMENT FORM (CDM PDD) - Version 03.1. CDM – Executive Board page 45
Annex 1
CONTACT INFORMATION ON PARTICIPANTS IN THE PROJECT ACTIVITY Organization: Binani Cement Limited Street/P.O.Box: Binanigram Building: City: Sirohi State/Region: Rajasthan Postfix/ZIP: 307025 Country: India Telephone: 02971-228280 FAX: 02971-225020 E-Mail: URL: Represented by: Title: Vice-President (Operations) Salutation: Mr Last Name: Lal Middle Name: First Name: Darshan Department: Operations Mobile: Direct FAX: Direct tel: Personal E-Mail: [email protected]

PROJECT DESIGN DOCUMENT FORM (CDM PDD) - Version 03.1. CDM – Executive Board page 46
Annex 2
INFORMATION REGARDING PUBLIC FUNDING
No public funding including ODA is available in this project.

PROJECT DESIGN DOCUMENT FORM (CDM PDD) - Version 03.1. CDM – Executive Board page 47
Annex 3
BASELINE INFORMATION The baseline information is attached as separate excel sheet with enclosure 1: CER calculation.
Annex 4
MONITORING INFORMATION
Monitoring will be done as per section B.7.2.
- - - - -