Embed Size (px)
Citation preview

PROJECT DESIGN DOCUMENT FORM (CDM-SSC-PDD) - Version 03
CDM – Executive Board
1
CLEAN DEVELOPMENT MECHANISM
PROJECT DESIGN DOCUMENT FORM (CDM-SSC-PDD)
Version 03 - in effect as of: 22 December 2006
CONTENTS
A. General description of the small scale project activity
B. Application of a baseline and monitoring methodology
C. Duration of the project activity / crediting period
D. Environmental impacts
E. Stakeholders‟ comments
Annexes
Annex 1: Contact information on participants in the proposed small scale project activity
Annex 2: Information regarding public funding
Annex 3: Baseline information
Annex 4: Monitoring Information

PROJECT DESIGN DOCUMENT FORM (CDM-SSC-PDD) - Version 03
CDM – Executive Board
2
Revision history of this document
Version
Number
Date Description and reason of revision
01 21 January
2003
Initial adoption
02 8 July 2005 The Board agreed to revise the CDM SSC PDD to reflect
guidance and clarifications provided by the Board since
version 01 of this document.
As a consequence, the guidelines for completing CDM SSC
PDD have been revised accordingly to version 2. The latest
version can be found at
<http://cdm.unfccc.int/Reference/Documents>.
03 22 December
2006 The Board agreed to revise the CDM project design
document for small-scale activities (CDM-SSC-PDD), taking
into account CDM-PDD and CDM-NM.

PROJECT DESIGN DOCUMENT FORM (CDM-SSC-PDD) - Version 03
CDM – Executive Board
3
SECTION A. General description of small-scale project activity
A.1 Title of the small-scale project activity:
Biomass based steam generation project by Sterling Agro Industries Ltd.
Version: 1.3
Date: 31/08/09
A.2. Description of the small-scale project activity:
Sterling Agro Industries Ltd. (Sterling) has undertaken a project activity, which entails thermal energy
generation using renewable fuels. The project activity is being implemented at Dairy products
manufacturing unit at Bhitouna, Kasganj-Soron Road, Dist-Kanshiram Nagar, Uttar Pradesh. The project
activity involves the installation of biomass based boiler with an installed capacity of 15 TPH avoiding
use of coal in steam generation. The main fuel (biomass) used is rice husk along with other agriculture
residues as available in the region.
In the absence of this project activity, equivalent amount of energy would have been generated from coal
based boiler which would spew the comparable amount of GHG into the atmosphere. Hence, the
implementation of this project activity leads to reduction in GHG emissions associated with the coal
based steam generation.
Project activity’s contribution to sustainable development:
The project activity contributes to the sustainable development in the following manner:
Social well being:
The project activity will result in lower GHG emissions to the surrounding environment and
improve the working conditions inside the plant premises as well as improving the local
environment for people living in close proximity.
The project activity will provide business opportunity for biomass suppliers, contractors, local
people etc.
Environmental well being:
Renewable biomass is used as a fuel in the project activity. Uses of renewable fuels will reduce
the GHG emission to the environment as compared to non-renewable fuels which have positive
emissions to the atmosphere.
The project activity will also reduce the pollution associated with the extraction and transport of
the fossil fuel.
Economic well being:
The project activity will create employment opportunities during the project stage and operation
and maintenance of the boiler.
The project activity will help in conservation of fast depleting natural resources like coal, thereby
contributing to the economic well being of country as a whole.
Technological well being:
PROJECT DESIGN DOCUMENT FORM (CDM-SSC-PDD) - Version 03
CDM – Executive Board
4
The project activity is expected to increase awareness and interest among the industry players to
make investments in similar areas.
The project activity is also expected to encourage technology providers in putting more R&D
efforts towards new and renewable technology development.
A.3. Project participants:
Name of Party involved ((host)
indicates a host Party)
Private and/or public
entity(ies) project participants
(as applicable)
Kindly indicate if the Party
involved wishes to be
considered as project
participant (Yes/No)
India Private entity:
Sterling Agro Industries Ltd.
No
A.4. Technical description of the small-scale project activity:
A.4.1. Location of the small-scale project activity:
A.4.1.1. Host Party(ies):
Country: India
A.4.1.2. Region/State/Province etc.:
State: Uttar Pradesh
A.4.1.3. City/Town/Community etc:
Village: Bhitouna
Dist: Kanshiram Nagar
State: Uttar Pradesh
A.4.1.4. Details of physical location, including information allowing the
unique identification of this small-scale project activity :
Kasganj is connected to the project site by state highway. Kasganj Bus Station is the nearest bus
terminal. Agra Civil Enclaves is the nearest airport. The geographical location of the plant is between
Longitude 78042‟00‟‟ East and Latitude 27
048‟00‟‟ North. Location is depicted in following maps-

PROJECT DESIGN DOCUMENT FORM (CDM-SSC-PDD) - Version 03
CDM – Executive Board
5
A.4.2. Type and category(ies) and technology/measure of the small-scale project activity:
The project activity is a small scale project activity and confirms to Appendix B of the simplified
modalities and procedures for small-scale CDM project activities.
TYPE I: Renewable Energy Projects,
Project location

PROJECT DESIGN DOCUMENT FORM (CDM-SSC-PDD) - Version 03
CDM – Executive Board
6
Category IC: “Thermal energy for the user with or without electricity”; Version 13, Sectoral Scope
01, EB-38 (dated 28th March 2008)
Reference:
http://cdm.unfccc.int/UserManagement/FileStorage/CDMWF_AM_YL0327DQSKVFXYQREWRT3VN
R58402G
Technology employed:
The project activity entails installation of biomass boiler for thermal energy generation. In the project
activity the project proponent will use renewable biomass (mainly rice husk along with other agriculture
residues) in the boiler for steam generation.
Technical specification of the boiler used in the project activity is as below –
Type Semi outdoor, Bi drum, water
tube, AFBC boiler
Capacity 15 TPH
Steam Pressure 21 kg/cm2
Steam Temperature Saturated
Make Cheema Boiler
The technology is environmentally safe and sound.
A.4.3 Estimated amount of emission reductions over the chosen crediting period:
Years Estimation of annual emission reductions
in tonnes of CO2 e
2009-2010 18289
2010-2011 18289
2011-2012 18289
2012-2013 18289
2013-2014 18289
2014-2015 18289
2015-2016 18289
2016-2017 18289
2017-2018 18289
2019-2020 18289
Total estimated reduction
(tonnes of CO2 e) 182890
Total number of crediting years 10
Annual average of the estimated reductions
over the crediting period
18289
A.4.4. Public funding of the small-scale project activity:

PROJECT DESIGN DOCUMENT FORM (CDM-SSC-PDD) - Version 03
CDM – Executive Board
7
The project activity does not involve any public funding from Annex-1 countries or through ODA
A.4.5. Confirmation that the small-scale project activity is not a debundled component of a
large scale project activity:
The project activity is not a de-bundled component of a large project activity as there is no registered
small scale project activity or application to register another project activity;
• with the same project participants
• in the same category and technology/measure; and
• whose project boundary is within 1 km of project boundary of the small scale project activity.
None of the above is applicable to the present project activity. Therefore, the project activity is not a
debundled component of a large scale project activity. This is first such project from project proponent
proposed under CDM.
SECTION B. Application of a baseline and monitoring methodology
B.1. Title and reference of the approved baseline and monitoring methodology applied to the
small-scale project activity:
Methodology:
Type I: Renewable Energy Projects
Category IC: “Thermal energy for the user with or without electricity”
Version 13
Sectoral Scope 01
EB-38
Dated 28th March 2008
Reference:
The list of the small-scale CDM project activity categories contained in Appendix B of the simplified
M&P for small-scale CDM project activities1.
B.2 Justification of the choice of the project category:
The position of the CDM project activity vis-à-vis applicability conditions in the AMS-I.C is described in
the following table. This methodology comprises renewable energy technologies that supply individual
households or users with thermal energy that displaces fossil fuels under the following conditions:
Applicability Conditions Position of the project activity vis-à-vis
applicability conditions
1 http://cdm.unfccc.int/UserManagement/FileStorage/CDMWF_AM_YL0327DQSKVFXYQREWRT3VNR58402G

PROJECT DESIGN DOCUMENT FORM (CDM-SSC-PDD) - Version 03
CDM – Executive Board
8
This category comprises renewable energy
technologies that supply individual households or
users with thermal energy that displaces fossil
fuels. Examples include solar thermal water heaters
and dryers, solar cookers, energy derived from
renewable biomass for water heating, space
heating, or drying, and other technologies that
provide thermal energy that displaces fossil fuel.
Biomass based co-generating systems that produce
heat and electricity are included in this category.
The project activity involves the installation of
renewable biomass based boiler that produces
steam for use in spray dryer and milk processing.
Where thermal generation capacity is specified by
the manufacturer, it shall be less than 45 MW.
The thermal generation capacity of the project
activity is only 9.83 MWthermal (refer annex-3).
For co-fired systems the aggregate installed
capacity (specified for fossil fuel use) of all
systems affected by the project activity shall not
exceed 45 MWth.
Cogeneration projects that displace/ avoid fossil
fuel consumption in the production of thermal
energy (e.g. steam or process heat) and/or
electricity shall use this methodology. The capacity
of the project in this case shall be the thermal
energy production capacity i.e., 45 MWth.
The thermal generation capacity of the project
activity is only 9.83 MWthermal (refer annex-3).
In the case of project activities that involve the
addition of renewable energy units at an existing
renewable energy facility, the total capacity of the
units added by the project should be lower than
45MWth and should be physically distinct from the
existing units.
The project activity is not the extension of an
existing renewable energy facility.
As demonstrated above the project activity satisfies the qualifying criteria of Type I: Renewable Energy
Projects and Category IC: “Thermal energy for the user with or without electricity”. Hence the
choice of project Type and category is justified.
B.3. Description of the project boundary:
“The physical, geographical site of the renewable energy generation delineates the project boundary”.
This project boundary includes the steam generating boiler and fuel storage area.
Project boundary is illustrated in the following diagram:

PROJECT DESIGN DOCUMENT FORM (CDM-SSC-PDD) - Version 03
CDM – Executive Board
9
B.4. Description of baseline and its development:
As per para 6 of the small scale methodology AMS I. C version 13, „For renewable energy technologies
that displace technologies using fossil fuels, the simplified baseline is the fuel consumption of the
technologies that would have been used in the absence of the project activity times an emission
coefficient for the fossil fuel displaced. IPCC default values for emission coefficients may be used.‟
The project proponent had following alternatives in order to generate steam:
1. Use of fossil fuels like coal, furnace oil and diesel as fuel source
2. Use of biomass (rice husk) as fuel source
The decision of fossil fuel that would have been used in the absence of project activity will be based on
the costs of various fuels options, i.e. fuel cost per unit of energy supplied.
The unit cost of various fuels options available for steam generation per unit of energy generation, are
shown below.
Fuel type Fuel NCV Fuel price Cost per unit of
energy
FO 0.0000404 TJ/Kg2 33 Rs./Kg
3 816831.683 Rs./TJ
Diesel 0.000043 TJ/Kg4 34.86 Rs./lt
5 988655.701 Rs./TJ
Coal 1.8828E-05 TJ/Kg6 4 Rs./Kg
7 212449.543 Rs./TJ
2 IPCC default value
3 http://www.bharatpetroleum.com/sbu/ind_comm/gen_petroprices.asp?from=ind
4 IPCC default value
5 http://www.iocl.com/products/HighSpeedDiesel.aspx
6 Plant Lab data
Biomass
source
Biomass
Storage
Boiler Steam to process
Project
boundary

PROJECT DESIGN DOCUMENT FORM (CDM-SSC-PDD) - Version 03
CDM – Executive Board
10
As is evident from above, coal has the lowest unit cost amongst all the fuel options available (It is
substantially low). Besides this, prior to the project activity project proponent has been using coal as fuel
to meet its steam requirements. Therefore coal has been chosen as the possible fuel alternatives for the
project activity.
Therefore coal and biomass (without CDM benefits) have been chosen as the possible fuel alternatives
for the project activity.
Now the project proponent had following alternatives in order to generate steam:
Alternative-1: Steam generation using coal
This alternative considers onsite generation of steam in a coal fired boiler.
Alternative-2: Steam generation using Biomass without CDM benefit
The decision of the plausible baseline for this project activity is based on the cost of unit energy
generation. The least levelized cost of unit energy generation will be taken as baseline option for the
project activity. The detailed explanation for the basis of unit cost analysis is given in section B.5. The
summary of the unit cost analysis has been discussed in the table below.
Parameter Unit Alternative-1:Steam
generation using coal
Alternative-2: Steam
generation using
biomass without CDM
benefit
Unit Cost Rs./ton of steam 669 773
As evident from the table above, Unit cost of steam generation for Alternative-2 is more than that in
Alternative -1 and hence it can be concluded that Alternative-1 would be the choice for steam generation
for the project proponent in the absence of the project activity. Besides this Alternative- 2 faces many
barriers (refer section B.5 of the document for additionality) and hence cannot become a plausible
baseline option for energy generation for the project proponent. Hence the most plausible baseline
scenario for this project activity is “Steam generation using coal”.
Since the project activity is using coal in the baseline for steam generation, therefore baseline emission is
calculated as per para 10 of the small scale methodology AMS I. C version 13.
According to the para 10, the baseline emission is calculated as per the equation below:
7 As per coal invoice
PROJECT DESIGN DOCUMENT FORM (CDM-SSC-PDD) - Version 03
CDM – Executive Board
11
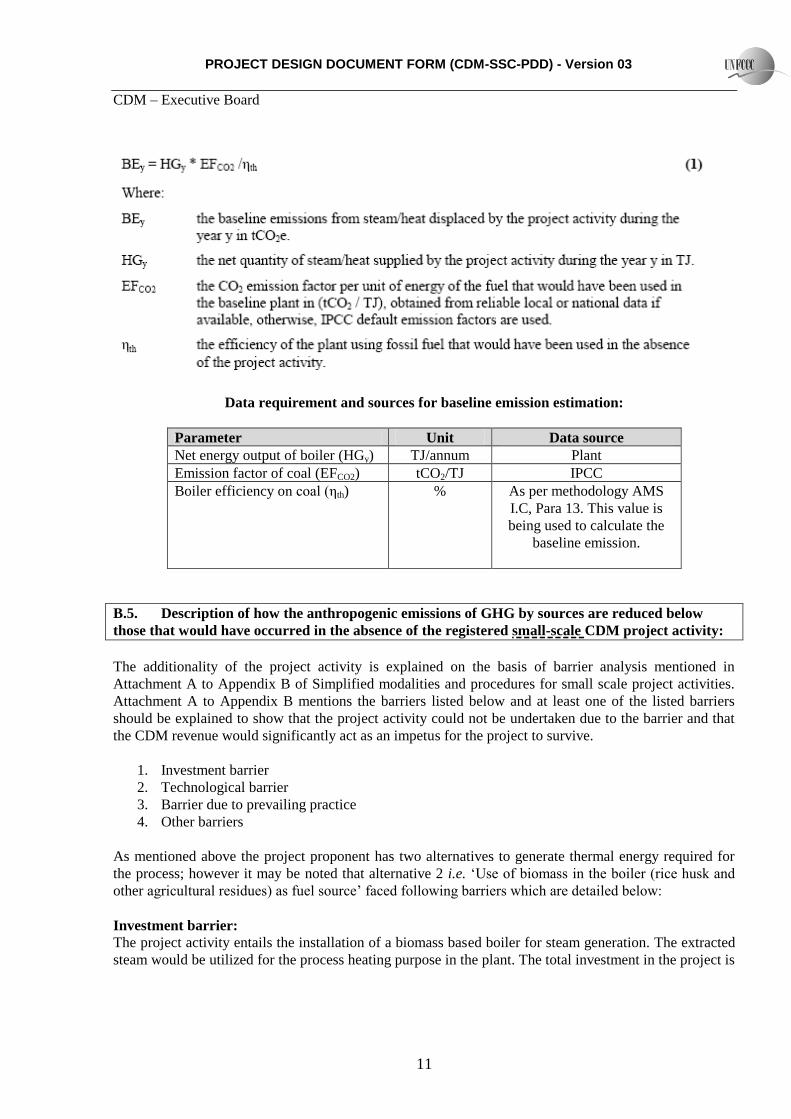
Data requirement and sources for baseline emission estimation:
Parameter Unit Data source
Net energy output of boiler (HGy) TJ/annum Plant
Emission factor of coal (EFCO2) tCO2/TJ IPCC
Boiler efficiency on coal (ηth) % As per methodology AMS
I.C, Para 13. This value is
being used to calculate the
baseline emission.
B.5. Description of how the anthropogenic emissions of GHG by sources are reduced below
those that would have occurred in the absence of the registered small-scale CDM project activity:
The additionality of the project activity is explained on the basis of barrier analysis mentioned in
Attachment A to Appendix B of Simplified modalities and procedures for small scale project activities.
Attachment A to Appendix B mentions the barriers listed below and at least one of the listed barriers
should be explained to show that the project activity could not be undertaken due to the barrier and that
the CDM revenue would significantly act as an impetus for the project to survive.
1. Investment barrier
2. Technological barrier
3. Barrier due to prevailing practice
4. Other barriers
As mentioned above the project proponent has two alternatives to generate thermal energy required for
the process; however it may be noted that alternative 2 i.e. „Use of biomass in the boiler (rice husk and
other agricultural residues) as fuel source‟ faced following barriers which are detailed below:
Investment barrier:
The project activity entails the installation of a biomass based boiler for steam generation. The extracted
steam would be utilized for the process heating purpose in the plant. The total investment in the project is

PROJECT DESIGN DOCUMENT FORM (CDM-SSC-PDD) - Version 03
CDM – Executive Board
12
approximately Rs. 183.45 Lacs8. This includes the cost of boiler and its accessories, civil works etc. Here
we would analyse the project financial viability in terms of fuel cost analysis. The fuel cost analysis has
been done based on unit cost of energy generation for biomass and the baseline scenario i.e. coal. In this
analysis we have considered the cost of project activity to be same for both the cases. The efficiency for
both the cases has been considered as per the purchase order of the boiler. Other factors e.g. required rate
of return on equity, insurance and depreciation rate have been considered to be the same for both the
cases for comparison. The landed cost of coal used in the baseline scenario has been taken from coal
invoice. The landed cost of biomass in project activity has been obtained from supplier‟s quotation.
The calorific values used for the unit cost analysis have been obtained from the plant laboratory. The
calorific values have been measured using a Bomb Calorimeter in the plant laboratory. The measured
calorific value of coal and biomass are in the range of 4500-4800 Kcal/Kg and 2200-2500Kcal/Kg
respectively. Therefore using a conservative approach, the lowest calorific value for coal and highest
calorific value for biomass has been considered in this analysis. The assumptions considered for the cost
comparison are tabulated below:
Financial parameters:
Description Details Remarks
Project cost
(Rs. Lacs)
183.45 The value is taken from DPR. It includes cost of Boiler, chimney work,
erection of boiler, ash handling system, civil works etc. This is
considered to be the same for both the alternatives.
Equity (%) 100% Considered same for both the alternatives.
O & M (%) 3.5% The value is taken from DPR. This is considered to be the same for both
the alternatives.
Cost of equity
(%)
14% The value is taken from DPR. This is considered to be the same for both
the alternatives.
Depreciation
(%)
4.5% The value is taken from DPR. This is considered to be the same for both
the alternatives.
Coal Price
(Rs./MT)
4000 The coal price as referred form the coal invoice is Rs. 3000/MT, but the
landed cost of coal is amount to Rs. 4000/MT as considered in the
financial analysis. The transportation cost has been taken to be Rs
1000/MT, which is a conservative estimate based on the invoice of Rs
660/MT.
Biomass price
(Rs./MT)
2500 As per Supplier quotation landed cost of biomass is Rs.2500-2550/MT.
Being conservative, we have taken Rs.2500/MT for cost comparison.
Technical parameters:
Description Details Remarks
Quantity of steam
generated (TPH)
15 As per Technical specification of the boiler
Pressure of steam
(Kg/cm2)
21 As per Technical specification of the boiler
Temperature of steam Saturated As per Technical specfication of the boiler
8 1 million = 10 lacs

PROJECT DESIGN DOCUMENT FORM (CDM-SSC-PDD) - Version 03
CDM – Executive Board
13
(Deg C)
Boiler efficiency (On
coal)
81% As per the applied methodology, Page 3, para 13,
Maximum efficiency of 100% of baseline coal based
boiler has been considered in emission reduction and to
be on more conservative side, the design efficiency 81%
of coal based boiler (As per offer for 15TPH coal fired
boiler from Cheema boiler) has been considered to
evaluate the project financial viability in terms of cost
comparison analysis.
Boiler efficiency (On
Biomass)
78% As per technical specification of the boiler
Coal calorific value 4500 Kcal/Kg Measured value. The calorific value has been measured
using a Bomb Calorimeter in the plant laboratory.
Biomass calorific value 2500 Kcal/Kg Measured value. The calorific value has been measured
using a Bomb Calorimeter in the plant laboratory.
Feed water inlet
temperature (Deg C)
105 The value is taken from Bureau of Energy Efficiency
(BEE) Handbook for boilers (Page no 49).
Plant Load Factor 70% The value is taken from DPR. This is considered to be
the same for both the alternatives.
Based on the values above, the cost comparison has been carried out for equivalent steam generation for
both the options. The comparison is shown below:
Parameter Unit Coal Based steam
generation
Biomass based steam
generation
Cost of equity Rs. (Lacs) 25.68 25.68
Depreciation Rs. (Lacs) 8.26 8.26
Total Fixed cost Rs. (Lacs) 33.94 33.94
Fuel cost Rs. (Lacs) 498.80 582.73
O & M cost Rs. (Lacs) 6.42 6.42
Total Variable cost Rs. (Lacs) 505.22 589.15
Total cost (Fixed +
Variable)
Rs. (Lacs) 539.16 623.09
Total steam generation TPA 80640 80640
Unit Cost Rs./ton 669 773
As demonstrated above the use of coal is the most cost effective option. It is evident from the table
above that the unit generation of energy using biomass as fuel is costlier than that a coal fired generation.
Hence the project activity is not a business-as-usual and not the baseline scenario.
Sensitivity Analysis: For the sensitivity analysis, the main uncertainties are cost of biomass and
efficiency of the biomass boiler.
Cost of Fuel: It has been observed that biomass prices increased significantly because of improper
collection mechanism, inconsistency in production, lake of a structured and established market etc.
The changes in unit cost of steam production with different fuel cost are shown in table below:

PROJECT DESIGN DOCUMENT FORM (CDM-SSC-PDD) - Version 03
CDM – Executive Board
14
Changes in unit cost of steam production with cost of fuel
Scenario Unit cost of steam production
On coal
Unit cost of steam production
On Biomass
Biomass price increased by 10%
and coal price remains constant
Rs. 669 Rs. 845
Coal price increased by 10% and
biomass price remains constant
Rs. 730 Rs. 773
Biomass price decreased by 10%
and coal price remains constant
Rs. 669 Rs. 701
Coal price decreased by 10% and
biomass price remains constant
Rs. 607 Rs. 771
Boiler efficiency: The efficiency of a boiler depends on various factors like bulk density of fuel, calorific
value, moisture content of fuel etc. The improper storage and transport of biomass and moisture content
in biomass more than normal in monsoon season adversely affect on the calorific value of biomass which
directly affect the performance of biomass based system and unit cost of energy generation. The changes
in unit cost of energy production with different efficiencies of boiler are tabulated below:
Changes in unit cost of steam production with efficiency of boiler
Scenario Unit cost of steam production
on Coal
Unit cost of steam production
on Biomass
Biomass boiler eff. increased by
10% and coal boiler eff. remains
constant
Rs. 669 Rs. 707
Coal boiler eff. increased by
10% and biomass boiler eff.
remains constant
Rs. 612 Rs. 773
Biomass boiler eff. decreased by
10% and coal boiler eff. remains
constant
Rs. 669 Rs. 853
Coal boiler eff. decreased by
10% and biomass boiler eff.
remains constant
Rs. 737 Rs. 773
The conclusion of the sensitivity analysis is that the unit cost of steam production is very sensitive to
boiler efficiency and fuel cost. For all analyzed cases, the unit cost of steam production in the project
activity is well above the unit cost of baseline scenario. Even in the case of a maximum decreased in
biomass price, the unit cost of steam production is well above the baseline scenario. In the case of
efficiency decreased or increased by 10%, the unit cost of energy production goes above unit cost of
energy generation in baseline scenario.
Technological barrier:
Biomass utilization in boiler does create some technical challenges. Such challenges may include
physical processing of the biomass for proper injection or feeding into the boiler, fireside performance of

PROJECT DESIGN DOCUMENT FORM (CDM-SSC-PDD) - Version 03
CDM – Executive Board
15
the biomass and its impact on flame stability, boiler heat exchanger surface fouling or slagging, and
corrosion. Ash deposition and boiler tube corrosion can also be an issue because biomass can contain
considerable alkali and alkaline-earth elements and chlorine which, when mixed with other gas
components promote a different array of vapor and fine particulate deposition in the boiler9.
The biomass based boiler installed in this project activity has lower efficiency as compared to coal based
boiler. The boiler efficiency offered by the technology supplier is in the range of 74-78% which is below
than the coal fired boiler (81-85%)10
. The efficiency difference would affect the fuel consumption rate in
boiler and hence it would cost more for the same energy output. The factors that affect the efficiency of a
boiler include bulk density of fuel, energy density of fuel and its calorific value. The low bulk density
and low energy density of biomass lowers the performance of a biomass based system11
. The tendency of
lower bulk density of biomass also translates into higher transportation cost and storage cost12
. Their
lower bulk density also means that special consideration must be given to storage, handling and feeding
them into combustion systems.
The other problems with biomass combustion are the higher level of moisture content and presence of
impurities. The moisture content of a single source of biomass fuel delivered to a plant can vary
significantly because of differences in factors such as harvesting, storage, transportation, and drying
conditions. The moisture content of biomass may also vary depending upon the season. In the monsoons,
the moisture content will be comparatively more as compared to the other seasons. The presence of
moisture more than normal would not only affect the performance of the boiler but also result in
increased effective cost of biomass and energy generation13
.
Again, the biomass procured is adulterated with impurities such as scrap materials, rock, dust particle,
metals, glass and other biomass such as leaves, straw etc. The presence of impurities may cause the
plugging and mechanical breakdown of boiler equipments. The presence of glass and metal may cause
sintering and fouling of boiler equipments14
. Presence of impurities can also provide incorrect estimates
of the biomass requirement for energy generation. In addition to this the effective cost of biomass is also
increased affecting project‟s viability.
Other barriers:
Seasonal availability of biomass:
The success of a biomass project mainly depends on the availability of biomass materials. Biomass
availability is highly subject to seasonal fluctuations due to the vagaries of nature. The other most
important aspect for sustainable availability of biomass to the project activity is proper management of
procurement, transportation and storage of biomass.
9 http://www.osti.gov/energycitations/servlets/purl/791079-K0YZWO/native/791079.PDF
10 Boiler purchase order
11 http://www.abe.psu.edu/extension/factsheets/h/H82.pdf
12 http://www.osti.gov/energycitations/servlets/purl/791079-K0YZWO/native/791079.PDF
13 http://www.soi.wide.ad.jp/class/20070041/slides/01/40.html
14 http://www.osti.gov/energycitations/servlets/purl/791079-K0YZWO/native/791079.PDF

PROJECT DESIGN DOCUMENT FORM (CDM-SSC-PDD) - Version 03
CDM – Executive Board
16
Procurement, transportation and price fluctuation of biomass: Procurement and transportation of
biomass in such a huge quantity (23309 MT/year) to the project site is a big constraint for project‟s
successful operation. This is because of factors like biomass is widely dispersed in small quantities and
absence of a formal market for continuous supply of biomass. These factors may not only create
availability issues but may also impact the prices of biomass severely. The procurement of biomass
would be a daunting task as it is involved the setting up of a system for the collection of biomass from
large number of sellers, since one single supplier cannot supply the quantity of biomass required for the
project activity. In addition to this, the cost of procurement will increase every year as per the trend in the
cost of labour.
Storage of biomass: The availability of biomass residues are season dependent. In India, it is largely
monsoon based. To ensure a sustainable supply of biomass to this project activity, adequate storage
facilities are required, which in turn occupied lots of space in the plant. The project activity has
proposed a storage area of 12,000 square meters. The storage area is depicted in the following picture.
Moreover, the characteristics of biomass fuel change quickly within a very short time, mainly the
calorific value decreases due to loss of volatiles15
, which adversely affects on the performance of the
boiler.
Summary:
As discussed in above sections, project activity can not be considered a natural choice for steam
generation. There are a number of barriers for such projects to come up. Besides, it is not the most cost
effective way for steam generation. However, CDM benefits accruing from the project activity would
support it financially and to some extent cover the risks involved.
CDM Consideration:
15 http://www.biomassenergycentre.org.uk/portal/page?_pageid=75,17306&_dad=portal&_schema=PORTAL

PROJECT DESIGN DOCUMENT FORM (CDM-SSC-PDD) - Version 03
CDM – Executive Board
17
As per the GUIDANCE ON THE DEMONSTRATION AND ASSESSMENT OF PRIOR
CONSIDERATION OF THE CDM –
(a) The project participant must indicate awareness of the CDM prior to the project activity start date,
and that the benefits of the CDM were a decisive factor in the decision to proceed with the project.
Evidence to support this would include, inter alia, minutes and/or notes related to the consideration of
the decision by the Board of Directors, or equivalent, of the project participant, to undertake the project
as a CDM project activity.
(b) The project participant must indicate, by means of reliable evidence, that continuing and real actions
were taken to secure CDM status for the project in parallel with its implementation. Evidence to support
this should include, inter alia, contracts with consultants for CDM/PDD/methodology services, Emission
Reduction Purchase Agreements or other documentation related to the sale of the potential CERs
(including correspondence with multilateral financial institutions or carbon funds), evidence of
agreements or negotiations with a DOE for validation services, submission of a new methodology to the
CDM Executive Board, publication in newspaper, interviews with DNA, earlier correspondence on the
project with the DNA or the UNFCCC secretariat;
Following demonstrates the serious consideration of CDM benefits by PP in implementation of the
project under discussion-
Sterling Agro Industries Ltd. seriously considered the CDM benefits before implementation of the
project. Following is the trail of events in the project activity -
Following are the timelines of the project –
-
S.N. Events Date
1 Preparation of Detailed project report December-2007
2 Offer from Cheema boiler for 15TPH
coal fired boiler.
05/01/2008
3 Offer from Cheema boiler for 15TPH
biomass fired boiler.
15/01/2008
4 Board decided to go ahead with CDM 18/01/2008
5 Purchase order placed for biomass fired
boiler
22/01/08
7 Offer from CDM advisor 08/04/08
8 Approval from director of boilers, U.P. 18/06/08
11 Engagement of CDM advisor 04/07/08
12 Consent to establish from director of
boilers
16/07/08
13 News Paper advertisement published
Rajpath in English (dated on 05/07/08).
Rajpath in Hindi (dated on 10/07/08)
Pravada (dated on 16/07/08)
14 Validation proposal from DOE 23/07/08
15 Engagement of DOE 30/07/08
16 PDD and PCN submitted to MoEF 22/08/08
17 Interviews with DNA 17/10/08

PROJECT DESIGN DOCUMENT FORM (CDM-SSC-PDD) - Version 03
CDM – Executive Board
18
18 PDD webhosting 23/10/08
19 Commissioning trial and Bank tube
damage
20/02/09
20 Validation site visit 19/03/09
21 Expected date of commissioning May-June 2009
The above information demonstrates that not only Project proponent considered CDM benefits during the
decision making process but also started the project registration process along with the implementation of
project.
B.6. Emission reductions:
B.6.1. Explanation of methodological choices:
As discussed in section B-4, the baseline for the project activity is steam generation using coal, therefore
baseline emission is calculated as per para 10 of the small scale methodology AMS I. C version 13.
Baseline emission (BEy):
According to the para 10, the baseline emission is calculated as per the equation below:
BEy = HGy * EFCO2 /ηth (1)
Where,
BEy the baseline emissions from steam displaced by the project activity during the year y in
tCO2e.
HGy the net quantity of steam supplied by the project activity during the year y in TJ.
EFCO2 the CO2 emission factor per unit of energy of the coal that would have been used in the
baseline plant in (tCO2 / TJ), IPCC default emission factor is used (96.1 tCO2/TJ).
ηth the efficiency of the boiler using coal that would have been used in the absence of the
project activity.
Project Emission (PEy):
There are no project activity emissions as this is a renewable project activity. However, small quantity of
fossil fuel would be used for start up the boiler and as co-firing in the project activity. Project emissions
on account of use of fossil fuel would be considered and monitored as per the “Tool to calculate project
or leakage CO2 emissions from fossil fuel combustion”, version-02, EB4116
.
Project Emissions due to Auxiliary Fuel (e.g. Coal) Consumption is estimated as per the following
equation:
16
http://cdm.unfccc.int/methodologies/Tools/meth_tool03_v02.pdf

PROJECT DESIGN DOCUMENT FORM (CDM-SSC-PDD) - Version 03
CDM – Executive Board
19
i
yiyjiyjFC COEFFCPE ,,,,, (2)
Where
PEFC,j,y Are the CO2 emissions from fossil fuel combustion in process j during the year y
(tCO2/yr)
FCi,j,y the quantity of fuel type i combusted in process j during the year y (mass or volume
unit/yr)
COEFi,y the CO2 emission coefficient of fuel type i in year y (tCO2/mass or volume unit)
i the fuel types combusted in process j during the year y
The CO2 emission coefficient COEFi,y is calculated based on net calorific value and CO2 emission factor
of the fuel type i, as follows:
yiCOyiyi EFNCVCOEF ,,2,, (3)
Where,
COEFi,y the CO2 emission coefficient of fuel type i in year y (tCO2/mass or volume unit)
NCVi,y the weighted average net calorific value of the fuel type i in year y (GJ/mass or volume
unit)
EFCO2,i,y the weighted average CO2 emission factor of fuel type i in year y (tCO2/GJ)
i the fuel types combusted in process j during the year y
Leakages (Ly):
A. As per the “General guidance on leakage in biomass project activities, Version 02, EB 28”
leakage estimation has been done as below:
The project activity proposes using surplus biomass (rice husk) available surplus in the region. The
guidance has highlighted three distinct possibilities of leakage in biomass usage.
Biomass type Activity/source Shift of pre-
project
activities
Emission from biomass
generation/cultivation
Competing use
of biomass
Biomass from
forest
Existing forest - - X
New forest X X -

PROJECT DESIGN DOCUMENT FORM (CDM-SSC-PDD) - Version 03
CDM – Executive Board
20
Biomass from
croplands or
grasslands
(woody or non
woody)
In the absence of
the project the land
would be used as
cropland/wastelan
d
X X -
In the absence of
the project activity
land would be
abandoned
- X -
Biomass residues
or wastes*
Biomass residues
or wastes are
collected and used
- - X
*Applicable to the project activity.
The project activity involves procurement of biomass residue available in the region. The biomass would
be procured from selected parts of Aligarh, Mathura, Agra, Hathras, Firozabad, Mainpuri, Bareilly and
Etah districts constituting Agra Mandal and area covered within 90 km radius from Etah district. For this
as per the guidance, the project participant shall evaluate annually if there is a surplus of the biomass in
the region of the project activity, which is not utilized. It will be demonstrated using published literature,
official reports, surveys etc. that the quantity of available biomass in the region, is at least 25% larger
than the quantity of biomass that is utilized including the project activity, then this source of leakage can
be neglected otherwise this leakage shall be estimated and deducted from the emission reductions.
There is enough biomass residue available in the region that goes unutilized and hence leakage emissions
on account of competing use of this biomass residue has not been considered. However, this will be
monitored annually which will be available during verification.
In case when the biomass residues available in the region is not at least 25% higher than the quantity of
biomass that is utilized including the project activity, following procedure would be adopted for
estimation of leakage-
Ly = EFCO2,LE * ∑BFk,y * NCVk (4)
Where;
Ly = Leakage emissions during year y, tCO2
EFCO2, LE = CO2 emission factor of the most carbon intensive fuel used in the country, tCO2/ GJ, National
Emission Factor Value (0.1062 tCO2/GJ for Lignite)17
BFk,y = Quantity of biomass residue k used in project activity not available in surplus in the region in
year y
NCVk = Net calorific value of biomass residue k, GJ/ tonne
17 http://www.cea.nic.in/planning/c%20and%20e/user_guide_ver3.pdf
PROJECT DESIGN DOCUMENT FORM (CDM-SSC-PDD) - Version 03
CDM – Executive Board
21
B. Leakage due to transfer of equipments to/ from the project activity
As per the methodology, if the equipment is transferred from another activity or if the existing equipment
is transferred to another activity, leakage is to be considered. The equipments installed in the project
activity are not transferred from any other activity. Besides, no existing equipment has been transferred
from the project site. Hence leakage for this part is zero.
C. Leakage due to transportation of biomass to the plant site
The project activity is not expected to cause any leakage emissions due to transportation of biomass;
rather it is expected to result in reduced leakage emissions due to reduced transportation of fuel. In the
pre-project scenario coal was procured from the mines located at a distance of around 300-350 kms from
the project site, where as in the post project scenario the project activity the biomass is procured from in
a region of max 100 kms from the project site. However being conservative the project proponent is not
claiming any emission reductions due to reduced fuel transportation.
Emission reduction (ERy):
The emission reduction achieved by the project activity will be the difference between the baseline
emission and the sum of the project emission and leakage.
ERy = BEy – (PEy + Ly) (5)
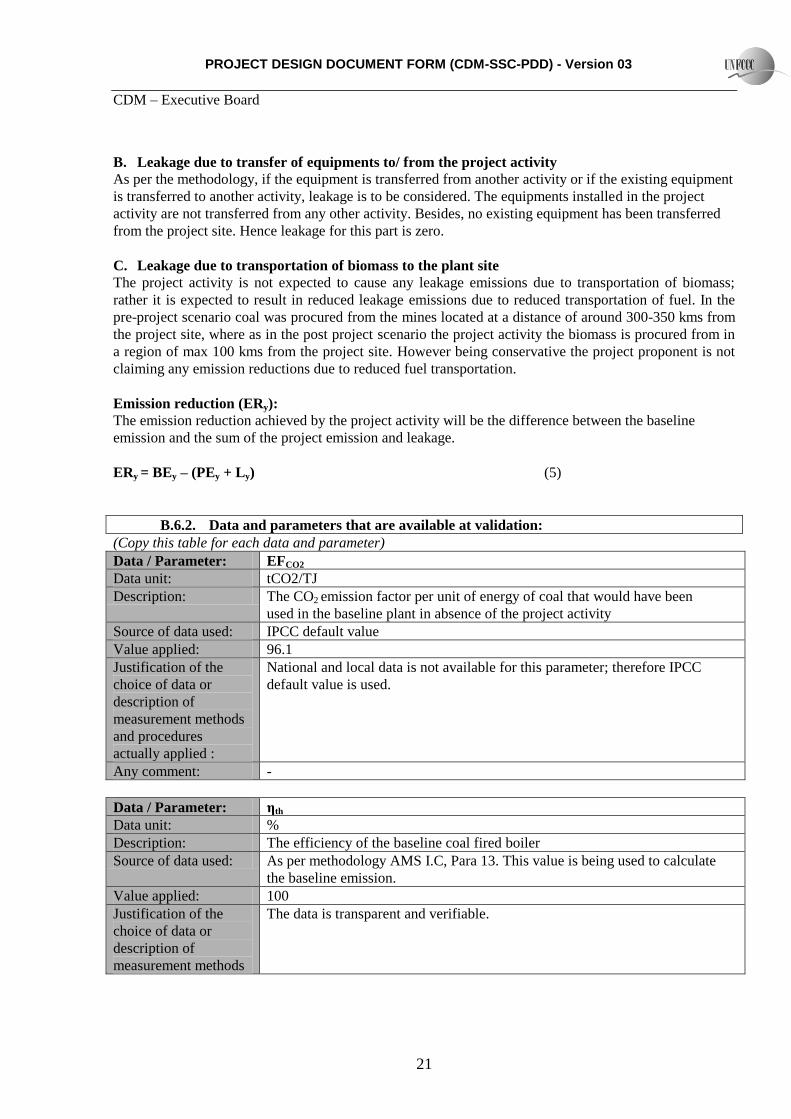
B.6.2. Data and parameters that are available at validation:
(Copy this table for each data and parameter)
Data / Parameter: EFCO2
Data unit: tCO2/TJ
Description: The CO2 emission factor per unit of energy of coal that would have been
used in the baseline plant in absence of the project activity
Source of data used: IPCC default value
Value applied: 96.1
Justification of the
choice of data or
description of
measurement methods
and procedures
actually applied :
National and local data is not available for this parameter; therefore IPCC
default value is used.
Any comment: -
Data / Parameter: ηth
Data unit: %
Description: The efficiency of the baseline coal fired boiler
Source of data used: As per methodology AMS I.C, Para 13. This value is being used to calculate
the baseline emission.
Value applied: 100
Justification of the
choice of data or
description of
measurement methods
The data is transparent and verifiable.

PROJECT DESIGN DOCUMENT FORM (CDM-SSC-PDD) - Version 03
CDM – Executive Board
22
and procedures
actually applied :
Any comment: -
B.6.3 Ex-ante calculation of emission reductions:
Baseline emission (BEy):
The baseline emission is calculated based on equation (1) described in section B.6.1 of this PDD:
Project Emission (PEy):
The project emission is calculated based on equation (2) described in section B.6.1 of this document:
Leakages (Ly):
As described in section B.6.1 of this document, the ex-ante estimation of Leakage emission is zero for the
project activity.
Emission reduction (ERy):
The emission reduction achieved by the project activity will be the difference between the baseline
emission and the sum of the project emission and leakage and is calculated based on equation (3) in
section B.6.1 of this document.
B.6.4 Summary of the ex-ante estimation of emission reductions:
Year Estimation of
project activity
emissions
(tCO2e)
Estimation of
baseline
emissions
(tCO2e)
Estimation of
leakage (tCO2e)
Estimation of
overall emission
reductions
(tCO2)
2009-10 0 18289 0 18289
2010-11 0 18289 0 18289
2011-12 0 18289 0 18289
2012-13 0 18289 0 18289
2013-14 0 18289 0 18289
2014-15 0 18289 0 18289
BEy = HGy * EFCO2 /ηth
BEy = 15TPH × 7680 hrs/annum × (2799.3 – 439.3) KJ/kg × 70% × 96.1 tCO2/TJ × 10-6
/ 100%
= 18289 tCO2/ annum
PE,y = 0 (For ex-ante estimation)
ERy = BEy – (PEy + Ly)
ERy = 18289 – (0 + 0) = 18289 tCO2/annum

PROJECT DESIGN DOCUMENT FORM (CDM-SSC-PDD) - Version 03
CDM – Executive Board
23
2015-16 0 18289 0 18289
2016-17 0 18289 0 18289
2017-18 0 18289 0 18289
2018-19 0 18289 0 18289
Total (tonnes of
CO2 e)
0 182890 0 182890
B.7 Application of a monitoring methodology and description of the monitoring plan:
B.7.1 Data and parameters monitored:
(Copy this table for each data and parameter)
Data / Parameter: Qsteam, i
Data unit: Tonne
Description: Quantity of steam generated
Source of data to be
used:
Onsite measurement
Value of data -
Description of
measurement methods
and procedures to be
applied:
Directly measured using steam flow meter. Data will be monitored on daily
basis.
QA/QC procedures to
be applied:
Steam flow meter will be calibrated/ checked annually as per manufacturer‟s
prescribed standards.
Any comment: -
Data / Parameter: Tsteam. i
Data unit: Degree C
Description: Temperature of the steam generated
Source of data to be
used:
On-site measurement
Value of data
Description of
measurement methods
and procedures to be
applied:
Measured using on-site temperature gauge. The data will be monitored on daily
basis.
QA/QC procedures to
be applied:
Gauge will be tested annually as per manufacturer‟s prescribed standards.
Any comment: -
Data / Parameter: Psteam, i
Data unit: Kg/cm2
Description: Pressure of the steam generated
Source of data to be
used:
On-site measurement
Value of data
PROJECT DESIGN DOCUMENT FORM (CDM-SSC-PDD) - Version 03
CDM – Executive Board
24
Description of
measurement methods
and procedures to be
applied:
Measured using on-site pressure gauge. The data will be monitored on daily
basis.
QA/QC procedures to
be applied:
Gauge will be tested annually as per manufacturer‟s prescribed standards.
Any comment: -
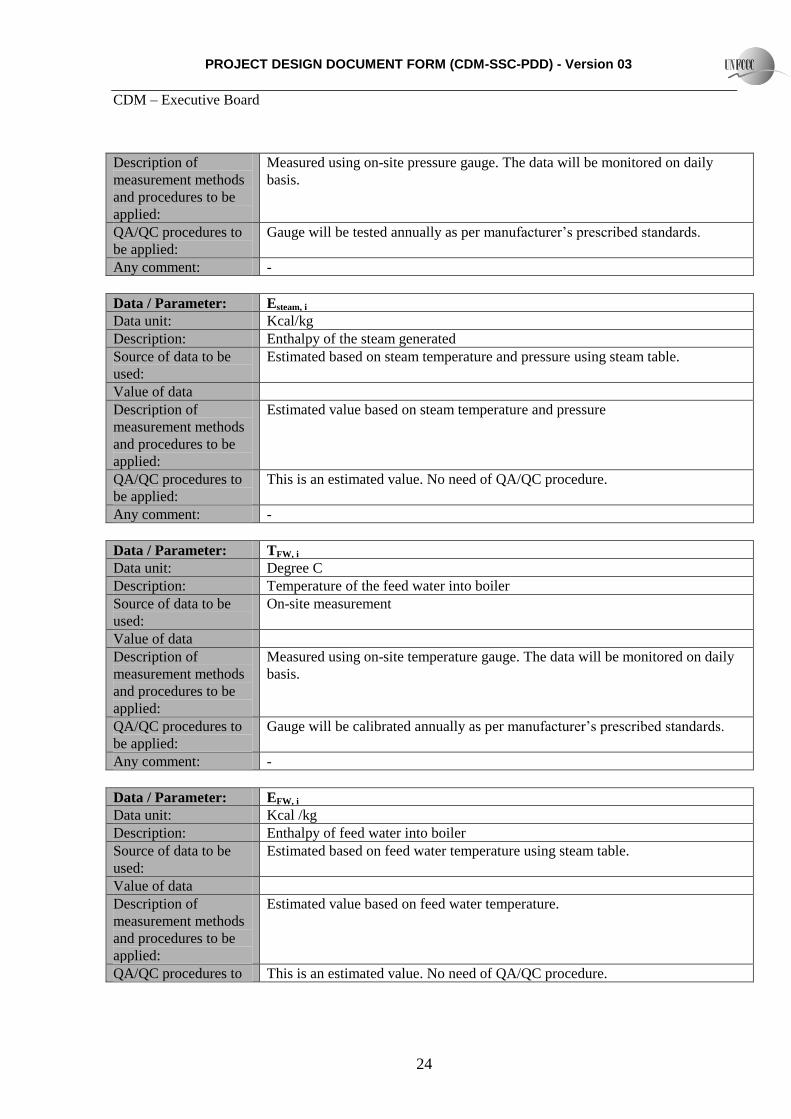
Data / Parameter: Esteam, i
Data unit: Kcal/kg
Description: Enthalpy of the steam generated
Source of data to be
used:
Estimated based on steam temperature and pressure using steam table.
Value of data
Description of
measurement methods
and procedures to be
applied:
Estimated value based on steam temperature and pressure
QA/QC procedures to
be applied:
This is an estimated value. No need of QA/QC procedure.
Any comment: -
Data / Parameter: TFW, i
Data unit: Degree C
Description: Temperature of the feed water into boiler
Source of data to be
used:
On-site measurement
Value of data
Description of
measurement methods
and procedures to be
applied:
Measured using on-site temperature gauge. The data will be monitored on daily
basis.
QA/QC procedures to
be applied:
Gauge will be calibrated annually as per manufacturer‟s prescribed standards.
Any comment: -
Data / Parameter: EFW, i
Data unit: Kcal /kg
Description: Enthalpy of feed water into boiler
Source of data to be
used:
Estimated based on feed water temperature using steam table.
Value of data
Description of
measurement methods
and procedures to be
applied:
Estimated value based on feed water temperature.
QA/QC procedures to This is an estimated value. No need of QA/QC procedure.

PROJECT DESIGN DOCUMENT FORM (CDM-SSC-PDD) - Version 03
CDM – Executive Board
25
be applied:
Any comment: -
Data / Parameter: Qbiomass, i,y
Data unit: Kg
Description: Quantity of biomass of type i combusted in year y
Source of data to be
used:
On-site measurement
Value of data
Description of
measurement methods
and procedures to be
applied:
Quantity of biomass used in project activity would be measured using weigh
scales and recorded in Log books.
QA/QC procedures to
be applied:
The data will be cross checked with the biomass procurement data.
Any comment: -
Data / Parameter: Qfossil, i,y
Data unit: Kg
Description: Quantity of fossil fuel of type i combusted in year y
Source of data to be
used:
On-site measurement
Value of data
Description of
measurement methods
and procedures to be
applied:
Quantity of fossil fuel used in project activity would be measured using weigh
scales and recorded in Log books.
QA/QC procedures to
be applied:
The data will be cross checked with the fossil fuel procurement data.
Any comment:
Data / Parameter: NCVbiomass, i
Data unit: KJ/kg
Description: Net calorific value of biomass of type i used
Source of data to be
used:
Plant laboratory
Value of data
Description of
measurement methods
and procedures to be
applied:
Measurement will be done in plant laboratory using Bomb calorimeter. The data
will be monitored annually. A bomb calorimeter is a type of constant-volume
calorimeter used in measuring the heat of combustion of a particular reaction.
Bomb calorimeters have to withstand the large pressure within the calorimeter as
the reaction is being measured. Electrical energy is used to ignite the fuel, as the
fuel is burning, it will heat up the surrounding air, which expands and escapes
through a tube that leads the air out of the calorimeter. When the air is escaping
through the copper tube it will also heat up the water outside the tube. The
temperature of the water allows for calculating calorie content of the fuel. The

PROJECT DESIGN DOCUMENT FORM (CDM-SSC-PDD) - Version 03
CDM – Executive Board
26
CV measured by the Bomb calorimeter is Gross Calorific value. The conversion
of GCV to NCV would be carried out by analyzing fuel characteristics and using
algorithm as per IPCC-2006 guidelines, Volume-2 (Energy), Chapter-
1(Introduction), page no-1.17.
QA/QC procedures to
be applied:
Bomb calorimeter will be calibrated annually as per manufacturer‟s prescribed
standards.
Any comment: -
Data / Parameter: NCVff, i
Data unit: KJ/kg
Description: Net calorific value of fossil fuel of type i used
Source of data to be
used:
Plant laboratory
Value of data
Description of
measurement methods
and procedures to be
applied:
Measurement will be done in plant laboratory using Bomb calorimeter. The data
will be monitored annually. Measurement will be done in plant laboratory using
Bomb calorimeter. The data will be monitored annually. A bomb calorimeter is a
type of constant-volume calorimeter used in measuring the heat of combustion of
a particular reaction. Bomb calorimeters have to withstand the large pressure
within the calorimeter as the reaction is being measured. Electrical energy is
used to ignite the fuel, as the fuel is burning, it will heat up the surrounding air,
which expands and escapes through a tube that leads the air out of the
calorimeter. When the air is escaping through the copper tube it will also heat up
the water outside the tube. The temperature of the water allows for calculating
calorie content of the fuel. The CV measured by the Bomb calorimeter is Gross
Calorific value. The conversion of GCV to NCV would be carried out by
analyzing fuel characteristics and using algorithm as per IPCC-2006 guidelines,
Volume-2 (Energy), Chapter-1(Introduction), page no-1.17.
QA/QC procedures to
be applied:
Bomb calorimeter will be calibrated annually as per manufacturer‟s prescribed
standards.
Any comment: -
Data / Parameter: Biomass availability
Data unit: Tonnes
Description: Surplus biomass availability in the region
Source of data to be
used:
To be based on publicly available reports on biomass availability in the region
from state or central Government agencies and/ or other institutions of repute OR
Sterling Agro Industries Ltd. would carry out its own assessment through
external experts/ in-house resources in case of non-availability of such
information otherwise.
The assessment would be done annually.
Value of data
Description of
measurement methods
and procedures to be
applied:
-
QA/QC procedures to No need of QA/QC procedure

PROJECT DESIGN DOCUMENT FORM (CDM-SSC-PDD) - Version 03
CDM – Executive Board
27
be applied:
Any comment: -
B.7.2 Description of the monitoring plan:
The project proponent has proposed the following structure for data monitoring, collection, data
archiving and calibration of equipments for this project activity. The team comprises of the following
members.
1. Head
2. Plant In-charge
3. Shift In-charge
Organisational Structure for Monitoring
Responsibilities of Head: Overall functioning and maintenance of the project activity.
Responsibilities of Plant In-charge: Responsibility for Maintains the data records, ensures
completeness of data, and reliability of data (calibration of equipments).
Responsibilities of Shift In-charge: Responsibility for day to day data collection and maintains day to
day log book for monitored data.
Personnel training: In order to ensure a proper functioning of the project activity and a properly
monitoring of emission reductions, the staff will be trained to enable them undertaking necessary tasks in
a transparent and credible approach. The operator personnel will be trained in equipment operation, data
recording, reports writing, operation and maintenance and emergency procedures in compliance with the
monitoring plan.
Data source: As per section B.7.1
Data collection and record keeping: Data will be collected at the plant operation site under the
supervision of the shift-in-charge and records will be maintained in daily logs. The reports are checked
periodically by the Plant In-charge and discussed thoroughly with the data monitoring personnel. A
separate log will also be maintained for the biomass supply on the site, its storage and usage in the
project activity.
Head
Plant In-charge
Shift In-charge

PROJECT DESIGN DOCUMENT FORM (CDM-SSC-PDD) - Version 03
CDM – Executive Board
28
Reliability of data collected: The reliability of the measuring equipments will be calibrated as per section
B.7.1. Documents pertaining to testing of equipments shall be maintained by Plant In-charge.
Frequency of monitoring: As per section B.7.1
Archiving of data: All data collected as part of monitoring should be archived in paper and be kept at
least for 2 years after the end of the last crediting period.
Maintenance of instruments and equipments: Instruments will be subject to regular maintenance and
cross-checking regime with a minimal frequency of once a year. The Operations Department shall be
responsible for the proper functioning of the equipments/ instruments and shall take a corrective action if
found not operating, as required.
Emergency preparedness: The project activity will not result in any unidentified activity that can result
in substantial emissions from the project activity. No need for emergency preparedness in data
monitoring is visualized.
Emission reduction calculation: Emission reduction calculations and monitoring report will be done
annually based on the data collected. This will be done by the team. The monitoring report and the
emission reduction calculation will be maintained by the head for verification.
B.8 Date of completion of the application of the baseline and monitoring methodology and the
name of the responsible person(s)/entity(ies)
The baseline and monitoring was completed on 23/07/2008 by the project proponent.
Sharad Saluja
Director
Sterling Agro Industries Limited (Also project participant)
11th Floor, Aggarwal Cyber Plaza 2,
Netaji Subhash Place, Pitampura,
New Delhi-110034 (India)
Phone: +91 11 47008000
Fax: +91 11 47008010
Mo: +91 9811345050
Email: [email protected]
SECTION C. Duration of the project activity / crediting period
C.1 Duration of the project activity:
C.1.1. Starting date of the project activity:
22/01/2008 (date of Purchase order of the biomass fired boiler)

PROJECT DESIGN DOCUMENT FORM (CDM-SSC-PDD) - Version 03
CDM – Executive Board
29
C.1.2. Expected operational lifetime of the project activity:
20 Years
C.2 Choice of the crediting period and related information:
C.2.1. Renewable crediting period
C.2.1.1. Starting date of the first crediting period:
NA
C.2.1.2. Length of the first crediting period:
NA
C.2.2. Fixed crediting period:
C.2.2.1. Starting date:
The start date of the crediting period is 01/10/2009 or a date not earlier than the date of registration of the
small scale project activity
C.2.2.2. Length:
10 years
SECTION D. Environmental impacts
D.1. If required by the host Party, documentation on the analysis of the environmental impacts
of the project activity:
According to Indian regulation, the implementation of Biomass based energy generation project does not
require an Environmental Impact Assessment (EIA). As per the Ministry of Environment and Forests
(MoEF), Government of India notification dated September 14th,
200618
regarding the requirement of EIA
studies as per the Environment Protection Rule, 1986 (MoEF, 2002) is not required for this project
activity.
The project activity involves the use of biomass residue as fuel for steam generation and displacement of
fossil fuels. There is no adverse impact by the project activity on air, water and soil. It has only positive
impacts in terms of GHG emission reduction.
18 http://envfor.nic.in/legis/eia/so1533.pdf

PROJECT DESIGN DOCUMENT FORM (CDM-SSC-PDD) - Version 03
CDM – Executive Board
30
D.2. If environmental impacts are considered significant by the project participants or the host
Party, please provide conclusions and all references to support documentation of an environmental
impact assessment undertaken in accordance with the procedures as required by the host Party:
Sterling Agro Industries Ltd. has fulfilled the requirements stipulated under state and central laws for
establishment of the biomass boiler.
SECTION E. Stakeholders’ comments
E.1. Brief description how comments by local stakeholders have been invited and compiled:
Stakeholder consultation for the project activity has been conducted to account for the views of the
people impacted either directly or indirectly due to the project activity. This has been carried out at all
levels of stakeholders –
A. District Magistrate
B. Local gram panchayat
C. Local community
The project proponent informed and requested all stakeholders about their views regarding the project
activity. A letter was sent to the District Magistrate,(Kasganj), Kashiram Nagar dated on 28/08/08 and
Gram Panchayats of Soron road, Kasganj, Kanshiram Nagar dated on 28/08/08 with the details of the
project activity and request for their suggestions. An advertisement was also published to inform local
people regarding the project activity. The newspaper advertisement describes in brief about the project
activity, the benefits associated with the project activity and ask for the views from local people.
A meeting was also held with villagers at the plant site on 28/08/08. Meeting presided with the brief
introduction of the Villagers and representatives and investors. Mr. Vimal Agrawal, Director, Sterling
Agro Industries Ltd. briefed about the agenda of the meetings and introduced the Global Warming,
Climate Change and CDM. He also explained about the project activity and how the identified project
fulfil the requirements of CDM and the purpose of meeting as to seek the concern, opinion and
suggestion of the villagers.
E.2. Summary of the comments received:
People participated with great enthusiasm and raised a few questions, which were answered to in an
appropriate manner by the project proponent. Summary of these comments is given as follows;
Queries and responses from the proponent and the stakeholders:
1. What are green house gases and how it impacts on environment?
Ans: The gases like CO2, N2O those emit from burning of fossil fuel is called green house gases.
2. What are the benefits of this project on environment and people at large?

PROJECT DESIGN DOCUMENT FORM (CDM-SSC-PDD) - Version 03
CDM – Executive Board
31
Ans: The project activity involves the installation of biomass boiler for energy generation and it will
reduce the air and water pollution.
3. What are the negative impacts of this project?
Ans: There is no negative impact of this project activity. The proposed activity does not use additional
fossil fuel and does not lead to any additional emission of pollutants.
4. While implementing the project, could the developer do something which would be helpful to the
local population?
Ans: The project activity will result in lower GHG emissions to the surrounding environment and thus
improve the local environment for people living in close proximity.
5. What is the opinion of the gram panchayat for this project activity?
Ans: The comments received from gram panchayat can be summarized as positive and implementation
of the project activity is also appreciated.
E.3. Report on how due account was taken of any comments received:
The gram pranchayat and villagers expressed their happiness & thanked for calling them for discussion.
There were no negative comments received from the stakeholders.

PROJECT DESIGN DOCUMENT FORM (CDM-SSC-PDD) - Version 03
CDM – Executive Board
32
Annex 1
CONTACT INFORMATION ON PARTICIPANTS IN THE PROJECT ACTIVITY
Organization: Sterling Agro Industries Ltd.
Street/P.O.Box: Netaji Subhash Place, Pitampura
Building: 11th Floor, Aggarwal Cyber Plaza 2,
City: New Delhi
State/Region: Delhi
Postcode/ZIP: 110034
Country: India
Telephone: +91 11 47008000
FAX: +91 11 47008010
E-Mail: [email protected]
URL:
Represented by:
Title: Director
Salutation: Mr.
Last name: Saluja
Middle name:
First name: Sharad
Department: -
Mobile: +91 9811345050
Direct FAX: +91 11 47008010
Direct tel: +91 11 47008000
Personal e-mail: [email protected]

PROJECT DESIGN DOCUMENT FORM (CDM-SSC-PDD) - Version 03
CDM – Executive Board
33
Annex 2
INFORMATION REGARDING PUBLIC FUNDING
No public funding of any kind is involved in the project activity.

PROJECT DESIGN DOCUMENT FORM (CDM-SSC-PDD) - Version 03
CDM – Executive Board
34
Annex 3
BASELINE INFORMATION
Applicability of small scale methodology (AMS – IC)
Parameter Unit Details
Qty of steam generated TPH 15
Pr. of steam kg/cm2 21
Temp of steam Deg C Saturated Steam
Enthalpy of steam kJ/kg 2799.3
Enthalpy of feed water kJ/kg 439.3
Net Energy output of boiler at rated capacity kJ/kg 2360.0
Total thermal energy output KJ/hr 35400.45
Thermal output from boiler MWth 9.83
Please refer section B.4 for baseline information.

PROJECT DESIGN DOCUMENT FORM (CDM-SSC-PDD) - Version 03
CDM – Executive Board
35
Annex 4
MONITORING INFORMATION
Please refer section B.7
- - - - -


![Remobilisation of Lead and Nickel Residues in Esperance€¦ · Project Scope Purpose – to determine if – lead – and/or nickel [harder, with ongoing export] – residues in](https://img.dokumen.tips/doc/110x75/5f098b337e708231d4275543/remobilisation-of-lead-and-nickel-residues-in-esperance-project-scope-purpose-a.jpg)