Embed Size (px)
Citation preview

Clean Air FutureHealth and Climate Benefits of Zero Emission Vehicles
A report by the American Lung Association in California October 2016
Bonnie Holmes-GenSenior Director, Air Quality and Climate Change
Will BarrettSenior Policy Analyst


Table of ContentsREPORT OVERVIEW . . . . . . . . . . . . . . . . . . . . . . . . . . . . . . . . . . . . . . . . . . . . . . . . . . . . . . . . . . . . . . . . . . . . . .4
ACKNOWLEDGMENTS . . . . . . . . . . . . . . . . . . . . . . . . . . . . . . . . . . . . . . . . . . . . . . . . . . . . . . . . . . . . . . . . . . .4
EXECUTIVE SUMMARY . . . . . . . . . . . . . . . . . . . . . . . . . . . . . . . . . . . . . . . . . . . . . . . . . . . . . . . . . . . . . . . . . . .5
PUBLIC HEALTH AND VEHICLE POLLUTION . . . . . . . . . . . . . . . . . . . . . . . . . . . . . . . . . . . . . . . . . . . . . .8
PROJECT DESCRIPTION . . . . . . . . . . . . . . . . . . . . . . . . . . . . . . . . . . . . . . . . . . . . . . . . . . . . . . . . . . . . . . . . 10
ROLE OF ZEVS IN MEETING AIR QUALITY AND CLIMATE GOALS . . . . . . . . . . . . . . . . . . . . . . . . 11
ANALYSIS RESULTS . . . . . . . . . . . . . . . . . . . . . . . . . . . . . . . . . . . . . . . . . . . . . . . . . . . . . . . . . . . . . . . . . . . . 12
REACHING ZEV GOALS ACROSS THE 10 ZEV STATES . . . . . . . . . . . . . . . . . . . . . . . . . . . . . . . . . . . . 15
POLICIES THAT SUPPORT A ZEV FUTURE . . . . . . . . . . . . . . . . . . . . . . . . . . . . . . . . . . . . . . . . . . . . . . . . 16
SUPPORTING A GROWING ZEV MARKET . . . . . . . . . . . . . . . . . . . . . . . . . . . . . . . . . . . . . . . . . . . . . . . 17
CONCLUSIONS, POLICY RECOMMENDATIONS AND WAYS TO GET INVOLVED . . . . . . . . . . . 17
METHODOLOGY . . . . . . . . . . . . . . . . . . . . . . . . . . . . . . . . . . . . . . . . . . . . . . . . . . . . . . . . . . . . . . . . . . . . . . 18
APPENDIX A: METHODOLOGY AND ASSUMPTIONS . . . . . . . . . . . . . . . . . . . . . . . . . . . . . . . . . . . . . 20
APPENDIX B: HEALTH OUTCOME CHARTS . . . . . . . . . . . . . . . . . . . . . . . . . . . . . . . . . . . . . . . . . . . . . . 24

4Clean Air Future: Health and Climate Benefits of Zero Emission Vehicles American Lung Association in California
REPORT OVERVIEW
This report was produced by the American Lung Association in California to illustrate the billions of dollars in health and other societal damages caused by passenger vehicle pollution today, and to highlight the benefits of the ongoing transition to zero emission technologies across the passenger vehicle fleet. From coast to coast, the over-reliance on fossil fuels for nearly all transportation damages our air, our health, our environment and our economy. Fortunately, the transition to zero emission technologies in the transportation sector is underway, promising cleaner air, a healthier climate, and creating lasting benefits.
In response to the growing awareness that vehicle pollution and climate change pose grave threats to our health, safety and economic futures, both the federal government and individual states have adopted strong policies that set a course for cleaner air and healthier transportation and energy options in the future. The American Lung Association supports the transition to zero emission technologies highlighted in this report; this transition is vital to meeting clean air and climate change targets to protect public health.
ACKNOWLEDGMENTS
The American Lung Association in California wishes to thank the following individuals for their time and support in the development of this report, including countless hours of guidance, data analysis and collection, review and editing. Reviewers to this report included Paul Billings and Janice Nolen in the national American Lung Association office, as well as colleagues in the offices of the American Lung Association of the Mountain Pacific, American Lung Association of the Northeast and American Lung Association of the Mid-Atlantic, which cover the nine other ZEV states. Neal Fann at the U.S. Environmental Protection Agency’s Risk and Benefits Group provided additional detail and data related to the health components of this report. Dr. Fabio Caiazzo of the Massachusetts Institute of Technology provided helpful guidance in the early stages of the development of this report. Marcus Alexander with the Electric Power Research Institute, Simon Mui with the Natural Resources Defense Council and Don Anair and David Reichmuth with the Union of Concerned Scientists also provided helpful technical assistance throughout. Matt Solomon and the staff at the Northeast States for Coordinated Air Use and Management (NESCAUM) provided significant data collection and review over several months. Jamie Knapp of J Knapp Communications provided helpful review, writing and editing support. Michael Chan of TetraTech LLC provided detailed analysis services in support of this project.

5American Lung Association in California Clean Air Future: Health and Climate Benefits of Zero Emission Vehicles
EXECUTIVE SUMMARY
In the coming decades, a full transition to zero emission transportation technologies across all sectors of the vehicle fleet, running on increasing amounts of clean, non-combustion renewable electricity or hydrogen sources (e.g. wind, solar), is needed to support clean air and a healthy climate. The pollutants generated daily from our cars, trucks, SUVs and other vehicles cause local health impacts, affect local and regional air quality across the United States, and contribute to global climate change. Dependence on petroleum-based fuels for the vast majority of our transportation needs today is driving these severe impacts. The transportation sector as a whole, including passenger vehicles, heavy-duty trucks, off-road construction equipment, and other segments must all transition away from combustion to cleaner, low-carbon1 technologies and fuels.
While the American Lung Association in California strongly supports cleaning up pollution from the entire transportation sector, including the freight, off-road and other transportation segments, this report concentrates on the transition to zero emission technologies solely in the passenger vehicle segment. This report uses existing modeling tools to analyze the harm caused by passenger vehicle pollution today, largely driven by internal combustion engines, compared to a future where the majority of cars on the road are zero emission vehicles (ZEVs), including battery electric vehicles (BEVs), plug-in hybrid electric vehicles (PHEVs) and hydrogen fuel cell electric vehicles (FCVs) by 2050. The modeling tools are vehicle emission models employed by the United States Environmental Protection Agency (EPA), and peer-reviewed tools used by state and federal agencies.
The assessment is focused on the 10 U.S. states that have adopted a ZEV sales program: California, Connecticut, Maine, Maryland, Massachusetts, New Jersey, New York, Oregon, Rhode Island and Vermont. These states are referred to throughout this report as the “10 ZEV States.”
The report provides a conservative estimate of the future monetized health and climate costs and benefits of a transition to zero emission technologies in these states, in both aggregated and individual state formats for 2050.
Vehicle Health and Climate Costs: This report estimates that in 2015, the harm attributed to passenger vehicles in the 10 ZEV States totaled $37 billion in health and climate costs combined, as shown in Figure ES1.2 Of that figure, health costs added up to $24 billion in 2015; that total represents the monetized sum of harmful emissions responsible for an estimated 220,000 work-loss days, more than 109,000 asthma exacerbations, hundreds of thousands of other respiratory health impacts, and 2,580 premature deaths.
$0
$5
$10
$15
$20
$25
$30
$35
$40
2015
$24
$13
$37
2030
$11
$13
$24
Health
2050 (ZEV Future)
$12
$3
$16
Climate
Billi
ons
Passenger Vehicle Health and Climate Costs
1For more information on the carbon footprint of transportation fuels, see: • California Air Resources Board’s Low Carbon Fuel Standard page: https://www.arb.ca.gov/fuels/lcfs/lcfs.htm • Oregon Department of Environmental Quality’s Clean Fuels Program page: http://www.deq.state.or.us/aq/cleanFuel/qa.htm.
2 It is important to note that while greenhouse gas emissions fall by over half between 2015 and 2050 under the ZEV Future scenario, the monetized costs of climate change to our society increase over time, reflecting the urgency of near term action. The “Benefits of the ZEV Future Scenario” section illustrates the value of reduced carbon emissions over time, while recognizing the increasing cost of carbon pollution.
Figure ES1

6Clean Air Future: Health and Climate Benefits of Zero Emission Vehicles American Lung Association in California
To simplify: each tank of gasoline used in the 10 ZEV States is estimated to cause $18.42 in health and climate costs, as shown in Figure ES2.
Under this report’s “ZEV Future” scenario, 100% of the new car sales and approximately 65% of all cars on the road are assumed to be ZEVs by 2050 in the 10 ZEV States. Under this scenario, a conservative estimate of the total health and climate change costs associated with passenger vehicle fleet pollution drops from to $37 billion annually to $15.7 billion by 2050, as shown in Figure ES1. This represents a $21 billion drop in annual costs. Annual pollution-related impacts drop by over 85%, due to fewer lost work days caused by pollution-related illnesses, fewer asthma attacks and fewer premature deaths.
ZEV Health and Climate Benefits: A separate analysis that calculates the year-by-year health and climate savings provides another way to understand the substantial benefits of transitioning to a fleet with a majority of ZEVs in the 10 ZEV States. This analysis uses the social cost of carbon to determine the annual climate benefits from the transition to cleaner vehicles through 2050. Health benefits and climate benefits are combined to illustrate the total value of the emissions reduced by a transition to ZEVs.
As shown in Figure ES3, the health benefits of the ZEV Future scenario include an estimated $13 billion annual savings in 2030 and $21 billion annual savings in 2050 from fewer air pollution (smog and soot) related health impacts, including asthma attacks, lost work days and premature deaths. The analysis finds 1,429 fewer premature deaths due to vehicle pollution in 2030 and 2,246 fewer premature deaths in 2050 under the ZEV Future scenario, as shown in Figure ES4. Climate benefits include $5.5 billion annual savings in 2030 and $12.8 billion annual savings in 2050. This value is calculated by applying the social cost of carbon to the tons of greenhouse gases pollution reduced each year, demonstrating avoided climate damage, including harm to human health, agriculture and the environment.
$6.55$11.82
$18.42 in Health and Climate Impactsper 16-Gallon Tank of Gas in 2015
Health Climate
Figure ES2
$0
$5
$10
$15
$20
$25
$30
$35
$24
$13
Increasing Benefits of 100% ZEV Sales by 2050
Health Climate
2015 2030
$18
$5.5
$12.5
2050 (ZEV Future)
$12.8
$20.5
$33.3
Billi
ons
Figure ES3
0
500
1,000
1,500
2,000
2,500
3,000
Premature Deaths Due to Vehicle Pollution
2015 2030
1,429 Fewer 2,246 Fewer
2,580
334
1,152
2050 (ZEV Future)
Dea
ths p
er Y
ear
Dea
ths p
er Y
ear
Figure ES4

7American Lung Association in California Clean Air Future: Health and Climate Benefits of Zero Emission Vehicles
In summary, the report finds the public is currently bearing high costs from the use of petroleum-based fuels in the 10 ZEV States and can realize billions of dollars in annual savings from reduced health and climate harm under a scenario where ZEVs and other advanced clean cars make up a majority of passenger vehicles on the road by 2050. Health and climate benefits will grow each year over the next 35 years as conventional vehicles transition to ZEVs and advanced technologies, and will deepen as more segments of the transportation sector transition to zero emissions. In addition, reliance on 100% renewable energy to charge ZEVs will substantially boost climate and health benefits.
In order to achieve – and accelerate – the health and climate benefits presented in this analysis, a number of state, federal and local actions must take place to increase ZEV deployment in all ZEV states and support a thriving ZEV market across the country. Necessary actions include the following:
1. The California Air Resources Board should strengthen the California ZEV program in 2017 to ensure that 1.5 million ZEVs – BEVs, PHEVs and FCVs – are on the road in California and over 3 million are on the road in the 10 ZEV States by 2025 and ensure that 15% of all new cars and light trucks sold will be required to be ZEVs. California must also stay the course on ending the loophole (called the “Travel Provision”) that stalls ZEV sales in states outside of California that have adopted the ZEV program.
2. Fede ral and state leaders should support key policies to spur sales of BEVs, PHEVs and FCVs, including: a. Extend and increase federal, state and local rebates and tax credits designed to support ZEV deployment and make ZEVs accessible to people of all income levels. b. Promote non-monetary incentives such as access to preferred parking and access to highway “carpool” lanes for ZEV technologies. c. Support public and private investment, including utility programs, to build and expand vehicle charging and fueling infrastructure for workplaces, public spaces and residences, including multi-unit dwellings. d. Support programs to increase zero emission technologies across the transportation sector as a whole, including for buses, trucks, and other heavy-duty vehicles and equipment. e. Ensure that the cleanest available technologies benefit all communities, including disadvantaged communities and those most impacted by pollution today.
3. The U.S. Environmental Protection Agency and states must implement the federal Clean Power Plan and strengthen state-level renewable energy goals and programs to shift ZEV power sources from fossil fuels to non-combustion electricity generation as quickly as possible.
For families across the United States, and especially those living with respiratory illnesses or in close proximity to major roadways, freeways or other pollution hot spots, the transition to zero emission transportation solutions is vital to securing a healthier future. Everyone can participate in this future by supporting strong state and federal actions, and on a personal level, choosing a zero emission technology when making a vehicle purchase decision.

8Clean Air Future: Health and Climate Benefits of Zero Emission Vehicles American Lung Association in California
PUBLIC HEALTH AND VEHICLE POLLUTION
More than half of all Americans – 166 million people – live in counties where they are exposed to unhealthy air, according to the 2016 State of the Air report published by the American Lung Associationi. The report shows that many residents living in the ten states that have adopted the California zero emission vehicle (ZEV) program are affected by poor air quality. The 2016 State of the Air report noted that in nine of the 10 ZEV States (excluding Vermont), counties received a failing grade for either ozone or particle pollution. Although the pollution in these communities is caused by a variety of sources (transportation, power plants, wood burning, etc.), vehicle emissions contribute to the overall burden, especially for those communities nearest major traffic sources.
The transportation sector is a leading source of pollutants that threaten lung health and lead to asthma attacks, hospitalizations, emergency room visits and even early death. While all communities that suffer from unhealthy air experience health effects, communities located near major roadways are at increased risk of illness. Often, low-income
communities and communities of color bear a disproportionate burden due to near-roadway pollution.ii Recent research concluded that exposure to traffic pollution causes asthma attacks in children, and may cause a wide range of other effects including contributing to the onset of childhood asthma, impaired lung function, cardiovascular impacts and premature death.iii It is important to note that passenger
vehicle emissions evaluated in this report represent only a portion of the overall “mobile sources” transportation sector, which includes heavy-duty diesel trucks, buses, trains, off-road construction equipment, and other sources of pollution that must also transition to cleaner fuels and technologies.
In addition to direct public health impacts, the transportation sector adds to the public health burdens of climate change. As seen in Figure 1, transportation sources cause 49% of the greenhouse gas emissions in the 10 ZEV States. Nationally, transportation sources generate approximately one-third of climate pollution.iv In March 2016, the United States Global Change Research Centerv published a comprehensive review of the growing threats to health due to climate change in the United States. This national report projected hundreds of thousands of illnesses, hospitalizations and deaths due to increases in air pollution caused by climate change by 2030, as well as increased health disparities. Climate change, first and foremost, is a public health threat that requires urgent attention, especially through pollution reductions in the transportation sector.
Passenger vehicles impact health through their tailpipe emissions and their fuel production process, or “upstream” emissions. Tailpipes emit harmful emissions that create ozone and particulate matter pollution, as well as greenhouse gases, which cause climate change. Fuel production processes extract, refine and transport fossil fuels for traditional vehicles, or generate electricity or hydrogen for ZEVs. Emissions from these processes are called upstream emissions.
UPSTREAM EMISSIONS:
Greenhouse Gas Emissions by Sector10 ZEV States (2013)
Transportation49%
Commercial8%
Electric Power17%
Residential13%
Industrial13%
Figure 1: Aggregated greenhouse gas emissions in the 10 ZEV States: California, Connecticut, Maine, Maryland, Massachusetts, New Jersey, New York, Oregon, Rhode Island and Vermont.

9American Lung Association in California Clean Air Future: Health and Climate Benefits of Zero Emission Vehicles
Past research published by the American Lung Association in California has demonstrated the ill effects of vehicle pollution on health and the significant health benefits possible with a shift to zero emission technologies. In 2011 and 2012, the California charter produced a series of “The Road to Clean Air” reports to highlight the benefits to California of more aggressive Low Emission Vehicle (LEV) standards that were later adopted through 2025 and to envision a complete fleet transition to ZEVs in California over the same period. The report found that a complete fleet turnover from 2010 vehicle standards to ZEVs would reduce harm to climate, health and the economy by $13 billion in 2025, preventing hundreds of premature deaths and tens of thousands of asthma attacks and work days lost to respiratory illness.vi
Additionally, recent studies by the Electric Power Research Institute (EPRI) and Natural Resources Defense Council (NRDC)vii, and by the Union of Concerned Scientists (UCS)viii, point to the benefits of ZEVs in advancing clean air and a healthy climate. The UCS review of electric vehicle sales in 2014 noted that electric vehicles delivered greenhouse gas emission benefits over gasoline vehicles regardless of location. UCS concluded that to “reach their full potential, [electric vehicles] must account for a larger share of vehicle sales” while the power grid cleans up. The EPRI/NRDC report modeled widespread electrification of the transportation sector (not limited solely to passenger vehicles) and similarly noted that “air quality benefits from adoption of [plug-in electric vehicles] are expected to increase as the power system becomes cleaner and a greater portion of the transportation fleet is electrified.” Importantly, the detailed emissions modeling used by EPRI/NRDC projected air quality benefits from transportation electrification above and beyond the benefits attributed to federal vehicle emissions standards. Transportation electrification benefits accrued in both urban and rural areas across the United States in the modeled scenarios.

10Clean Air Future: Health and Climate Benefits of Zero Emission Vehicles American Lung Association in California
PROJECT DESCRIPTION
This report compares the present level of harm, caused by today’s largely petroleum-fueled passenger vehicles, to levels in a future scenario that assumes the majority of cars on the road are zero emission vehicles (ZEVs). In its analysis, the report uses vehicle emission models employed by the U.S. Environmental Protection Agency (EPA) and peer-reviewed tools used by state and federal agencies.
The report includes an analysis of the health and climate benefits of the ZEV program in the 10 ZEV States (California, Connecticut, Maine, Maryland, Massachusetts, New Jersey, New York, Oregon, Rhode Island and Vermont). It seeks to illustrate the benefits of maintaining and expanding a strong course toward zero emission transportation in addition to current policies for advanced clean cars.
This report is unique in that it analyzes costs and benefits that are often overlooked: the direct and upstream emissions generated by our the current and future vehicle fleets as well as the health and climate benefits of policies to achieve a vehicle fleet with a majority of ZEVs by 2050. ZEVs include plug-in hybrid electric vehicles (PHEVs), battery electric vehicles (BEVs) or hydrogen fuel cell vehicles (FCVs).
Specifically, the report illustrates the following impacts of vehicle pollution:• Health outcomes, including asthma attacks, emergency room (ER) visits, lost work days and premature deaths
attributed to vehicle emissions that form particulate matter and ozone, as well as health and environmental outcomes from greenhouse gas emissions.
• Monetized health impacts (e.g. costs of premature deaths, hospitalizations). • Social cost of carbon, or the monetization of climate change impacts attributable to greenhouse gas
emissions.
This report focuses on the benefits that could accrue from a vehicle technology transition that must take place between now and 2050. It estimates the benefits of a transition to a passenger vehicle fleet made up of 65% ZEVs (including approximately 50% PHEVs and 50% BEVs or FCVs) by 2050, including consideration of external costs. External costs, such as illnesses, emergency room visits, asthma attacks, and other health costs are often dismissed, but these societal and health costs are real, and are incorporated in this analysis of future benefits.
The results shown in this report represent two scenarios:• 2015 Vehicle Fleet – today’s passenger vehicle fleet in the 10 ZEV States.• ZEV Future – assumes 100% of new cars sold in 2050 are ZEVs, and approximately 65% of the entire
passenger vehicle fleet are ZEVs.
Specifically, this report shows the cost of pollution created by the existing conventional passenger vehicle fleet in 2015, then projects the benefits of a transition to a ZEV Future scenario by 2050 through a modeling exercise. The analysis generates benefits data by multiplying the social cost of carbon for a given year by the annual tons of greenhouse gas emissions reductions and then combining this data with annual cost savings of reduced health outcomes. The calculation of health and climate costs and benefits includes assumptions about upstream emissions for fuels used to power both internal combustion and zero emission vehicles. For more detail on the methodology, please see Appendix A.
It is also worth noting that this report focuses only on the passenger vehicle fleet and associated regulatory structures. Therefore the benefits shown in this report represent only a portion of the gains that would be achieved when ZEV technology migrates to the medium- and heavy-duty on-road and off-road sectors. For example, in California alone, diesel emissions from the freight sector were estimated to have caused $20 billion in health impacts in 2012.ix And yet, the benefits of a transition to a majority of ZEVs in the passenger vehicle fleet, as shown in this report, are significant.

11American Lung Association in California Clean Air Future: Health and Climate Benefits of Zero Emission Vehicles
ROLE OF ZEVS IN MEETING AIR QUALITY AND CLIMATE GOALS
The goal of zero emission transportation has played a vital role in California’s air quality strategies since the ZEV program was first adopted in 1990. Since then, the role and importance of the ZEV program has grown as state climate pollution reduction targets have been adopted and stronger federal air quality standards for ozone and particle pollution have been established. In 2012, California strengthened its ZEV program to put the state on the path to meet clean air and climate goals so that BEVs, PHEVs or FCVs would represent approximately one out of every seven vehicles sold in California by 2025. Actions by the California Legislature and Governor have set additional vehicle volume targets, including state law SB 1275x which requires 1 million ZEVs by 2023 and Gov. Jerry Brown’s Executive Order B-16-12 calling for 1.5 million ZEVs by 2025.xi
Nine states have adopted the California ZEV program in order to increase ZEV deployment in their states, while other states have adopted policies to support ZEVs, such as incentives, even if they lack a formal state ZEV program structure. Those states and other jurisdictions recognized the multiple benefits of ZEVs in meeting health-based pollution targets and climate goals. Following are some key actions and agreements:
• In October 2013, eight states (California, Connecticut, Maryland, Massachusetts, New York, Oregon, Rhode Island and Vermont) signed a Memorandum of Understanding (MOU) to ensure successful rollout of state ZEV programs, with the goal of 3.3 million ZEVs on the roads in these states by 2025.xii
• These states have also implemented a variety of complementary policies since the signing of the MOU, including incentives for vehicles and charging stations, grants to support workplace charging programs, formation of state ZEV Commissions, and others.
• These same eight ZEV states signed the International ZEV Alliance agreement at the 2015 Paris climate conference to push for 100% ZEV sales “as fast as possible, and no later than 2050” to help avoid the worst impacts of climate change.xiii Germany, The Netherlands, Norway, Québec and the United Kingdom also signed the agreement.
The ZEV program is a critical policy to clean up passenger vehicles. Together with federal vehicle regulations, California’s Advanced Clean Cars program, the federal Clean Power Plan and other measures, this policy establishes the path for protecting public health through the commercialization of cleaner vehicle technologies, including BEVs, PHEVs and FCVs that can operate on renewable energy sources, virtually eliminating passenger vehicle pollution.

12Clean Air Future: Health and Climate Benefits of Zero Emission Vehicles American Lung Association in California
ANALYSIS RESULTS
A review of the emissions of the 2015 fleet of motor vehicles in the 10 ZEV States illustrates the overall health and societal harm attributable to our nation’s dependence on petroleum-based fuels for passenger vehicle transportation, as shown in Figure 2.3 By contrast, a phase-in of BEVs, PHEVs and FCVs by 2050 in those 10 states can yield billions of dollars in health and climate benefits. The following discussion explores the health and climate costs of pollution caused by passenger vehicles, as well as the benefits of a transition to zero emission transportation.
CURRENT COSTS OF VEHICLE POLLUTIONThis analysis estimates that $37 billion in public health and climate change costs can be attributed to vehicle emissions from the fleet on the road in 2015 across the 10 ZEV States – or equivalent to $1.15 per gallon of gas consumed. A fill-up of a mid-sized sedan’s 16-gallon tank of gas costs approximately $18.42 in harm due to health and climate impacts, as shown in Figure 3.
In the 10 ZEV States, the following estimated health impacts can be attributed annually to the ozone- and fine particulate matter (PM)-generating emissions of the current (2015) vehicle fleet. • 109,637 asthma attacks;• 220,199 days of work lost to respiratory illness;• 2,580 premature deaths;• 1,895 heart attacks; and• 1,868 ER visits/hospitalizations.
Under the ZEV Future scenario, a conservative estimate of the total health and climate change costs associated with passenger vehicle fleet pollution drops from to $37 billion annually to $15.7 billion by 2050. This represents a $21 billion drop in annual costs, even considering the increasing social cost of carbon pollution impacts over time.
3 It is important to note that while greenhouse gas emissions fall by over half between 2015 and 2050 under the ZEV Future scenario, the monetized costs of climate change to our society increase over time, reflecting the urgency of near term action. The “Benefits of the ZEV Future Scenario” section illustrates the value of reduced carbon emissions over time, while recognizing the increasing cost of carbon pollution.
$0
$5
$10
$15
$20
$25
$30
$35
$40
2015
$24
$13
$37
2030
$11
$13
$24
Health
2050 (ZEV Future)
$12
$3
$16
Climate
Billi
ons
Passenger Vehicle Health and Climate Costs
Figure 2
$6.55$11.82
$18.42 in Health and Climate Impactsper 16-Gallon Tank of Gas in 2015
Health Climate
Figure 3

13American Lung Association in California Clean Air Future: Health and Climate Benefits of Zero Emission Vehicles
BENEFITS OF THE ZEV FUTURE SCENARIO A separate analysis shows that the transition of the vehicle fleet to a majority of ZEVs by 2050 can provide tens of billions in health and climate savings compared to the largely petroleum-fueled 2015 vehicle fleet.
The analysis finds significant health and climate savings from cleaning up the vehicle fleet across the 10 ZEV States under the ZEV Future scenario, and as shown in Figure 4, these benefits continue to grow over time:• $20.5 billion in annual health savings from
fewer asthma attacks, lost work days, premature deaths, heart attacks and emergency room visits as the result of cleaner air.
• $12.8 billion in annual climate benefits calculated by applying the social cost of carbon (per ton value in 2050) to the 162 million metric tons of carbon pollution reduced under the ZEV Future scenario in 2050. These benefits are linked to reduced costs to health, agriculture and the environment.
Specific health benefits from reduced ozone- and PM-generating emissions in 2050, shown in Figures 5, 6 and Appendix B, include:• 96,370 fewer asthma attacks; • 194,908 fewer work-loss days; • 2,246 fewer premature deaths;• 1,625 fewer ER/Hospitalizations; and• 1,629 fewer heart attacks.
Pollution reduction benefits in 2050 are estimated to be:• An approximate 90% reduction in emissions
that generate ozone and PM, or over 1.1 million tons of emissions reduced in 2050 compared to 2015.
• An over 50% reduction in greenhouse gas emissions, or a 162 million metric ton reduction in greenhouse gas emissions in 2050 compared to 2015.
• That reduction would equate to removing 34 million passenger vehiclesxiv from the road in a year, or roughly all of the cars in the eight ZEV States on the East Coast.
$0
$5
$10
$15
$20
$25
$30
$35
$24
$13
Increasing Benefits of 100% ZEV Sales by 2050
Health Climate
2015 2030
$18
$5.5
$12.5
2050 (ZEV Future)
$12.8
$20.5
$33.3
Billi
ons
Figure 4
0
50,000
100,000
150,000
200,000
250,000
Lost Work Days Due to Vehicle Pollution
2015 2030
132,878 Fewer 194,908 Fewer220,199
25,291
87,321
2050 (ZEV Future)
Lost
Wor
k D
ays
Per Y
ear
Lost
Wor
k D
ays
Per Y
ear
Figure 5
0
20,000
40,000
60,000
80,000
100,000
120,000
Asthma Attacks Due to Vehicle Pollution
2015 2030
64,212 Fewer 96,370 Fewer
109,637
13,267
45,426
2050 (ZEV Future)
Ast
hma
Attac
ksPe
r Yea
r
Ast
hma
Attac
ksPe
r Yea
r
Figure 6

14Clean Air Future: Health and Climate Benefits of Zero Emission Vehicles American Lung Association in California
REGIONAL COSTS AND BENEFITSTo illustrate more state-level impacts of achieving the 2050 ZEV Future scenario, this study calculated each of the 10 ZEV States’ proportional share of costs and benefits based on total vehicle populations in each state.
State-level Costs: Figure 7 illustrates the combined health and climate costs attributable to passenger vehicles in each of the 10 ZEV States in 2015.
These costs range from $313 million in Vermont up to $15 billion in California. Residents of all of the 10 ZEV States are harmed by exposure to vehicle pollution, and can benefit from policies to transition to ZEVs and clean energy.
State-level Benefits: Compared to 2015 pollution levels, each of the 10 ZEV States will see annual increases in health and climate savings due to the increase in ZEVs. The savings achieved in 2050 for each of the 10 ZEV States under the ZEV Future scenario are presented in Table 1. The $33.3 billion in annual benefits of the ZEV Future scenario in 2050 would translate to an average of $1,045 in annual climate and health savings per-household across the 10 ZEV States.xv
Despite the relatively small population of ZEVs on the roads today compared to conventional vehicles in states outside of California, the ZEV program and state actions are expected to ramp up sales throughout the 10 ZEV States going forward. For example, states are building vehicle charging stations and introducing consumer incentives to purchase ZEVs through tax credits or rebates, access to carpool lane travel, or other options that make the clean air choice the easy choice. As these programs mature, ZEV sales will grow accordingly, and these states can all move toward a future with cleaner air.
$37 Billion: Health and Climate Costsdue to Passenger Vehicle Fleet in 2015
CA$15 billion
NY$7.9 billion
NJ$4.6 billion
MA$2.9 billion
MD$2.6 billion
CT$1.4 billion
OR$1.3 billion
ME$0.5 billion
RI$0.4 billion
VT$0.3 billion
Figure 7
Table 1ZEV State Combined Health
and Climate Benefits in 2050
California $13.5 billionConnecticut $1.3 billionMaine $0.5 billionMaryland $2.4 billionMassachusetts $2.7 billionNew Jersey $4.1 billionNew York $7.1 billionOregon $1.1 billionRhode Island $0.4 billionVermont $0.3 billionTotal $33.3 billion

15American Lung Association in California Clean Air Future: Health and Climate Benefits of Zero Emission Vehicles
REACHING ZEV GOALS ACROSS THE 10 ZEV STATES
The ZEV program has proven to be a driver of major vehicle technology innovation and sales in California. The state’s ZEV market has grown significantly; roughly half of all U.S. ZEV sales occur in the Golden State. As more states adopt the ZEV program, they help support the mass transition needed to a ZEV Future.
Outside of California, the ZEV states have not equally shared in the deployment of these technologies because of a loophole in the California Air Resources Board’s ZEV policy known as the “Travel Provision.” This loophole has allowed automakers to use a credit system to avoid any requirement to place ZEVs in other states, even if those states have adopted the California ZEV program. Under this loophole, a BEV placed in California counts as automaker compliance for placing vehicles in other states. In practice, it means automakers place most ZEVs in California, leaving consumers outside of California with limited ZEV availability.xvi Fortunately, a portion of this loophole is set to end in 2017, meaning automakers will then be responsible for placing BEVs and PHEVs in service in all ZEV States and not just California, greatly expanding the reach and benefits of the ZEV program. (It is important to note that the Travel Provision loophole will still apply to FCVs; they will be exempted from the ZEV requirement outside of California throughout the current policy, setting up future delays of that technology in the other ZEV States.)
The Travel Provision loophole, and the resulting lack of vehicle availability in states outside of California, has made it extremely difficult to develop a robust ZEV market beyond California. Consumers outside of California want ZEVs – even though they cannot get them nearly as easily. The Consumers Union and UCS recently polled consumers in California and the Northeast about their impressions of ZEVs. The findings were striking: two-thirds of Californians and more than half of Northeastern respondents expressed interest in ZEVs, and over 40% of these consumers could have their daily driving needs met by ZEVs.xvii Further, a Consumer Federation of America survey published in September 2016 noted interest in ZEVs increasing over their 2015 survey, particularly among younger consumers.xviii From coast to coast, consumers clearly are interested in ZEVs. Fortunately, the policy barriers to getting them will soon be coming down – just as complementary programs to boost the ZEV market are coming online.
Another key provision of the ZEV program that affects availability of electric vehicles in California and other states is the credit-based compliance system. The ZEV program awards credits to automakers that produce and sell ZEVs. Automakers use these credits to comply with the regulation. As technology has advanced beyond the levels expected when the ZEV program was last amended in 2012, the credit system has become outdated and generates more credits than anticipated. As a result, the states are in danger of falling short of ZEV goals (1.5 million ZEVs in California and 3.3 million on the road across partner states by 2025, as noted above). For the states to ensure meeting planned ZEV volumes, the program must be strengthened to remain on track to meet targets in 2025 and beyond.

16Clean Air Future: Health and Climate Benefits of Zero Emission Vehicles American Lung Association in California
POLICIES THAT SUPPORT A ZEV FUTURE
Federal fuel economy standards, state and federal vehicle emission standards and the state ZEV programs all work together to spur the transition to cleaner cars that help achieve clean air and climate goals. In order to achieve these goals and reach a true ZEV future, the ZEV program and other clean car regulations must be strengthened to speed up the introduction of the cleanest cars and promote truly zero emission options.
The ZEV regulation is only a piece of the puzzle to increase the numbers of ZEVs, as illustrated in Figure 8. Many states have adopted and are moving forward with innovative programs to increase consumer awareness and adoption of ZEV technologies. Direct consumer rebates on vehicle purchases, deployment of large public charging/fueling networks, providing High Occupancy Vehicle (HOV) or “carpool” lane access to clean air vehicles, preferential parking, and more options are providing additional incentives to consumers. A 2015 review of ZEV incentive programs by the International Council on Clean Transportation (ICCT) provides a detailed review of the dozens of city, state and utility programs across the United States supporting the increased deployment of ZEVs, both within and outside of ZEV States.xix States are moving forward with the knowledge that the ZEV programs that have been adopted will improve air quality and slow climate change, and are responding with policy decisions and consumer incentives that support clean air.
As states move forward with programs to bring more ZEVs on the road, transportation energy demand will shift to the electrical grid. A key priority must be to ensure that power sources grow cleaner as quickly as possible. Coal, natural gas and other fossil fuels have significant upstream emissions of fine particles, ozone and PM precursors, and carbon that must be reduced.
Implementing a rapid phase-in of renewable energy sources (e.g. wind and solar) will couple the tailpipe-free emissions on the road with reduced power plant emissions and an increasing amount of emission-free renewable power. Implementing the Clean Power Plan, Mercury and Air Toxic Standards and other federal policies, coupled with state and local renewable power goals, are critical steps in protecting public health, preserving a sustainable climate and bringing the transportation sector to a truly zero emission future. Existing state and national renewable energy policies are already resulting in changes to the electricity grid that are curbing dependence on harmful fossil fuels in favor of cleaner technologies. Ongoing efforts will be needed to ensure that clean, non-combustion renewable energy is the dominant source of power going forward.
To better understand the benefits of a conversion to renewable energy in the ten ZEV states, a further analysis of the ZEV Future scenario, wherein all ZEV miles are powered by zero emission renewable energy sources, was also conducted. This analysis found an additional 40% increase in health and climate benefits would result in 2050. These greater benefits would continue to increase beyond 2050 as the percentage of zero emission vehicles in the state fleets continues to grow.
POLICYDRIVES ZEV SALES
CLEAN ENERGY
REBATES ANDTAX CREDITS
LOCAL • STATE • FEDERAL
INFRASTRUCTUREPARKING • CHARGING
HOV LANE ACCESS
CONSUMEROUTREACH
ZEV FUTURE

17American Lung Association in California Clean Air Future: Health and Climate Benefits of Zero Emission Vehicles
SUPPORTING A GROWING ZEV MARKET
Many major automakers currently offer zero emission vehicle options, with more models being announced regularly. ZEV sales continue to grow year over year, with over half a million ZEVs sold across the U.S. since 2010, about half of which have been sold in California.xx The choices, which include BEVs, PHEVs and FCVs, are growing each year, and sales are surpassing the sales rate of traditional hybrids in the early stages of that technology.xxi Further consumer education, infrastructure and ZEV deployment efforts should be made through the recently announced settlement in the Volkswagen diesel emissions cheating case, wherein $2 billion in ZEV projects will be deployed throughout the United States.xxi Additionally, in July 2016 the Obama administration announced a new funding opportunity allowing ZEV infrastructure to take part in a $4.5 billion grant program.xxiii
A full-scale transition to ZEVs will require continued strong regulatory actions and careful coordination between state and federal leadership, utilities, energy regulators and the public in order to protect against increases in “upstream” emissions at power plants that threaten the health of other communities far from roadways. Utilities play an important role here in cleaning up the power grid. They also play an important role in supporting the ZEV market, including by providing special electricity rates for plug-in vehicle customers, investing in charging infrastructure and promoting the benefits of ZEVs to customers. Under a 2015 California law, renewables are required to make up half of the state’s power supply by 2030 and utility regulators are now responsible for directing “electrical corporations to file applications for programs and investments to accelerate widespread transportation electrification.”xxiv This shift, and the utility-driven ZEV programs noted in the ICCT report referenced above, represent a major opportunity to reduce the use of polluting fuels and fight air pollution and climate change.
CONCLUSIONS, POLICY RECOMMENDATIONS AND WAYS TO GET INVOLVED
Conclusions:1. Pollution from passenger vehicles in 2015 is estimated to cost $37 billion in public health and climate change costs,
which translates to a hidden cost of approximately $18 per fill-up of a tank of gas across the 10 ZEV States.2. More than 109,000 asthma attacks, 220,000 lost work days and over 2,500 premature deaths are estimated to have
resulted from passenger vehicle emissions in 2015 in the 10 ZEV States. 3. The 10 ZEV States could experience over $33 billion in health and climate savings in 2050, avoid 195,000 lost
work days, and prevent over 96,000 asthma attacks and over 2,200 premature deaths by achieving the ZEV Future scenario.
4 . The reduction in greenhouse gas emissions by achieving the ZEV Future scenario in 2050 is equal to removing 34 million passenger vehicles from the road, roughly the same number of cars on the road today in the eight East Coast ZEV States.
5 . The health and climate benefits of achieving the ZEV Future scenario would be increased by an additional 40% if all the electricity used to power the ZEVs was generated from emissions-free renewable sources.
6. A broad-scale transformation to ZEV technologies, including battery electric and hydrogen fuel cell electric vehicles, for the entire transportation sector – along with a transition to renewable energy – is critical to meeting health-protective air quality standards and climate change goals.
7. Adopting and implementing strong regulatory actions, combined with incentives, infrastructure expansion and public outreach are needed to reach the ZEV Future scenario.
18Clean Air Future: Health and Climate Benefits of Zero Emission Vehicles American Lung Association in California
Policy Recommendations:1. The California Air Resources Board should strengthen the California ZEV program in 2017 to ensure that 1.5 million
ZEVs – BEVs, PHEVs and FCVs – are on the road in California and over 3 million are on the road in the 10 ZEV States by 2025, and ensure that 15% of new cars and light trucks sold will be required to be ZEVs. California must also stay the course on ending the Travel Provision loophole that stalls ZEV sales in states outside of California that have adopted the ZEV program.
2. Federal and state leaders should support key policies to spur sales of BEVs, PHEVs and FCVs, including:a . Extend and increase federal, state and local rebates and tax credits designed to support ZEV deployment and
make ZEVs accessible to all income levels.b . Support strong public-private partnerships to promote ZEV technologies to a wide public audience, such as
those underway in the Northeast and California. c. Promote non-monetary incentives such as access to preferred parking and access to highway HOV or
“carpool” lanes for ZEV technologies. d . Support public and private investment, including utility programs, to build and expand vehicle charging and
fueling infrastructure for workplaces, public spaces and residences, including multi-unit apartments.e . Support programs to increase zero emission technologies across the transportation sector as a whole,
including for buses, trucks and other heavy-duty equipment. f . Ensure that the cleanest available technologies benefit all communities, including disadvantaged communities
and those most impacted by pollution today. 3. The U.S. EPA and states must implement the federal Clean Power Plan and strengthen state-level renewable energy
goals and programs to shift ZEV power sources from fossil fuels to non-combustion electricity generation as quickly as possible.
Three actions consumers can take to support cleaner air in their community:1. Consider a ZEV for your next purchase – there are more and more models each year, and more and more programs
(carpool lane access, rebates, tax credits, etc.) to support a clean car purchase. 2. Contact your local elected officials and encourage your community to become ZEV-ready and to add more ZEVs to
your community’s public fleets. 3. Contact policymakers and encourage them to protect public health by adopting policies that bring more zero
emission transportation and energy choices to all consumers. Every community should have the opportunity to benefit from clean air and clean technologies.
METHODOLOGY
This report relies on research models utilized by air agencies to estimate emissions data, and applies available factors to illustrate potential health and climate benefits of reducing harmful emissions from the passenger vehicle sector.
Data collection for this report was performed by Tetra Tech LLC under contract with the American Lung Association in California, and by the Northeast States for Coordinated Air Use Management (NESCAUM).
The vehicle air pollutant information contained in this report was compiled using the U.S. EPA MOVES model to determine vehicle fleet and emissions characteristics in the 10 ZEV States. The Argonne National Laboratory’s GREET model was utilized to evaluate upstream emissions associated with electric vehicle charging and petroleum use.
Health outcome information was estimated utilizing emissions and health impact factors that were developed for U.S. EPA assessments of the benefits of the Clean Air Act and associated air quality programs, and associated literature.

19American Lung Association in California Clean Air Future: Health and Climate Benefits of Zero Emission Vehicles
Greenhouse gas social cost of carbon information presented in this report was developed by the Joint U.S. Interagency Working Group on Social Cost of Carbon, updated to 2015 dollars, and applied to the total and reduced greenhouse gas emissions derived from the modeled fleet emissions. Overall, the social cost of carbon provides an estimated cost of the climate change impacts on agricultural productivity, human health, property damages from increased flood risk, and the value of ecosystem services (e.g. clean drinking water, pollination, carbon storage in forests). These calculations were performed by TetraTech LLC under contract with the American Lung Association in California.
A more detailed discussion of the methodology is found in Appendix A of this report.
CITATIONSi American Lung Association. State of the Air 2016. www.stateoftheair.org ii Rowangould, Gregory. University of New Mexico, Civil Engineering Department. A Census of the United States Near-Roadway Population: Public
Health and Environmental Justice Considerations. Transportation Research Part D: Transport and Environment. 2013. http://dx.doi.org/10.1016/j.trd.2013.08.003
iii Health Effects Institute: Traffic-Related Air Pollution: A Critical Review of the Literature on Emissions, Exposure, and Health Effects. Jan. 2010. https://www.healtheffects.org/publication/traffic-related-air-pollution-critical-review-literature-emissions-exposure-and-health
iv US Energy Information Administration. Energy-Related Carbon Dioxide Emissions at the State Level, 2000-2013. October 2015. http://www.eia.gov/environment/emissions/state/analysis/
v US Global Climate Research Center. The Impacts of Climate Change on Human Health in the United States: A Scientific Assessment. Jul. 2016. http://health2016.globalchange.gov/
vi American Lung Association in California. The Road to Clean Air II: A Zero Emission Future. 2012. http://www.lung.org/local-content/california/documents/zev-road-to-clean-air_final.pdf
vii Electric Power Research Institute, Natural Resources Defense Council. Environmental Assessment of Full Transportation Electrification Portfolio. Sept. 2015. http://www.epri.com/abstracts/Pages/ProductAbstract.aspx?ProductId=3002006881
viii Union of Concerned Scientists. Cleaner Cars from the Cradle to the Grave. Nov. 2015. http://www.ucsusa.org/clean-vehicles/electric-vehicles/life-cycle-ev-emissions#.V7NyC_krKUk
ix California Air Resources Board. Sustainable Freight Discussion Document: Pathways to Zero and Near-Zero Emissions. 2015. https://www.arb.ca.gov/gmp/sfti/sustainable-freight-pathways-to-zero-and-near-zero-emissions-discussion-document.pdf
x Senate Bill 1275, the California Charge Ahead Initiative authored by Senator Kevin de León. xi Governor Jerry Brown. Executive Order B-16-12 issued March 23, 2012. https://www.gov.ca.gov/news.php?id=17472 xii Multi-State ZEV Task Force. Memorandum of Understanding. October 24, 2013. http://www.nescaum.org/documents/zev-mou-8-governors-
signed-20131024.pdf/ xiii International Zero Emission Vehicle Alliance. December 3, 2015. https://www.scribd.com/document/292065952/ZEV-Alliance-COP21-
Announcement-3-Dec-2015 xiv US Environmental Protection Agency – Greenhouse Gas Equivalency calculator applied to 162 million metric tons of carbon pollution avoided.
https://www.epa.gov/energy/greenhouse-gas-equivalencies-calculator xv United States Census Bureau. QuickFacts. Family and Living Arrangements. Accessed October 14, 2016. https://www.census.gov/quickfacts/table/
PST045215/00 xvi Union of Concerned Scientists. Electrifying the Vehicle Market. August 2016. http://www.ucsusa.org/EVAvailability xvii Consumers Union, Union of Concerned Scientists. Driving Habits, Vehicle Needs, and Attitudes toward Electric Vehicles in the Northeast and
California. May 2016. http://www.ucsusa.org/sites/default/files/attach/2016/05/Electric-Vehicle-Survey-Methodology.pdfxviii Consumer Federation of America. http://consumerfed.org/press_release/new-data-shows-consumer-interest-electric-vehicles-
growing/?platform=hootsuite xix International Council on Clean Transportation. Assessment of leading electric vehicle promotion activities in United States cities. July 2015. http://
www.theicct.org/sites/default/files/publications/ICCT_EV-promotion-US-cities_20150729.pdf xx Plug-In Electric Vehicle Collaborative. PEV Sales Dashboard. Oct 4, 2016. http://www.pevcollaborative.org/ xxi CFA. Ibid.xxii US Environmental Protection Agency. Volkswagen Clean Air Act Partial Settlement. https://www.epa.gov/enforcement/volkswagen-clean-air-act-
partial-settlement#investment xxiii White House. Fact Sheet: Obama Administration Announces Federal and Private Sector Actions to Accelerate Electric Vehicle Adoption in the
United States. July 2016. https://www.whitehouse.gov/the-press-office/2016/07/21/fact-sheet-obama-administration-announces-federal-and-private-sector
xxiv California Senate Bill 350. Kevin de León, 2015.

20Clean Air Future: Health and Climate Benefits of Zero Emission Vehicles American Lung Association in California
APPENDIX A: METHODOLOGY AND ASSUMPTIONS
Scope of Report: Provide an assessment of the health and climate change benefits of a widespread transition to zero emission vehicle (ZEV) technologies in the U.S. states that have adopted California’s ZEV program. Throughout the report, these states are referred to as the 10 ZEV States: California, Connecticut, Maine, Maryland, Massachusetts, New Jersey, New York, Oregon, Rhode Island and Vermont. • Utilize existing pollution models to estimate lifecycle air pollutant and greenhouse gas emissions associated with
passenger (cars, light trucks and sport utility) vehicles in the 10 ZEV States under present (2015) and future (2050) conditions as passenger vehicle fleets transition toward Zero Emission Vehicle technologies, including Battery Electric Vehicles (BEV), Plug-in Hybrid Electric Vehicles (PHEV) and Hydrogen Fuel Cell vehicles (FCV). Pollutants analyzed include: Nitrogen Oxides (NOx), Volatile Organic Compounds (VOC), Fine Particle Matter (PM2.5), sulfur oxide pollution (SOx) and greenhouse gases (GHG).
• Translate emissions into health and climate change metrics that can help estimate the costs and benefits of vehicle fuels and technologies. Estimate specific health outcomes avoided for both present and future scenarios and their economic costs and benefits using impacts estimated per ton of pollutant from the U.S. Environmental Protection Agency (US EPA). Calculate estimates of economic costs of the fleet emissions in 2015 and economic benefits under lower emissions in the future (2050) fleet.
• Costs: Cost associated with each ton of pollution emitted. • Benefits: Value associated with each ton of pollution reduced.
• Report health and climate impacts and benefits for the following fleet scenarios:• 2015 Vehicle Fleet: Estimated emissions impacts of vehicles on the road today, roughly 98% powered by
combustion engines.• 2050 ZEV Future Scenario: Estimated emissions benefits resulting from current vehicle standards to 2025 and
a transition to 100% of new car sales being zero emission technologies by 2050 which means that roughly 65% of the fleet is made up of ZEVs in 2050. That fleet would include:
• 26 million combustion vehicles • 49 million ZEVs, assumed to be approximately 50-50 split between BEV and PHEV for this assessment.
• FCVs were not modeled for this analysis, however they will likely play an increasingly important role in electric transportation in the decades to come.
Pollution Data Collection: The Northeast States for Coordinated Air Use Management (NESCAUM) collected vehicle fleet emissions data using U.S. EPA MOtor Vehicle Emission Simulator (MOVES) model, and TetraTech LLC collected upstream emissions information using the Argonne National Laboratory’s Greenhouse Gases, Regulated Emissions, and Energy Use in Transportation Model (GREET) model.
MOVES model description (from EPA): “EPA’s MOtor Vehicle Emission Simulator (MOVES) is a state-of-the-science emission modeling system that estimates emissions for mobile sources at the national, county, and project level for criteria air pollutants, greenhouse gases, and air toxics.”
GREET model description (from Argonne National Lab): “Sponsored by the U.S. Department of Energy’s Office of Energy Efficiency and Renewable Energy (EERE), Argonne has developed a full life-cycle model called GREET (Greenhouse gases, Regulated Emissions, and Energy use in Transportation). It allows researchers and analysts to evaluate various vehicle and fuel combinations on a full fuel-cycle/vehicle-cycle basis.”
Criteria air pollutants include: ozone, carbon monoxide, sulfur oxides, nitrogen oxides, and lead. However only directly emitted Nitrogen Oxides (NOx), Volatile Organic Compounds (VOC), Fine Particle Matter (PM2.5), sulfur oxide pollution (SOx) and greenhouse gases (GHG) were analyzed in this study. For purposes of this study, the fuel combinations used were both the current fuel mix and a future fuel mix defined under “2050 ZEV Future Scenario” above.

21American Lung Association in California Clean Air Future: Health and Climate Benefits of Zero Emission Vehicles
Vehicle Fleet Emissions: Utilized U.S. EPA MOVES model to collect emissions data on vehicle fleet air pollutant and greenhouse gas emissions for the 10 ZEV States for both vehicle fleet scenarios. • For the ZEV future scenario, ZEV technologies were assumed to increase across the fleet mix in the 10 ZEV States,
ultimately rolling in to 100% of new car sales, or approximately 65% of the fleet, in 2050 being BEVs or PHEVs.
Upstream Emissions Calculations: Utilized Argonne National Laboratory GREET Model for emissions associated with the electricity or petroleum used to power passenger vehicles. Petroleum modeled included ethanol blended at 10% for all years of the analysis. Each reference to petroleum in this analysis is referring to petroleum with 10% ethanol blend.• Using the GREET model, determined an average value that reflects emissions (including air pollutants (NOx, SOx,
PM 2.5, VOCs) and greenhouse gas emissions) for the full life-cycle of energy used to power electric- and petroleum-fueled passenger vehicles.
• The average value accounts for upstream emissions that may occur beyond the location the fuels are processed or used, including emissions associated with:
• Extraction, refining and processing of transportation fuels• Transportation of fuels, including to refueling stations
• Passenger vehicle petroleum upstream emissions were combined with the tailpipe emissions values obtained through the MOVES emissions model to illustrate the full lifecycle emissions impacts of petroleum combustion in passenger vehicles. The petroleum upstream emissions analysis includes analysis of emissions associated with ethanol used in the 10% ethanol blend.
• Electricity upstream emissions for powering electric vehicles were assumed to be from a “marginal” electricity mix for all 10 ZEV states rather than “baseload energy,” and assumed one marginal emissions factor for all 10 ZEV States.
• Marginal electricity emissions are estimated by examining what kind of power generation is likely to be used to match any additional (or marginal) demand needed to power electric vehicles. The electricity consumed by the additional demand from EVs is electricity “on the margin” and is assumed to from one of two different mixes of electricity in this study.
• Baseload electricity emissions are estimated by examining the mix of electricity generation used to meet current demand in a given region (including coal, natural gas, hydro, renewables etc.), treating all the electricity produced and consumed in the region equally.
• Detailed modeling of future baseload energy in each state is beyond the scope of this report. Use of a marginal energy assumption for all 10 ZEV states, rather than baseload energy allows the study to focus on a cleaner mix of energy and reflects the steps being taken to transition to cleaner energy production underway in many states.
• Two marginal electricity scenarios were run, one using a GREET emission profile equivalent to emissions from a combined cycle natural gas power on the margin, and another using an emission profile equivalent to 100% renewable electricity power sources on the margin for comparison purposes.
• The ZEV Future scenario utilized the marginal energy mix equivalent to combined cycle natural gas to serve as a midpoint between the current national energy mix with predominantly fossil fuel sources and a future energy mix goal of zero emission renewable power.
Generating Health Outcome and Cost Information: Tetra Tech LLC applied health metrics derived from U.S. Environmental Protection Agency literature on a per ton basis to the collected emissions data.1 • It is important to note that the health outcome and monetization data is attributed on an aggregate tons scale – no
direct exposure data or analysis is included in this assessment. • Factors for health cases and monetization are assumed constant at 2030 and beyond.• Within the analysis, a mid-range valuation average (based on studies by American Cancer Society/Lepeule 20122
and Six-Cities/Krewski 20093) was calculated based on the foundation reports used by EPA to calculate per-ton damages, with monetized rates updated to $2015.
• Of the four pollutants, US EPA has not updated the valuation per ton of VOCs, as was done with the PM, NOx and SOx factors. For this assessment, prior average (American Cancer Society/Pope 20024 and Six-Cities/Laden 20065) VOC values were included.

22Clean Air Future: Health and Climate Benefits of Zero Emission Vehicles American Lung Association in California
Health, case-based evaluation: The table below shows the metrics (for 2016) applied to estimate the health outcomes of lifecycle emissions per ton of emissions attributed to the passenger vehicle fleet in the 10 ZEV States. These metrics were not applied to geographic or population density of exposure.
NOx SO2 Direct PM VOCPremature mortality 0.0014 0.0036 0.0681 0.00024Respiratory emergency room visits 0.0005 0.0011 0.0238 0.00010Acute bronchitis 0.0014 0.0040 0.0668 0.00023Lower respiratory symptoms 0.0173 0.0506 0.8526 0.00269Upper respiratory symptoms 0.0249 0.0722 1.2237 0.00203Minor restricted activity days 0.6903 1.9154 35.1018 0.11096Work-loss days 0.1162 0.3242 5.9243 0.01871Asthma exacerbation 0.0609 0.0741 3.0060 0.00247Cardiovascular hospital admissions 0.0003 0.0007 0.0139 0.00007Respiratory hospital admissions 0.0002 0.0005 0.0112 0.00003Non-fatal heart attacks 0.0010 0.0025 0.0493 0.00023
Health, monetization evaluation: The following monetary values were applied to estimate the monetized costs associated with the lifecycle emissions attributed to the passenger vehicle fleet in the 10 ZEV States. These are calculated on a per-ton of pollution basis (i.e. not applied to geographic or population density of exposure).
• PM2.5 - $614,575/ton in 2015 to $812,888/ton in 2050• NOx - $12,468 per ton in 2015 to $16,106 per ton in 2050• VOC - $1,963/ton in 2015 to $2,566/ton in 2050• SOx - $33,946/ton in 2015 to $45,297/ton in 2050
Generating Climate Change Cost Information: Climate change monetization was calculated by applying dollar values to each metric ton of greenhouse gas emitted (cost) or avoided (benefit).• The social cost of carbon valuations were derived from the U.S. Government Interagency Working Group on the
Social Cost of Carbon’s 2015 update document.6 • Social cost of carbon value presented in the Technical Support Document used $2007 dollars, which have
been updated for this report to $2015 dollars as follows:• 2015 value: $41 ($2015) per metric ton.• 2050 value: $79 ($2015) per metric ton.
• Social cost of carbon was developed to provide regulatory agencies with a way to provide the benefits of reducing climate pollutants when considering the costs and benefits of undertaking regulatory actions. The social cost of carbon incorporates the costs of climate impacts in such sectors as:
• Human health• Agricultural productivity• Property damage due to flooding• Ecosystem services

23American Lung Association in California Clean Air Future: Health and Climate Benefits of Zero Emission Vehicles
Combining Health Data and Social Cost of Carbon Data to Generate Combined Benefits:• To generate health benefits, each ton of emissions reduced (PM, NOx, VOC, SOx) was multiplied by the value per
ton as described above. The benefits shown represent the avoided costs created by a ZEV Future fleet in 2050 relative to the fleet in 2015. The direct health benefits (monetary costs) are calculated from avoided emissions the base year.
• To estimate the GHG benefits over time, the annual (benefit) value per ton of GHG reduced was multiplied by the annual reductions in GHG after 2015 to provide an annual estimate of benefits s shown in Figure 4. Note that overall GHG emissions drop by approximately 50% in this analysis and the value of the social cost of carbon nearly doubles between 2015 and 2050, so the avoided cost as reflected in Figure 1 remains almost constant.
• The calculated GHG benefits were then added to the total estimated health benefit to provide a clearer picture of the combined health and climate benefits of the ZEV Future scenario.
State and Household breakdown• Costs (Figure 7) and benefits (Table 1) attributed to each state by share of registered vehicles based on National
Automobile Dealers Association (NADA) data for vehicle registrations in 2014 (most recent data available).7 • Estimated benefits distributed across total households in each of the 10 ZEV States as reported by the U.S. Census
Bureau.8
1 United States Environmental Protection Agency, “Technical Support Document: Estimating the Benefit per Ton of Reducing PM2.5 Precursors from 17 Sectors,” January 2013. https://www.epa.gov/sites/production/files/2014-10/documents/sourceapportionmentbpttsd.pdf and Fann, N., Fulcher, C.M., and Hubbell, B.J., “The influence of location, source, and emission type in estimates of the human health benefits of reducing a ton of air pollution,” Air Quality, Atmosphere & Health. September 2009. https://www.ncbi.nlm.nih.gov/pmc/articles/PMC2770129/
2 Lepeule J, Laden F, Dockery D, Schwartz J. 2012. Chronic exposure to fine particles and mortality: an extended follow-up of the Harvard Six Cities study from 1974 to 2009. Environ Health Perspect 120:965–970; http://ehp.niehs.nih.gov/1104660/
3 Krewski D, Jerrett M, Burnett RT, Ma R, Hughes E, Shi Y, et al. 2009. Extended follow-up and spatial analysis of the American Cancer Society study linking particulate air pollution and mortality. Res Rep Health Eff Inst 140:5–114. https://www.healtheffects.org/publication/extended-follow-and-spatial-analysis-american-cancer-society-study-linking-particulate
4 Pope CA, Burnett RT III, Thun MJ (2002) Lung cancer, cardiopulmonary mortality, and long-term exposure to fine particulate air pollution. JAMA 287:1132–1141https://www.ncbi.nlm.nih.gov/pubmed/11879110
5 Laden F, Schwartz J, Speizer FE (2006) Reduction in fine particulate air pollution and mortality. Am J Respir Crit Care Med 173:667–672. https://www.ncbi.nlm.nih.gov/pubmed/16424447
6 United States Government. Interagency Working Group on Social Cost of Carbon. “Technical Support Document: Technical Update of the Social Cost of Carbon for Regulatory Impact Analysis Under Executive Order 12866.” July 2015. https://www.whitehouse.gov/sites/default/files/omb/inforeg/scc-tsd-final-july-2015.pdf
7 National Automobile Dealers Association (NADA). “Annual Financial Profile of America’s Franchised New-Car Dealerships.” 2015. https://www.nada.org/nadadata/ 8 United States Census Bureau. QuickFacts. Family and Living Arrangements. Accessed October 14, 2016. https://www.census.gov/quickfacts/table/PST045215/00
24Clean Air Future: Health and Climate Benefits of Zero Emission Vehicles American Lung Association in California
APPENDIX B: HEALTH OUTCOME CHARTS
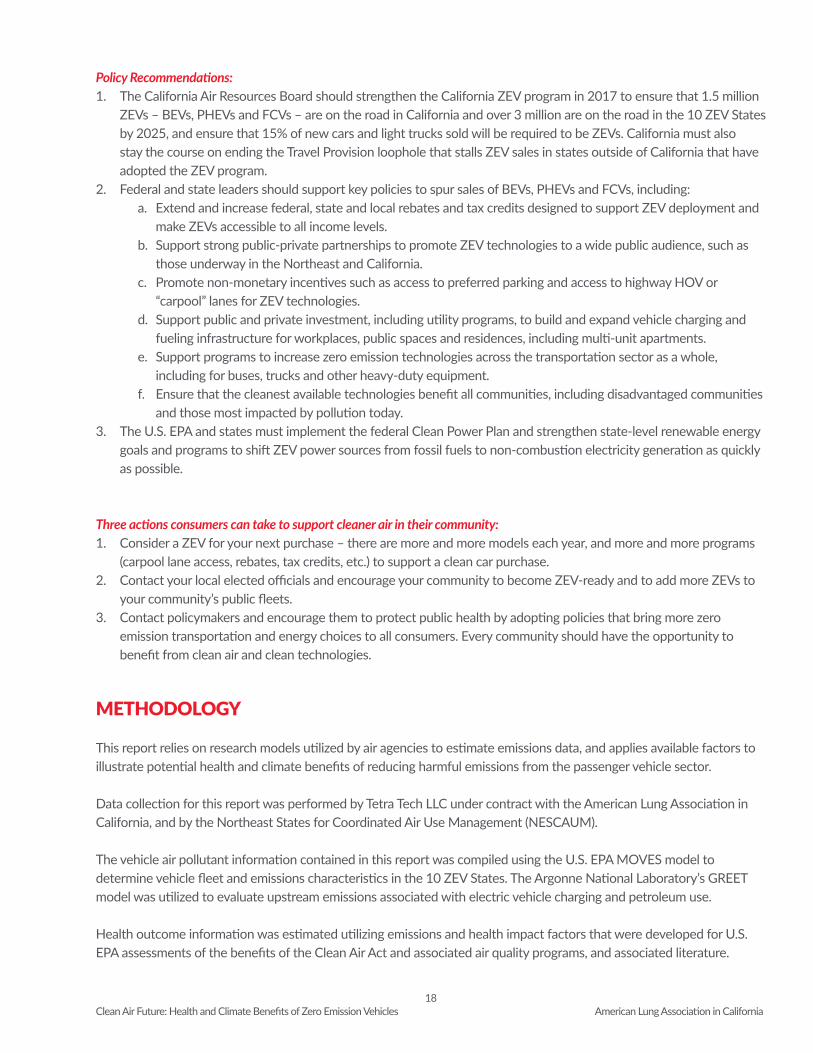
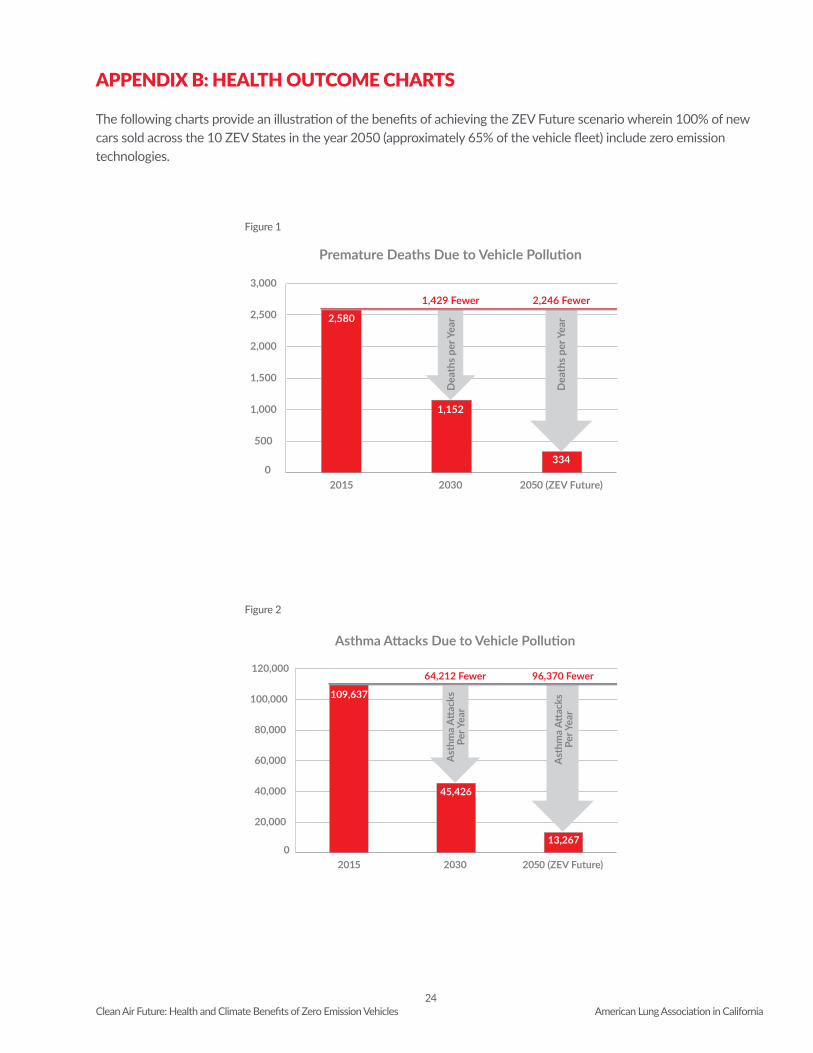
The following charts provide an illustration of the benefits of achieving the ZEV Future scenario wherein 100% of new cars sold across the 10 ZEV States in the year 2050 (approximately 65% of the vehicle fleet) include zero emission technologies.
0
500
1,000
1,500
2,000
2,500
3,000
Premature Deaths Due to Vehicle Pollution
2015 2030
1,429 Fewer 2,246 Fewer
2,580
334
1,152
2050 (ZEV Future)
Dea
ths p
er Y
ear
Dea
ths p
er Y
ear
Figure 1
0
20,000
40,000
60,000
80,000
100,000
120,000
Asthma Attacks Due to Vehicle Pollution
2015 2030
64,212 Fewer 96,370 Fewer
109,637
13,267
45,426
2050 (ZEV Future)
Ast
hma
Attac
ksPe
r Yea
r
Ast
hma
Attac
ksPe
r Yea
r
Figure 2

25American Lung Association in California Clean Air Future: Health and Climate Benefits of Zero Emission Vehicles
0
500
1,000
1,500
2,000
ER Visits/Hospitalization Due to Vehicle Pollution
2015 2030
1,024 Fewer 1,625 Fewer
1,868
243
844
2050 (ZEV Future)
ER V
isits
/H
ospi
taliz
aito
nPe
r Yea
r
ER V
isits
/H
ospi
taliz
aito
nPe
r Yea
r
Figure 4
0
50,000
100,000
150,000
200,000
250,000
Lost Work Days Due to Vehicle Pollution
2015 2030
132,878 Fewer 194,908 Fewer220,199
25,291
87,321
2050 (ZEV Future)
Lost
Wor
k D
ays
Per Y
ear
Lost
Wor
k D
ays
Per Y
ear
Figure 3

26Clean Air Future: Health and Climate Benefits of Zero Emission Vehicles American Lung Association in California
0
10,000
20,000
30,000
40,000
50,000
60,000
70,000
80,000
Upper/Lower Respiratory Symptoms Due to Vehicle Pollution
2015 2030
45,766 Fewer 68,413 Fewer
77,828
9,415
32,061
2050 (ZEV Future)
Hea
rt A
ttac
ksPe
r Yea
r
Hea
rt A
ttac
ksPe
r Yea
r
Figure 6
0
500
1,000
1,500
2,000
Heart Attacks Due to Vehicle Pollution
2015 2030
971 Fewer 1,629 Fewer1,895
266
924
2050 (ZEV Future)
Hea
rt A
ttac
ksPe
r Yea
r
Hea
rt A
ttac
ksPe
r Yea
r
Figure 5

27American Lung Association in California Clean Air Future: Health and Climate Benefits of Zero Emission Vehicles

lung.org/california | 1.800.LUNGUSA (1.800.586.4872)
@Californialung American Lung Association in California