Embed Size (px)
Citation preview

Clay Masonry Arch Project
Prepared For: Dr. Jennifer Tanner University of Wyoming College of Engineering
Department of Architectural and Civil Engineering Dept. 3295
1000 E. University Ave. Laramie, WY 82071
Prepared By: Michael Lujan Jason D. McKee
Jared Reimer Adam Tufte
Khaled Al Waili
ARE 4280 Masonry Design
December 15, 2005

Introduction
Our design group was asked to design and construct a clay masonry arch model for testing and analyzing. We were to predict possible failures and calculate its maximum capacities prior to testing. For the post-test analysis we were to determine the accuracy of our calculations and predictions.
Construction Guidelines
The guidelines for the arch model were to construct the arch with up to a maximum of 40 clay brick. The width of the model had to be 36 inches (+/- ½ inch), and the height was allowed to be between 18 and 24 inches.
Construction Procedures
For the first phase it was determined we had to assemble a jig out of plywood and Styrofoam to construct the clay masonry arch on. The jig and arch layout was drafted and plotted on large format paper and cut out to use as a template as shown in Figure 1.
Figure 1. Full‐size Jig Template
Next, the template was placed on plywood and cut out the form with a jigsaw. This was doen twice to have two plywood semicircles for the jig. Styrofoam was then “sandwiched” between the two plywood semicircles and secured together with duct tape as shown in Figure 2.

Figure 2. Jig Assembly
Finally, a plywood rectangular platform was secured to the flat side of the semicircle “sandwich” for the platform base of the jig.
The next phase was the construction of the masonry arch. During the drafting portion of the first phase, we concluded that this model could be constructed with 23 clay masonry units and be within the model size requirements.
Our group decided to use cement-lime Type S mortar because of its strength and workability. We mixed the Type S mortar by proportion, which requires 1 part cement, ½ part lime, and 4 ½ parts sand. Once the mortar was thoroughly mixed the arch construction began. Both legs of the arch were started by laying each course simultaneously. After laying each course we measured the mortar joints and floor-to-brick height (shown in Figure 3) to determine if the legs were being constructed evenly. This was performed until all bricks were laid forming the arch as shown in Figure 4.
Figure 3. Masonry Arch Construction Detail

Figure 4. Constructed Clay Masonry Arch
Testing Observation
Prior to testing, it was predicted the arch would fail at one of the mortar joints next to the brick at the peak, or keystone, and at the joint between the third and fourth or at 7.63 in. shown in Figure 3. We concluded to this guess because the keystone would endure the most stress in the arch therefore that joint would break. The joint at 7.64 in., shown in Figure 3, would fail because the bottom three courses were vertical and by the fourth course the bricks started to rotate to begin the arch pattern. Therefore, it would fail due to initial displacement during testing.
Before the testing began, a shrinkage crack was found at the joint next to the keystone brick. As the mortar was curing over a 28-day period, the arch began to shrink. Consequently, the jig prevented the arch from shrinking, thus a shrinkage crack was formed.
The arch was removed from the jig and placed in the loading frame of the servo-controlled actuator as shown in Figure 5. The arch was tested as a beam with the piston pressing down at the peak, or midspan, as the legs of the arch were supported by the testing room floor. The load of the piston was set at 0.05 inches/minute until critical failure.
During the testing, the arch developed additional joint separation at the 7.64 in. joint on both sides of the arch and the 18.34 in. joint on one side, see Figure 3. After the separation in the joints of the arch, the bricks were resisting against the reaction frames of the actuator shown in Figure 5. Finally, the arch could no longer support anymore load and failed completely.
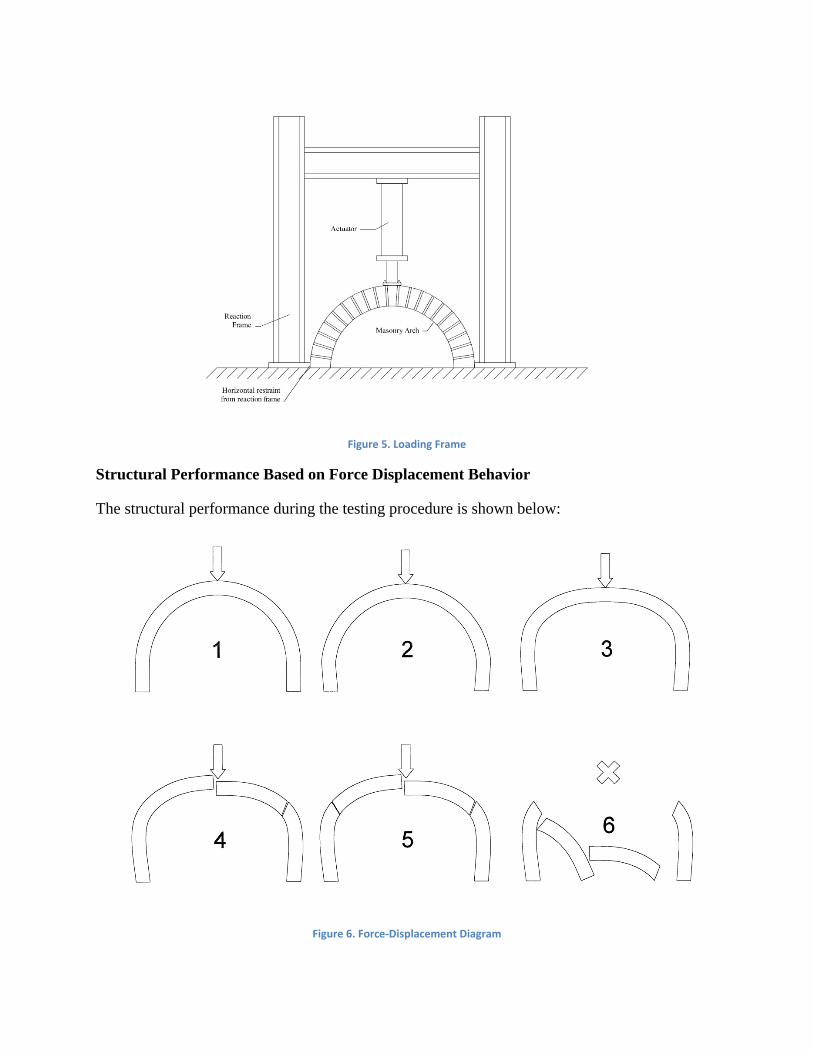
Figure 5. Loading Frame
Structural Performance Based on Force Displacement Behavior
The structural performance during the testing procedure is shown below:
Figure 6. Force‐Displacement Diagram

During the testing procedure, the arch underwent an imposed displacement creating a force. In Figure 5.1, the process began to take place and a load was applied. At first, no displacement was seen. In Figure 5.2, displacement began to occur. The most noticeable displacement was a rotation at the base of the arch as well as a downward displacement at the middle (keystone). As the arch was further tested (Figure 5.3) an outward projection was seen due to a deeper displacement of the middle, and further rotation of the base. Figures 5.4 and 5.5 show where cracking occurred due to the intense stress in the mortar joints at the critical locations. Eventually the displacement and force was great enough to fail the arch.
Structural Stiffness
The structural stiffness was measured to be the slope of the force/displacement graph in the elastic portion. The graph is shown in below:
Figure 7. Force‐Displacement Graph
We estimated the elastic portion of the test to be between the points (1.468, 240.53) and (53.121, 1.423). This is the most linear portion of the graph and the most accurate measurement could be made. The calculation for the stiffness is shown below:
Stiffness240.53 lb 53.121 lb
1.468 in 1.423 in
/
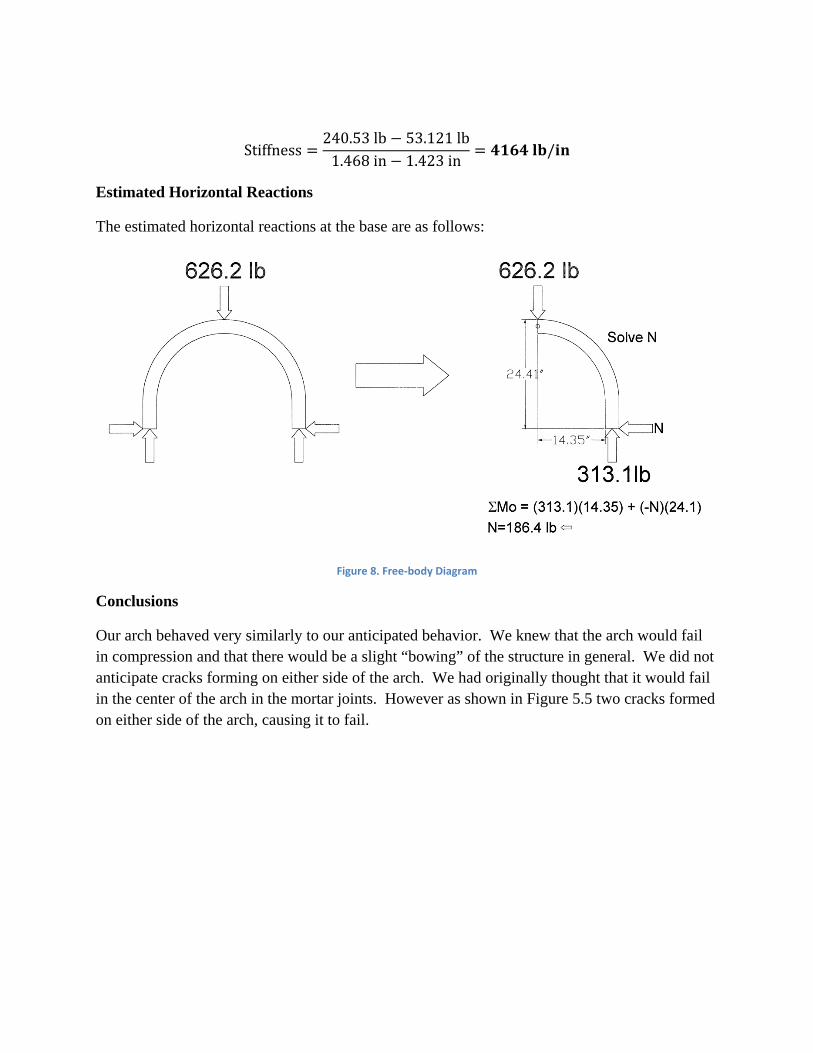
Estimated Horizontal Reactions
The estimated horizontal reactions at the base are as follows:
Figure 8. Free‐body Diagram
Conclusions
Our arch behaved very similarly to our anticipated behavior. We knew that the arch would fail in compression and that there would be a slight “bowing” of the structure in general. We did not anticipate cracks forming on either side of the arch. We had originally thought that it would fail in the center of the arch in the mortar joints. However as shown in Figure 5.5 two cracks formed on either side of the arch, causing it to fail.


![1A...STORIA ARTE LEGGIO [3C ARCH- D.IG.1] DID DID [3C ARCH- D.IG.2] DID DID DID DID DID PROARC CAPPELLI [3C ARCH- D.IG.2] LAB ARCH1 LETT-STOR INGLESE MATEM-FIS 5 ZINI MAZZONCINI CICIA](https://img.dokumen.tips/doc/110x75/60a77cbaf247e313df497fac/1a-storia-arte-leggio-3c-arch-dig1-did-did-3c-arch-dig2-did-did-did.jpg)