Embed Size (px)
Citation preview

Working Paper 09-61 Departamento de Economía Economic Series (38) Universidad Carlos III de Madrid October 2008 Calle Madrid, 126 28903 Getafe (Spain) Fax (34) 916249875
Class Attendance and Academic Performance among Spanish Economics Students
Vincenzo Andrietti, Rosaria D’Addazio and Carlos Velasco
Gómez
October 1, 2008 Abstract This paper presents new evidence on the effects of class attendance on academic performance. We analyse survey data collected for an Introductory Econometrics Course at the Facultad de Ciencias Sociales y Jurídicas of Universidad Carlos III de Madrid, matched to administrative data. Using OLS-proxy regressions to control for unobservable student characteristics potentially correlated with attendance, we find a positive and significant effect of attendance on academic performance. However, the fact that instrumental variable regressions may be failing to account for the correlation not captured by the controls calls for further investigation based on panel data. JEL classification: A22, I21.

1 Introduction
Evaluation of learning is a widely debated topic in the economic educa-tion literature. However, despite the common assumption that undergradu-ate students benefit from attending lectures, until the 1990s there was littleevidence about attendance and its effects on students’ learning. In line withRomer (1993) seminal article, a number of recent studies has found positiveeffects of attendance on performance, leading some authors to call for policiesto increase or even mandate attendance.
The extent to which we can rely on these results is however not alwaysclear, due to the fact that most studies leave unresolved the two main prob-lems usually affecting the attendance rate variable. First, self-reported atten-dance rates are likely to be measured with error, inducing attenuation biasin the estimated coefficients. Second, attendance rate is potentially endoge-nous, given that students choice of whether to attend lectures is positivelyaffected by unobservable individual characteristics, such as ability, effort, andmotivation, that are also likely to have a positive effect on performance. Thiscorrelation determines positive omitted variable bias in the estimates.
This paper represent an attempt to address these issues through the col-lection of a novel dataset that combines survey and administrative informa-tion. First, careful attendance monitoring at each class meeting throughoutthe semester allows accurate measurement of attendance rate. Second, datacollected include proxy variables of students ability, motivation and effort, aswell as instrumental variables thought to be correlated with the potentiallyendogenous variables but uncorrelated with the error.
We also contribute to fill the lack of evidence for European Union coun-tries, presenting novel empirical evidence for Spain.
The data for this study have been collected on students enrolled in theIntroduction to Econometrics course at the "Facultad de Ciencias Socialesy Jurídicas" of "Universidad Carlos III de Madrid" in the spring semester ofthe academic year 2006-2007.
We exploit the richness of the data to define a set of regressors proxiesof ability (registered and completed credit), effort (number of study hours,
2

efforts to get lecture notes) and motivation (students’ self reported interest inthe course). By including them in our regression we attempt to disentanglethe impact of attendance on performance from unobservable factors. Theproxy-regression results show a positive effect of attendance on academicperformance.
However, if proxies regressors were not perfect measures of unobservables,OLS-proxies regression would still be biased and inconsistent, incorrectlyattributing to attendance the effect of the components of ability, effort andmotivation not captured by the controls. One possible solution would be tofind appropriate instruments for the potentially endogenous variable.
We look further into this issue using distance from campus and havinga job as instruments for attendance. Although our instruments seem to beuncorrelated with the unobservables, their weak correlation with attendanceleads to undesirable consequences, such as high standard errors and bias.
Failure of cross-sectional instruments variation to account for potentialendogeneity of attendance calls for further investigation aiming at exploitingthe variability of attendance and performance in the time dimensions, whichwould require collection of panel data.
The remainder of this work is organized as follows. Section 2 reviews theliterature. Section 3 describes the data. Section 4 describes the empiricalstrategy. Section 5 presents the results. Section 6 concludes.
2 Literature
In his widely cited paper “Do students go to class? Should they?”, Romer(1993) was one of the first authors to explore the relationship between studentattendance and exam performance. From a preliminary survey on the extentof absenteeism at US colleges, he found that, on average, about one thirdof the students attending undergraduate economics courses at a representa-tive sample of American universities were missing class on a “typical” day. Inlight of this result, Romer used attendance records at six meetings of his largesize Intermediate Macroeconomics course in order to provide quantitative ev-idence on the effect of attendance on exam performance. The OLS estimates
3

implied that, after controlling for unobservable aptitude, motivation and ef-fort, attendance had a positive and significant impact on learning. On thebasis of these findings, Romer recommended experimenting with mandatoryattendance policies to enhance student performance1.
Two earlier studies had also found an inverse relationship between ab-senteeism and exam performance2. In a paper examining student allocationtime (n = 216), Schmidt (1983) reported that hours spent attending lecturesand discussion sections positively affected course grades, even after control-ling for hours of study. Park and Kerr (1990) used a multinomial logit modelin order to identify the determinants of academic performance in a Moneyand Banking course (n = 97). After holding student motivation constant,they found that higher attendance was associated with better performance,although students’ GPA and college entrance exam scores showed themselvesto be even more important factors.
Following Romer’s (1993) seminal paper, in the last fifteen years severalstudies have attempted to measure the impact of attendance on learning.Durden and Ellis (1995) uses students’ self-reported number of absences inorder to explore the relationship between absenteeism and academic achieve-ment in several sections (n = 346) of a Principles of Economics course. Con-trolling for student differences in background, ability and motivation, theyfind a nonlinear effect of attendance on learning: while a few absences do notlead to worse grades, excessive absenteeism does.
Using data on a sample of about 400 Agricultural Economics studentsat four large US universities, Devadoss and Foltz (1996) find that, aftertaking into account motivational and aptitude differences across students, thedifference in exam performance between a student with perfect attendanceand a student attending only half of the classes is, on average, a full lettergrade.
1Conflicting opinions on this controversial conclusion are expressed in Brauer et al.(1994).
2See McConnell and Lamphear (1969), Paden and Moyer (1969), Buckles and McMahon(1971), Browne et al. (1991) for previous evidence showing, on the contrary, no significantdifference in exam performance between students who attended and students who skippedclass.
4

Chan et al. (1997) examines the relationship between class attendanceand academic performance in two small sections (n = 71) of a Principlesof Finance course. After correcting for the selectivity bias due to studentwithdrawals by using Tobit and Heckman’s two-stage models, they find apositive effect of attendance on performance. They also find that a manda-tory attendance policy would not significantly enhance course grades.
Marburger (2001) applies an original approach to identify the “pure” ef-fect of absenteeism on exam performance in a small size (n = 60) Principlesof Microeconomics course. Student’s absences records over the semester arematched with records of the class meetings when the material correspond-ing to each question of three multiple-choice exams was covered. Resultsfrom a probit regression show that missing class on a specific day signif-icantly increase the likelihood to respond incorrectly to a multiple-choicequestion based on the material covered that day compared to students whowere present. This finding suggests a negative relationship between absen-teeism and academic performance.
Rodgers (2001) finds a small but statistically significant impact of atten-dance on academic performance in a sample of (n = 167) students enrolledin her Introductory Statistics course.
Using a sample of (n = 371) first-year italian Economics students, Brattiand Staffolani (2002) find that, after controlling for the number of studyhours, the positive and significant effect of class attendance on performanceis not robust to the inclusion of self study. Kirby and McElroy (2003) alsobase their analysis on a sample (n = 368) of first year economics studentsin Ireland. They find that class attendance is significantly affected by hoursworked and travel time to university. On the other hand, tutorial attendanceappears to enhance exam performance more than class attendance.
More recently, Stanca (2006) has been the author of the most compre-hensive study to date. He uses a large panel data set collected from anIntroductory Microeconomics course (n = 766) in a Italian university. Thedata combine administrative and survey sources. However, a limit of thedata is that attendance to classes and tutorials is self reported by students.Applying three different econometric approaches (OLS-proxy regression, in-
5

strumental variables and panel estimators) to address the endogeneity ofattendance rate variable, he bases his conclusions on panel data estimatesindicating that attendance has an important independent effect on learning.
Although most studies find positive effects of attendance on performance,the extent to which we can rely on the evidence presented in the cited stud-ies is not always clear. Most of the studies leave unresolved the two mainproblems usually affecting the attendance rate variable.
First, self-reported attendance rates are likely to be measured with error,inducing attenuation bias in the estimated coefficients. 3
Second, attendance rate is potentially endogenous, given that studentschoice of whether to attend lectures is positively affected by unobservableindividual characteristics, such as ability, effort, and motivation, that are alsolikely to have a positive effect on performance. This correlation determinespositive omitted variable bias in the estimates. Existing studies based oncross-sectional data either do not face the endogeneity problem or attemptto disentangle the impact of attendance on performance from unobservablefactors introducing proxy variables for unobservable ability (scores on collegeentry exams, grade point average), effort (number of study hours, completionof homework assignments) and motivation (students’ self reported interest inthe course). Stanca(2006) is the first to apply instrumental variables methodsin this literature.
A few studies based on panel data exploit the variability of attendanceand performance in the time dimension4. This allows to take into accounttime-invariant unobservable factors that affect both attendance and perfor-mance, and therefore to eliminate the omitted variable bias that characterizesestimates of the effect of attendance on performance even adequate instru-ments are not available.
Moreover, most of the literature focuses on the US. Kirby and McEl-roy(2003) for Ireland and Bratti and Staffolani(2002) and Stanca(2006) forItaly provide the only evidence available in the European Union context.This study contributes towards filling this gap, presenting novel evidence for
3Of the cited studies only Marburger (2001) records attendance at each class meeting.4See Marburger (2001), Rodgers(2001) and Stanca(2006).
6
Spain.
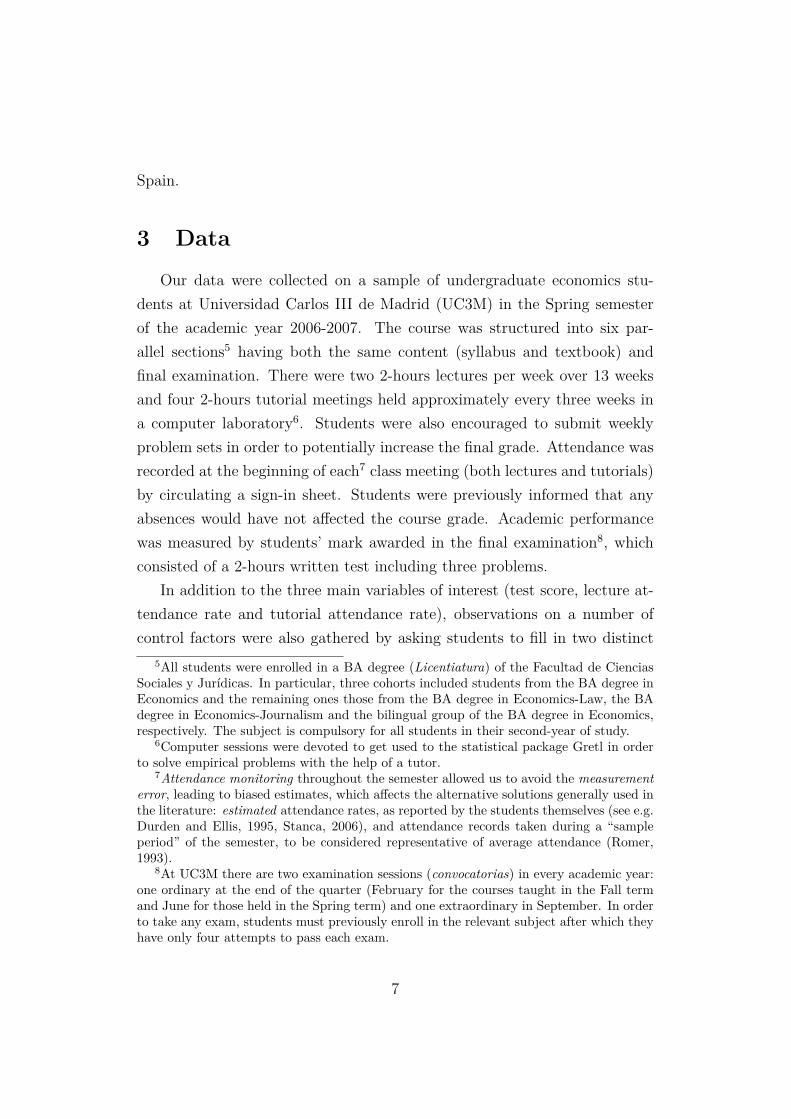
3 Data
Our data were collected on a sample of undergraduate economics stu-dents at Universidad Carlos III de Madrid (UC3M) in the Spring semesterof the academic year 2006-2007. The course was structured into six par-allel sections5 having both the same content (syllabus and textbook) andfinal examination. There were two 2-hours lectures per week over 13 weeksand four 2-hours tutorial meetings held approximately every three weeks ina computer laboratory6. Students were also encouraged to submit weeklyproblem sets in order to potentially increase the final grade. Attendance wasrecorded at the beginning of each7 class meeting (both lectures and tutorials)by circulating a sign-in sheet. Students were previously informed that anyabsences would have not affected the course grade. Academic performancewas measured by students’ mark awarded in the final examination8, whichconsisted of a 2-hours written test including three problems.
In addition to the three main variables of interest (test score, lecture at-tendance rate and tutorial attendance rate), observations on a number ofcontrol factors were also gathered by asking students to fill in two distinct
5All students were enrolled in a BA degree (Licentiatura) of the Facultad de CienciasSociales y Jurídicas. In particular, three cohorts included students from the BA degree inEconomics and the remaining ones those from the BA degree in Economics-Law, the BAdegree in Economics-Journalism and the bilingual group of the BA degree in Economics,respectively. The subject is compulsory for all students in their second-year of study.
6Computer sessions were devoted to get used to the statistical package Gretl in orderto solve empirical problems with the help of a tutor.
7Attendance monitoring throughout the semester allowed us to avoid the measurementerror, leading to biased estimates, which affects the alternative solutions generally used inthe literature: estimated attendance rates, as reported by the students themselves (see e.g.Durden and Ellis, 1995, Stanca, 2006), and attendance records taken during a “sampleperiod” of the semester, to be considered representative of average attendance (Romer,1993).
8At UC3M there are two examination sessions (convocatorias) in every academic year:one ordinary at the end of the quarter (February for the courses taught in the Fall termand June for those held in the Spring term) and one extraordinary in September. In orderto take any exam, students must previously enroll in the relevant subject after which theyhave only four attempts to pass each exam.
7

questionnaires. The former, consisting of 29 multiple-choice questions aboutfamily background and individual characteristics and habits, was adminis-tered during the first9 class meeting. The latter, including a further 4 ques-tions pertaining to students’ study habits and teaching and subject evalua-tion, was compiled before starting the exam. These data were supplementedwith the administrative records of UC3M providing detailed information onstudents’ academic career10. Matching data from two different sources (sur-vey and administrative) helps considerably in improving data quality. It isworth noting that such a strategy is a peculiarity of our study in comparisonwith the body of the literature11. The sample so obtained include 488 stu-dents, of whom 172 returninge incomplete questionnaires were dropped fromthe analysis. The actual sample is therefore composed by 316 individuals.
Descriptive statistics for the main variables used in the empirical anal-ysis are presented in Table 112. For ease of interpretation, exam score13
was expressed as a percentage. In our sample, the average grade rangedbetween 0 and 100 around a mean value of 62.29. A typical student at-tended, on average, 42.99 per cent of lectures14 and a lower percentage oftutorials (37.68). The set of control factors includes demographic variables(male, siblings, live with family, distance), information about individual andfamily background (technology, father graduate, mother graduate, father not
9Absent and non-attending students compiled it when taking the examination. Un-like most previous ones, our study includes in the empirical analysis even students whowithdrew from the course and those who never attended class in order to avoid potentialsample selection bias.
10See Table 1 in the appendix for a list of the main variables formally obtained asadministrative data.
11Park and Kerr (1990), Chan et al. (1997) and Kirby and McElroy (2003) are the onlystudies base on matched data.
12We added a column specifying the source of the variables: survey or administrativedatabase.
13Spanish university system employs a numerical grading scale, even though coursegrades are delivered to the students into a categorical form. In particular, marks, rangingfrom 0 to 10, are grouped into the following five categories: Suspenso (grades between 0and 5), Aprobado (between 5 and 7), Notable (between 7 and 9), Sobresaliente (between 9and 10) and Matrícula de Honor (10 or very close to this grade).
14This figure is substantially lower than those reported in the literature: Romer (67%),Stanca (67.4%), Rodgers (64%, 70%), Marburger (82%), Devadoss and Foltz (89%). It iscomparable only with that observed by Kirby and McElroy (47%).
8

working, mother not working), students’ characteristics (pc) and proxies forindividual unobservable factors. In particular, ability was measured by twoindicators: credits enrolled, ranging between 35 and 135 around a mean valueof 86.72 and credits completed, showing an average value of 149.21, with arange from 48 to 313. Effort was proxied by four variables: weekly hoursof study, registering a mean value of 3.13, with a range between 0 and 20;never asking notes, sometimes asking notes and often asking notes, dummyvariables measuring how intensely the students searched for lectures notes.All three averaged quite low (0.06, 0.32 and 0.19, respectively). Measures ofmotivation included subject evaluation and teaching evaluation, as reportedby the students themselves on a 0-100 scale. They registered average valuesof 62.61 and 65.93, respectively.
Table 2 provides summary statistics comparing non-attending studentsversus attending ones. Interestingly, students with a positive attendance ratescored significantly better than students who never attended lectures: thedifference in exam performance between the two groups was approximately 11percentage points (63.07 and 51.82, respectively). Moreover, by consideringonly those students who attended at least one lecture, we discovered a similaraverage attendance rate (46.20 compared to 42.99 for the overall sample).
Table 3 shows descriptive statistics (means) for some indicators of per-formance, attendance, ability and effort by students’ degree course. In thelast row of the table the overall means are displayed. On average, studentsenrolled in the Economics-Law degree revealed themselves to be the bestones, as they obtained the best marks (average grade of 71.81, almost 10percentage points above the overall mean of 62.29), attended the highestpercentage of lectures (50.41 compared to the overall mean rate of 42.99)and completed the highest number of credits (194.01 against the overallmean value of 149.21). On the contrary, students performing worst werethose enrolled in the Economics-Journalism degree: on average, they scored56.93 and registered 120.63 credits completed. The lowest attendance ratebelonged, instead, to the students from Economics-Bilingual degree: averagevalues of 24.48 per cent for lectures and 23.46 per cent for tutorials. Studentsfrom Economics degree reported values generally close to the overall means.
9

Finally, the average values of weekly study hours and credits enrolled werefound in line with the overall means (3.13 and 86.72, respectively) for all thedegree courses.
4 Empirical Strategy
Our goal is to specify and estimate an appropriate education productionfunction (EPF) explaining academic performance in terms of class attendancerate, all other things being equal. According to the EPF approach15, a basiclearning model can take the following form:
yi = β0 + β1xi1 + β2xi2 + ui i = 1, 2, . . . , n (1)
where yi is the educational outcome for individual i, measured by examscore, xi1 is class attendance rate, xi2 is a vector including selected inputsinto the achievement process and ui is an error term containing all the otherfactors influencing academic performance.
Input measures are those suggested by both theoretical considerationsand the results of previous studies. They range from school inputs to familybackground, from socio-economic variables to students’ study habits. Amongthe several factors which matter for academic achievement there are also cer-tain unobservable student characteristics, such as ability, effort and motiva-tion. Since these same variables are potentially correlated with the students’propensity to attend class, excluding them from the model would give riseto a problem of omitted variable bias. In this study, we survey two differ-ent econometric approaches accounting for possible sources of endogeneity inorder to estimate a causal relationship between attendance and exam perfor-mance.
One way to compensate for missing data on specific input variables isto include in the OLS regression one or more proxy variables. Considera population model with two explanatory variables, one of which (x∗i2) isunobserved:
15See, among others, Lazear (2001), Coates (2003) and Todd and Wolpin (2003).
10

yi = β0 + β1xi1 + β2x∗i2 + ui (2)
and suppose we have a proxy variable (xi2) for x∗i2. On the basis ofthe relationship between the unobservable factor and the proxy variable,captured by the simple regression model:
x∗i2 = δ0 + δ2xi2 + ηi (3)
we can regress yi on xi1 and xi2. Such a procedure can lead to a consistentestimator of the slope parameter β1 under the following assumptions aboutui and ηi:
1. the error ui is uncorrelated with xi2. This condition is equivalent toassuming that xi2 is irrelevant in the population model once xi1 andx∗i2 have been controlled for. In terms of conditional expectations, wecan write:
E(yi|xi1, x∗i2, xi2) = E(yi|xi1, x∗i2) (4)
2. the error ηi is uncorrelated with xi1 and xi2. Assuming this requires xi2to be a “good” proxy for x∗i2. In a conditional mean sense, we have:
E(x∗i2|xi1, xi2) = E(x∗i2|xi2) = δ0 + δ2xi2 (5)
that is x∗i2 has zero correlation with xi1 once xi2 has been controlledfor.
In our analysis ability is proxied by credits enrolled and credits completed,effort by hours of study, never asking notes, sometimes asking notes and oftenasking notes, motivation by subject evaluation and teaching evaluation.
Proxy variables may be difficult to find in practice and the ones availabledo not always satisfy the properties needed to produce a consistent estimatorof β1. In such cases an alternative approach to the endogeneity problem isoffered by the method of instrumental variables (IV). It allows to consistentlyestimate the unknown parameters of the population regression function when
11

the regressor of interest (xi1) is correlated with the error term ui, for instancein the presence of omitted variables.
Instrumental variables estimator:
β̂IV1 = Cov(zi, yi)Cov(zi, xi)
(6)
eliminates such a correlation provided the “instruments” zi satisfy thetwo conditions for instrument validity:
1. Instrument Relevance: zi is correlated with xi1
Cov(zi, xi1) 6= 0 (7)
This assumption can be verified by regressing xi1 against zi and theincluded exogenous variables. Instruments not satisfying such a con-dition are called “weak”. Weak instruments16 imply a 2SLS estimatorbiased and 2SLS t-statistics and confidence intervals unreliable.
2. Instrument Exogeneity: zi is uncorrelated with ui
Cov(zi, ui) = 0 (8)
This condition can be partially checked with the test of overidentifyingrestrictions as long as the number of instruments exceeds the numberof included endogenous variables. If the instruments are not exogenous,then the 2SLS estimator is inconsistent.
In the following we run two stage least squares regression using distancecovered to reach campus (in kilometers) and work (1=working student) asinstruments for attendance.
16We can check for instrument “weakness” by computing an F test. When there is asingle endogenous regressor, we face with weak instruments if the first-stage F -statisticsis less than 10 (Bound, Jaeger and Baker (1995)).
12

5 Results
We start by estimating alternative specifications of our learning model byOLS regression. Table 4 presents the point estimates for the overall sample(n = 316). Attendance is found to have a small but statistically significant(at the one percent level) effect on performance in all models. On average,attending an extra percentage point of lectures increases test score of about0.13 percentage points. It should be noted that the estimated coefficienton attendance keeps basically the same after controlling for both individualcharacteristics and unobservable factors, as shown in columns 2 to 5. Onepossible explanation for such a result is that we could have not selected goodproxies for ability, effort and motivation.
Among the control variables included in the OLS models, only a fewhave a significant effect on student performance. In specifications 2 and 4live with family is negatively and significantly associated to performance (atthe five and ten percent levels, respectively). As reported in columns 3 and5, credits completed appears as one of the most important determinants ofacademic performance. In both models the coefficient on this ability indicatoris statistically significant at the one percent level and has the expected sign:one additional credit completed corresponds to a 0.07 percent higher testscore. The point estimate for subject evaluation is also quantitatively small(0.09 and 0.10 in specifications 4 and 5, respectively) and significant at thefive percent level. Finally, in contrast with the majority of the literature, wefind no significant difference in the performance of males and females.
Table 5 shows the results obtained by restricting the sample to the 294students who attended at least one lecture. Interestingly, we find that at-tendance rate is not sensitive to the exclusion from the data set of thosestudents who never attended class. In fact, the point estimates keep almostunchanged. For instance, the coefficient on attendance falls from 0.12 to 0.10in the basic univariate specification and from 0.13 to 0.11 in the remainingmodels. Subject evaluation has a coefficient only slightly higher (from 0.09to 0.11 in model 4 and from 0.10 to 0.13 in specification 5), whereas creditscompleted is exactly the same both in magnitude and statistical significance.
13

Only credits enrolled now becomes significant, at the five percent level.We finally compare the effects of lecture and tutorial attendance on stu-
dent performance. The results are reported in Table 6. We run three differentOLS regressions including the complete set of controls. The first specifica-tion (5) contains lecture attendance as the main regressor; in the secondone (5a) lecture attendance is replaced with tutorial attendance, whereas inthe last one (5b) lectures and tutorials are jointly included. The coefficienton tutorial in column 2 indicates that the effect tutorial attendance on aca-demic performance is very close to that of lecture attendance: 0.09 and 0.13percent improvement in final grade for one additional percentage point of at-tendance, respectively. Adding both variables in the same specification doesnot change the relationship between the estimated coefficients. As shown incolumn 3, the point estimates are quite similar (0.11 and 0.02 for lecture andclass attendance, respectively). This result suggests that the respective rolesof lectures and classes cannot be identified separately.
As an alternative approach to the endogeneity problem, we then run twostage least squares regression using distance covered to reach campus (in kilo-meters) and work (1=working student) as instruments for attendance. Theresults shown in Table 7 are qualitatively similar to the previous ones. Themain finding is that now the estimated effect of attendance on performanceis substantially higher (nearly 0.50, that is about four times higher than thepoint estimates obtained with models that do not take into account endo-geneity or that simply employ proxy variables) and slightly significant. Also,we would have expected a reduction on the estimated coefficient, given thatthe OLS-proxies results may be still upward biased. The rise in estimatedcoefficient and in standard errors may be due to the fact that our instrumentsare only weakly correlated with attendance. This result suggests that instru-mental variables methods are not failing in taking into account the remainingendogeneity of the attendance rate variable.
14

6 Conclusions
Although continuous evaluation of students learning is among the prin-ciples inspiring the European Space of Higher Education (Bologna Process),evidence about the effect of class attendance on academic performance islacking for most European Union countries. This is partly due to the lackof adequate data and partly due to methodological problems. This analysisrepresents a first step towards filling this gap. Using new data that combinesdifferent sources of information and regression proxies techniques we find asignificant effect of lecture attendance on academic performance. However,failure of cross-sectional instruments variation to account for potential en-dogeneity of attendance calls for further investigation aiming at exploitingthe variability of attendance and performance in the time dimensions, whichwould require collection of panel data.
References
[1] Bound, J., Jaeger, D.A. and Baker, R.M. (1995). “Problems with In-strumental Variables Estimation When the Correlation Between the In-strument and the Endogenous Explanatory Variable Is Weak.”, Journalof the American Statistical Association, 90 (430), 443-450.
[2] Bratti, M. and Staffolani, S. (2002). “Student time allocation and ed-ucational production functions”, Quaderni di ricerca, Dipartimento diEconomia - Universita’ di Ancona, July, no. 170.
[3] Browne, N.M., Hoag, J., Wheeler, M.V. and Boudreau, N. (1991). “TheImpact of Teachers in Economic Classrooms”, Journal of Economics,17, 25-30.
[4] Buckles, S.G. and McMahon, M.E. (1971). “Further Evidence on theValue of Lecture in Elementary Economics”, Journal of Economic Edu-cation, 2(2), 138-141.
[5] Chan, K.C., Shum, C. and Wright, D.J. (1997). “Class attendance and
15

student performance in principles of finance”, Financial Practice andEducation, Fall/Winter, 7(2), 58-65.
[6] Coates, D. (2003). “Education production functions using instructionaltime as an input”, Education Economics, 11(3), 273-292.
[7] Devadoss, S. and Foltz, J. (1996). “Evaluation of factors influencingstudent class attendance and performance”, American Journal of Agri-cultural Economics, August, 78(3), 499-507.
[8] Dolado, J.J. and Morales, E. (2008). “Which Factors Determine Aca-demic Performance of Undergraduate Students In Economics? SomeSpanish Evidence”, Working Paper.
[9] Durden, G.C. and Ellis, L.V. (1995). “The effects of attendance on stu-dent learning in principles of economics”, American Economic ReviewPapers and Proceedings, May, 85(2), 343-346.
[10] Kirby, A. and McElroy, B. (2003). “The effect of attendance on gradefor first-year Economics students in University College Cork”, The Eco-nomic and Social Review, 34(3), 311-326.
[11] Lazear, E.P. (2001). “Educational production”, Quarterly Journal ofEconomics, 116(3), 777-803.
[12] Marburger, D.R. (2001). “Absenteeism and undergraduate exam perfor-mance”, Journal of Economic Education, Spring, 32(2), 99-109.
[13] McConnell, C.R. and Lamphear, C. (1969). “Teaching Principles of Eco-nomics Without Lectures”, Journal of Economic Education, 1(4), 20-32.
[14] Paden, D.W. and Moyer, M.E. (1969). “The effectiveness of TeachingMethods: The Relative Effectiveness of Three Methods of TeachingPriciples of Economics”, Journal of Economic Education, 1, 33-45.
[15] Park, K.H. and Kerr, P.M. (1990). “Determinants of academic perfor-mance: a multinomial logit approach”, Journal of Economic Education,Spring, 21(2), 101-111.
16

[16] Rodgers, J.R. (2001). “A panel-data study of the effect of student at-tendance on university performance”, Australian Journal of Education,45(3), 284-295.
[17] Romer, D. (1993). “Do students go to class? Should they?”, Journal ofEconomic Perspectives, Summer, 7(3), 167-174.
[18] Schmidt, R.M. (1983). “Who maximizes what? A study in student timeallocation”, The American Economic Review, May, 73(2), 23-28.
[19] Stanca, L. (2006). “The Effects of Attendance on Academic Perfor-mance: Panel Data Evidence for Introductory Microeconomics”, Journalof Economic Education, 37(3), 251-266.
[20] Stock, J.H. and Watson M.W. (2003). “Introduction to Econometrics”,Addison Wesley.
[21] Todd, P.E. and Wolpin, K.I. (2003). “On the specification and estima-tion of the production function for cognitive achievement”, The Eco-nomic Journal, February, 113, F3-F33.
[22] Wooldridge, J.M. (2006). “Introductory Econometrics. A Modern Ap-proach”, South-Western.
17

Table 1: Descriptive Statistics
Variable Source Mean Std. Dev. Min MaxScore (%) admin 62.29 17.40 0.00 100.00Attendance (%) survey 42.99 30.58 0.00 100.00Tutorial (%) survey 37.68 32.45 0.00 100.00Male admin 0.55 0.50 0.00 1.00Siblings survey 1.25 0.91 0.00 5.00Live with family survey 0.73 0.44 0.00 1.00Distance survey 18.04 14.54 0.00 80.00Technology admin 0.21 0.41 0.00 1.00Father graduate survey 0.35 0.48 0.00 1.00Mother graduate survey 0.27 0.44 0.00 1.00Father not working survey 0.08 0.27 0.00 1.00Mother not working survey 0.35 0.48 0.00 1.00Pc survey 0.96 0.21 0.00 1.00Credits enrolled admin 86.72 13.78 35.00 135.00Credits completed admin 149.21 56.17 48.00 313.00Hours of study survey 3.13 2.49 0.00 20.00Never asking notes survey 0.06 0.24 0.00 1.00Sometimes asking notes survey 0.32 0.47 0.00 1.00Often asking notes survey 0.19 0.39 0.00 1.00Subject evaluation survey 62.61 24.40 0.00 100.00Teaching evaluation survey 65.93 22.70 0.00 100.00Note: n=316.
18

Table 2: Descriptive Statistics by attendance rate
VariableAttendance=0 Attendance>0
(n=22) (n=294)Mean Std. Dev. Mean Std. Dev.
Score (%) 51.82 17.41 63.07 17.17Attendance (%) 0.00 0.00 46.20 29.27Tutorial (%) 1.14 5.33 40.42 31.97Male 0.55 0.51 0.55 0.50Siblings 1.05 0.65 1.27 0.93Live with family 0.73 0.46 0.73 0.45Distance 22.40 19.52 17.72 14.10Technology 0.14 0.35 0.22 0.41Father graduate 0.23 0.43 0.36 0.48Mother graduate 0.18 0.39 0.28 0.45Father not working 0.09 0.29 0.08 0.27Mother not working 0.41 0.50 0.35 0.48Pc 0.95 0.21 0.96 0.21Credits enrolled 93.77 17.04 86.20 13.40Credits completed 144.73 45.74 149.55 56.92Hours of study 4.45 4.36 3.03 2.27Never asking notes 0.05 0.21 0.06 0.25Sometimes asking notes 0.50 0.51 0.31 0.46Often asking notes 0.18 0.39 0.18 0.39Subject evaluation 57.50 26.58 62.99 24.23Teaching evaluation 55.91 23.69 66.68 22.49
19

Table3:
Descriptiv
eStatist
ics(m
eans)by
degree
course
DegreeCou
rse
Score(%
)Attenda
nce(%
)Tu
toria
l(%)
Credits
Enrolled
Credits
Com
pleted
Hou
rsof
stud
yEc
onom
ics
59.0
244.1
040.3
686.4
313
2.44
3.17
Econ
omics-Bilin
gual
61.5
624.4
823.4
686.8
915
9.67
3.00
Econ
omics-Jo
urna
lism
56.9
335.8
432.3
286.7
012
0.63
3.06
Econ
omics-La
w71.8
150.4
139.6
387.2
619
4.01
3.13
Total
62.2
942.9
937.6
986.7
214
9.21
3.13
Not
e:n=
316.
20

Table4:
Determinan
tsof
acad
emic
perfo
rman
ce:OLS
estim
ates
(fullsample)
Indepe
ndentVa
riable
OLS
OLS
OLS
OLS
OLS
(1)
(2)
(3)
(4)
(5)
Attenda
nce
0.12
***
0.13
***
0.13
***
0.13
***
0.13
***
Male
0.82
0.27
0.59
−0.
07Siblings
−0.
76−
0.92
−0.
77−
0.97
Live
with
family
−4.
20**
−3.
10−
3.50
*−
2.5
Pc−
0.81
−0.
21−
0.71
−0.
52Te
chno
logy
1.40
1.80
1.80
2.10
Credits
enrolled
0.11
0.11
Credits
completed
0.07
***
0.07
***
Hou
rsof
stud
y0.
300.
14Never
asking
notes
5.30
3.50
Sometim
esasking
notes
2.60
2.00
Ofte
nasking
notes
0.77
1.30
Subjectevalua
tion
0.09
**0.
10**
Teacherevalua
tion
0.01
0.00
Con
stan
t57.0
0***
56.0
0***
36.0
0***
47.0
0***
28.0
0***
R2
0.04
0.15
0.22
0.18
0.24
Not
e:n=
316
Sign
ificancelevels:(*)p<
0.10,(**
)p<
0.05
,(***)
p<0.
01.
Other
controlfactors
(dum
mies):father
grad
uate,m
othergrad
uate,fatherno
tworking
,motherno
tworking
.
21

Table5:
Determinan
tsof
acad
emic
perfo
rman
ce:OLS
estim
ates
(attenda
nce>
0)
Indepe
ndentVa
riable
OLS
OLS
OLS
OLS
OLS
(1)
(2)
(3)
(4)
(5)
Attenda
nce
0.10
***
0.11
***
0.11
***
0.11
***
0.11
***
Male
1.60
1.00
1.40
0.62
Siblings
−1.
10−
1.40
−1.
20−
1.50
Live
with
family
−4.
10*
−2.
90−
3.40
−2.
10Pc
−1.
70−
1.30
−0.
82−
0.91
Techno
logy
0.52
0.96
0.88
1.20
Credits
enrolled
0.16
**0.
17**
Credits
completed
0.07
***
0.07
***
Hou
rsof
stud
y0.
460.
23Never
asking
notes
4.50
2.60
Sometim
esasking
notes
2.00
0.91
Ofte
nasking
notes
1.50
2.00
Subjectevalua
tion
0.11
**0.
13***
Teacherevalua
tion
0.02
0.01
Con
stan
t59.0
0***
59.0
0***
34.0
0***
47.0
0***
24.0
0***
Not
e:n=
294
Sign
ificancelevels:(*)p<
0.10,(**
)p<
0.05
,(***)
p<0.
01.
Other
controlfactors
(dum
mies):father
grad
uate,m
othergrad
uate,fatherno
tworking
,motherno
tworking
.
22

Table 6: Determinants of academic performance: OLS estimates (lectures vstutorials)
Equation OLS OLS OLS(5) (5a) (5b)
Attendance 0.13 *** 0.11 **Tutorial 0.09 *** 0.02R2 0.24 0.23 0.24Note: n=316
Significance levels: (*) p< 0.10, (**) p< 0.05, (***) p< 0.01.
23
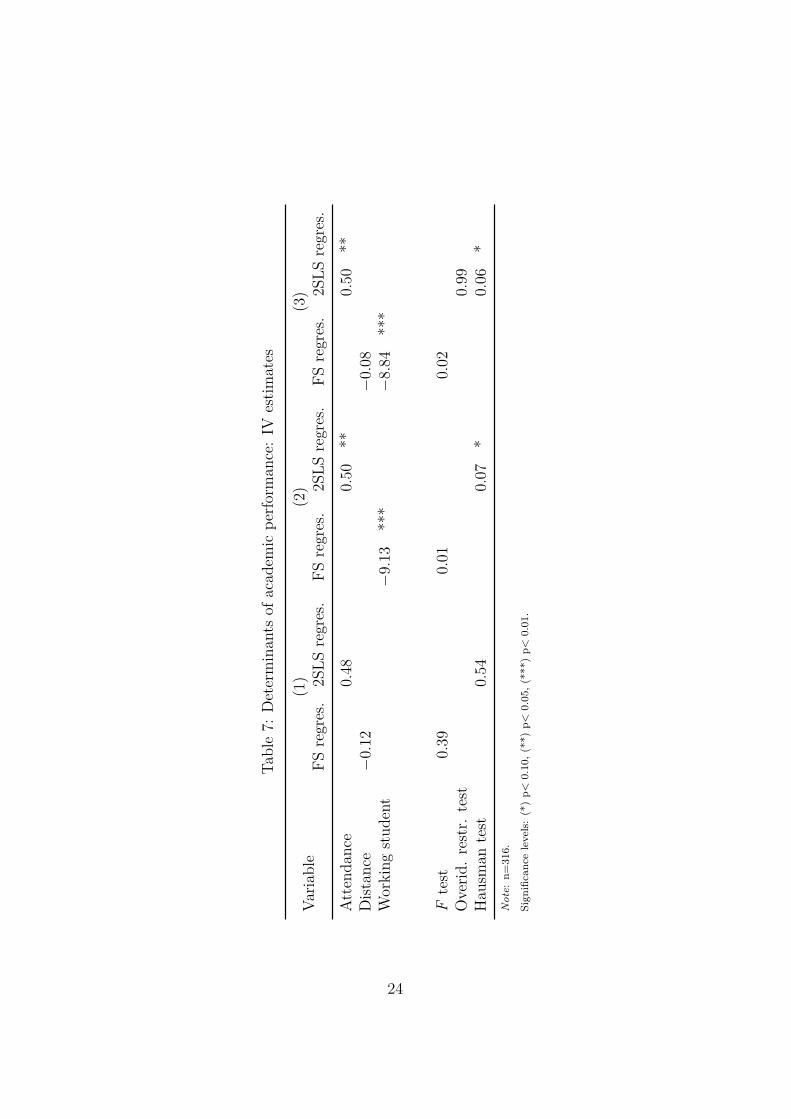
Table7:
Determinan
tsof
acad
emic
perfo
rman
ce:IV
estim
ates
Varia
ble
(1)
(2)
(3)
FSregres.
2SLS
regres.
FSregres.
2SLS
regres.
FSregres.
2SLS
regres.
Attenda
nce
0.48
0.50
**0.
50**
Dist
ance
−0.
12−
0.08
Working
stud
ent
−9.
13***
−8.
84***
Ftest
0.39
0.01
0.02
Overid
.restr.
test
0.99
Hau
sman
test
0.54
0.07
*0.
06*
Not
e:n=
316.
Sign
ificancelevels:(*)p<
0.10,(**
)p<
0.05,(**
*)p<
0.01.
24