Embed Size (px)
Citation preview

1
Class #4September 4, 2008
Measuring the Impact of IT ProjectsTangible and Intangible
MBA/MIS - 513

2
AVERY CLOUDCIO NEW HANOVER HEALTH SYSTEM

3
Tonight’s Agenda
Guest PresenterAvery Cloud
Questions on the homework
Measuring Employee Productivity

4
Due next week - MondayROI Exercise
Upload to Entropy as a .doc, .docx, .zip by Monday at 6PM
Justify your recommendationsShow your work

5
Due next week – Monday (Cases)Building IT Infrastructure for Strategic
AgilityPhill, Mary, Lisa, Jonathan, Lorie
Volkswagen of America : Managing IT PrioritiesJonathan, Susanna, Chris, Donald, Brian

6
Due Next Week - ThursdayRoyal Caribbean Cruise Line Case
Upload to Entropy by 6PM on Thursday
Please read the suggestions in the syllabus on how to approach
Business Professional
Executive Summary (1 page max)

7
Executive Summary

8
3 to 5 more pagesNo more than 1 / 2 page summaryYou can answer 1 or more of the following
What is/are your recommendation(s)What new IS knowledge was learnedHow does the case (situation presented)
impact the competitive position of the firmHow does IS/IT complement their corporate
strategyHow may the case relate to your current or
past employment

9
BOOK BMEASURING THE BUSINESS VALUE OF INFORMATION TECHNOLOGY
Measuring Employee Productivity
Chapter 4

10
Business & IT ManagersNecessary to develop productivity
measures
Conduct experiments
Use statistical methods
Consider ‘pilot studies’

11
Building a plan to measure employee productivity

12
Means to gather data:Interviews (semi structured)
Surveys (structured)
User activity logs
Server activity logs
Field studies (watch faculty)
Lab study

13
Methods to collect dataMethod Best Usage Advantages DisadvantagesInterview Identifying employee
tasks and methodsExcellent for collecting feedback on the employee's likes and dislikes.
Rarely provides performance data. Subject to reporting bias, which can result in over- or under-estimation.
Survey Identifying employee tasks and methods
Easy to administer with a large number of employees.
Is subject to reporting bias, which can result in over- or under-estimation. Often overused due to ease of administration.
User Activity Log Quantifying employee tasks and methods
Easy to administer to a large population on a regular basis.
Can interfere with the work process. Is subject to reporting bias, which can result in over- or under-estimation.
14
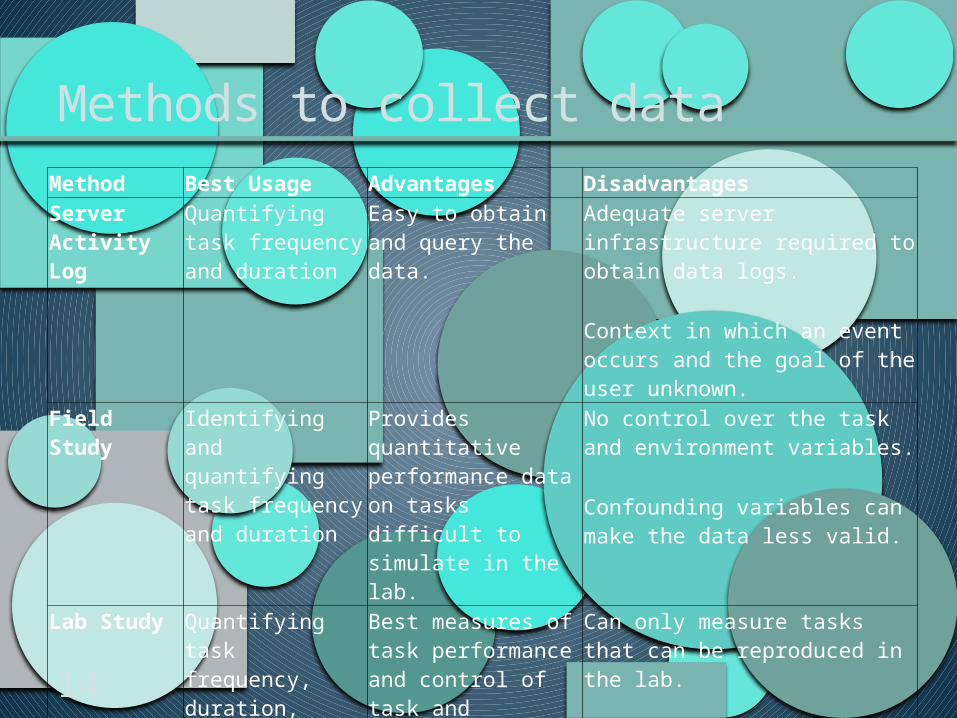
Methods to collect dataMethod Best Usage Advantages DisadvantagesServer Activity Log
Quantifying task frequency and duration
Easy to obtain and query the data.
Adequate server infrastructure required to obtain data logs. Context in which an event occurs and the goal of the user unknown.
Field Study Identifying and quantifying task frequency and duration
Provides quantitative performance data on tasks difficult to simulate in the lab.
No control over the task and environment variables. Confounding variables can make the data less valid.
Lab Study Quantifying task frequency, duration, error rate
Best measures of task performance and control of task and environment variables.
Can only measure tasks that can be reproduced in the lab. Requires time to prepare collateral materials. Introduces the artificial nature of a lab setting.

15
“IMPORTANT TO INCLUDE AT LEAST ONE QUANTITATIVE MEASURE AS PART OF EVERY PRODUCTIVITY STUDY”

16
Methods to gain ‘quantitative’ dataPilot Study –
Very important if a new technology and prior experience is not known
Collaborating with Third PartiesHas a ‘non competing firm’ implemented the
technology?
17
CONSIDER:DOES ENTROPY IMPROVE FACULTY/STUDENT PRODUCTIVITY?Reason: Should we expand Entropy outside of the IS department?

18
WHAT ITEMS MIGHT YOU WANT TO MEASURE?
WHAT MEANS WOULD YOU USE TO GATHER DATA?

19

20
INTANGIBLES

21
What are intangible benefits?There are two main intangible benefits in IT
investments. The first is internal improvement or infrastructure investment and the second relates to customers
Grembergen
Examples may include:Change in the production processRetained customersIncreased salesCustomer satisfactionMarket gain

22
Do companies measure?41 companies surveyed found that most
ASSUMED benefit would follow from projects
Why Not?Intangible value is extremely hard to
measure.

23
A study of 20 Wilmington area companies reported these problems with IT Projects
Project Justification Intangibles
Identifying Intangibles
Post Project Evaluation
Convincing Top
Management
Business Unit Buy-in
Developing Metrics

24
Recommendations of IT community
Consider the Value of Intangible
Benefits in every Applicable IT Project
Have the Business Unit Manager
Establish the Value of Intangibles
Evaluate Completed Projects
Recommendations
Build on a History of Successful Past
Projects
Business Unit Manager must be
the Project Champion
Tie Intangibles to Corporate Strategy

25
Intangible ExamplesStrategic Impacts Measurement Quantifiable Impact
EXTENT OF IT INTEGRATION – ALL CORPORATION DIVISIONS
DECISIONMAKING
Increase level of communications between departments, especially meeting times.
Change in meeting anticipated ROI.
Cost per manager per meeting hour.Better decision support system provides historical data and outside database.Measure actual ROI vs. projected. System provides 2% reduction in the gap, providing management a better means to evaluate projects.
INSTALLATION OFNETWORK
Change in data access. Measure screen retrieval time before/after new network.
INSTALLATION OF AUTOMATIC TRACKING – KEY COMPETITOR PRICES
Respond to changes in competitor’s price changes quicker.
Every minute of price difference between prices and a competitor costs.
INSTALL ERP SYSTEM Reduce steps in all phases of the operation.
Select departments or processes and measure time difference before and after.

26
Intangible ExamplesOperation IT Impacts Measurement Quantifiable Impact
SALES PER EMPLOYEE
Change in # of ‘closes’ per day, per salesperson.
New system increased...closes from 13 to 15. Average sale is $100 = $200/per salespersonper day increase.
WAIT TIMESCUSTOMERSERVICED
Before and after wait times per average customer.
System time reduced 5 to 3 minutes…20% less dropped calls. Increased sales as each completed call results in $50 revenue. Pay for the 800 number.
SATISFIED CUSTOMERS
Change in # of customer complaints per 1000 orders.
Each complaint takes 12 minutes of customer service at $15/hour…measure reduction.Satisfied customer rates less than 75% will not repurchase. Increase 5% customer service satisfaction.

27
Intangible MetricsRisk impact
What is the cost of a negative event if we avoid an investmentWhat is the value of a lost customer?What is the value of a lost employee?What is the value of dropping to a 90% service
level versus 95%

28
Intangibles should be measuredUsers need to determine the value in advance
Users need to have a measuring technique and sign off

29
WHAT INTANGIBLE BENEFITS WOULD ACCRUE FOR EXPANSION OF ENTROPY AND HOW WOULD YOU MEASURE THEM?

30

31
ExerciseWe know a customer spends $250/year
A system has been proposed that will provide our call center with a record of past customer calls and details of those calls?
How / what - would you measure the benefits of this project?

32
What should we measure?

33
Exercise
How do you measure success in your department/company?
What are your measures for good performance?
What data is critical and who generates this data?


![Patrimonio Cultural Tangible e Intangible [Gusman, Jorge]](https://img.dokumen.tips/doc/110x75/5571fc30497959916996b266/patrimonio-cultural-tangible-e-intangible-gusman-jorge.jpg)