Embed Size (px)
Citation preview

K. A. Connor, - 1 - Revised: 6 September 2016
Rensselaer Polytechnic Institute Troy, New York, USA
Class #3: Experiment
Signals, Instrumentation, and Basic Circuits
Purpose: The objectives of this experiment are to gain some experience with the tools we use (i.e. the electronic test
and measuring equipment and the analysis software) and to gain some fundamental understanding of voltage
dividers.
Background: Before doing this experiment, students should be able to
Apply Ohm’s Law to determine the current through a resistor
Determine the values of series and parallel combinations of resistors
Identify the audible frequency spectrum in humans
Identify the value of standard, low wattage resistors from the color and pattern of their stripes
Download and install software on a Windows machine
Learning Outcomes: Students will be able to
Use a digital Multimeter (DMM) to measure DC resistance values and DC voltages in simple resistive circuits.
Build, test and simulate a simple resistive voltage divider and demonstrate conditions under which measurement
devices (e.g. DMM or oscilloscope) significantly affect the operation of the circuit. Then, use the changes in
voltages caused by the measurement devices to determine the resistance of the measurement device.
Be able to build simple resistive circuits driven by constant and periodic voltage sources using a small
protoboard (aka breadboard).
Use an oscilloscope to measure and display the voltages in a simple resistive circuit driven by a sinusoidal
voltage from a function generator.
Fully annotate voltage plots obtained from physical experiments, including such signal characteristics as
frequency (both types), period, amplitude, average or DC offset, etc. and identify where on a standard circuit
diagram the voltages are found.
Articulate a series of questions posed about simple circuits and answer the questions using fully annotated data
obtained from physical experiments.
Develop the circuit model of a physical battery using an ideal voltage source and an ideal resistor.
Calculate the power delivered by a battery and dissipated in a resistor.
Equipment Required
Analog Discovery With Digilent Waveforms
Oscilloscope Analog Discovery
Function Generator Analog Discovery
DC Power Supply Analog Discovery & Batteries
DVM Analog Discovery
DMM Benchtop or Hand-Held Digital Multi-meter
Two 100 Ohm resistors, two 1M Ohm resistors and two 1k Ohm resistors.
Protoboard
Pre-Lab
Required Reading: Before beginning the lab, at least one team member must read over and be generally acquainted
with this document and the other reading & video materials.
Hand-Drawn Circuit Diagrams: Before beginning the lab, hand-drawn circuit diagrams must be prepared for all
circuits either to be analyzed using a SPICE program or physically built and characterized using your Analog
Discovery board.

K. A. Connor, - 2 - Revised: 6 September 2016
Rensselaer Polytechnic Institute Troy, New York, USA
Part A – Sine Waves and Hearing
In this exercise, a function generator will be used to produce electrical signals with various shapes, including sine
waves. Our objective is to learn about the basic properties of sine waves and related signals by seeing them, hearing
them and analyzing them with the oscilloscope and audio output capabilities of the Analog Discovery. You will
need a set of ear buds or something similar to hear the audio. We will also demonstrate some interesting facts about
human hearing and speech.
Background
Equipment: What formerly would require the use of an entire workbench of equipment can now be accomplished
using the Analog Discovery (see Figure A-1 below) and a laptop computer. This board, coupled with the Digilent
Waveforms software, can produce the same functionality as each of the following pieces of equipment (and more): a
two channel oscilloscope (scope), a digital voltmeter (DVM), two DC power supplies and a two channel function
generator. The digital voltmeter (DVM) has 2 channels (Here we use the Scope Channel 1+ (Orange) and Scope
Channel 2+ (Blue)). (In Wavesforms 2015, use Logger) The scope is a measuring device that lets you view a plot of
a voltage signal vs time. The DC power supplies generate constant DC voltage signals (like a battery). The function
generator creates a voltage signal that varies with time. The PC is an integral part of the equipment setup. You use
it to simulate many of the circuits you will build (using a SPICE program), as well as to operate Analog Discovery.
The function generator can be programmed to generate waves with specified amplitude and frequency. Ear buds
and speakers convert an electrical signal to sound that we then can hear. The oscilloscope analyzes an electrical
signal and displays a picture of the signal. The combination of the oscilloscope and audio output allows us to see
with our eyes what we are hearing with our ears. The two function generators are labeled as Waveform Generator
W1 (Yellow) and Waveform Generator W2 (Yellow/White). We will start with only one of the function generators
in this experiment (Waveform Generator W1). See Figure A-1.
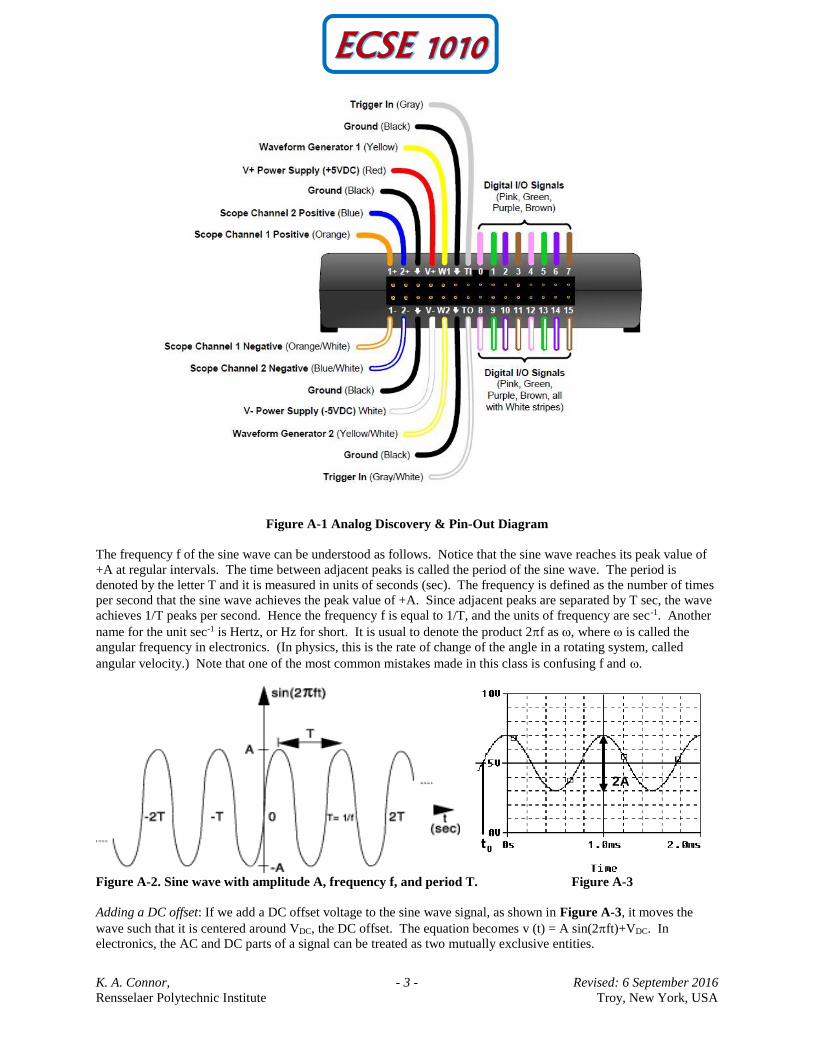
The sine wave equation: All of us should have studied the sine and cosine trigonometric functions in math and
physics classes. A sine wave is described by an equation of the form v (t) = A sin (2ft) = A sin (t), where the
variable t represents time. We use the term "wave'" because the shape is similar to a water wave that you might see
on an ocean or a lake. As shown in Figure A-2, a sine wave is characterized by two parameters, called amplitude
(A) and frequency (f). The amplitude A determines the maximum value that the sine wave achieves along the
vertical axis. The sine wave takes on values between +A and -A at various times.
K. A. Connor, - 3 - Revised: 6 September 2016
Rensselaer Polytechnic Institute Troy, New York, USA
Figure A-1 Analog Discovery & Pin-Out Diagram
The frequency f of the sine wave can be understood as follows. Notice that the sine wave reaches its peak value of
+A at regular intervals. The time between adjacent peaks is called the period of the sine wave. The period is
denoted by the letter T and it is measured in units of seconds (sec). The frequency is defined as the number of times
per second that the sine wave achieves the peak value of +A. Since adjacent peaks are separated by T sec, the wave
achieves 1/T peaks per second. Hence the frequency f is equal to 1/T, and the units of frequency are sec-1. Another
name for the unit sec-1 is Hertz, or Hz for short. It is usual to denote the product 2f as , where is called the
angular frequency in electronics. (In physics, this is the rate of change of the angle in a rotating system, called
angular velocity.) Note that one of the most common mistakes made in this class is confusing f and .
Figure A-2. Sine wave with amplitude A, frequency f, and period T. Figure A-3
Adding a DC offset: If we add a DC offset voltage to the sine wave signal, as shown in Figure A-3, it moves the
wave such that it is centered around VDC, the DC offset. The equation becomes v (t) = A sin(2ft)+VDC. In
electronics, the AC and DC parts of a signal can be treated as two mutually exclusive entities.
2A

K. A. Connor, - 4 - Revised: 6 September 2016
Rensselaer Polytechnic Institute Troy, New York, USA
Scalar measurement of sine waves: Measurement devices do not usually give us the voltage amplitude A directly.
Rather they determine VP-P (the peak-to-peak voltage) or VRMS (the RMS voltage). The peak-to-peak amplitude is
the difference between the largest positive value of the sine wave and the largest negative value of the sine wave, so
it should be nearly equal to A - (-A) = 2A. The RMS value is determined by taking the square root of the average of
the square of the voltage. Since the voltages here are sinusoids 414.12 VVRMSV . Note that in electronics
the RMS voltage depends only on the time-varying amplitude and not on any offset.
Impedance and resistance: You should be familiar with the term resistance. It is a measure of the degree to which a
resistor resists the flow of electrons. Circuits that have a combination of components (some of which are not
resistors) also affect the flow of electrons. However, the behavior of these circuits is more complicated because it
varies with the frequency of the signal. We call this complicated response “impedance.” Both resistance and
impedance are measured in Ohms () and the terms are often used interchangeably.
Human hearing: We are exposed to a wide variety of sounds every day. We hear a sound after our brain processes
the sensations recorded by our ears. Two attributes that are commonly used to characterize sounds are loudness
(amplitude) and pitch (frequency). Loudness, of course, refers to how loud or intense we perceive the sound to be.
Pitch refers to whether we perceive the sound to be high or low. For example, the sound of an ambulance siren has a
higher pitch than the sound of a fog horn. Keep in mind that your ear is a biological system. It is designed to hear
certain pitches better than others even though, technically, they have the same loudness.
Experiment
A.1) Setting up a Sine Wave on the Function Generator
For the first experiment, we need to set up a sinusoidal voltage. Set up Analog Discovery to generate a signal from
function generator 1 (W1, GND) and measure it with scope channel 1 (1+, 1-). This can either be done by
connecting the wires directly (Orange to Yellow and Orange/White to Black) or using a protoboard. Both options
are shown in Figure A-4. Note that the connection pins that come with Analog Discovery can be broken apart, but it
is helpful often to have some remain in pairs or other combinations.
Figure A-4

K. A. Connor, - 5 - Revised: 6 September 2016
Rensselaer Polytechnic Institute Troy, New York, USA
After correctly installing the Digilent Waveforms software and connecting the Analog Discovery, open the software
and select the WaveGen (for the function generator) and the Scope (for the oscilloscope) from the Digilent
Waveforms window. You should see the window similar to that shown in Figure A-5 (with ‘Basic’ selected) for the
function generator and the window shown in Figure A-6 for the scope. The values for various parameters shown in
both windows will likely be different. We will set those up next.
Function Generator:
First we will set the frequency. The frequency of the function generator is adjusted as follows:
Make sure that you choose the channel or channels you are using in the “Channels” menu. The default
choice when Waveforms starts is usually Channel 1 (AWG1). If this is the case, you do not need to use the
Channels drop down menu. We only need one Function Generator in this experiment. Note that we will use
Function Generator and Arbitrary Waveform Generator (AWG) pretty much interchangeably. This system
can produce any time-varying signal, so it is an AWG, but we mostly use it to produce sine, triangular and
square waves like a function generator.
Make sure that the “Frequency” box is checked and AWG configuration mode is “Basic”. Select the
“Frequency” box or drag the “frequency bar” for Ch.1. Set it to display 1kHz.
Amplitude: Make sure the Amplitude is checked. Set the voltage amplitude to 200mV.
Your WaveGen window should look like Figure A-5. Make sure is showing.
Figure A-5
Scope:
First we set up the vertical and horizontal scales for the display. On scope channel C1, select the Volts/div to
100mV, the offset to 0 V. Uncheck C2, since we will not be using channel 2. The Time/div should be set at
200µs/div. The voltage and time scale settings are found on the right hand side of the scope window.
To make a measurement, connect the source (W1) to scope input (1+) and scope input (1-) to ground. Make
sure the connections you made above are good.
When you are ready, press the “Run AWG1” button on the WaveGen and the “Run” button on the Scope. These
are the ‘On’ buttons for the function generator and scope, respectively. If you cannot see a signal on the scope,
double-check to make sure all of the settings are correct.
Change the frequency up or down as desired. How does this change the signal on the scope? The purpose of
this step is to see what kind of signals this setup can produce. You should play around a little with different
frequencies, voltage amplitudes, signal shapes, etc.

K. A. Connor, - 6 - Revised: 6 September 2016
Rensselaer Polytechnic Institute Troy, New York, USA
Set WaveGen again so the display reads 1kHz and the amplitude is 200mV with no offset. Use the ‘Copy
Window as Image’ option in the Edit drop down menu on the Scope and paste the image in your report
document. Clearly label both the amplitude and period of the signal you have measured.
Figure A-6
A.2) Using the Audio Output from Analog Discovery
We now wish to connect the function generator, the scope and earphones to perform some simple experiments.
Start by measuring the resistance of each channel for your ear buds or earphones (from left or right to ground
or common) using a desktop or handheld DMM. We only need an approximate value for the resistance, so any
device can be used for this purpose. There are typically two types of connectors used for earbuds, depending on
whether or not a microphone is included. Both are shown below.
Plug your ear buds into the audio output on the
Analog Discovery. Do not do this with the ear buds in
your ears. The volume may be too high. It is prudent to
turn on the volume with the ear buds away from your
ears and bring them closer until you are sure the volume
level is comfortable. You should hear only one channel.
If you use both AWG sources you will hear both
channels.
Adjust the volume of the signal to a comfortable level by changing the amplitude of the signal. By comfortable
level, we mean the lowest amplitude that allows you to hear a distinct sound. What is the value of the voltage
amplitude that you have selected?
Let us investigate how our perception of loudness changes as the frequency of the sine wave is varied. With the
sine wave amplitude fixed at your comfortable level, vary the frequency over the range from 100Hz to
10,000Hz. Try cycling through the following frequencies, without changing the signal amplitude: 100, 200,
300, 400, 500, 600, 700, 800, 900, 1000, 2000, 3000, 4000, 5000, 6000, 7000, 8000, 9000, and 10,000Hz.
Which frequency do you hear the loudest? Is there any variation among the members of your team? If you
have problems discerning significant differences in loudness, try a different set of ear buds.
Experiment with the Equipment
At this point, you will have put the function generator and scope through some basic tasks. Experiment with the
other features of the function generator and see what happens. Some very interesting and annoying waves can be
produced. Play around a little and then find a particular set of operating conditions that you find the most
Time and voltage scales
Run Button

K. A. Connor, - 7 - Revised: 6 September 2016
Rensselaer Polytechnic Institute Troy, New York, USA
interesting. Under what circumstances might you experience the sounds you have produced or generally when
might you encounter a waveform like the one you have displayed on your scope?
Summary
You should now know how to set up voltage signals with the function generator feature, connect the function
generator output to the scope input and display them using the oscilloscope feature. You should understand the
pitch/frequency and amplitude/volume relationships, and know how these relate to human hearing.
Part B – Voltage Dividers and Measuring Equipment
In this part of the experiment you will be learn that equipment isn’t ideal and that “real” behavior must be taken into
account when making measurements. You will look at batteries and measure the effective internal resistance; they
aren’t ideal voltage sources. You will also look at the behavior of two voltage dividers when a DC voltage and an
AC voltage are applied. You will use circuit analysis to examine the behavior of these circuits.
Background
Impedance: Every piece of electrical equipment has an effect on the circuit you connect it to. Just as it is impossible
to design a dynamic mechanical system without friction (that resists motion), it is impossible to design an electrical
system without impedance (that resists the flow of electrons). Impedance has two effects on an electrical system. It
changes its magnitude (the value of the voltage) and its phase (voltage behavior over time). If the impedance affects
only magnitude, then we call it resistance. Each electrical measurement device has an internal impedance, and this
is also true for the Analog Discovery. The impedances we will concern ourselves with in this class are listed in
Table B-1 below: (These values aren’t exactly correct, but they still can be used to make the point.)
Device impedance (magnitude only)
Scope Analog Discovery 1Meg
DMM (DC voltage) 10Meg (typical)
DMM (AC voltage) 1Meg (typical)
function generator Analog
Discovery
Negligible (typical)
DC power supplies (any) Negligible (typical)
Batteries 0.4 to 32 (typical)
Table B-1
Note that presently we are only concerned about the effect of the equipment on the magnitude (resistance
component) of the impedance. Also note that the devices are designed to have minimal effect on any circuit they are
connected to. In this part of the experiment, we will examine how much of an effect the equipment has.
Voltage dividers: In order to analyze the effect of the equipment, we need to understand a fundamental concept of
circuit analysis called a voltage divider. Basically, when a voltage in a circuit is applied across two or more
resistances, it divides up in a manner proportional to the resistances. That is, a larger resistance will have a larger
voltage drop and that voltage drop will be proportional to the size of the resistance divided by the total resistance of
a circuit.

K. A. Connor, - 8 - Revised: 6 September 2016
Rensselaer Polytechnic Institute Troy, New York, USA
Figure B-1.
In Figure B-1 above, Vin is divided between R1 and R2. Mathematically, this can be expressed:
VinRR
RVVin
RR
RVVVVin RRRR
21
2
21
12121
Note that R1+R2 is the total resistance of the circuit. We can use a voltage divider to determine how much effect a
device has on a circuit, or in this case, the effect that a circuit has on a device. In the simple electrical model of the
battery shown in Figure B-2, the internal resistance of the battery depends on the battery size and chemistry. This is
a simple model that ignores much of the internal chemistry including changes as the battery is discharged. The
default assumption normally is that the voltage output of a battery doesn’t change with the load. We will investigate
how this works in an actual circuit.
Figure B-2.
The output of the battery is measured using the Analog Discovery with and without a load resister. Remember that
Rbat represents the internal model of the battery. You do not add this resister to the circuit. Rload represents the
load, or combined resistance of whatever circuit you place on the source. Using the voltage divider rule, we know
that the voltage drop across the load is given by: VbatRloadRbat
RloadVmeasured
.
Series and parallel circuits: Another fundamental concept we need to understand in order to analyze the circuits we
will build is how to mathematically combine resistances. If any number of resistances are connected in series, you
simply add them to find the total resistance. If any number of resistances are wired in parallel, the total resistance is
the reciprocal of the sum of the reciprocals of all of the resistances. This is summarized in Figure B-3.

K. A. Connor, - 9 - Revised: 6 September 2016
Rensselaer Polytechnic Institute Troy, New York, USA
Figure B-3.
Note that the voltage divider rule applies only to series circuits. Any time we use our measuring devices to measure
the voltage across a device, as illustrated in Figure B-4, we are combining that device in parallel with the resistance
we are measuring. So just connecting the oscilloscope will affect the quantity to be measured. In this case the
effective load resistance on the battery is Rtotal and it is the parallel combination of the scope impedance (1Meg)
with the resistance of the load resistor (Rload). This results in total load resistance, Rtotal.
Figure B-4.
Once you have the total load resistance, RT, you can use the voltage divider rule to find the internal resistance of the
battery. Note that, since the voltage drop across any number of resistors in parallel is the same, VRtotal is equal to
VRload.
Other basic circuit components: There are two other basic circuit components: capacitors and inductors. To
combine capacitors in series take the reciprocal of the sum of the reciprocals. To combine capacitors in parallel,
simply add the capacitances. [Note: This is the opposite of combining resistors.] Inductors combine like resistors.
To combine inductors in series, you add them. To combine them in parallel, you take the reciprocal of the sum of
the reciprocals.
nn
nT
nT
nn
LLLLCCCCparallel
LLLLCCCC
series
1111
1111
21
21
21
21
Experiment
Vbat
Rbat
Rload Rscope
1Meg
Vbat
Rbat
Rtotal =

K. A. Connor, - 10 - Revised: 6 September 2016
Rensselaer Polytechnic Institute Troy, New York, USA
B.1) Some DC Measurements
We will look at what happens when we apply a load to a battery. We will be using batteries extensively in this
course, so understanding their basic electrical properties is critical. We will be making DC measurements, like we
do with a typical multi-meter. For this section, shut off the scope, go to the main Waveforms window and select
Voltmeter from the ‘More Measurements’ drop down menu. When this is enabled, it will use the inputs for the scope
channels, but it is better to have the scope off to avoid confusion.
Measure the voltage of a 9V “Heavy Duty” battery without any load. Simply connect the battery to the
protoboard and connect the leads from the protoboard to the 1+ (Scope Channel 1 Positive (orange)) and 1-
(Scope Channel 1 Negative (orange-white)). Note that, when we make most measurements in this course, they
will be single-ended (referenced to ground). Then you need to touch the 1+ wire to the point of interest. To do
this, the negative input 1- and GND must be connected. When we make what are called differential
measurements, we use the two wires but do not connect the ground. We will return to that in a future
experiment. In this case the load is an open circuit (infinite resistance) because we have added no load to the
battery; the input resistance of the Analog Discovery is also so large compared to the range of battery resistance
listed above, that it can also be ignored. Record the value of the voltage you measure. (It will also be useful to
check your measurement with a multi-meter if you have one. This extra step is not required.)
Now add a load to the battery, as in Figure B-5. The load is two 100Ω resistors in series. We will discuss why
two resistors are used a little later. Set up the circuit so that you can add and remove the load quickly, leaving it
disconnected unless you are making a measurement. This just means wire it so that it is easy to pull out and
reinstall one end of one resistor. You should only connect the load to the battery for a short moment (a second
or two) long enough to make the measurement. If you leave the resistors connected, your battery will drain
down quickly and will definitely not last a full semester. Record the voltage displayed in the Voltmeter window
of the Analog Discovery with the resistive load disconnected. Then connect the resistors, quickly record the
new voltage, and quickly disconnect the load. You may want to repeat this a few times to find the typical
change of voltage with and without the load. Remember to record the unloaded battery voltage as well as the
change in voltage. In the figure, A1+ is 1+ and A1- is 1-. The A reminds us this is an analog measurement.
Figure B-5.
Use the results from this experiment to determine the value of Rbat.
Repeat the experiment with a different battery from a plastic case the TAs will place on the center table.
Choices are a 9V Alkaline, a pack of 2 AA alkaline batteries in series, and a watch battery. If you do a low
voltage battery it may be wise to load the battery with only one 100Ω resistor.
Share data with other teams so that you have numbers for at least 4 battery types.
As noted under Figure B-4, the information you have just obtained about each battery using a voltage divider
can be used to determine the internal resistance of the battery. What is the internal resistance of the two batteries
characterized by your team?
B.2) Some AC Measurements
The part above showed that the load can effect the equipment, in this case a battery. Now we will look at how the
instrument can affect the circuit. The Analog Discovery oscilloscope can load the circuit and affect the circuit to be
measured. Now you can shut off the Voltmeter and turn on the Scope again.
Use the function generator, W1, of the Analog Discovery to put an AC signal on a resistor divider circuit shown
in Figure B-6. Set the Function Generator to 1kHz and Amplitude to .5 V (since the goal is 1VP-P) . Use R1 =
1kΩ and R2 = 1kΩ. Take data and plot the output using Excel.
A1+
GND
A1-

K. A. Connor, - 11 - Revised: 6 September 2016
Rensselaer Polytechnic Institute Troy, New York, USA
Figure B-6.
Make all the connections on the protoboard. In the circuit above, A1+ is analog input + which is 1+ for Analog
Discovery. A1- is 1-, A2+ is 2+, A2- is 2-. GND is Ground. The Function Generator output is W1. Only one ground
connection has to be made from the Analog Discovery because the Function Generators (W1 & W2) are connected
internally to ground.
Calculate the ratio of the voltage measured on 2+ to the voltage on 1+.
Repeat the experiment using R1 = R2 = 1MegΩ resistors. Again create a plot of the voltages and calculate the
ratio of the voltages.
The more exact model of this measurement is given in Figure B-7, were RA1+ and RA2+ represent the
effective internal input resistances of the analog input channels of the Analog Discovery. The effective input
resistance of A1+ can be ignored (Do you know why?), but the input resistance of A2+ effects the
measurement. Using the measurements above, estimate the value of RA2+.
Figure B-7.
Useful Hints:
You can copy an image of the plot to Microsoft. Word by “Edit – Copy as Image”
You can save the data in a csv file, which you can open in Excel, using “Export.”
You can change the thickness of the line segment by: Right click on the plot – select and change the plot
thickness.
B.3) Power Calculations and Impedance Matching
Now we will look at the power associated with the battery circuit
Power Ratings: In part B.1 you used two resistors in series. The effective resistance of resistors in series is
simply the sum of the resistances. So why use two 100Ω resistors in series when we could use one 200Ω
resistor? Power rating is the answer. RVRIIVP /22 where P is the power, V, I, and R are the
voltage, current, and resistance of the load. The power is in Watts if you use Volts, Amps and Ohms. Our
resistors have a power rating of ¼ watt.
o Calculate the total power out of the battery for part B.1 for just the 9V battery measurements.
o Calculate the power per resistor. Ask for help if it isn’t now clear as to why we used 2 resistors rather than
one for this measurement.
o Calculate the total power out of the battery for part B.1 for the 2 AA battery pack.
Impedance matching: Impedance matching is important with weak signals, not with batteries. Even so, the
concept can be demonstrated using our circuits. Don’t wire this circuit; it would cause excessive heating and a
rapid discharge of the battery.
A1+
A2+
GND
A1+
GND
A2+
RA2+
RA1+
A1-, A2-
W1
W1
A1-, A2-

K. A. Connor, - 12 - Revised: 6 September 2016
Rensselaer Polytechnic Institute Troy, New York, USA
For this part assume that you have a 9V battery with an internal resistance of 30Ω. Using Figure B-2, calculate
the voltage that would be measured across the load if the load resistance is 100Ω, 60Ω, 30Ω, 20Ω, and 15Ω.
For each load resistance, determine the power that would be dissipated in the load resistor. Plot the power
dissipated vs. the load resistance.
If you did this correctly, you will see that the maximum power in the load occurs when the load resistance is
equal to the internal battery resistance. This is call impedance matching.
Summary
You should now understand how to calculate the effective resistance of resistors in series and/or in parallel. You
have an appreciation of AC and DC signals, and that the load and/or the equipment affects the voltages and currents
in the circuit. Lastly you should be comfortable with using the Analog Discovery, including the function generator,
the oscilloscope and the voltmeter.
Report
Be sure you have answered all of the questions in the text. A report format will be provided for you, but it will
largely just be a list of the questions.