Embed Size (px)
Citation preview

CLARK COUNTY, NEVADA, AND INCORPORATED AREAS VOLUME 1 OF 2 Community Name
Community Number
BOULDER CITY, CITY OF 320004
HENDERSON, CITY OF 320005
LAS VEGAS, CITY OF 325276
MESQUITE, CITY OF 320035
NORTH LAS VEGAS, CITY OF 320007
CLARK COUNTY,
UNINCORPORATED AREAS 320003
REVISED: November 16, 2011
Federal Emergency Management Agency
FLOOD INSURANCE STUDY NUMBER 32003CV001C
NOTICE TO FLOOD INSURANCE STUDY USERS
Communities participating in the National Flood Insurance Program have established repositories of flood hazard data for floodplain management and flood insurance purposes. This Flood Insurance Study may not contain all data available within the repository. It is advisable to contact the community repository for any additional data. The Federal Emergency Management Agency (FEMA) may revise and republish part or all of this FIS report at any time. In addition, FEMA may revise part of this FIS report by the Letter of Map Revision process, which does not involve republication or redistribution of the FIS report. Therefore, users should consult with community officials and check the Community Map Repository to obtain the most current FIS report components. This FIS report was revised on November 16, 2011. Users should refer to Section 10.0, Revisions Description, for further information. Section 10.0 is intended to present the most up-to-date information for specific portions of this FIS report. Therefore, users of this report should be aware that the information presented in Section 10.0 supersedes information in Sections 1.0 through 9.0 of this FIS report. Effective Date: September 27, 2002 Revised Dates: December 4, 2007 November 16, 2011

i
TABLE OF CONTENTS
Volume 1 Page 1.0 INTRODUCTION .......................................................................................................................... 1 1.1 Purpose of Study ................................................................................................................. 1 1.2 Authority and Acknowledgments ....................................................................................... 1 1.3 Coordination ....................................................................................................................... 1 2.0 AREA STUDIED ........................................................................................................................... 3 2.1 Scope of Study .................................................................................................................... 3 2.2 Community Description ...................................................................................................... 5 2.3 Principal Flood Problems .................................................................................................... 9 2.4 Flood Protection Measures ............................................................................................... 12 3.0 ENGINEERING METHODS ..................................................................................................... 14 3.1 Hydrologic Analyses ......................................................................................................... 14 3.2 Hydraulic Analyses ........................................................................................................... 22 4.0 FLOODPLAIN MANAGEMENT APPLICATIONS ............................................................... 26 4.1 Floodplain Boundaries ...................................................................................................... 26 4.2 Floodways ......................................................................................................................... 28 5.0 INSURANCE APPLICATION ................................................................................................... 53 6.0 FLOOD INSURANCE RATE MAP........................................................................................... 53 7.0 OTHER STUDIES ....................................................................................................................... 54 8.0 LOCATION OF DATA ............................................................................................................... 54 9.0 BIBLIOGRAPHY AND REFERENCES ................................................................................... 56 10.0 REVISION DESCRIPTIONS ..................................................................................................... 64 10.1 First Revision .................................................................................................................... 64 10.2 Second Revision ............................................................................................................... 81 10.3 Third Revision .................................................................................................................. 89 10.4 Forth Revision................................................................................................................... 91

ii
TABLE OF CONTENTS (Cont’d)
Volume 1 (Cont’d) Page FIGURES Figure 1 - Floodway Schematic .................................................................................................................. 28 TABLES Table 1 – Flood Insurance Study Contractors ............................................................................................... 2 Table 2 – Community Coordination Officer Meetings ................................................................................. 4 Table 3 - Summary of Discharges ............................................................................................................... 17 Table 4 – Summary of Manning’s “n” Values ............................................................................................ 24 Table 5 – Floodway Data ............................................................................................................................ 29 Table 6 – Community Map History ............................................................................................................ 55 Table 7 – Letters of Map Change................................................................................................................ 73 Table 8 – List of Levees Requiring Flood Hazard Revisions ................................................................... 107 Table 9 – Letters of Map Change.............................................................................................................. 108 Volume 2
EXHIBITS
Exhibit 1 - Flood Profiles Blue Diamond Wash Middle Branch Panels 01P-04P Blue Diamond Wash Middle Branch – Left Bank Overflow Panels 05P Blue Diamond Wash Middle Branch – Right Bank Overflow Panels 06P
Blue Diamond Wash North Branch Panels 07P – 09P Colorado River Panels 10P-11P Duck Creek Panels 12P-22P Duck Creek South Channel Panels 23P Duck Creek Tributary Panel 24P Georgia Avenue Wash Panel 25P Hemenway Wash Panels 26P-29P King Charles Diversion Channel Panel 30P Las Vegas Wash Panels 31P-56P Las Vegas Wash Split Flow No.1 Panels 57P Las Vegas Wash Split Flow No.2 Panels 58P-59P Las Vegas Wash Split Flow No.3 Panels 60P Unnamed Tributary to Las Vegas Wash (A Channel) Panels 61P-63P Meadow Valley Wash Panels 64P-68P Muddy River Panels 69P-83P Muddy River Side Channel Panel 84P Muddy River West Branch Panel 85P Overton Wash Panels 86P-88P Pulsipher Wash Panel 89P Pulsipher Wash Overflow Panel 90P Tropicana Wash Central Branch Panels 91P-93P Tropicana Wash North Branch Panels 94P-96P Unnamed Wash Along Gowan Road Panels 97P-98P Unnamed Wash Along Maverick Street and Duncan Drive Panel 99P Unnamed Wash Along North Rancho Drive Panels 100P-103P Unnamed Wash Along U.S. Highway 95 Panel 104P-106P

iii
TABLE OF CONTENTS (Cont’d)
Volume 2 (Cont’d) Exhibit 1 - Flood Profiles (cont’d)
Virgin River Panels 107P-114P Virgin River – Avulsion Panel 115P Wash B Panels 116P-117P Wash C Panel 118P Wash D Panel 119P
PUBLISHED SEPARATELY: Flood Insurance Rate Map Index Flood Insurance Rate Map

FLOOD INSURANCE STUDY CLARK COUNTY, NEVADA AND INCORPORATED AREAS 1.0 INTRODUCTION
1.1 Purpose of Study
This Flood Insurance Study (FIS) revises and updates information on the existence and severity of flood hazards in the geographic area of Clark County, including the Cities of Boulder City, Henderson, Las Vegas, Mesquite, and North Las Vegas, and the unincorporated areas of Clark County (referred to collectively herein as Clark County) and aids in the administration of the National Flood Insurance Act of 1968 and the Flood Disaster Protection Act of 1973. The study has developed flood-risk data for various areas of the community that will be used to establish actuarial flood insurance rates and assist the community in its efforts to promote sound floodplain management. Minimum floodplain management requirements for participation in the National Flood Insurance Program (NFIP) are set forth in the Code of Federal Regulations at 44 CFR, 60.3. This information will be used to update existing floodplain regulations as part of the Regular Phase of the NFIP. The information will also be used by local and regional planners to further promote sound land use and floodplain development.
In some states or communities, floodplain management criteria or regulations may exist that are more restrictive or comprehensive than the minimum Federal requirements. In such cases, the more restrictive criteria take precedence and the State (or other jurisdictional agency) will be able to explain them.
1.2 Authority and Acknowledgments
The sources of authority for this FIS are the National Flood Insurance Act of 1968 and the Flood Disaster Protection Act of 1973.
The hydrologic and hydraulic analyses for the FISs for the communities listed in Section 1.1 were performed under contract to the Federal Emergency Management Agency (FEMA). Additional information on the study contractors for each study is provided in Table 1.
1.3 Coordination
The following were contacted for information pertinent to the individual FISs: U.S. Soil Conservation Service (SCS); Clark County Department of Comprehensive Planning; U.S. Army Corps of Engineers (COE); State of Nevada Division of Emergency Management; U.S. Geological Survey (USGS); the U.S. Bureau of Reclamation (USBR); and The Boulder City News.

Table 1. Flood Insurance Study Contractors Contract or Community Name Study Contractor Interagency Agreement No. Completion Date Boulder City, City of Soil Conservation Service IAA-H-8-77 November 1978 Project Order No. 1 Clark County James M. Montgomery EMW-83-C-1197 August 1986 (Unincorporated Areas) PRC Engineering EMW-83-C-1193 March 1986 Henderson, City of Soil Conservation Service IAA-H-8-77 November 1978 Project Order No. 1 Amendment 9 Las Vegas, City of Soil Conservation Service IAA-H-8-77 November 1978 Mesquite, City of James M. Montgomery EMW-83-C-1197 May 1986 North Las Vegas, City of Soil Conservation Service IAA-H-8-77 November 1978 Project Order No. 1 November 1982 James M. Montgomery --1 1Performed for the City of North Las Vegas
2

3
During the preparations of the initial FISs for the individual communities, FEMA representatives held coordination meetings with community officials, representatives of the study contractor for each study, and other interested agencies and citizens. The meetings, referred to as the initial, intermediate, and final community coordination meetings, were held at specified intervals during the preparation of the studies. The comments and issues raised at those meetings were addressed in the FIS for each community. The dates that the meeting were held for each community are provided in Table 2.
2.0 AREA STUDIED
2.1 Scope of Study
This FIS covers the geographic area of Clark County, Nevada, including the incorporated areas of the Cities of Las Vegas, North Las Vegas, Henderson, Boulder City, and Mesquite. For the purposes of this study, the unincorporated areas of Clark County were divided into three separate study areas: the Moapa Valley, the Laughlin Area, and the Las Vegas Valley. The Moapa Valley includes the floodplains of the Muddy River and the major washes draining to it from the west. Streams studied by detailed methods are: the Muddy River, from the Fish and Game diversion structure to the Wells Siding diversion structure, and from a point approximately 19,200 feet upstream of the Wells Siding diversion structure to a point approximately 15,500 feet upstream of Interstate Highway 15; Overton Wash, from a point approximately 3,900 feet above its mouth for a reach of approximately 12,600 feet; and the West Branch Muddy River, from its convergence to its divergence from the main branch of the Muddy River, a reach of about 7,000 feet. A portion of the Muddy River between River Miles 8.1 and 11.7 was analyzed using approximate methods. The Laughlin Area includes detailed riverine analyses along the Colorado River and detailed alluvial fan analyses along Bridge Canyon Wash, Dripping Springs Wash, Hiko Springs Wash, and the Southwest Unnamed Wash. The Las Vegas Valley area incorporates approximate alluvial fan analyses along Blue Diamond Wash, Flamingo Wash, and Red Rock Wash. In addition, approximate alluvial fan analysis was performed along Peak Springs Canyon Wash in the Pahrump Valley area of Clark County. The streams or portions of streams, studied by detailed methods in the incorporated communities include the following: Hemenway Wash studied from the mouth upstream to Lakeview Drive extended; Georgia Avenue Wash studied from the corporate limits to the north end of Sierra Vista Place; approximately 1 mile of the upstream end of Wash C, which flows from near the intersection of Utah Street and Adams Boulevard to the corporate limits of Boulder City; Wash D, which crosses U.S. Highway 93 1.3 miles west of the junction with Nevada Highway studied from U.S. Highway 93 downstream

Table 2. Community Coordination Officer (CCO) Meetings
Initial CCO Meeting or Community Name Coordination Meetings Intermediate CCO Meeting Final CCO Meeting Boulder City, City of June 1975 July 20, 1978 October 7, 1980 Clark County April 14, 1983 -- -- (Unincorporated Areas) Henderson, City of June 1975 January 8, 1976 October 7, 1980 Las Vegas, City of January 1976 July 19, 1978 June 13, 1979 July 1977 April 1978 Mesquite, City of April 14, 1983 -- July 17, 1986 North Las Vegas, City of January 1976 July 19, 1978 June 12, 1979 July 1977 December 1977 April 1978
4

5
0.4 mile; Wash B, which parallels U.S. Highway 93 (Business); Las Vegas Wash from Nellis Boulevard extending northward to Owens Avenue and from approximately 200 feet downstream of Lake Mead Boulevard to Las Vegas Wash northwesterly from its confluence with Las Vegas Wash to approximately 1,000 feet south of Lone Mountain Road; Union Pacific Overflow from its confluence with Unnamed Tributary of Las Vegas Wash to its confluence with Las Vegas Wash; Las Vegas Creek from its confluence with Las Vegas Wash to Las Vegas Boulevard North, a distance of 3.4 miles; Pulsipher Wash from the edge of the Virgin River floodplain and ending just above Interstate 15; and alluvial fan flooding within the City of Henderson. The areas studied by detailed methods were selected with priority given to all known flood hazards and areas of projected development or proposed construction through August 1991. The streams, or portions of streams studied by approximate methods include the following: Abbott Wash, Town Wash; Wash C; and Wash D.
Approximate analyses were used to study those areas having a low development potential or minimal flood hazards. The scope and methods of study were proposed to, and agreed upon, by FEMA and Clark County.
2.2 Community Description
Clark County is located in southern Nevada and is bordered to the west by Nye County, Nevada, to the north by Lincoln County, Nevada, to the east by the Colorado River and Mohave County, Arizona, and to the south by San Bernardino County and Inyo County, California. The Cities of Las Vegas, North Las Vegas, Boulder City, Mesquite, and Henderson are the major incorporated population centers. Boulder City is located in southern Clark County. It is 5 miles from Lake Mead and 23 miles southeast of Las Vegas. Situated on the drainage divide between the Colorado River and the Eldorado Valley, the elevations within the corporate limits range from 2,000 feet in the Hemenway Wash and Eldorado Valley areas to more than 3,600 feet in the River Mountains, located in the northwest portion of the city. The city encompasses approximately 32 square miles. The largest wash in Boulder City is Hemenway Wash, located in the northern portion of the city. At the corporate limits, this wash has a drainage area of approximately 4.1 square miles. The Georgia Avenue Wash in the southern portion of the city has a drainage area of approximately 1.9 square miles at the corporate limits. There are a number of washes with drainage areas of approximately 1.0 square mile or less, and alluvial fan areas with distributary drainage patterns. Boulder City was founded in 1931, during the construction of the Hoover Dam. It served as a residence for those involved in the construction of the dam. The community was designed to house as many as 2,500 workers. Boulder City became incorporated in 1960 when the USBR deeded the area to self-government.

6
The city of Henderson is located in central Clark County. It is near the center of a broad desert valley surrounded by mountains ranging from 2,000 to 10,000 feet above the valley. Las Vegas is approximately 10 miles north of Henderson. The total land area within the city is approximately 64 square miles. Henderson is situated in the Las Vegas Valley drainage basin at the northern end of the McCullough Mountain range. The City of Las Vegas is located in central Clark County, and occupies the central part of a broad, open desert basin. Las Vegas is bounded by the City of North Las Vegas on the north and Clark County on the east, west, and south. The corporate limits encompass an area of approximately 33 square miles, of which approximately 95 percent is developed. The development consists of single-family residences, some multiple-family residence complexes, small business, and large casino-hotel facilities in the downtown area. Las Vegas Wash originates in the mountains, approximately 28 miles north of the City of Las Vegas, and continues southeastward for approximately 42 miles, where it terminates at Lake Mead. The drainage basin is bounded by the Spring Mountains on the west; by parts of the Desert, Sheep, and Las Vegas Ranges on the north; by the Frenchman and River Mountains and a low range of hills on the east; and by the Spring Mountains and the Bird Spring and McCullough Ranges on the south. The drainage area of Las Vegas Creek is bounded on the west by La Madre Mountain, which has an elevation of approximately 7,000 feet. Three miles east of this boundary, the drainage area consists of a well-defined alluvial fan that continues eastward to Interstate 15 in downtown Las Vegas. Flows on this fan are often the result of intense short-duration thunderstorms. The flow pattern on the fans is complex, and areas of concentrated flow can shift often. Urban development of this fan is changing its runoff potential and flow paths. Las Vegas Creek flows from west to east between the traffic lanes of Washington Avenue. At the confluence with Las Vegas Wash, the combined drainage area is over 800 square miles. The City of Mesquite, incorporated in March 1984, is located in the northeastern corner of Clark County. It lies immediately north of the Virgin River approximately 80 miles northeast of the City of Las Vegas. Mesquite has an area of approximately 11.3 square miles. Mesquite is situated at an elevation of approximately 1,600 feet. There are three distinct topographic regions within the city. The northernmost region is composed of steep, barren foothills from which many dry washes originate and flow southerly into the city. The central region is a broad, flat plain between the foothills and the Virgin River. This is part of the historical Virgin River floodplain, and has gently sloping topography to the south and west. This central region supports essentially all of the existing Virgin River channel and floodplain, and must be kept free of development.

7
The City of North Las Vegas is located in central Clark County, and occupies the central part of a broad, open desert basin. North Las Vegas is bounded by the City of Las Vegas on the south and west and Clark County on the east and north. Henderson and Boulder City are approximately 15 miles and 25 miles, respectively, southeast from North Las Vegas. Interstate 15 passes through the city. Boulder Dam is approximately 32 miles southeast of North Las Vegas. The corporate limits encompass an area of approximately 22.75 square miles. Las Vegas Wash originates in the Desert and Sheep Mountain ranges located north of the City of North Las Vegas. An alluvial apron formed by numerous coalesced alluvial fans skirts the mountains and is located within the northern portion of the city. The southern portion of the city is dissected by many small channels, which do not have the capacity to contain the larger, more infrequent storms that occur. Las Vegas Wash runs through the eastern portion of North Las Vegas and continues southeastward until it terminates at Lake Mead on the Colorado River. Unnamed Tributary to Las Vegas Wash joins it from the west at Las Vegas Boulevard. Here Las Vegas Wash has a drainage area of 880 square miles and a channel length of 38 miles from its headwaters. Population growth has been rapid in Clark County over the past 60 years, increasing from less than 5,000 in 1920 to over 598,300 in 1986. Half of the total county population is located within the unincorporated areas of the county. The population of Clark County is concentrated in the Las Vegas Valley; 96 percent of the total county population, or 574,335, are located in the valley. Of those, over 288,500 are within the unincorporated portion of the valley (Reference 1). In addition to the permanent population, a significant visitor population is present in the Las Vegas Valley throughout the year. The visitor population is generated principally by the entertainment, gaming, and recreational opportunities of the area. Legalized gambling has been the prime element in the economic development. Mining and agriculture have become secondary industries. Typical soil types of the Las Vegas Valley include the Delnorte-Nickel family, the Bodlard-Bracken-McCarran association, and the Nickel-Arizo-Delnorte family. The Bodlard-Bracken-McCarran association consists of a gravely fine sandy loam and fine sandy loam with slopes of 0 to 8 percent. The two other soil types are gravelly loams to very gravelly sandy loams formed on alluvial fans from mixed rock sources, with slopes of 2 to 15 percent. The weather in the county is arid, characterized by sparse rainfall, low humidity, and wide extremes in daily temperatures. The average annual precipitation is approximately 3.95 inches. The average annual temperature is about 66°F with average daily maximums in the high 70s and average daily minimums in the mid-50s. Daily maximum temperatures in summer usually exceed 100°F (Reference 2).

8
Winter storms in the area are regional in nature. These storms are associated with broad low-pressure systems that develop over the Pacific Ocean and move easterly. Precipitation from these storms is generally widespread and is intense only on rare occasions. Summer storms, however, occur as localized thunderstorms and can be intense. These local convective storms are associated with moisture from the gulf of California and the southern Pacific Ocean that moves northeasterly. Floods occurring in the area in and around Clark County are generally associated with precipitation from summer convective thunderstorms originating in the mountains, occurring mainly during the hotter months (July through September) (References 3 and 4). Due to the arid nature of the desert in which Clark County is located, the area is dry except during and shortly after a storm. When a major storm does move into the area, water collects rapidly as surface runoff and concentrates in a short period of time. Consequently, resultant floodflows are of the flash flood type, having sharp peaks and short durations. Natural vegetation in the area around Clark County is typical of the Mojave Basin desert region and includes creosote brush, a variety of yuccas, mesquite, and sagebrush. Soils are coarse and rocky in the foothill areas, producing rapid runoff. Soils on the plain are more porous, particularly where modified by agricultural activity. The topography of Clark County is characterized by north-south-trending mountain ranges eroding laterally to vast desert valleys. The ranges rise to elevations as high as 11,918 feet (Mt. Charleston, Spring Mountain Range). Other range crests are between 9,000 and 6,000 feet. Wide alluvial fans or aprons extend from the base of the mountains. The alluvial fans gently level out of the basin lowlands, where sediments from the gullies and washes draining the aprons are deposited. The basin lowlands have been continually filling with sediment since the mountains were formed. Sediment deposition is attributed to the reduced runoff velocities and associated low scouring in the valley bottom areas. Storm drainage channels in the lowlands are poorly defined, and most storm runoff occurs as sheetflow, which is concentrated ultimately in major wash areas with high speed and intensity. The Moapa Valley is 50 miles northeast of Las Vegas. Meadow Valley Wash is a major tributary of the Muddy River entering from north. The Muddy River flows southeasterly into Lake Mead, southeast of the Town of Overton. In the Lower Moapa Valley, the irrigated land is intensively farmed, and the prime crops are vegetables, other cash crops, and forage crops, which are fed to dairy cattle and horses. More recent irrigation development has occurred in the Upper Moapa Valley. The Moapa Indian Reservation covers a large portion of the irrigated land in this area. In the Meadow Valley Wash area, there is minimal agriculture development, but residential development has begun west of Glendale. The nonirrigated areas have either phreatophytic tree and shrub cover or grass and desert brush. The vegetation of the surrounding watershed is very sparse desert brush. Alluvium is the dominant valley-fill material in the Moapa Valley and Mesquite-Bunkerville area. It is generally very thick and consists of gravel, sand, silt, and clay of sedimentary origin. The soils in the area are generally fine to moderately coarse textured in the valley bottom, and moderately coarse or coarse textured and gravelly on the upper terraces. Colors are usually pale or light brown. There is little organic matter or nitrogen in the native

9
soil. Deposits of gypsum and other salts originating from the Muddy Creek Formation are found in parts of the valley. The Laughlin Area is located 70 miles south and slightly east of the City of Las Vegas. The development consists of a coal-fired power plant and a small casino-resort complex located on the west bank of the Colorado River. Soils in the Laughlin area consist of: Carrizo-Gunsight, a sloping sandy loam surface; rock outcrop Gachado, a very cobbly fine sandy loam surface; Gunsight-Carrizo-Ajo, a sandy gravelly loam; and Gilman-McClellan-Coachella, loam and loamy fine sand.
2.3 Principal Flood Problems
The typical flood-producing storm causing flooding problems in Clark County are associated with summer thunderstorms of short duration and high intensity which result in significant runoff rates. These storms result from topical depressions that approach Clark County from the south or southeast. Summer or winter general storms of longer duration and lower intensity have not contributed to significant discharges in the past. Severe storms have occurred in the Clark County area in the past decade. There are only three first-order rain gages in Southern Nevada (at Las Vegas Airport, Boulder City, and Searchlight). Thus, much of the information regarding historical storms comes from other scattered gages and eyewitness accounts. Newspaper accounts of flood damage in and around Boulder City date back to July 11, 1932, when a large storm extending from Indian Springs on the west to Boulder City on the east caused damage to the Boulder Dam Highway. Other flood damage in Boulder City occurred on September 24, 1935; March 3, 1938, June 29, 1938; September 7, 1939; July 27, 1952; and, October 27, 1974. The heaviest rainfall recorded at Boulder City since a weather station was established there in 1931 occurred on September 11, 1976. The rainfall recorded for the day was 2.62 inches, which reportedly occurred within a 3-hour time span. The amount of precipitation which occurred from this storm exceeded that which would be expected once in 100 years. There have been a number of major floods in Henderson. In September 1952, a storm blackened Henderson; power poles were downed and rains were torrential. In June 1954, homes on the north side of Henderson were ravaged by high waters. Several homeowners were forced to knock out walls to allow mud and water to pass through. In July 1974, severe flooding forced Henderson Police to close Sunset Road due to flooding (Reference 7). Conclusions drawn from limited data are that these three floods were smaller than the 10-year recurrence interval flood. The July 1974 flood was the most recent as well as the most severe flood of record. A flood occurred in Henderson on July 24, 1955, resulting from an intense storm centered over Henderson. The greatest amount of rainfall observed was 1.75 inches approximately 8 miles southeast of the city along U.S. Highway 95. Rainfall measurements in other parts of Henderson ranged from 0.6 inch to 1.5 inches. Floodwater swept down on Henderson, swamping hundreds of homes and stopping traffic. The recurrence interval for this flood is estimated to be 25 years. The largest recorded flow on Las Vegas Creek in the City of Las Vegas occurred on July 3-4,

10
1975, when a flow of 1,000 cubic feet per second (cfs) was measured at a point above F Street (Reference 8). The return period for this event is 28 years. This flood resulted from an average of 1.75 inches of rain. The next largest floods occurred in 1955; when on June 13, 700 cfs, and on July 24, 600 cfs, were measured at a point located 300 feet downstream of the intersection of the Tonopah Highway (U.S. Highway 95) and Las Vegas Creek (References 9 and 10). These flows have return periods of 12 and 8 years, respectively. An additional 6,000 cfs were measured on the west side of the Union Pacific Railroad, approximately 200 feet north of San Francisco Street, on June 13, 1955. The Charleston Boulevard and Bonanza Road underpasses at the Union Pacific Railroad in the City of Las Vegas have been inundated many times in the past. The largest recorded flood that occurred on Las Vegas Wash happened on July 3, 1976, when 12,000 cfs was measured at the USGS gaging station located upstream of Las Vegas Boulevard north of Las Vegas. The next measured events occurred on May 31, 1973, and September 25, 1967, when flows measured 1,640 cfs and 1,170 cfs, respectively. These three floods have return periods of 111, 5, and 4 years, respectively (References 11 and 12). Principal flood problems in the City of Mesquite are associated with a series of washes that originate in the mountains to the north of the city and flow southerly to the Virgin River. The three washes of major concern are Pulsipher, Abbot, and Town. Flows from these washes concentrate at the mouths, then spread out across the broad area between the foothills and the Virgin River. The channels for the washes have a limited capacity, and are only capable of containing approximately a 10-year floodflow. In addition, the channels are unlined, and are susceptible to erosion and sediment deposition problems, particularly at bridge and unimproved road crossings. Recent major flood events have occurred in August 1981 and July 1984. The 1984 flood reportedly caused flow to overtop Mesquite Boulevard on Abbott Wash by approximately 0.5 foot, and led to extensive erosion and sediment deposition throughout all of the channels. Local residents claimed that the worst flood event on Town Wash in the past 40 years caused water to overtop Mesquite Boulevard by approximately 1.0 foot. There are no available estimates of flow rates or frequencies for any past flood on any of the three dry washes. The Virgin River causes frequent flooding problems in the Mesquite area. The largest peak flow of record at the gage at Bunkerville bridge (downstream of the confluence of Abbott Wash) was 35,200 cfs on December 6, 1966 (Reference 12). This flow has an estimated return period of 98 years. Damage from flooding of this nature generally consists of erosion, sedimentation, inundation of crop land, and road and bridge washouts. Vegetation in the floodplain (natural and agricultural) becomes uprooted and obstructs downstream bridges.

11
Most severe flood events on Las Vegas Wash result from intense, short-duration thunderstorms. One of the largest recorded floods on Las Vegas Wash in North Las Vegas was 12,010 cfs on July 3, 1975. The next largest measured event occurred on May 31, 1973, and September 25, 1967, when 1,640 cfs and 1,170 cfs, respectively, were measured. These three floods have return periods of approximately 150, 4, and 3 years, respectively. Recent major flood events have occurred in August 1981, August 1983, and July 1984. The 1981 event was the result of a severe thunderstorm which occurred on August 10, 1981, moving from north to south across southeastern Nevada. Heaviest rainfall was reported over the Moapa Valley (Reference 5), with at least one inch of rain falling over approximately 10,000 square miles. In the area of greatest intensity, 6.5 inches of rain was estimated to fall in less than one hour. On August 10, 1983, an intense flash-flood thunderstorm occurred over the upper portion of Flamingo Wash (Reference 13), moving from south to north and causing flooding in the Las Vegas Valley area of Clark County. The storms produced at least one inch of rain over 100 to 150 square miles. The maximum total storm depth was estimated to be 4 inches occurring over a 3-hour period. A series of thunderstorms swept through southern Nevada in July and August 1984 and caused flooding in the Las Vegas Valley, the Moapa Valley, and the City of Boulder City. The total storm depth at the City of Boulder City was 3.25 inches in a 2.5-hour period (Reference 3). Most of the stream channels located on debris cones or alluvial fans are inadequate to pass even minor floods, and flows rarely spread out evenly over the surface of an alluvial fan. Typically, flow is concentrated in a temporary channel or confined to a portion of the fan surface. The flow paths are prone to lateral migration and sudden relocation to other areas of the fan during a single flood event. This erratic, unpredictable behavior subjects all portions of the fan to potential flood hazard. Channel migration is considerably less on larger well-defined washes, especially where channel stability measures have been constructed (i.e., reinforced concrete lining or rock riprap). On washes where protective measures have not been constructed, rapid alteration may occur in the channel banks due to the highly erosive materials that produce an alluvial fan. In undeveloped areas, floodflows on alluvial fans are essentially unmodified, and processes such as fanhead trenching, braiding of distributary channels, and channel abandonment occur. Urban development on alluvial fans is subjected to major flood-related hazards such as high velocities, rapid bank erosion, and sediment deposition. Flooding within the Moapa Valley is of two types: (1) Major storms on the upstream watershed of the Muddy River and its tributary, Meadow Valley Wash; and (2) intense convective storms on the watershed of local side washes. Flooding of both types has always been a problem in the developed and irrigated areas. On August 17, 1922, a large flood damaged much of the Moapa Valley. The flood came through Arrow Canyon into the upper end of the valley and was augmented by flow from side washes emptying into the valley. Roads and bridges were washed out, and the drugstore and many houses were flooded in Overton. The estimated discharge for the lower Moapa

12
area was 8,110 cfs and had a recurrence interval of approximately 20 years. A large flood hit Meadow Valley Wash and Lower Moapa Valley on March 3, 1983. The estimated discharge was 10,000 cfs, and the recurrence interval was 30 years. On August 11, 1941, the largest flood recorded in the Lower Moapa Valley occurred. An intense short-duration storm over the Lower Moapa Valley and California Wash produced estimated discharges of 10,000 cfs at California Wash and 12,000 cfs at Glendale. The latter is estimated to be a 36-year flood. The discharge on California Wash is estimated to be a 100-year flood. The most recent large flood in the Moapa Valley occurred in November 1960. The estimated discharge near Glendale was 7,400 cfs, with a return period of 16 years. Vegetation in channels of the Muddy River and Meadow Valley Wash obstruct floodflows. In many areas, tress and shrubs grow on the channel banks and bottom and thereby increase roughness and decrease the effective flow area of the channel. There are several culverts and bridge crossings along the Muddy River. The culverts are often overtopped by floodwaters, and erosion and washing occurs. In past floods, bridges have been washed out and carried downstream, thus aggravating flood problems. The Laughlin area is subject to flash floods coming from west of the area. There are few well-defined channels to concentrate the floodflows. Most of the damage consists of roads being covered with silt, boulders, and other debris, making travel impossible at times. The Colorado River has been a major flooding source in the Laughlin area of Nevada and the entire Mohave Valley. This valley is of alluvial origin and prior to the construction of levees for channelization, the river twisted and meandered through the area. Prior to the construction of Hoover Dam and other dams on the Colorado River, major snowmelt floods caused damage to the lower Colorado River basin each spring. Peak floodflows of 300,000 cfs occurred in 1884, and 220,000 cfs occurred in 1921 (Reference 4). These flows are far in excess of the present 500-year frequency flood used in this study. During the spring and early summer of 1984, higher than normal snowmelt in the Colorado River Basin filled the storage capacity of the Colorado River dam system. Releases in excess of 40,000 cfs from Davis Dam were required for a period of time during the late summer and fall of 1984. Several residential structures adjacent to the Colorado River experienced flood damage as a result of these releases.
2.4 Flood Protection Measures
Development occurred in Clark County without any significant flood control structures until the Civilian Conservation Corps (CCC) was sent to Nevada in 1933. After the CCC left in 1935, no major flood control improvements were made in the county for over 20 years. The North Las Vegas Detention Basin is a 2,600 acre-foot facility located in the northern Las Vegas Valley, on Las Vegas Wash. The amount originally funded for the project was $2.8 million and was budgeted by the 1981 Clark County Flood Control Bond Issue. An additional $500,000 was requested and received from Clark County when this amount proved to be insufficient to complete construction. Construction of the project began in September 1983, and work was completed in April 1984. The basin is located 3.5 miles north of Craig Road on Losee Road. It is the largest detention basin in the state of Nevada. Flows from the north on Las Vegas Wash are routed through the basin, which diverts up to

13
9,000 cfs from the wash and reduces the flow to a 4,500 cfs outflow. When full, the basin is designed to contain a 100-year floodflow on Las Vegas Wash. Flows from storms of a frequency higher than the 100-year event will cause some overtopping of the diversion berm in the wash. The Angle Park Detention Basin is located upstream of the Las Vegas Expressway and currently has a storage capacity of approximately 950 acre-feet. The project was funded in phases through the 1981 Clark County Flood Control Bond Issue and a cooperative agreement between the City of Las Vegas and Clark County for appropriation of bond issue funds for design and construction of the basin. This agreement was dated July 1982. The final phase (Phase IIB) of the project was completed in late 1985. The Red Rock Detention Basin is located in the southwestern Las Vegas Valley, on the alluvial fan portion of Red Rock Wash, downstream of the Charleston Boulevard crossing. The facility has a storage volume of 1,673 acre-feet at the spillway crest. It reduces the 100-year peakflow on Red Rock Wash to 1,390 cfs through a pair of 60-inch RCP outlet works. Several flood control structures have been built on the Muddy River and Meadow Valley Wash in the Moapa Valley. In 1935 and 1936, Wells Siding Diversion Dam and Bowman Reservoir were constructed by the CCC. These structures are located near the upper end of the Lower Moapa Valley. The Wells Siding Diversion Dam diverts Muddy River flows into the Lower Moapa Valley Canal System and into Bowman Reservoir. The feeder canal to Bowman Reservoir has a capacity of approximately 1,000 cfs. Bowman Reservoir is approximately 1 mile east of Wells Siding Dam and is approximately 30 feet high and 780 feet long. The reservoir is used to store excess winter flows to supplement the normal Muddy River discharge during the heavy irrigation season. Runoff from a small side wash is collected in Bowman Reservoir, but this has a minor effect on reducing peak flows on the Muddy River. The Muddy River channel was enlarged for 2 miles in the vicinity of Logandale by the CCC. Arrow Canyon Dam was built by the CCC on the Muddy River. This dam is approximately 30 feet high and is constructed of rubble masonry. At the time of compiling this study, the storage area of the dam was filled with sediment and no longer controlled floodflows. A channelization project completed in the early 1960s, between the Union Pacific Railroad and the upstream boundary of the Moapa Indian Reservation, affords some flood protection to the lands within this portion of the Muddy River. Two COE dams, Pine Canyon and Mathews Canyon Dams, are located in the drainage area of Meadow Valley Wash above the Town of Caliente, Lincoln County, Nevada. The SCS has constructed a watershed protection and flood prevention project in the headwaters of Meadow Valley Wash. Because of the distance from the study area, their effect on major floodflows in the study area is minimal. In the Laughlin area, flows in the Colorado River are regulated by Hoover Dam and Davis distribution was adopted Dam, north of the area. These structures offer flood protection from events larger than the 100-year flood on the Colorado River. Additionally, the USBR has constructed a levee for flood protection along the Colorado River through the area. The levee, designed to contain the 100-year discharge, is armored

14
with rock riprap to protect it from erosion. Current county ordinances require that any new construction be elevated 18 inches above the 100-year water-surface elevation, as determined by the developer.
3.0 ENGINEERING METHODS
For the flooding sources studied by detailed methods in the community, standard hydrologic and hydraulic study methods were used to determine the flood-hazard data required for this study. Flood events of a magnitude that are expected to be equaled or exceeded once on the average during any 10-, 50-, 100-, or 500-year period (recurrence interval) have been selected as having special significance for floodplain management and for flood insurance rates. These events, commonly termed the 10-, 50-, 100-, and 500-year floods, have a 10-, 2-, 1-, and 0.2-percent chance, respectively, of being equaled or exceeded during any year. Although the recurrence interval represents the long-term, average period between floods of a specific magnitude, rare floods could occur at short intervals or even within the same year. The risk of experiencing a rare flood increases when periods greater than 1 year are considered. For example, the risk of having a flood that equals or exceeds the 100-year flood (1-percent chance of annual exceedence) in any 50-year period is approximately 40 percent (4 in 10); for any 90-year period, the risk increases to approximately 60 percent (6 in 10). The analyses reported herein reflect flooding potentials based on conditions existing in the community at the time of completion of this study. Maps and flood elevations will be amended periodically to reflect future changes.
3.1 Hydrologic Analyses
Hydrologic analyses were carried out to establish peak discharge-frequency relationships for each flooding source studied by detailed methods affecting the community.
Peak discharges for the desired return periods were computed for flooding sources in Clark County primarily through the use of the TR-20 Project Formulation-Hydrology computer program (Reference 15) or by using log-Pearson Type III procedures. The TR-20 program was developed by the SCS to implement the SCS unit hydrograph procedures. Aspects for the hydrologic analysis which are common to all of the study areas are discussed in the following paragraphs, after which specific procedures applied to each individual area are described. An investigation of flood-producing storms typical of Southern Nevada was conducted. It was determined, based on a review of published historical storm events, that thunderstorms in the study area are generally of approximately 3-hour duration, and cover at most 150 to 200 square miles. Qualitative descriptions of historical events were used to develop a

15
synthetic cumulative time distribution for a 3-hour thunderstorm in Southern Nevada. This rather than any of the SCS standard dimensionless storm patterns. This approach was coordinated with local meteorologists. Point precipitation values for the 10-year, 50-year, and 100-year 3-hour storms were obtained from the National Oceanic and Atmospheric Administration (NOAA) Precipitation-Frequency Atlas for the State of Nevada (Reference 16). Depth-area reduction factors from a recent publication of NOAA called HYDRO-40 (Reference 17) were used to estimate average rainfall over each of the study watersheds. Although HYDRO-40 was developed using actual storm data from Arizona and western New Mexico, common storm-producing mechanisms would appear to justify application of the results to southern Nevada as well. Peak 500-year floodflows for the study streams analyzed with TR-20 were estimated by extrapolating graphically from the computed 10-, 50-, and 100-year discharges. All peak flows adopted for use in this study are considered to be clear water flows. That is, no sediment or debris bulking factors have been applied to the results of the TR-20 or log-Pearson Type III analyses. Bulking has not been used in this study based on discussions with Clark County Public Works engineers, who indicated that channels and storage facilities in the study reaches do not seem to exhibit large widespread amounts of sedimentation or erosion. This primary flooding source in the Moapa valley is the Muddy River. This is a major watercourse with a USGS stream gage located in “The Narrows” between the Upper and Lower Moapa Valley. The gage has a 33-year period of systematic record, as well as historical peak estimates, which was considered adequate for use in a statistical analysis. The log-Pearson Type III method recommended by Water Resources Council Bulletin 17B (Reference 18), was used to determine 10-, 50-, 100-, and 500-year peak flows at the gage site. This analysis made use of the full systematic record up to the 1983 water year, and incorporated the 15 historical peaks as per Bulletin 17B. Subsequent to the initial statistical analysis and preliminary hydraulic calculations, a large flood occurred on the Muddy River in August 1984, which generated the highest peak flow in the systematic record. As a result, frequency statistics were recomputed, including the new flow. However, it was determined that the previously estimated discharges fell within the 50-percent confidence interval of the more recent estimates and thus, in accordance with FIS Guidelines, the original discharges were adopted. Peak discharges at the Muddy River gage were translated downstream by two compensating methods: (1) flows were increased by the ratio of the increased drainage area; and (2) flows were routed through the Moapa Valley floodplain using the normal depth routing method, assuming a hydrograph shape similar to that developed by the COE in the Flood Plain Information Report for the Muddy River (Reference 19). In addition, peak flows for all recurrence intervals were reduced by 1,000 cfs downstream of Wells Siding to account for water supply diversions to Bowman Reservoir. This is the maximum capacity of the diversion facility. Peak flows for the Muddy River upstream of Meadow Valley Wash were determined by a discharge-drainage area relationship developed using log-Pearson analyses of records from two gages: the Muddy River near Glendale and Meadow Wash near Caliente.

16
Peak floodflows for Overton Wash were originally scheduled to be determined using a regional regression approach. However, the best available regional methods had questionable reliability, so a recent TR-20 analysis by the SCS was used for Overton Wash hydrology. Peak 100-year floodflows at the apexes of the four major alluvial fans in the Laughlin area (Hiko Springs Wash, Bridge Canyon Wash, Dripping Springs Wash, and Southwest Unnamed Wash) were computed using a TR-20 model developed by the Clark County Department of Comprehensive Planning. The flood magnitude-frequency relationships for these washes were assumed to be normal distributions of the base 10 logarithms of the peak discharges. The distributions were assumed to have a standard deviation of 0.8. This area had originally been scheduled for analysis with regional regression methods. However, during the course of the study, the Department of Comprehensive Planning conducted a floodplain study for the Laughlin Area which included a TR-20 model for each of the fan tributary areas. After review and some minor revisions, this model was adopted for the FIS hydrology as the best available information. There is no historical rainfall-runoff data available from the Laughlin flooding sources with which to calibrate the hydrologic model. Critical storms were assumed to occur independently over each of the four fan watersheds, which have areas ranging from 4 to 18 square miles. Peak discharge-frequency relationships for the Colorado River were based on operating procedures for the Hoover Dam (Reference 20) and USBR information (Reference 14). These discharges were adopted for the Bullhead City study area. The 100-year peak discharge is equivalent to the “levee design flood” used by the USBR. The 10-, 50-, and 500-year peak discharge relationships were based on operating procedures for Hoover Dam and additional information provided by the USBR (References 14 and 20). Estimates of flood discharges for the alluvial fan analysis in the City of Henderson were based on published USGS data (Reference 21). The Las Vegas Wash watershed in North Las Vegas was divided into 78 subbasins to model the rainfall-runoff process. Subbasin areas varied from 1.1 to 432.7 square miles, while times of concentration ranged from 0.37 to 6.52 hours. Soil type and land-use impacts on runoff were modeled using the SCS, Curve Number; subbasin curve numbers varied from 77 to 93. The TR-20 model for Las Vegas wash was roughly calibrated using historical rainfall and runoff data gathered during the July 3, 1975, flood, which is the largest recorded flood event in the study area. Peak discharges corresponding to the selected frequencies were computed at key locations in the watershed, including Las Vegas Wash at the Union Pacific Railroad and the Unnamed Tributary to Los Vegas Wash at the Union Pacific Railroad. Flows at these two points were routed downstream to their confluence above Las Vegas Boulevard. Below the confluence, peak discharges were determined by adding peak flows in Las Vegas Wash to concurrent flows in the Unnamed Tributary to Las Vegas Wash. Channel overflows occurring at bridges, culverts, and other locations or reduced channel capacity were computed based on hydraulic rating curves developed using the HEC-2 Water-Surface Profiles computer program (Reference 22).
Peak discharge-drainage area relationships for all of the flooding sources studied by detailed methods are shown in Table 3.

Table 3. Summary of Discharges Drainage Area Peak Discharges (Cubic Feet per Second) Flooding Source and Location (Square Miles) 10-Year 50-Year 100-Year 500-Year Alluvial Fan In Eastern Henderson 5.54 370 2,200 3,600 --1 Alluvial Fan In Western Henderson 76.0 1,490 13,300 23,370 --1 Abbott Wash At Interstate 15 7.16 --1 --1 3,334 --1 Blue Diamond Fan At Apex 69.5 2,010 8,800 14,820 42,550 Bridge Canyon Wash At Apex 7.3 650 2,680 4,430 12,240 Colorado River At Laughlin 169,300 --1 --1 40,0002 --1 Dripping Springs Wash At Apex 4.5 460 1,910 3,150 8,710 Duck Creek At Interstate 15 --3 --1 --1 1,326 --1 Upstream of Lower Duck Creek Detention Basin 119.8 --1 --1 4,826 --1 Downstream of Lower Duck Creek Detention Basin 119.8 --1 --1 3,395 --1 At Mountain Vista Avenue 158.5 --1 --1 6,195 --1 At Boulder Highway 164.8 --1 --1 8,562 --1 Duck Creek Tributary At Interstate 15 --3 --1 --1 5,100 --1 Duck Creek South Channel Above Silverado Ranch Boulevard 6.7 --1 --1 5,700 --1
1Discharge not available 2Established by the Colorado River Floodway Protection Act, Public Law 99-450 3Flow affected by upstream overflows, diversions, or obstructions; drainage area does not apply

Table 3. Summary of Discharges (Cont’d)
Flooding Source and Location Drainage Area (Square Miles)
Peak Discharges (Cubic Feet Per Second) 10% Annual
Chance 2% Annual
Chance 1% Annual
Chance 0.2% Annual
Chance Georgia Avenue Wash
At Buchman Boulevard 1.98 263 781 1,285 4,300 At Mendota Drive 0.95 177 459 727 2,000 At Cross Section E 0.45 68 189 310 1,000
Hemenway Wash
At Cross Section C 2.86 290 635 815 1,380 At Cross Section E 1.06 80 195 260 420
Hiko Springs Wash
At Apex 17.9 1,220 5,070 8,370 23,130 Las Vegas Creek
At Las Vegas Boulevard 13 640 1,280 1,570 2,420 At Confluence with Las Vegas Wash 14 660 1,300 1,600 2,450
Las Vegas Wash
Just below Losee Road --1 --1 --1 6,730 --1 Approximately 400 feet downstream of Interstate 15 --2 --1 --1 9,136 --1 Approximately 750 feet upstream of East Cheyenne Avenue --2 --1 --1 6,977 --1 Just downstream of Owens Boulevard --2 --1 --1 8,155 --1 At confluence of Las Vegas Creek --2 --1 --1 11,314 --1 Just downstream of Stewart Street --2 --1 --1 12,754 --1 Just downstream of Las Vegas Boulevard --2 --1 --1 7,573 --1 Just downstream of Nellis Boulevard --2 --1 --1 13,515 --1 Approximately 1,200 feet upstream of confluence of Sloan Channel --2 --1 --1 18,672 --1 Approximately 250 feet downstream of Lake Mead Boulevard --2 --1 --1 7,800 --1 At Desert Inn Road --2 --1 --1 18,718 --1
1 Data Not Available 2 Flow affected by upstream overflows, diversions, or obstructions; drainage area does not apply.

Table 3. Summary of Discharges (Cont’d)
Flooding Source and Location Drainage Area (Square Miles)
Peak Discharges (Cubic Feet Per Second) 10% Annual
Chance 2% Annual
Chance 1% Annual
Chance 0.2% Annual
Chance Las Vegas Wash (Cont’d)
Approximately 850 feet upstream of divergence of Las Vegas Split Flow 1 --1 --1 --1 18,798 --1
Just downstream of divergence of Las Vegas Split Flow 2 --1 --1 --1 5,682 --1
Approximately 1,200 feet downstream of convergence of Las Vegas Split Flow 2 --1 --1 --1 20,690 --1
Just downstream of divergence of Las Vegas Split Flow 3 --1 --1 --1 11,752 --1
Approximately 5,300 feet downstream of convergence of Las Vegas Split Flow 3 --1 --1 --1 22,530 --1
Las Vegas Wash Split Flow 1
Just downstream of divergence from Las Vegas Wash --1 --1 --1 8,907 --1
Las Vegas Wash Split Flow 2
Just downstream of divergence from Las Vegas Wash --1 --1 --1 4,210 --1
Las Vegas Wash Split Flow 3
Just downstream of divergence from Las Vegas Wash --1 --1 --1 8,938 --1
Middle Branch Blue Diamond Wash
At Union Pacific Railroad --2 --1 --1 1,961 --1 At Interstate 15 97.5 --1 --1 1,462 --1
Muddy River
At Cooper Avenue 4,035 5,250 14,750 21,300 45,900 Downstream of Wells Siding 3,950 5,270 14,800 21,400 45,500 Upstream of confluence with Meadow Valley
Wash 1,360 3,620 10,900 16,000 34,400 1 Data Not Available 2 Flow affected by upstream overflows, diversions, or obstructions; drainage area does not apply.

Table 3. Summary of Discharges (Cont’d)
Flooding Source and Location Drainage Area (Square Miles)
Peak Discharges (Cubic Feet Per Second) 10% Annual
Chance 2% Annual
Chance 1% Annual
Chance 0.2% Annual
Chance North Branch Blue Diamond Wash
At Union Pacific Railroad --2 --1 --1 244 --1 At Interstate 15 7.8 --1 --1 1,290 --1
Overton Wash
At Upstream Limit of Detailed Study 21.7 2,170 4,510 5,680 8,200 Pulsifier Wash
At Leavitt Lane 4.9 --1 --1 2,100 --1 Upstream of Interstate 15 4.7 --1 --1 3,100 --1
Southwest Unnamed Wash
At Apex 3.9 260 1,070 1,770 4,890 Tropicana Wash – Central Branch
At Flamingo Wash 20.1 --1 --1 4,473 --1 Upstream of Airport Wash 12.1 --1 --1 3,320 --1 Downstream of Koval Road 11.0 --1 --1 3,320 --1 Just upstream of Interstate 15 3.6 --1 --1 1,545 --1 Just downstream of Union Pacific Railroad 1.5 --1 --1 750 --1 Downstream of Tropicana Wash – North Branch 1.3 --1 --1 1,582 --1 Upstream of Union Pacific Railroad 1.5 --1 --1 1,818 --1 Breakout Upstream of Union Pacific Railroad 1.5 --1 --1 1,068 --1 Downstream of Tropicana Wash – South Branch 0.1 --1 --1 121 --1 At Jones Boulevard 0.3 --1 --1 189 --1
Tropicana Wash – North Branch
Above confluence with Tropicana Wash – Central Branch 1.0 --1 --1 1,352 --1
Just downstream of Hacienda Avenue 0.5 --1 --1 833 --1 Just downstream of South Decatur Boulevard 0.8 --1 --1 1,270 --1 At Jones Boulevard 0.4 --1 --1 240 --1 Just upstream of the confluence with Tributary
No.2 0.9 --1 --1 821 --1 Tropicana Wash – South Branch
Above Jones Boulevard 0.3 --1 --1 340 --1 1 Data Not Available 2 Flow affected by upstream overflows, diversions, or obstructions; drainage area does not apply.


22
3.2 Hydraulic Analyses
Analyses of the hydraulic characteristics of flooding from the sources studied were carried out to provide estimates of the elevations of floods of the selected recurrence intervals. Users should be aware that flood elevations shown on the Flood Insurance Rate Map (FIRM) represent rounded whole-foot elevations and may not exactly reflect the elevations shown on the Flood Profiles or in the Floodway Data tables in the FIS report. Flood elevations shown on the FIRM are primarily intended for flood insurance rating purposes. For construction and/or floodplain management purposes, users are cautioned to use the flood elevation data presented in this FIS in conjunction with the data shown on the FIRM. Cross sections for the backwater analyses of the detailed riverine study streams in the unincorporated areas of Clark County and the City of Mesquite were obtained from an aerial survey conducted in May 1984. This information was augmented by relative channel sections obtained by field measurement. All bridges and culverts were field surveyed to obtain hydraulic data and structural geometry. Cross sections for the backwater analyses of the Colorado River were obtained from the USBR (Reference 14). The below-water sections were obtained by field measurement. Ground topography was joined with the river cross section information at appropriate locations. Ground topography was obtained from three sources:
1. From aerial photogrammetry, flown in 1984 and compiled at a map scale of 1:4,800 with a 4-foot contour interval (Reference 23).
2. From aerial photogrammetry, flown in 1977 and compiled at a map scale of
1:1,200 with a 2-foot contour interval (Reference 24).
3. From USGS quadrangle maps at a scale of 1:24,000 with a 5-foot contour interval (Reference 25).
The cross section data for Hemenway Wash, Georgia Avenue Wash, Wash B, Wash C, and Wash D in the City of Boulder consisted of 11 cross sections digitized from aerial photogrammetry, 4 cross sections surveyed, and 15 cross sections for which data were derived from 2-foot contour interval maps (Reference 26). Cross sections for the backwater analysis of Las Vegas Wash and Las Vegas Creek in the City of Las Vegas were obtained from field surveys, construction drawings of Washington Avenue, and topographic maps compiled in 1976 and 1977 from photographs dated February 1974 (Reference 27). Additional bridge and culvert data were obtained by field measurement. Cross sections for the backwater analysis of Las Vegas Wash and the Unnamed Tributary to Las Vegas Wash in the City of North Las Vegas were obtained from aerial photographs flown on September 26, 1981, which were compiled to produce topographic mapping at a scale of 1:2,400 with a contour interval of 2 feet (Reference 28), and from field reconnaissance of the study area. Additional topographic data in the overflow area parallel to the Union Pacific Railroad were obtained from 1:480 topographic maps provided by the City of North Las Vegas, based on aerial photography from February and March 1980 (Reference 29). Topographic information required to extend cross sections beyond the corporate limits for the shallow flooding analysis between Lake Mead Boulevard and Las Vegas Boulevard was obtained from the most current USGS topographic mapping for the study area (Reference 30). Water-surface elevations of floods of the selected recurrence intervals for the Cities of Boulder City and Las Vegas were computed through use of the SCS WSP-2 step-backwater

23
computer program (Reference 31). Water-surface elevations of floods of the selected recurrence intervals for the unincorporated areas of Clark County, the City of Mesquite, and the City of North Las Vegas were computed through the use of the COE HEC-2 step-backwater computer program (Reference 22). Locations of selected cross sections used in the hydraulic analyses are shown on the Flood Profiles (Exhibit 1). For stream segments for which a floodway was computed (Section 4.2), selected cross section locations are also shown on the FIRM.
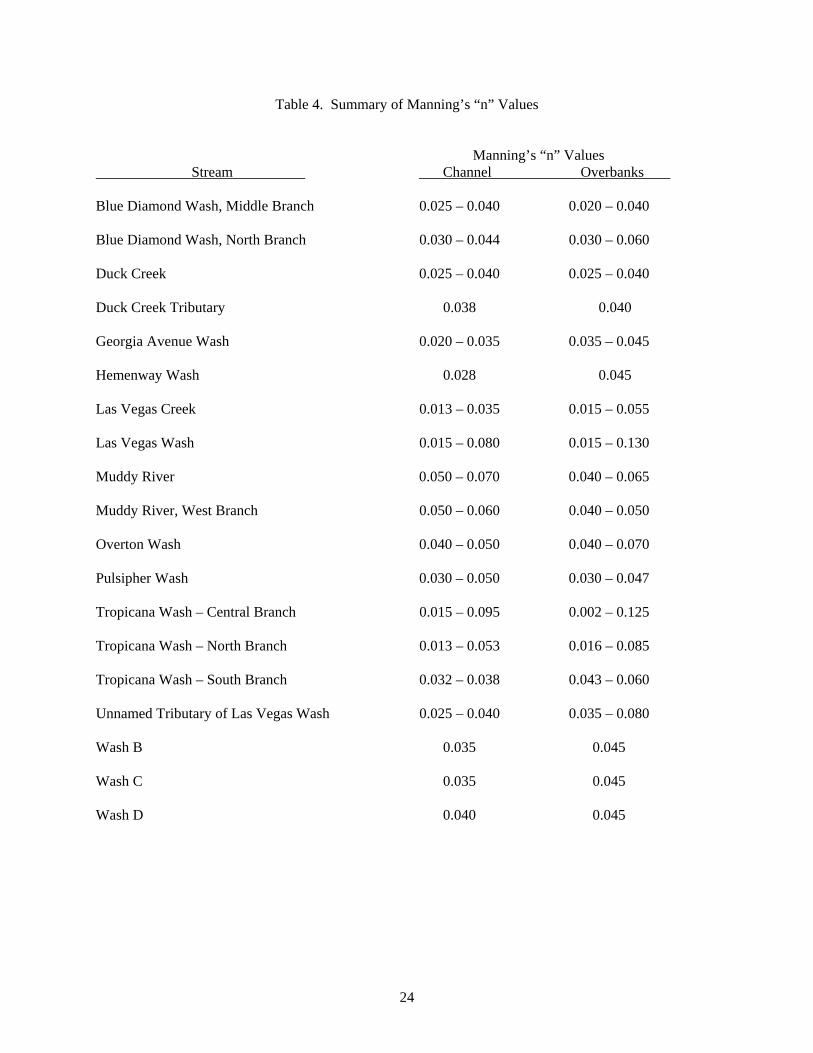
Roughness coefficients (Manning’s “n”) used in the hydraulic analysis were selected based on field observation and engineering judgement. These values are shown in Table 4. Flood profiles were drawn showing computed water-surface elevations for floods of the selected recurrence intervals. The starting water-surface elevations for the Muddy River, Overton Wash, and the West Branch Muddy River were calculated using the slope-area method. This starting method assumes that floods on the tributary stream are independent of floods on the main stream. The large difference in watershed areas between these tributaries and their main streams makes it very unlikely that concurrent floods would occur on both sources. Starting water-surface elevations for the original study for the Colorado River were determined by constructing stage/discharge curves from information supplied by the USBR and USGS. In evaluating the floodplains for the Muddy River and Overton Wash, it was determined that channel overflows occurred, particularly for the more infrequent flood events. These overflows leave the channel and do not return to it. Overflow magnitudes were determined by modeling the full flow over the entire floodplain (including the overflow area), and using either the flow distribution routine of HEC-2 or hand calculations to estimate the percentage of flow occurring in the overbanks. For determination of natural profiles, the overflow was subtracted from the full flow and the cross sections were modified to show effective flow area only in the main floodplain (excluding the overflow areas). Thus, flows in the HEC-2 model may decrease in a downstream direction as overflows are progressively subtracted from the main flow area at subsequent cross sections. Normal depth calculations were made at cross sections taken from USGS maps (Reference 32) for the reach of the Muddy River analyzed using approximate methods. The starting water-surface elevations for Pulsipher Wash were calculated using the slope-area method. This starting method assumed that floods on Pulsipher Wash are independent of floods on the Virgin River. The large difference in watershed areas between the wash and the river makes it very unlikely that concurrent floods would occur on both sources. In evaluating the floodplain for Pulsipher Wash, it was found that channel overflows occurred at or downstream of Mesquite Boulevard for the more infrequent flood events.
24
Table 4. Summary of Manning’s “n” Values
Manning’s “n” Values Stream Channel Overbanks Blue Diamond Wash, Middle Branch 0.025 – 0.040 0.020 – 0.040 Blue Diamond Wash, North Branch 0.030 – 0.044 0.030 – 0.060 Duck Creek 0.025 – 0.040 0.025 – 0.040 Duck Creek Tributary 0.038 0.040 Georgia Avenue Wash 0.020 – 0.035 0.035 – 0.045 Hemenway Wash 0.028 0.045 Las Vegas Creek 0.013 – 0.035 0.015 – 0.055 Las Vegas Wash 0.015 – 0.080 0.015 – 0.130 Muddy River 0.050 – 0.070 0.040 – 0.065 Muddy River, West Branch 0.050 – 0.060 0.040 – 0.050 Overton Wash 0.040 – 0.050 0.040 – 0.070 Pulsipher Wash 0.030 – 0.050 0.030 – 0.047 Tropicana Wash – Central Branch 0.015 – 0.095 0.002 – 0.125 Tropicana Wash – North Branch 0.013 – 0.053 0.016 – 0.085 Tropicana Wash – South Branch 0.032 – 0.038 0.043 – 0.060 Unnamed Tributary of Las Vegas Wash 0.025 – 0.040 0.035 – 0.080 Wash B 0.035 0.045 Wash C 0.035 0.045 Wash D 0.040 0.045

25
These overflows leave the channel and do not return to it, due in part to the slope of the floodplain away from the channel, and to the presence of levees on the channel banks. At the locations on the wash, the main floodplain is separated from the overflow areas only by a slight topographic ridge. Overflow magnitudes were determined by modeling the full flow over the entire floodplain (including the overflow area), and using the flow distribution routine of HEC-2 to estimate the percentage of flow occurring in the overbanks. For determination of natural profiles, the overflow was subtracted from the full flow, and the cross sections were modified to show effective flow areas only in the main floodplain (excluding the overflow areas). Flows in the HEC-2 model decrease in a downstream direction as overflows are progressively subtracted from the main flow area at subsequent cross sections. Average 100-year flow depths in overflow areas for Pulsipher Wash were determined using normal-depth calculations. In all cases average depths were less than 1.0 foot. Boundaries of the shallow flooding overflow areas could be determined only by approximate methods due to the general lack of topography on the broad Virgin River historical floodplain. Starting water-surface elevations for Las Vegas Wash, the Unnamed Tributary to Las Vegas Wash, Las Vegas Creek, and the Union Pacific Railroad overflow were calculated using the slope-area method. Shallow flooding occurs in the floodplain of Las Vegas Wash and the Unnamed Tributary to Las Vegas Wash. Shallow flooding is a result of overflows caused by reduced channel capacities frequently related to undersized bridge or culvert openings. Average depths and flow paths in these areas were estimated using normal depth calculations and accounts of historical flooding. Shallow flooding is often characterized by highly unpredictable flow directions caused by low relief or shifting channels and high debris loads. Where such conditions exist, the entire area susceptible to this unpredictable flow was delineated as a zone of equal risk. Small scale topographic variations were averaged across inundated areas to determine flood depths. The FEMA alluvial fan methodology was used to determine the flood depths and velocities on the alluvial fans in the Laughlin area (Reference 33). For two of the four fans in the area (Bridge Canyon Wash and Southwest Unnamed Wash), it was determined that the flood events consist of multiple channels. Therefore, the methodology for multiple flood channels was used to analyze the multiple channel regions of those alluvial fans. In alluvial fan areas subject to flooding from more than one flooding source, flood depths and velocities were computed by assuming that the event of inundation by a flood from any canyon is independent of the event of inundation by a flood from any other canyon. In accordance with FEMA guidelines, the union of such events, which has a probability of 0.01, was used to define depths and velocities in areas where multiple alluvial fans intersect. The hydraulic analyses for this study were based on unobstructed flow. The flood elevations shown on the profiles are thus considered valid only if hydraulic structures remain unobstructed, operate properly, and do not fail.
26
All elevations are referenced to the North American Vertical Datum of 1988 (NAVD). Elevation reference marks (ERMs) and the descriptions of the marks used in this study are shown on the maps. ERMs shown on the FIRM represent those used during the preparation of this and previous FISs. The elevations associated with each ERM were obtained and/or developed during FIS production to establish vertical control for determination of flood elevations and floodplain boundaries shown on the FIRM. Users should be aware that these ERM elevations may have changed since the publication of this FIS. To obtain up-to-date elevation information on National Geodetic Survey (NGS) ERMs shown on this map, please contact the Information Services Branch of the NGS at (301) 713-3242, or visit their website at www.ngs.noaa.gov. Map users should seek verification of non-NGS ERM monument elevations when using these elevations for construction or floodplain management purposes.
4.0 FLOODPLAIN MANAGEMENT APPLICATIONS
The NFIP encourages State and local governments to adopt sound floodplain management programs. To assist in this endeavor, each FIS provides 100-year floodplain data, which may include a combination of the following: 10-, 50-,100-, and 500-year flood elevations; delineations of the 100-year and 500-year floodplains; and 100-year floodway. This information is presented on the FIRM and in many components of the FIS, including Flood Profiles, Floodway Data tables and Summary of Stillwater Elevation tables. Users should reference the data presented in the FIS as well as additional information that may be available at the local community map repository before making flood elevation and/or floodplain boundary determinations. 4.1 Floodplain Boundaries
To provide a national standard without regional discrimination, the 1-percent annual chance (100-year) flood has been adopted by FEMA as the base flood for floodplain management purposes. The 0.2-percent annual chance (500-year) flood is employed to indicate additional areas of flood risk in the community. For each stream studied by detailed methods, the 100- and 500-year floodplain boundaries have been delineated using the flood elevations determined at each cross section. Between cross sections, the boundaries for the unincorporated areas of Clark County and the City of Mesquite were interpolated using rectified photo-topographic maps at a scale of 1:4,800, with a contour interval of 4 feet (Reference 34). For the Colorado River for the original study, floodplain boundaries were interpolated using topographic maps at a scale of 1:4,800, with a contour interval of 4 feet (Reference 23). Between cross sections in the City of Boulder City, the boundaries were interpolated using topographic maps at a scale of 1:2,400, with a contour interval of 2 feet (Reference 26). Between cross sections in the City of Las Vegas, the boundaries were interpolated using topographic maps at a scale of 1:2,400, with a contour interval of 5 feet. Shallow flooding areas were delineated using topographic maps (Reference 27). Between cross sections in the City of North Las Vegas, the boundaries were interpolated using topographic maps at a scale of 1:2,400, with a contour interval of 2 feet (Reference 28).

27
Alluvial fan boundaries in the City of Henderson were delineated using topographic maps at a scale of 1:24,000 with a contour interval of 20 feet (Reference 36). Approximate flood boundaries in the City of Boulder City were determined with the use of the following information and data:
1. Shallow flood depth as determined 2. Flood Hazard Boundary Map for Boulder City
3. USGS Flood-Prone Area Map (Reference 37)
4. Historical flood data
Approximate flood boundaries in the City of Henderson were delineated using topographic maps at a scale of 1:24,000, with a contour interval of 20 feet and at a scale of 1:2,400, with a contour interval of 5 feet (References 36 and 27). Approximate flood boundaries in some portions of the study area were taken from the Flood Hazard Boundary Map (Reference 38). Approximate 100-year flood boundaries in the City of Las Vegas were delineated using the previously cited topographic maps (Reference 27) and topographic maps at a scale of 1:24,000, with a contour interval of 20 feet (Reference 39). For the streams studied by approximate methods in the City of North Las Vegas, the boundary of the 100-year flood was developed from normal depth calculations and topographic maps at a scale of 1:2,400, with a contour interval of 2 feet (Reference 28), and topographic maps at a scale of 1:24,000, with a contour interval of 20 feet (Reference 30). Shallow flooding areas were delineated using normal depth calculations and topographic maps at a scale of 1:2,400, with a contour interval of 2 feet (Reference 28). Approximate 100-year floodplain boundaries in some portions of the study area were taken directly from the Flood Hazard Boundary Map for the City of Mesquite (Reference 40). Approximate floodplain boundaries on the Muddy River were delineated on USGS 7.5-Minute Series Topographic Maps (Reference 32). The alluvial fan boundaries were also delineated using rectified photo-topographic maps at a scale of 1:4,800, with a contour interval of 4 feet (Reference 34).
The 100- and 500-year floodplain boundaries are shown on the FIRM (Exhibit 2). On this map, the 100-year floodplain boundary corresponds to the boundary of the areas of special flood hazards (Zones A, AE, and AO); and the 500-year floodplain boundary corresponds to the boundary of areas of moderate flood hazards. In cases where the 100- and 500-year floodplain boundaries are close together, only the 100-year floodplain boundary has been shown. Small areas within the floodplain boundaries may lie above the flood elevations but cannot be shown due to limitations of the map scale and/or lack of detailed topographic data.
For the streams studied by approximate methods, only the 100-year floodplain boundary is shown on the FIRM.

28
Approximate 100-year floodplain boundaries in some portions of the study area were taken directly from the Flood Hazard Boundary Map for Clark County (Reference 35).
4.2 Floodways
Encroachment on floodplains, such as structures and fill, reduces flood-carrying capacity, increases flood heights and velocities, and increases flood hazards in areas beyond the encroachment. One aspect of floodplain management involves balancing the economic gain from floodplain development against the resulting increase in flood hazard. For purposes of the NFIP, a floodway is used as a tool to assist local communities in this aspect of floodplain management. Under this concept, the area of the 100-year floodplain is divided into a floodway and a floodway fringe. The floodway is the channel of a stream, plus any adjacent floodplain areas, that must be kept free of encroachment so that the 100-year flood can be carried without substantial increases in flood heights. Minimum Federal standards limit such increases to 1.0 foot, provided that hazardous velocities are not produced. The floodways in this study are presented to local agencies as minimum standards that can be adopted directly or that can be used as a basis for additional floodway studies.
The floodways presented in this study were computed for certain stream segments on the basis of equal conveyance reduction from each side of the floodplain. Floodway widths were computed at cross sections. Between cross sections, the floodway boundaries were interpolated. The results of the floodway computations are tabulated at selected cross sections (Table 5). In cases where the floodway and 100-year floodplain boundaries are either close together or collinear, only the floodway boundary has been shown.
The area between the floodway and 100-year floodplain boundaries is termed the floodway fringe. The floodway fringe encompasses the portion of the floodplain that could be completely obstructed without increasing the water-surface elevation of the 100-year flood more than 1 foot at any point. Typical relationships between the floodway and the floodway fringe and their significance to floodplain development are shown in Figure 1.
Figure 1. Floodway Schematic
In the areas studied in detail where no floodway is shown, the concept of a floodway does not apply because of shifting channels (upstream portions of Hemenway Wash, Georgia Avenue Wash and Wash D), and no overbank flooding (Wash B and Wash C).

CROSS SECTION DISTANCE1 WIDTH (FEET)
SECTION AREA (SQUARE FEET)
MEAN VELOCITY (FEET PER SECOND)
REGULATORY
WITHOUT FLOODWAY
WITH FLOODWAY
INCREASE
FLOODING SOURCE FLOODWAYBASE FLOOD
WATER SURFACE ELEVATION
FEET (NGVD)FEET (NGVD)FEET (NAVD)SECOND)
A 120 40 65 22.6 2,103.9 2,103.9 2,103.9 0.0
B 818 40 63 23.3 2,114.5 2,114.5 2,114.5 0.0
C 1,208 40 68 21.6 2,121.6 2,121.6 2,121.6 0.0
Blue Diamond Wash - Middle Branch
FEET (NGVD)FEET (NGVD)FEET (NAVD)
D 1,878 40 56 26.3 2,130.4 2,130.4 2,130.5 0.1
E 2,458 40 78 18.9 2,147.7 2,147.7 2,147.7 0.0
F 3,943 95 93 15.8 2,171.4 2,171.4 2,171.4 0.0
G 4,543 81 174 8.4 2,187.8 2,187.8 2,188.3 0.5
H 4,843 55 139 10.5 2,191.9 2,191.9 2,191.9 0.0
I 5,603 175 210 6.9 2,200.2 2,200.2 2,200.2 0.0, , , ,
J 6,263 140 252 5.8 2,209.2 2,209.2 2,209.2 0.0
K 6,663 190 253 5.8 2,213.0 2,213.0 2,213.0 0.0
L 7,583 170 205 7.1 2,221.0 2,221.0 2,221.0 0.0
M 8,353 155 289 5.1 2,228.8 2,228.8 2,228.8 0.0
N 8,813 143 383 3.8 2,234.4 2,234.4 2,234.9 0.5
O-P2 - - - - - - - -O-P - - - - - - - -
Q 11,260 104 441 3.4 2,252.9 2,252.9 2,253.8 0.9
R 12,189 59 157 9.3 2,263.5 2,263.5 2,264.0 0.5
1 St di t i f t b C fl ith D k C k 2 Fl d N t C t d1 Stream distance in feet above Confluence with Duck Creek 2 Floodway Not Computed
FEDERAL EMERGENCY MANAGEMENT AGENCY
CLARK COUNTY, NV AND INCORPORATED AREAS
FLOODWAY DATA
BLUE DIAMOND WASH - MIDDLE BRANCH
TABLE 5 5

CROSS SECTION DISTANCE1 WIDTH (FEET)
SECTION AREA (SQUARE FEET)
MEAN VELOCITY (FEET PER SECOND)
REGULATORY
WITHOUT FLOODWAY
WITH FLOODWAY
INCREASE
FLOODING SOURCE FLOODWAYBASE FLOOD
WATER SURFACE ELEVATION
FEET (NGVD)FEET (NGVD)FEET (NAVD)SECOND)
A 100 30 54 23.8 2,081.0 2,081.0 2,081.0 0.0
B 895 10 60 21.5 2,089.8 2,089.8 2,089.8 0.0
C 1,395 10 80 16.1 2,097.2 2,097.2 2,097.2 0.0
Blue Diamond Wash - North Branch
FEET (NGVD)FEET (NGVD)FEET (NAVD)
D 2,175 10 71 18.3 2,101.6 2,101.6 2,101.6 0.0
E 2,968 10 78 16.5 2,109.0 2,109.0 2,109.0 0.0
F 3,638 10 70 18.4 2,113.8 2,113.8 2,113.8 0.0
G 4,583 23 56 23.1 2,120.7 2,120.7 2,120.7 0.0
H 5,076 116 386 3.3 2,137.2 2,137.2 2,137.2 0.0
I 5,951 38 142 10.0 2,152.5 2,152.5 2,153.4 0.9, , , ,
J 6,651 90 167 7.7 2,162.7 2,162.7 2,162.9 0.2
K 7,571 42 129 10.0 2,172.1 2,172.1 2,172.1 0.0
L 8,331 160 202 6.4 2,183.5 2,183.5 2,183.5 0.0
M 9,101 92 179 7.2 2,192.0 2,192.0 2,192.1 0.1
N 9,911 50 162 8.0 2,199.0 2,199.0 2,199.9 0.9
O 10 691 98 236 5 5 2 211 9 2 211 9 2 212 7 0 8O 10,691 98 236 5.5 2,211.9 2,211.9 2,212.7 0.8
P 11,487 49 75 17.2 2,217.1 2,217.1 2,217.1 0.0
Q 12,100 45 55 23.5 2,220.9 2,220.9 2,220.9 0.0
R 12,680 80 217 6.0 2,235.0 2,235.0 2,235.8 0.8
S 13,490 68 210 6.1 2,244.7 2,244.7 2,245.6 0.9
T 14,270 41 130 9.9 2,253.2 2,253.2 2,253.8 0.6
U 15 060 32 119 10 8 2 262 3 2 262 3 2 262 9 0 6U 15,060 32 119 10.8 2,262.3 2,262.3 2,262.9 0.6
1 St di t i f t b C fl ith D k C k1 Stream distance in feet above Confluence with Duck Creek
FEDERAL EMERGENCY MANAGEMENT AGENCY
CLARK COUNTY, NV AND INCORPORATED AREAS
FLOODWAY DATA
BLUE DIAMOND WASH - NORTH BRANCH
FEET (NGVD)FEET (NGVD)FEET (NAVD)
TABLE 5
FEET (NGVD)FEET (NGVD)FEET (NAVD)
TABLE 5


CROSS SECTION DISTANCE1 WIDTH (FEET)
SECTION AREA (SQUARE FEET)
MEAN VELOCITY (FEET PER SECOND)
REGULATORY
WITHOUT FLOODWAY
WITH FLOODWAY
INCREASE
FLOODING SOURCE FLOODWAYBASE FLOOD
WATER SURFACE ELEVATION
FEET (NGVD)FEET (NGVD)FEET (NAVD)SECOND)
Duck Creek
A-W2
X 27,449 88 590 10.3 1,890.1 1,890.1 1,890.1 0.0
Y 28,218 77 312 19.4 1.910.8 1,910.8 1,910.9 0.1
Z 29,108 78 575 10.6 1,925.1 1,925.1 1,925.1 0.0
AA 29 805 93 721 8 3 1 929 3 1 929 3 1 929 3 0 0
FEET (NGVD)FEET (NGVD)FEET (NAVD)
AA 29,805 93 721 8.3 1,929.3 1,929.3 1,929.3 0.0
AB 30,196 100 740 8.1 1,931.7 1,931.7 1,931.7 0.0
AC 31,113 109 740 8.1 1,935.9 1,935.9 1,935.9 0.0
AD 32,111 53 246 23.6 1,943.7 1,943.7 1,943.7 0.0
AE 32,908 68 252 23.1 1,955.9 1,955.9 1,955.9 0.0
AF 33,682 65 272 21.4 1,964.2 1,964.2 1,964.2 0.0
AG 34 486 6 326 1 9 1 9 0 4 1 9 0 4 1 9 0 4 0 0AG 34,486 56 326 17.9 1,970.4 1,970.4 1,970.4 0.0
AH 35,391 56 278 20.9 1,972.9 1,972.9 1,972.9 0.0
AI 35,949 34 209 27.4 1,976.7 1,976.7 1,976.7 0.0
AJ 36,400 41 225 25.5 1,982.5 1,982.5 1,982.5 0.0
AK 37,205 50 248 23.1 1,992.0 1,992.0 1,992.0 0.0
AL 37,923 50 224 25.6 1,998.2 1,998.2 1,998.2 0.0
AM 38,704 64 228 25.2 2,009.1 2,009.1 2,009.1 0.0
AN 39,209 50 257 22.3 2,015.9 2,015.9 2,015.9 0.0
AO 39,742 60 250 23.0 2,021.6 2,021.6 2,021.6 0.0
AP 40,418 65 322 17.5 2,030.0 2,030.0 2,030.0 0.0
AQ 41,089 83 435 13.0 2,035.4 2,035.4 2,035.4 0.0
AR 41,726 57 353 16.0 2,036.8 2,036.8 2,036.8 0.0
AS 42,184 76 422 13.4 2,041.2 2,041.2 2,041.2 0.0
AT 42,839 80 428 13.2 2,045.6 2,045.6 2,045.6 0.0
AU 44,390 63 310 18.2 2,053.7 2,053.7 2,053.7 0.0
AV 44,840 63 303 18.6 2,055.6 2,055.6 2,055.6 0.0
1 Feet Above Confluence With Las Vegas Wash 2 No Floodway Computed
FEET (NGVD)FEET (NGVD)FEET (NAVD)
FEDERAL EMERGENCY MANAGEMENT AGENCY
CLARK COUNTY, NV AND INCORPORATED AREAS
FLOODWAY DATA
DUCK CREEK
FEET (NGVD)FEET (NGVD)FEET (NAVD)
TABLE 5

CROSS SECTION DISTANCE1 WIDTH (FEET)
SECTION AREA (SQUARE FEET)
MEAN VELOCITY (FEET PER SECOND)
REGULATORY
WITHOUT FLOODWAY
WITH FLOODWAY
INCREASE
FLOODING SOURCE FLOODWAYBASE FLOOD
WATER SURFACE ELEVATION
FEET (NGVD)FEET (NGVD)FEET (NAVD)SECOND)
Duck Creek (Continued)
AW 45,751 88 506 10.7 2,061.5 2,061.5 2,061.5 0.0
AX 46,476 92 437 12.4 2,069.7 2,069.7 2,069.7 0.0
AY 47,165 94 362 15.0 2,071.6 2,071.6 2,071.6 0.0
AZ 47,978 103 434 11.7 2,079.0 2,079.0 2,079.0 0.0
BA 48 773 85 259 18 3 2 080 1 2 080 1 2 080 1 0 0
FEET (NGVD)FEET (NGVD)FEET (NAVD)
BA 48,773 85 259 18.3 2,080.1 2,080.1 2,080.1 0.0
BB 49,564 86 214 22.1 2,087.1 2,087.1 2,087.1 0.0
BC 50,202 96 179 26.5 2,096.3 2,096.3 2,096.3 0.0
BD 50,769 40 149 25.4 2,106.6 2,106.6 2,106.6 0.0
BE 51,547 42 163 23.2 2,118.8 2,118.8 2,118.8 0.0
BF 52,338 42 149 25.4 2,126.3 2,126.3 2,126.3 0.0
BG 3 161 40 138 2 4 2 142 8 2 142 8 2 142 8 0 0BG 53,161 40 138 27.4 2,142.8 2,142.8 2,142.8 0.0
BH 53,934 67 423 9.0 2,156.4 2,156.4 2,156.4 0.0
BI 54,735 58 297 12.9 2,157.6 2,157.6 2,157.6 0.0
BJ 55,536 69 398 9.6 2,160.4 2,160.4 2,160.4 0.0
BK 56,328 63 214 17..9 2,160.7 2,160.7 2,160.7 0.0
BL 57,099 60 182 21.0 2,163.4 2,163.4 2,163.4 0.0
BM 57,902 54 207 18.4 2,173.0 2,173.0 2,173.0 0.0
BN 58,582 64 316 10.8 2,178.5 2,178.5 2,178.5 0.0
BO 59,067 76 201 16.9 2,179.5 2,179.5 2,179.5 0.0
BP 59,675 120 511 6.6 2,184.9 2,184.9 2,184.9 0.0
BQ 63,138 45 233 20.8 2,215.9 2,215.9 2,215.9 0.0
BR 63,919 50 240 20.1 2,220.9 2,220.9 2,220.9 0.0
BS 64,695 54 270 17.8 2,226.5 2,226.5 2,226.5 0.0
BT 65,636 54 275 17.6 2,231.4 2,231.4 2,231.4 0.0
BU 66,256 66 239 20.2 2,233.3 2,233.3 2,233.3 0.0
BV 67,095 45 173 18.1 2,241.4 2,241.4 2,241.4 0.0
BW 67,959 45 133 23.5 2,248.2 2,242.2 2,248.2 0.01 Feet Above Confluence With Las Vegas Wash
FEDERAL EMERGENCY MANAGEMENT AGENCY
CLARK COUNTY, NV AND INCORPORATED AREAS
FLOODWAY DATA
DUCK CREEK
TABLE 5

CROSS SECTION DISTANCE1 WIDTH (FEET)SECTION AREA (SQUARE FEET)
MEAN VELOCITY (FEET PER SECOND)
REGULATORY
WITHOUT FLOODWAY
WITH FLOODWAY
INCREASE
FLOODING SOURCE FLOODWAYBASE FLOOD
WATER SURFACE ELEVATION
FEET (NAVD)SECOND)
Duck Creek - South Channel
A 528 120 706 3.5 2,214.6 2,214.6 2,215.2 0.6
B 653 85 382 6.1 2,214.7 2,214.7 2,215.2 0.5
C 1,230 71 268 7.2 2,219.4 2,219.4 2,220.2 0.8
FEET (NAVD)
Duck Creek Tributary
A 5802 22 120 16.8 2,240.6 2,240.6 2,240.6 0.0
B 1,0402 42 135 15.0 2,243.9 2,243.9 2,243.9 0.0
C 3,1362 48 175 11.6 2,265.1 2,265.1 2,265.1 0.0
D 3,5572 1,000 926 5.5 2,288.2 2,288.2 2,288.2 0.0
E 4,5942 811 1,346 7.1 2,292.6 2,292.6 2,293.5 0.9, , , , ,
Hemenway
A 4,4204 150 325 3.3 2,002.6 2,002.6 2,003.6 1.0
B-E3 - - - - - - - -
1 Feet above Lower Duck Creek Detention Basin 2 Feet Above Confluence with Duck Creek 3 Floodway Not Computed 4 Feet Above Mouth1 Feet above Lower Duck Creek Detention Basin 2 Feet Above Confluence with Duck Creek 3 Floodway Not Computed 4 Feet Above Mouth
FEDERAL EMERGENCY MANAGEMENT AGENCY
CLARK COUNTY, NV AND INCORPORATED AREAS
FLOODWAY DATA
DUCK CREEK SOUTH CHANNEL - DUCK CREEK TRIBUTARY - HEMENWAY WASH
FEET (NAVD)
TABLE 5

CROSS SECTION DISTANCE1 WIDTH (FEET)
SECTION AREA (SQUARE FEET)
MEAN VELOCITY (FEET PER SECOND)
REGULATORY
WITHOUT FLOODWAY
WITH FLOODWAY
INCREASE
Las Vegas Wash
YF 14 446 7,401 3.1 1,431.4 1,431.4 1,432.4 1.0
YG 1,489 195 2,369 9.5 1,435.9 1,435.9 1,436.5 0.6
YH 3,304 469 4,731 4.8 1,447.8 1,447.8 1,447.8 0.0
YI 4,318 323 3,547 6.4 1,451.3 1,451.3 1,451.3 0.0
YJ 5,685 427 3,054 7.4 1,465.2 1,465.2 1,465.2 0.0
YK 6,862 496 4,808 4.7 1,473.7 1,473.7 1,473.7 0.0
YL 8,823 536 5,145 4.4 1,486.6 1,486.6 1,486.6 0.0
YM 10,201 417 4,271 5.3 1,491.0 1,491.0 1,491.0 0.0
YN 11,929 685 5,037 4.5 1,502.3 1,502.3 1,502.3 0.0
YO 13,351 372 2,283 9.9 1,516.9 1,516.9 1,516.9 0.0
YP 14,334 520 2,857 7.9 1,526.1 1,526.1 1,526.4 0.3
YQ 16,128 572 4,060 5.6 1,532.8 1,532.8 1,533.3 0.5
YR 16,687 394 2,890 7.8 1,533.6 1,533.6 1,533.9 0.3
YS 17 960 800 5 186 4 3 1 538 5 1 538 5 1 538 6 0 1
FLOODING SOURCE FLOODWAYBASE FLOOD
WATER SURFACE ELEVATION
FEET (NGVD)FEET (NAVD)
YS 17,960 800 5,186 4.3 1,538.5 1,538.5 1,538.6 0.1
YT 19,547 370 2,495 9.0 1,547.5 1,547.5 1,548.3 0.8
YU 22,127 425 4,900 4.6 1,563.5 1,563.5 1,564.4 0.9
YV 23,522 276 3,503 6.4 1,569.8 1,569.8 1,570.4 0.6
YW 25,114 152 1,385 8.5 1,575.1 1,575.1 1,575.2 0.1
YX 26,314 125 1,340 8.8 1,584.0 1,584.0 1,584.1 0.1
YY 27,850 992 3,203 6.5 1,593.4 1,593.4 1,594.1 0.7
YZ 29,633 760 3,370 5.6 1,608.6 1,608.6 1,609.6 1.0
ZA 31,159 350 2,413 6.1 1,623.8 1,623.8 1,624.7 0.9
ZB 32,672 88 616 9.2 1,636.9 1,636.9 1,636.9 0.0
ZC 34,289 893 4,099 4.6 1,651.7 1,651.7 1,652.4 0.7
ZD 35,540 927 5,205 3.6 1,661.9 1,661.9 1,662.7 0.8
ZE 36,333 732 3,930 4.8 1,665.5 1,665.5 1,666.2 0.7
ZF 36,518 914 4,978 3.8 1,668.2 1,668.2 1,669.0 0.81 Stream distance in feet above mouth
FEDERAL EMERGENCY MANAGEMENT AGENCY
CLARK COUNTY, NV AND INCORPORATED AREAS
FLOODWAY DATA
LAS VEGAS WASH
FEET (NGVD)
TABLE10
FEET (NAVD)
TABLE 5

CROSS SECTION DISTANCE1 WIDTH (FEET)
SECTION AREA (SQUARE FEET)
MEAN VELOCITY (FEET PER SECOND)
REGULATORY
WITHOUT FLOODWAY
WITH FLOODWAY
INCREASE
Las Vegas Wash
ZG 37,706 650 4,692 4.0 1,670.9 1,670.9 1,671.9 1.0
ZH 39,495 261 2,239 8.4 1,677.9 1,667.9 1,667.9 0.0
ZI 40,710 242 2,181 8.6 1,680.3 1,680.3 1,680.3 0.0
ZJ 42,110 218 2,205 8.5 1,683.6 1,683.6 1,683.6 0.0
ZK 43,910 183 1,830 10.2 1,688.2 1,688.2 1,688.2 0.0
ZL 45,508 183 1,516 12.4 1,691.2 1,691.2 1,691.2 0.0
ZM 45,998 124 1,483 12.6 1,694.3 1,694.3 1,694.3 0.0
ZN 46,708 176 1,268 14.7 1,694.6 1,694.6 1,694.6 0.0
ZO 47,308 173 1,228 15.2 1,696.4 1,696.4 1,696.4 0.0
ZP 48,707 163 1,318 9.8 1,707.6 1,707.6 1,707.6 0.0
ZQ 49,906 263 1,859 7.3 1,712.7 1,712.7 1,712.7 0.0
ZR 50,905 222 830 11.0 1,716.1 1,716.1 1,716.1 0.0
ZS 52,085 356 1,420 5.6 1,722.0 1,722.0 1,722.0 0.0
ZT 52 505 491 1 871 4 4 1 723 6 1 723 6 1 723 6 0 0
FLOODING SOURCE FLOODWAYBASE FLOOD
WATER SURFACE ELEVATION
FEET (NGVD)FEET (NGVD)FEET (NAVD)
ZT 52,505 491 1,871 4.4 1,723.6 1,723.6 1,723.6 0.0
ZU 52,905 485 1,473 6.0 1,724.0 1,724.0 1,724.0 0.0
ZV 54,104 498 1,317 7.7 1,728.7 1,728.7 1,728.7 0.0
ZW 55,704 507 1,922 6.9 1,734.8 1,734.8 1,734.8 0.0
ZX 56,904 209 1,393 9.7 1,737.4 1,737.4 1,737.4 0.0
ZY 58,104 176 1,352 9.6 1,741.3 1,741.3 1,741.3 0.0
ZZ 58,479 263 1,767 6.7 1,742.7 1,742.7 1,742.7 0.0
A 59,500 157 1,889 6.5 1,747.2 1,747.2 1,747.2 0.0
B 60,895 137 1,273 10.0 1,748.1 1,748.1 1,748.2 0.1
C 62,495 117 1,002 12.7 1,755.1 1,755.1 1,755.1 0.0
D 64,118 134 1,246 9.6 1,760.9 1,760.9 1,760.9 0.0
E 65,505 131 914 13.1 1,765.8 1,765.8 1,765.8 0.0
F 67,290 139 1,604 7.5 1,772.8 1,772.8 1,772.8 0.0
G 69,290 145 1,419 8.4 1,783.2 1,783.2 1,783.2 0.01 Stream distance in feet above mouth
FEDERAL EMERGENCY MANAGEMENT AGENCY
CLARK COUNTY, NV AND INCORPORATED AREAS
FLOODWAY DATA
LAS VEGAS WASH
FEET (NGVD)FEET (NGVD)
TABLE10
FEET (NAVD)
TABLE 5

CROSS SECTION DISTANCE1 WIDTH (FEET)
SECTION AREA (SQUARE FEET)
MEAN VELOCITY (FEET PER SECOND)
REGULATORY
WITHOUT FLOODWAY
WITH FLOODWAY
INCREASE
Las Vegas Wash
H 71,290 119 959 11.8 1,789.8 1,789.8 1,789.8 0.0
I 73,490 119 771 10.6 1,801.3 1,801.3 1,801.3 0.0
J 77,937 114 808 9.4 1,828.4 1,828.4 1,828.4 0.0
K 79,534 102 564 13.4 1,832.7 1,832.7 1,832.7 0.0
L 80,764 86 1,041 7.3 1,841.1 1,841.1 1,841.1 0.0
M 81,333 121 815 9.3 1,841.5 1,841.5 1,841.5 0.0
N 81,933 118 779 9.7 1,843.2 1,843.2 1,843.2 0.0
O 82,733 131 629 12.0 1,845.9 1,845.9 1,845.9 0.0
P 83,133 228 965 7.9 1,848.4 1,848.4 1,848.4 0.0
Q 83,533 79 620 11.3 1,849.7 1,849.7 1,849.7 0.0
R 83,733 105 537 13.0 1,850.5 1,850.5 1,850.5 0.0
S 83,938 118 740 9.4 1,852.9 1,852.9 1,852.9 0.0
T 84,238 129 574 12.2 1,855.0 1,855.0 1,855.0 0.0
U CR2
FLOODING SOURCE FLOODWAYBASE FLOOD
WATER SURFACE ELEVATION
( )
FEET (NGVD)FEET (NGVD)FEET (NAVD)
U-CR - - - - - - - -
1 Stream distance in feet above mouth 2 Floodway not computed
FEDERAL EMERGENCY MANAGEMENT AGENCY
CLARK COUNTY, NV AND INCORPORATED AREAS
FLOODWAY DATA
LAS VEGAS WASH
( )
FEET (NGVD)FEET (NGVD)FEET (NAVD)
TABLE 5


CROSS SECTION DISTANCE1 WIDTH (FEET)
SECTION AREA (SQUARE FEET)
MEAN VELOCITY (FEET PER SECOND)
REGULATORY
WITHOUT FLOODWAY
WITH FLOODWAY
INCREASE
FLOODING SOURCE FLOODWAYBASE FLOOD
WATER SURFACE ELEVATION
FEET (NGVD)FEET (NGVD)FEET (NAVD)SECOND)
A-B2 - - - - - - - -
C 0.135 74 377 17.7 2,022.7 2,022.7 2,022.7 0.0
D 0.170 79 610 8.7 2,025.9 2,025.9 2,026.8 0.9
Tropicana Wash - Central Branch
FEET (NGVD)FEET (NGVD)FEET (NAVD)
E 0.219 120 497 10.7 2,029.2 2,029.2 2,029.4 0.2
F 0.276 142 877 6.0 2,031.1 2,031.1 2,032.0 0.9
G 0.301 172 1,321 4.0 2,033.6 2,033.6 2,033.8 0.2
H 0.345 99 580 7.7 2,033.6 2,033.6 2,033.6 0.0
I 0.397 73 356 12.6 2,034.7 2,034.7 2,034.7 0.0
J 0.446 107 742 6.0 2,038.5 2,038.5 2,038.5 0.0, , ,
K 0.491 101 398 11.2 2,040.3 2,040.3 2,040.3 0.0
L-T2 - - - - - - - -
U 0.992 110 586 5.7 2,062.8 2,062.8 2,062.8 0.0
V 1.036 98 584 6.8 2,063.0 2,063.0 2,063.0 0.0
W 1.073 92 396 8.4 2,063.2 2,063.2 2,063.2 0.0
X 1 080 54 166 20 0 2 063 4 2 063 4 2 063 4 0 0X 1.080 54 166 20.0 2,063.4 2,063.4 2,063.4 0.0
Y 1.095 67 283 11.8 2,065.9 2,065.9 2,065.9 0.0
Z-AE2 - - - - - - - -
AF 2.566 110 920 1.7 2,157.0 2,157.0 2,157.0 0.0
AG 2.649 44 419 5.2 2,157.3 2,157.3 2,157.4 0.1
AH 2.722 100 150 6.9 2,159.2 2,159.2 2,159.2 0.0
AI 2 845 45 114 9 1 2 170 8 2 170 8 2 170 8 0 0AI 2.845 45 114 9.1 2,170.8 2,170.8 2,170.8 0.0
AJ 2.877 33 132 9.7 2,172.9 2,172.9 2,172.9 0.0
AK-AL2 - - - - - - - -
AM 3.158 23 99 8.1 2,191.5 2,191.5 2,191.5 0.0
AN 3.217 48 141 5.7 2,200.7 2,200.7 2,201.5 0.8
AO 3.361 10 92 12.0 2,208.0 2,208.0 2,208.7 0.71 Mil b C fl ith Fl i W h 2 Fl d N t C t d1 Miles above Confluence with Flamingo Wash 2 Floodway Not Computed
FEDERAL EMERGENCY MANAGEMENT AGENCY
CLARK COUNTY, NV AND INCORPORATED AREAS
FLOODWAY DATA
TROPICANA WASH - CENTRAL BRANCH
FEET (NGVD)FEET (NGVD)FEET (NAVD)
TABLE 5
FEET (NGVD)FEET (NGVD)FEET (NAVD)
TABLE 5

CROSS SECTION DISTANCE1 WIDTH (FEET)
SECTION AREA (SQUARE FEET)
MEAN VELOCITY (FEET PER SECOND)
REGULATORY
WITHOUT FLOODWAY
WITH FLOODWAY
INCREASE
FLOODING SOURCE FLOODWAYBASE FLOOD
WATER SURFACE ELEVATION
FEET (NGVD)FEET (NGVD)FEET (NAVD)SECOND)
AP 3.3823 712 2,789 0.7 2,216.9 2,216.9 2,216.9 0.0
AQ 3.5413 46 167 10.9 2,220.5 2,220.5 2,221.5 1.0
AR 3.6633 36 235 8.5 2,229.6 2,229.6 2,229.6 0.02
Tropicana Wash - Central Branch (Continued)
FEET (NGVD)FEET (NGVD)FEET (NAVD)
AS-BF2 - - - - - - - -
A 0.038 66 105 7.2 2,235.7 2,235.7 2,236.4 0.7
B 0.208 28 231 8.2 2,245.7 2,245.7 2,245.7 0.0
Tropicana Wash - North Branch
, , ,
C 0.228 70 353 3.8 2,247.9 2,247.9 2,248.4 0.5
D 0.336 64 158 8.5 2,253.0 2,253.0 2,253.0 0.0
E 0.438 50 310 4.6 2,257.7 2,257.7 2,258.3 0.6
F 0.487 30 211 5.0 2,259.8 2,259.8 2,260.0 0.2
G 0.624 20 68 15.4 2,262.7 2,262.7 2,262.7 0.0
H 0 687 27 149 5 6 2 267 4 2 267 4 2 267 4 0 0H 0.687 27 149 5.6 2,267.4 2,267.4 2,267.4 0.0
I 0.735 26 37 22.0 2,265.3 2,265.3 2,265.3 0.0
J 0.800 24 123 6.8 2,276.1 2,276.1 2,276.1 0.0
K 0.861 20 217 7.2 2,278.3 2,278.3 2,278.3 0.0
L 1.111 23 147 2.4 2,288.8 2,288.8 2,288.8 0.0
M 1.184 22 116 3.0 2,288.8 2,288.8 2,288.8 0.0
N 1 246 25 87 4 1 2 288 8 2 288 8 2 288 8 0 0N 1.246 25 87 4.1 2,288.8 2,288.8 2,288.8 0.0
O 1.334 19 26 13.7 2,293.1 2,293.1 2,293.1 0.0
P 1.361 20 24 14.5 2,295.0 2,295.0 2,295.0 0.0
Q 1.547 21 24 14.9 2,307.0 2,307.0 2,307.0 0.0
R 1.596 20 43 8.2 2,312.3 2,312.3 2,312.3 0.0
S 1.725 24 43 5.8 2,316.9 2,316.9 2,316.9 0.01 Mil b C fl ith T i W h C t l B h 2 Fl d N t C t d 3 Mil b C fl ith Fl i W h1 Miles above Confluence with Tropicana Wash - Central Branch 2 Floodway Not Computed 3 Miles above Confluence with Flamingo Wash
FEDERAL EMERGENCY MANAGEMENT AGENCY
CLARK COUNTY, NV AND INCORPORATED AREAS
FLOODWAY DATA
TROPICANA WASH CENTRAL BRANCH - TROPICANA WASH NORTH BRANCH
FEET (NGVD)FEET (NGVD)FEET (NAVD)
TABLE 5
WASH NORTH BRANCH
FEET (NGVD)FEET (NGVD)FEET (NAVD)
TABLE 5

CROSS SECTION DISTANCE1 WIDTH (FEET)
SECTION AREA (SQUARE FEET)
MEAN VELOCITY (FEET PER SECOND)
REGULATORY
WITHOUT FLOODWAY
WITH FLOODWAY
INCREASE
FLOODING SOURCE FLOODWAYBASE FLOOD
WATER SURFACE ELEVATION
FEET (NGVD)FEET (NGVD)FEET (NAVD)SECOND)
T 1.773 19 82 4.1 2,323.7 2,323.7 2,323.7 0.0
U-Z2 - - - - - - - -
AA 2.227 28 102 8.3 2,356.2 2,356.2 2,356.8 0.6
Tropicana Wash - North Branch (Continued)
FEET (NGVD)FEET (NGVD)FEET (NAVD)
AB 2.335 48 101 8.4 2,364.4 2,364.4 2,364.4 0.0
AC 2.433 35 95 8.9 2,372.7 2,372.7 2,372.7 0.0
AD 2.532 30 87 9.8 2,382.9 2,382.9 2,382.9 0.0
1 Mil b C fl ith T i W h C t l B h 2 Fl d N t C t d1 Miles above Confluence with Tropicana Wash - Central Branch 2 Floodway Not Computed
FEDERAL EMERGENCY MANAGEMENT AGENCY
CLARK COUNTY, NV AND INCORPORATED AREAS
FLOODWAY DATA
TROPICANA WASH - NORTH BRANCH
FEET (NGVD)FEET (NGVD)FEET (NAVD)
TABLE 5
FEET (NGVD)FEET (NGVD)FEET (NAVD)
TABLE 5

CROSS SECTION DISTANCE1 WIDTH (FEET)
SECTION AREA (SQUARE FEET)
MEAN VELOCITY (FEET PER SECOND)
REGULATORY
WITHOUT FLOODWAY
WITH FLOODWAY
INCREASE
FLOODING SOURCE FLOODWAYBASE FLOOD
WATER SURFACE ELEVATION
FEET (NAVD)SECOND)
A 521 106 636 10.9 1,858.1 1,858.1 1,858.1 0.0
B 1,321 100 665 10.8 1,861.7 1,861.7 1,861.7 0.0
C 2,104 84 500 14.0 1,866.3 1,866.3 1,866.3 0.0
Unnamed Tributary to Las Vegas Wash (A Channel)
FEET (NAVD)
D 2,621 102 596 11.7 1,870.9 1,870.9 1,870.9 0.0
E 2,921 77 488 14.3 1,872.9 1,872.9 1,872.9 0.0
F 3,721 1,196 8,054 1.1 1,876.4 1,876.4 1,876.4 0.0
G 4,328 135 2,577 12.9 1,878.9 1,878.9 1,878.9 0.0
H 4,903 117 669 13.7 1,882.2 1,882.2 1,882.2 0.0
I 5,528 98 705 12.9 1,886.9 1,886.9 1,886.9 0.0, , , ,
J 6,168 125 821 8.2 1,899.3 1,899.3 1,899.3 0.0
K-L2 - - - - - - -
1 Feet upstream of confluence with Las Vegas Wash 2 Data Not Available1 Feet upstream of confluence with Las Vegas Wash 2 Data Not Available
FEDERAL EMERGENCY MANAGEMENT AGENCY
CLARK COUNTY, NV AND INCORPORATED AREAS
FLOODWAY DATA
UNNAMED TRIBUTARY TO LAS VEGAS WASH (A CHANNEL)
FEET (NAVD)
TABLE 5


53
5.0 INSURANCE APPLICATION
For flood insurance rating purposes, flood insurance zone designations are assigned to a community based on the results of the engineering analyses. These zones are as follows:
Zone A
Zone A is the flood insurance rate zone that corresponds to the 100-year floodplains that are determined in the FIS by approximate methods. Because detailed hydraulic analyses are not performed for such areas, no base (100-year) flood elevations (BFEs) or depths are shown within this zone.
Zone AE
Zone AE is the flood insurance rate zone that corresponds to the 100-year floodplains that are determined in the FIS by detailed methods. Whole-foot BFEs derived from the detailed hydraulic analyses are shown at selected intervals within this zone.
Zone AO
Zone AO is the flood insurance rate zone that corresponds to the areas of 100-year shallow flooding (usually sheet flow on sloping terrain) where average depths are between 1 and 3 feet. Average whole-foot depths derived from the detailed hydraulic analyses are shown within this zone. Alluvial fan flood hazard areas are shown on the FIRM as Zone AO, and average depths may exceed 3 feet. Development on alluvial fans is subject to more sever flood hazards than would normally be encountered in a Zone AO because the velocities of flows in the alluvial fan are high and the locations of the flow paths on the alluvial fans are unpredictable.
Zone X
Zone X is the flood insurance rate zone that corresponds to areas outside the 500-year floodplain, areas within the 500-year floodplain, areas of 100-year flooding where average depths are less than 1 foot, areas of 100-year flooding where the contributing drainage area is less than 1 square mile, and areas protected from the 100-year flood by levees. No BFEs or depths are shown within this zone.
Zone D
Zone D is the flood insurance rate zone that corresponds to unstudied areas where flood hazards are undetermined, but possible.
6.0 FLOOD INSURANCE RATE MAP
The FIRM is designed for flood insurance and floodplain management applications.
For flood insurance applications, the map designates flood insurance rate zones as described in Section 5.0 and, in the 100-year floodplains that were studied by detailed methods, shows selected whole-foot BFEs or average depths. Insurance agents use the zones and BFEs in conjunction with information on structures and their contents to assign premium rates for flood insurance policies.
For floodplain management applications, the map shows by tints, screens, and symbols, the 100- and 500-year floodplains, floodways, and the locations of selected cross sections used in the hydraulic

54
analyses and floodway computations.
The current FIRM represents flooding information for the entire geographic areas of Clark County. Previously separate FIRMs were prepared for each identified flood prone incorporated community and the unincorporated areas of the country. Historical data relating to the maps prepared for each community are presented in Table 6.
7.0 OTHER STUDIES
A Flood Plain Information report for Lower Las Vegas Wash was prepared by the COE in 1967 (Reference 41). The limits of the report extended to the southern corporate limits of the City of North Las Vegas. Peak discharge values were calculated for Las Vegas Wash that did not correspond to values used by the COE for their Flood Plain Information report. However, these differences were resolved during earlier coordination meetings. Boulder City completed a floodplain study (Reference 42) in 1975. Another study completed in Boulder City was the Hemenway Wash Inventory and Evaluation (Reference 43). Flood Boundaries were not drawn for that study; only peak discharges were computed.
Detailed FISs have previously been performed for the incorporated Cities of Las Vegas, North Las Vegas, Henderson, Boulder City, and Mesquite (References 44, 45, 46, 47, 48, respectively). Detailed analyses of flooding along Colorado River matches exactly with the detailed analyses of flooding shown in the FIS for the City of Bullhead City, Arizona (Reference 49). FISs for Nye County, Nevada; Lincoln County, Nevada; Mohave County, Arizona; San Bernardino County, California; and Inyo County, California have been performed (References 50, 51, 52, 53 and 54, respectively). The information in those studies generally agrees with the information given in this study for Clark County.
8.0 LOCATION OF DATA
Information concerning the pertinent data used in the preparation of this study can be obtained by contacting the Federal Emergency Management Agency, Region IX, Federal Insurance and Mitigation Administration, 1111 Broadway, Suite 1200, Oakland, California 94607-4052.

COMMUNITY NAME INITIAL IDENTIFICATIONFLOOD HAZARD BOUNDARY MAP REVISION DATE
FLOOD INSURANCE RATE MAP EFFECTIVE DATE
FLOOD INSURANCE RATE MAP REVISION DATE
Boulder City, City of 6/28/1974 12/26/1975 9/16/1981 None
Clark County (Unincorporated Areas) 8/30/1974 6/27/1978 9/29/1989 None
Henderson, City of 6/28/1974 1/28/1977 6/15/1982 None
Las Vegas, City of 12/3/1976 None 9/30/1980 10/18/1983
Mesquite, City of 11/1/1985 None 9/28/1990 None
North Las Vegas, City of 2/15/1974 2/4/1977 1/16/1981 12/15/1983
FEDERAL EMERGENCY MANAGEMENT AGENCY
CLARK COUNTY, NV AND INCORPORATED ARES
COMMUNITY MAP HISTORY
TA
BL
E 6

56
9.0 BIBLIOGRAPHY AND REFERENCES 1. Clark County Department of Comprehensive Planning, Las Vegas, Nevada, August 27, 1986
2. U.S. Department of Commerce, National Oceanic and Atmospheric Administration, National Weather Service, Climatological Data, State of Nevada
3. Clark County Regional Flood Control District, Flood Control Master Plan, Volume 1, James
M. Montgomery, Consulting Engineers, Inc., May 1986 4. U.S. Department of the Interior, Geological Survey, Water-Resources Investigations,
Open-File Report 80-963, Flood Potential of Topopah Wash and Tributaries, Eastern Part of Jackass Flats, Nevada Test Site, Southern Nevada, R.C. Christensen and N.E. Spahr, 1980
5. U.S. Department of Commerce, National Oceanic and Atmospheric Administration, National
Weather Service, Report on the Moapa Valley Flash Flood, August 10, 1981, 1982 6. Las Vegas Evening Review Journal, July 11, 1932 7. U.S. Department of Agriculture, Soil Conservation Service, History of Flooding, Clark
County, Nevada, 1905-1975, prepared in cooperation with the Clark County Conservation District, 1977
8. Clark County Flood Control Division, Department of Public Works, A Brief Hydrologic
Appraisal of the July 3-4, 1975, Flash Flood in Las Vegas Valley, Nevada, prepared in cooperation with the U.S. Geological Survey, 1976
9. U.S. Department of the Army, Corps of Engineers, Los Angeles District, Report on Flood of
June 13, 1955, Las Vegas and Vicinity, Nevada, July 6, 1955
10. U.S. Department of the Army, Corps of Engineers, Los Angeles District, Report on Flood of July 24, 1955 at Las Vegas and Henderson, Nevada, August 1955
11. U.S. Department of the Interior, Geological Survey, Water Supply Papers, Surface Water
Supply of the United States, 1957-1964
12. U.S. Department of the Interior, Geological Survey, Water-Data Reports, Water Resources Data for Nevada, 1965-1976
13. U.S. Department of the Interior, Geological Survey, Flash Flood of August 10, 1983 in Las
Vegas Valley, Nevada, Provisional records, 1983
14. U.S. Department of the Interior, Bureau of Reclamation, Flood Plain Information, Colorado River, Davis Dam to Topock, Boulder City, Nevada, March 1969
15. U.S. Department of Agriculture, Soil Conservation Service, TR-20, Computer Program For
Project Formulation – Hydrology, 1965, Revised 1982

57
16. U.S. Department of Commerce, National Oceanic and Atmospheric Administration, Precipitation-Frequency Atlas of the Western United States, Volume VII-Nevada, NOAA Atlas 2, J.F. Miller, R.H. Frederick, and R.J. Tracey, 1973
17. U.S. Department of Commerce, National Oceanic and Atmospheric Administration, National
Weather Service, Depth-Area Ratios in the Semi-Arid Southwest United States, Technical Memorandum NWS HYDRO-40, August 1984
18. U.S. Water Resources Council, Guidelines For Determining Flood Flow Frequency, Bulletin
#17B, September 1981
19. U.S. Department of the Army, Corps of Engineers, Flood Plain Information Report, Muddy River, June 1974
20. U.S. Department of the Army, Corps of Engineers, Los Angeles District, Colorado River
Basin, Hoover Dam: Review of Flood Control Regulations, Los Angeles, California, July 1982
21. U.S. Department of the Interior, Geological Survey, Water Resources Investigation, 77-21,
Magnitude and Frequency of Floods in California, A.O. Waananen and Jr., R. Crippen, June 1977
22. U.S. Department of the Army, Corps of Engineers, Hydrologic Engineering Center, Computer
Program 723-X6-L202A, HEC-2 Water Surface Profiles, Davis, California, November 1976, Revised September 1982, 1991
23. Kenney Aerial Mapping, Aerial Photogrammetry, Mohave County, Arizona, Map scale
1:4,800, Phoenix, Arizona 1984
24. U.S. Department of the Army, Corps of Engineers, Los Angeles District, Aerial Photogrammetry, Colorado River Needles Area, Map scale 1:1,200, Los Angeles, California, May 18, 1977
25. U.S. Department of the Interior, Geological Survey, 7.5-Minute Series Topographic Maps,
Map Scale 1:24,000
26. City of Boulder City, Department of Public Works, Topographic Maps Scale 1:2,400, Contour Interval of 2 feet: City of Boulder City, Nevada (1974)
27. Clark County Regional Planning Council, Clark County Regional Aerial Mapping Project,
Scale 1:2,400, Contour Interval of 5 feet, compiled by American Aerial Surveys, Inc., Covina, California, 1977
28. Aero-Graphic, Inc., Photogrammetric Maps, Scale 1:2,400, Contour Interval of 2 feet: North
Las Vegas, Nevada, (September 26, 1981)
29. Cooper Aerial Survey Co., Photogrammetric Maps, North Las Vegas, Nevada, Scale 1:480, February and March 1980
58
30. U.S. Department of the Interior, Geological Survey, 7.5-Minute Series Topographic Maps,
Scale 1:24,000, Contour Interval 20 feet: Las Vegas NE, (1976), Photorevised (1973); Las Vegas NW, Nevada (1967), Photorevised (1973); Gas Peak SW, Nevada (1974)
31. U.S. Department of Agriculture, Soil Conservation Service, Technical Release No. 61, WSP-
2 Computer Program, May 1976
32. U.S. Department of the Interior, Geological Survey, 7.5-Minute Topographic Maps, Scale 1:24,000, Contour Intervals 10 and 20 feet
33. Federal Emergency Management Agency, Office of Natural and Technological Hazards,
Computer Program for Determining Flood Depths and Velocities on Alluvial Fans, D.S. Harty, December 1982
34. Cooper Aerial of Nevada, Steroscopic Aerial Photography of Clark County, Nevada,
Scale 1:4,800, Contour Interval 4 feet: 1984
35. U.S. Department of Housing and Urban Development, Federal Insurance Administration, Flood Hazard Boundary Map, Clark County, Nevada, Scale 1:24,000, June 27, 1978
36. U.S. Department of the Interior, Geological Survey, 7.5-Minute Series Topographic Maps,
Scale 1:24,000, Contour Interval 20 feet: Henderson, Nevada (1970); Las Vegas SE, Nevada (1967), Photorevised (1973); Boulder Beach, Nevada (1970); Boulder City NW, Nevada (1958), Photorevised (1973); Boulder City, Nevada (1958), Photorevised
37. U.S Department of the Interior, Geological Survey, Flood-Prone Area Map, Scale 1:24,000,
Boulder City, Nevada 1974
38. U.S. Department of Urban and Housing Development, Federal Insurance Administration, Flood Hazard Boundary Map, City of Henderson, Nevada, Scale 1:24,000, January 1977
39. U.S. Department of the Interior, Geological Survey, 7.5-Minute Series Topographic Maps,
Scale 1:24,000, Contour Interval 20 feet: Gas Peak Southwest, Nevada (1974); Tule Springs, Park, Nevada (1974); Las Vegas Nevada Northwest, Nevada (1967); Photorevised (1973); Las Vegas Northeast, Nevada (1967), Photorevised (1973); Blue Diamond Northeast, Nevada (1972)
40. Federal Emergency Management Agency, Flood Hazard Boundary Map, City of Mesquite,
Clark County, Nevada, November 1, 1985
41. U.S. Department of the Army, Corps of Engineers, Los Angeles District, Flood Plain Information, Lower Las Vegas Wash, Clark County, Nevada, December 1967
42. City of Boulder City, Department of Public Works, Floodplain Study, 1976
43. U.S. Department of Agriculture, Soil Conservation Service, Hemenway Wash Inventory and
Evaluation, 1974
44. Federal Emergency Management Agency, Federal Insurance Administration, Flood Insurance Study, City of Las Vegas, Nevada, October 18, 1983

59
45. Federal Emergency Management Agency, Federal Insurance Administration, Flood Insurance Study, City of North Las Vegas, Nevada, December 15, 1983
46. Federal Emergency Management Agency, Federal Insurance Administration, Flood Insurance
Study, City of Henderson, Nevada, June 15, 1982
47. Federal Emergency Management Agency, Federal Insurance Administration, Flood Insurance Study, City of Boulder City, Nevada, September 16, 1981
48. Federal Emergency Management Agency, Federal Insurance Administration, Flood Insurance
Study, City of Mesquite, Nevada, September 28, 1990
49. Federal Emergency Management Agency, Federal Insurance Administration, Flood Insurance Study, City of Bullhead City, Arizona, September 4, 1987
50. Federal Emergency Management Agency, Federal Insurance Administration, Flood Insurance
Study, Nye County, Nevada, April 12, 1983
51. Federal Emergency Management Agency, Federal Insurance Administration, Flood Insurance Study, Lincoln County, Nevada, February 17, 1988
52. Federal Emergency Management Agency, Federal Insurance Administration, Flood Insurance
Study, Mohave County, Arizona, March 1, 1983
53. Federal Emergency Management Agency, Federal Insurance Administration, Flood Insurance Study, San Bernardino County, California, August 5, 1985
54. Federal Emergency Management Agency, Federal Insurance Administration Flood Insurance
Study, Inyo County, California, September 4, 1985
55. James M. Montgomery Consulting Engineers, Inc., Las Vegas Valley Flood Insurance Study Hydrology Report, September 1991
56. U.S. Department of the Army, Corps of Engineers, Hydrologic Engineering Center, HEC-1
Flood Hydrography Package, Davis, California, 1988
57. U.S. Department of the Army, Corps of Engineers, Hydrologic Documentation for Feasibility Study, Las Vegas Wash and Tributaries, Clark County, Nevada, April 1988
58. Cooper Aerial of Nevada, Aerial Photographic Maps entitled “Las Vegas,” Scale 1:4,800,
April 1991
59. CH2M Hill, Inc., Topographic Maps entitled “Duck Creek Wash,” Scale 1:4,800 with contour interval 4 feet, October 15, 1992
60. Federal Emergency Management Agency, Risk Studies Division, FAN, September 1990
61. James M. Montgomery Consulting Engineers, Inc., plans entitled City of North Las Vegas
(Detained Conditions), Sheets 6, 14, 15, 23, July 29, 1988
62. James M. Montgomery Consulting Engineers, Inc., Topographic Maps entitled “Las Vegas Valley,” Scale 1:4,800, 1984

60
63. Federal Emergency Management Agency, Federal Insurance Administration, Draft Flood
Insurance Study, Clark County, Nevada, August 1986
64. WRC Engineering, Inc., Hydrologic Criteria and Drainage Design Manual for the Clark County Flood Control District. October 1990
65. Federal Highway Administration, HY8 Culvert Analysis Micro Computer Program,
May 1987
66. CH2M Hill, Nevada, Aerial Topography Maps, Tropicana Wash and Tributaries, prepared by CH2M Hill, Scale 1:4,800, contour interval 4 feet, Photo date May 30, 1992
67. Cooper Aerial of Nevada, Aerial Topography Maps, Las Vegas Valley-Flamingo Wash and
Red Rock Wash, prepared by Mr. James M. Montgomery Consulting Engineers, Inc., scale 1:4,800, contour interval 4 feet, Photo date September 14, 1984
68. Church Engineering of Nevada, Hydraulic Analysis of the MGM Grand Box Culvert, October
1991
69. James M. Montgomery, Las Vegas Valley Flood Insurance Study Hydrology Report, 1991
70. Ensign & Buckley Engineers, Clark County, City of Las Vegas, & City of North Las Vegas, Nevada, Limited of Map Maintenance Program, Technical Support Data Notebook, Volume 1 and 2 of 2, April 2, 1996
71. U.S Department of the Army, Corps of Engineers, HEC-1 Flood Hydrograph Package, User’s
Manual, September 1990
72. Clark County Regional Flood Control District, Hydrologic Criteria and Drainage Design Manual, October 1990
73. James M. Montgomery Engineers/Cooper Aerial of Nevada, Orthophoto Topographic Maps
entitled “City of Las Vegas Orthophoto Topographic Maps,” Scale 1:4,800, contour interval 4 feet, dated September 14, 1984
74. Clark County Topographic Maps entitled “Clark County Regional Planning Council
Topographic Map,” scale 1:2,400, contour interval 5 feet, dated November 1976 75. City of North Las Vegas, Orthophoto Topographic Maps entitled “Orthophoto Topographic
Maps,” scale 1:2,400, contour interval 2 feet, dated April 16, 1983 76. City of Las Vegas, Department of Public Works, Digitized Cross Sections, on computer disk,
file entitled “LVWASH.dxf,” dated July 14, 1993 77. City of Las Vegas, Department of Public Works, Maintenance Plan, entitled “92/93 Las
Vegas Wash Maintenance – Charleston Boulevard to Owens Avenue,” undated 78. Wallace Montgomery Consulting Engineers, Construction Drawings, entitled “Owens Avenue
Bridge and Channel Improvements, Volume II – Drawings,” dated 1977 79. City of Las Vegas, Department of Public Works, As-built Drawings, entitled “East Bonanza
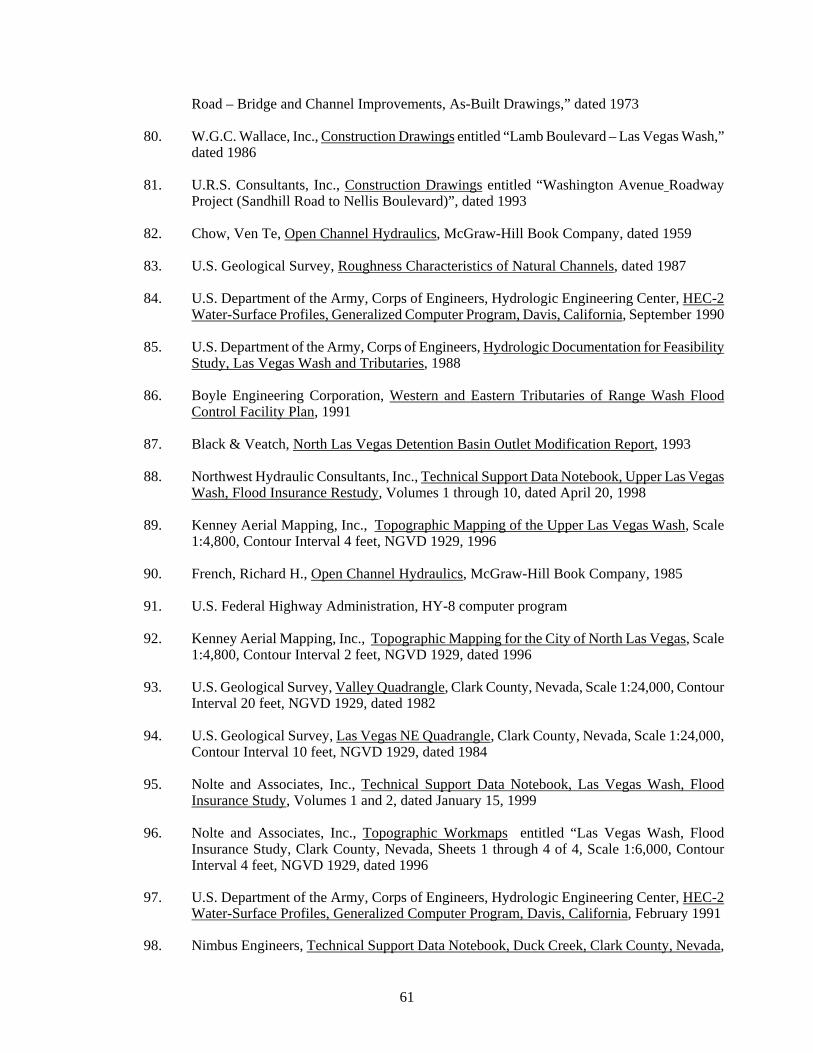
61
Road – Bridge and Channel Improvements, As-Built Drawings,” dated 1973
80. W.G.C. Wallace, Inc., Construction Drawings entitled “Lamb Boulevard – Las Vegas Wash,” dated 1986
81. U.R.S. Consultants, Inc., Construction Drawings entitled “Washington Avenue Roadway
Project (Sandhill Road to Nellis Boulevard)”, dated 1993 82. Chow, Ven Te, Open Channel Hydraulics, McGraw-Hill Book Company, dated 1959 83. U.S. Geological Survey, Roughness Characteristics of Natural Channels, dated 1987 84. U.S. Department of the Army, Corps of Engineers, Hydrologic Engineering Center, HEC-2
Water-Surface Profiles, Generalized Computer Program, Davis, California, September 1990 85. U.S. Department of the Army, Corps of Engineers, Hydrologic Documentation for Feasibility
Study, Las Vegas Wash and Tributaries, 1988 86. Boyle Engineering Corporation, Western and Eastern Tributaries of Range Wash Flood
Control Facility Plan, 1991
87. Black & Veatch, North Las Vegas Detention Basin Outlet Modification Report, 1993 88. Northwest Hydraulic Consultants, Inc., Technical Support Data Notebook, Upper Las Vegas
Wash, Flood Insurance Restudy, Volumes 1 through 10, dated April 20, 1998 89. Kenney Aerial Mapping, Inc., Topographic Mapping of the Upper Las Vegas Wash, Scale
1:4,800, Contour Interval 4 feet, NGVD 1929, 1996 90. French, Richard H., Open Channel Hydraulics, McGraw-Hill Book Company, 1985 91. U.S. Federal Highway Administration, HY-8 computer program 92. Kenney Aerial Mapping, Inc., Topographic Mapping for the City of North Las Vegas, Scale
1:4,800, Contour Interval 2 feet, NGVD 1929, dated 1996 93. U.S. Geological Survey, Valley Quadrangle, Clark County, Nevada, Scale 1:24,000, Contour
Interval 20 feet, NGVD 1929, dated 1982 94. U.S. Geological Survey, Las Vegas NE Quadrangle, Clark County, Nevada, Scale 1:24,000,
Contour Interval 10 feet, NGVD 1929, dated 1984 95. Nolte and Associates, Inc., Technical Support Data Notebook, Las Vegas Wash, Flood
Insurance Study, Volumes 1 and 2, dated January 15, 1999 96. Nolte and Associates, Inc., Topographic Workmaps entitled “Las Vegas Wash, Flood
Insurance Study, Clark County, Nevada, Sheets 1 through 4 of 4, Scale 1:6,000, Contour Interval 4 feet, NGVD 1929, dated 1996
97. U.S. Department of the Army, Corps of Engineers, Hydrologic Engineering Center, HEC-2
Water-Surface Profiles, Generalized Computer Program, Davis, California, February 1991
98. Nimbus Engineers, Technical Support Data Notebook, Duck Creek, Clark County, Nevada,

62
Volumes 1 through 4 of 4, dated July 1997 99. Kenney Aerial Mapping, Inc., Topographic Maps entitled “Duck Creek Hydraulic Workmap,
Sheet 1 through 7 of 7, Scale 1:4,800, Contour Interval 2 feet, dated June 1997 and revised May 1998
100. ALCA, Construction Plans entitled “Robindale Terrace,” dated 1990
Chow, V.T., Editor, Handbook of Applied Hydrology, A Compendium of Water-Resources Technology, 1964 Clark County Regional Flood Control District, Hydrologic Criteria and Drainage Design Manual, August 1999 Dames & Moore, Draft Environmental Impact Statement, Flood Control Master Plan for the Clark County Regional Flood Control District, Volume I, Environmental Setting and Impacts Analysis, October 1990 Federal Emergency Management Agency, Flood Insurance Study for Clark County, Nevada, September 1988 Federal Emergency Management Agency, Flood Insurance Study for Clark County, Nevada, and Incorporated Areas, September 27, 2002 G.C. Wallace Consulting Engineers, Inc., As-Built Plans entitled “Sunset Road Bridge and Channel,” dated 1983 Horizons Inc., Virgin River Post-Flood LiDAR, prepared for the Bureau of Reclamations, Lower Colorado Office, September 2005 James M. Montgomery Consulting Engineers, Inc., The Master Plan Update of the Las Vegas Valley for the Clark County Flood Control District, Volume II, August 1991 James M. Montgomery Consulting Engineers, Inc., Las Vegas Wash and Tributaries Overflow Study, Clark County, Nevada, September 1988 Michael Baker Jr., Inc. Duck Creek Hydrologic Unit Technical Data Appendix, Volume I, August 1992 Michael Baker Jr., Inc, Virgin River Bulletin 17B Annual Peak Flow Analysis, March 16, 2005 PBS&J, Orthophoto Topographic Maps entitled “Virgin River Physical Map Revision, Figure 4.2 – 100-Year Corrected Effective Work Map, Scale 1inch=800feet, contour interval 2 feet, dated September 2006 PBS&J, Orthophoto Topographic Maps entitled “Virgin River Physical Map Revision, Figure 4.8 – 500-Year Corrected Effective Work Map, Scale 1inch=800feet, contour interval 2 feet, dated September 2006 PBS&J, Response to Comments Virgin River Physical Map Revision, September 2006 PBS&J, Virgin River, Request for Letter of Map Revision, May 2006 Sharp, Milton L. Construction Plans entitled “Sunset Cliffs Apartments, Bridge at Duck Creek

63
Channel,” dated 1989 Southwest Engineering, Construction Plans entitled “Frontier Rancho Estates Unit No. 3,” dated 1987 State of Nevada Department of Transportation Construction Plans entitled “Clark County from FAI-015 at Riverside-Bunkerville Interchange Northeasterly to FAS Route 144 at Mesquite, September 28, 1983 State of Nevada Department of Transportation, Plan and Profile for Proposed Highway, entitled “Upper Virgin River Bridge”, April 15, 1931 U.S. Department of the Army, Corps of Engineers, Hydrologic Documentation for Feasibility Study, Las Vegas Wash and Tributaries, April 1988 U.S. Department of the Army, Corps of Engineers, Hydrologic Engineering Center, HEC-RAS Version 3.1.3, Davis, California, May 2005 U.S. Department of the Interior, Geological Survey, Water-Supply Paper 1849, Roughness Characteristics of Natural Channel, H.H. Barnes, Jr., 1977 U.S. Department of the Interior, Geological Survey, Water Resources Data for Nevada, 1965-1976 U.S. Department of Agriculture, Soil Conservation Service, National Engineering Handbook, Section 4, Hydrology, Victor Mockus, 1969 U.S. Department of Agriculture Soil Conservation Service in Cooperation with U.S. Department of the Interior Bureau of Land Management, University of Nevada Agricultural Experiment Station and University of Arizona Agricultural Experimental Station, Soil Survey of Las Vegas Valley Area, Part of Clark County, Nevada, July 1985 U.S. Geological Survey, Estimated Manning’s Roughness Coefficients for Stream Channels and Floodplains in Maricopa County, Arizona, April 1991 Wallace Montgomery Consulting Engineers, Construction Drawings, entitled “Stewart Avenue Bridge and Channel Improvements, Volume II – Drawings,” dated 1973 Wallace Montgomery Consulting Engineers, Construction Drawings, entitled “East Charleston Boulevard - Bridges and Channel Improvements, Volume II – Drawings,” dated 1971

64
10.0 REVISION DESCRIPTIONS
This section has been added to provide information regarding significant revisions made since the original FIS was printed. Future revisions may be made that do not result in the republishing of the FIS report. To assure that any user is aware of all revisions, it is advisable to contact the community repositories. 10.1 First Revision Countywide Update
This revision has combined the FIRMs and FIS reports for the county and incorporated cities into the countywide format.
Under the countywide format, FIRM panels have been produced using a single layout format for the entire area within the county instead of separate layout formats for each community. The single layout format facilitates the matching of adjacent panels and depicts the flood hazard area within the entire panel border, even in areas beyond a community corporate boundary line. In addition, under the countywide format, this single FIS report provides all FIS information and data for the entire county area. The mapping for the countywide conversion has been prepared using digital data. Previously published FIRM data produced manually have been converted to vector digital data by a digitizing process. These vector data were fit to raster digital images of the USGS quadrangle maps of the county area to provide horizontal positioning. Road and highway names and centerline data have been obtained from the Clark County Geographical Information System (GIS) Management Office. The Clark County GIS data were positioned using the USGS quadrangle maps with the relative centerline configuration and names maintained for the City of Las Vegas. For county areas outside of Las Vegas the centerlines were modified to the positional accuracy of the USGS quadrangle maps and the roads, highways and street names were taken from the FIRM panels. The adjusted centerline data were then computer plotted with the digitized floodplain data to produce the countywide FIRM. This study was revised on August 16, 1995, to include the restudy of hydrologic and hydraulic conditions on Tropicana Wash and Tributaries; Blue Diamond Alluvial Fan and an unnamed alluvial fan just west of Blue Diamond Alluvial Fan; North Branch Blue Diamond Wash and Middle Branch Blue Diamond Wash; Duck Creek; Duck Creek South Channel; and Duck Creek Tributary. Duck Creek, North Branch Blue Diamond Wash, Middle Branch Blue Diamond Wash, Blue Diamond Alluvial Fan, and an Unnamed Alluvial Fan just West of Blue Diamond Alluvial Fan Authority and Acknowledgments: The hydrologic analyses for Duck Creek were preformed by James M. Montgomery Consulting Engineers, Inc. (JMM) and were included in the report entitled “Las Vegas Valley Flood Insurance Study Hydrology Report,” September 1991 (Reference 55). Flood-frequency curves were developed by Michael Baker Jr. (MBJ) at the apexes of Blue Diamond Alluvial Fan and the unnamed alluvial fan and for North Branch Blue Diamond Wash and Middle Branch Blue Diamond Wash at the Union Pacific Railroad (UPRR). The hydraulic analyses for all flooding sources were performed by MBJ.
Coordination:

65
An initial meeting was held on February 25, 1992, to review the scope of work and the streams to be studied. Representatives from Clark County Public Works (CCPW), Clark County Regional Flood Control District (CCRFCD), MBJ, and FEMA attended the meeting. A second meeting was held on December 2, 1992, to review the results of the study. Representative from CCPW, CCRFCD, MBJ and FEMA attended the meeting. All comments from the community have been incorporated into this study. Scope: This study covers Duck Creek from Robindale Road to Interstate 15, Duck Creek South Channel, Duck Creek Tributary from its confluence with Duck Creek to Interstate 15, North Branch Blue Diamond Wash from its confluence with Duck Creek to the UPRR, Middle Branch Blue Diamond Wash from its confluence with Duck Creek to the UPRR, Blue Diamond Alluvial Fan from its apex to the UPRR, and the unnamed alluvial fan from its apex to Flamingo Wash. The areas studied by detailed methods were selected with priority given to all known flood hazards and areas of projected development or proposed construction through May 1993. Hydrologic Analysis: For Duck Creek and Duck Creek Tributary, peak discharge values for the 100-year flood were obtained from the report entitled “Las Vegas Valley Flood Insurance Study Hydrology Report,” dated September 1991 (Reference 55). Peak discharges were determined in this study by use of the COE HEC-1 hydrologic model (Reference 56). The flood frequency curves developed at the apexes of the alluvial fans are log-normal. Standard deviations for the curves were found using 100-year discharge values listed in the Technical Appendix to JMM’s report entitled “Las Vegas Valley Flood Insurance Study Hydrology Report,” dated September 1991 (Reference 55). Two-year discharge values were determined using COE regional relationships presented in its report entitled “Hydrologic Documentation for Feasibility Study, Las Vegas Wash and Tributaries, Clark County, Nevada,” dated April 1988 (Reference 57). The flood frequency curves for North Branch Blue Diamond Wash and Middle Branch Blue Diamond Wash at the UPRR were defined by the identification of two points for each wash through which flow would pass to enter the respective culverts. The frequency at which a given discharge is exceeded between those points is a function of the frequency at which it is exceeded at the apex of the Blue Diamond alluvial fan, the width of the opening between the two points, and the width of the area subject to alluvial flooding at the elevation of the two points. Flow values with recurrence intervals of 10, 20, 30, 40, 50, 60, 70, 80, 90, 100, 200, and 500 years were computed. The flood frequency curves at the UPRR were defined by fitting a log-Pearson Type III distribution to those pairs of flow values and recurrence intervals. Hydraulic Analysis: Cross-sectional information for Duck Creek and Duck Creek Tributary, North Branch Blue Diamond Wash and Middle Branch Blue Diamond Wash were obtained from the HEC-2 computer analyses prepared by JMM in 1986 for the draft FIS for the unincorporated areas of Clark County, Nevada, dated August 1986 (Reference 63). Additional information used to update and/or revise these data was obtained from Conditional Letter of Map Revision (CLOMR) and Letter of Map Revision (LOMR) data listed below; recent aerial photographic maps entitled “Las Vegas,” dated April 1991 (Reference 58); plans and mapping obtained from the CCPW; recent topographic maps entitled “Duck

66
Creek Wash,” dated October 15, 1992 (Reference 59); and field investigations conducted in February 1992.
List of CLOMRs and LOMRs
Stream Property Request Type Date Issued
Duck Creek Symphony Encore LOMR 10/04/91
Duck Creek Paradise Estates CLOMR Dropped
Duck Creek Robindale Terrace LOMR 06/05/91
Duck Creek Crystal Springs-Unit 5-6 LOMR 10/26/89 Duck Creek Crystal Springs-Unit 6-7 LOMR 07/17/89 Duck Creek Crystal Springs-Unit 8-9 LOMR 10/16/90 Duck Creek Crystal Springs-unit 11-12 LOMR 06/23/92 Duck Creek Windmill Village CLOMR 11/24/92
List of CLOMRs and LOMRs (Cont’d)
Stream Property Request Type Date Issued Middle Branch Buckingham Estates-Unit 1 LOMR 08/01/90 Blue Diamond Wash Middle Branch Carousel Park LOMR 04/01/91 Blue Diamond Wash
North Branch Buckingham Estates-Unit 2 CLOMR 03/12/91 Blue Diamond Wash The COE HEC-2 hydraulic model (Reference 22) was used to determine the 100-year flood elevations for Duck Creek, Duck Creek Tributary, North Branch Blue Diamond Wash, and Middle Branch Blue Diamond Wash. The starting water-surface elevations for Duck Creek and North Branch Blue Diamond Wash were based on the slope-area method. The starting water-surface elevation for Middle Branch Blue Diamond Wash was based on critical depth at the downstream end of the culvert under Bermuda Road. Channel roughness factors (Manning’s “n”) used in the hydraulic computations were chosen by engineering judgment and based on field observations of the streams and floodplain areas. The channel roughness varies from 0.025 to 0.044 and the overbank roughness varies from 0.025 to 0.060. These values are included in Table 4. The hydraulic analyses included divided flow analyses on the reach of Duck Creek between Pebble Road and its confluence with Duck Creek Tributary. These analyses involved balancing the quantity of flow in Duck Creek and the divided flow reach (Duck Creek-South Channel) so that water-surface elevations and energy grades were balanced at the upstream cross sections of the reach.

67
The hydraulic analysis for North Branch Blue Diamond Wash included a HEC-2 computer model for the 100-year flood and floodway from Amigo Street upstream to Interstate 15. For areas downstream from Amigo Street, HEC-2 computations were utilized to determine channel capacities. For flows exiting the channel, shallow flooding methods and available topographic mapping were utilized to determine areas subject to shallow flooding. Computations in this area were based on development plans for Buckingham Estates, Units Nos. 1 and 2. The channel area from Amigo Street to Duck Creek was designated Zone A because final channel banks and linings have not been completed. The hydraulic analysis for Middle Branch Blue Diamond Wash included a HEC-2 computer model that used the split flow option to calculate the amount of flow that leaves the main channel at Gilespie Street. The ground to the north of the wash is lower than the water-surface elevation, resulting in a flow split toward the north. At Gilespie Street, approximately 80 cfs overflows the main channel to the north. The 80 cfs that escapes at Gilespie Street continues to flow south of and parallel to Windmill Lane. The resulting flooding is less than 1 foot in average depth. The flow combines with the flow in the main channel east of Bermuda Road and flows into Windmill Lane and Windmill Channel to the confluence with Duck Creek. Floodways for the split flow areas on Duck Creek and Duck Creek Tributary at Las Vegas Boulevard and Interstate 15, and the area downstream of the split flow at Gilespie Street, were analyzed assuming that the flow splits would be confined in the main wash for the floodway run. The encroached 100-year flood elevations (with no flow splits allowed) were compared to the unencroached 100-year flood elevations (with the split flows allowed) to make certain that the 1-foot surcharge was not exceeded. The areas subject to alluvial fan flooding were delineated based on the information shown on topographic maps, (Reference 62) site investigation, and recent aerial photographs. The recent aerial photographs are shown on maps entitled “Las Vegas,” dated April 1991 (Reference 58). FEMA’s FAN program (Reference 60) was used to compute the contour widths corresponding to flood insurance zone boundaries. For Blue Diamond Alluvial Fan, two boundaries were determined for the northern side of the fan between elevations 2,352 and 2,644 feet NGVD. It was determined that flood flow not exceeding 1.5 feet in energy would be confined to south of the southern most of these boundaries. In the multiple channel region of the fan the flow corresponding to 1.5 feet in energy is 6,954 cfs. Therefore, for flows less than 6,954 cfs, contour widths were measured using the southernmost of the two northern boundaries; for flows greater than 6,954 cfs, contour widths were measured using the northernmost boundary. For North Branch Blue Diamond Wash, between the UPRR and Interstate 15, the analysis showed that at a point approximately 1,400 feet downstream of the UPRR, the capacity of the wash is approximately 2,000 cfs. At Decatur Boulevard it was found that approximately 50 percent of the flow in the wash at the road crossing (1,000 cfs) would continue east, not following the wash. The remaining 50 percent of the flood flow (1,000 cfs) was modeled as if it followed the wash down to a point approximately 4,000 feet downstream of Decatur Boulevard. Those percentages were estimated from the cross-sectional areas to the left and right of the crossing of Decatur Boulevard when it is flowing full. The alluvial fan flooding for North Branch Blue Diamond Wash was modeled the following way. Below elevation 2,384 feet, only that part of the flow exceeding 2,000 cfs was modeled as alluvial fan flooding originating at the breakout point on the right bank. Flows of less than 2,000 cfs were modeled as though they proceeded downstream to Decatur Boulevard. Below Decatur Boulevard, only 50 percent of the flow was modeled as alluvial fan flooding. The remaining 50 percent (of flows less than 2,000 cfs) was modeled though it proceeded downstream to a point approximately 4,000 feet

68
downstream of Decatur Boulevard. At that point the wash vanishes. The remaining flow was modeled as alluvial fan flooding. For Middle Branch Blue Diamond Wash, between the UPRR and Interstate 15, all flows were modeled as alluvial fan flooding. Areas subject to alluvial fan flooding where the 100-year flood depth is, on average, less than 1.0 foot are labeled Zone X (shaded). When realized, the hazards associated with alluvial fan flooding are just as severe in areas designated Zone X (shaded) as those designated Zone AO. The distinction between the zones should be regarded as a distinction between flooding potentials and not a distinction between the severity of damages to be expected in the event of a flood. The flood-frequency relationships defined at the North and Middle Branch Blue Diamond Wash culverts under UPRR depend, in part, on the likelihood that a flood passing through the apex of the Blue Diamond Alluvial Fan follows a path to the culvert. Thus, although a flood passing through one of the culverts will be approximately the same magnitude at both the apex and the culvert, the frequency at which that magnitude flood is expected at the culvert is much less than that at the apex. Therefore, for floodplain management purposes, it should be noted that any flow realized at the apex of the Blue Diamond Alluvial Fan may follow a path to and, thus, be realized at one of the UPRR culverts. Colorado River Floodway This update also includes the addition of flood hazard data produced as a result of the Colorado Floodway Protection Act passed by Congress in 1986. The act was passed to establish a floodway along the Colorado River from Davis Dam to the U.S.-Mexican border. The hydrologic and hydraulic analyses were prepared by the USBR. The hydrologic analysis was performed to determine the 100-year peak discharges at all points along the Colorado River for the study reach. Runoff from above Hoover Dam is typically the dominant contributing factor of flood flows, although combinations of releases from Davis and Parker Dams with flash floods originating from the watersheds contributing flows into the Colorado River, are significant in determining the peak 100-year discharges. A peak discharge of 40,000 cfs was determined to flow along the Colorado River from Davis Dam to the Clark County line. Further details regarding the methods used to produce the peak discharges along the Colorado River are outlined in the report entitled “Flood Frequency Determinations for the Lower Colorado River,” Volume I, Supporting Hydrologic Documents of the Colorado River Floodway Protection Act of 1986, dated March 1989, prepared by the USBR. The base (100-year) flood elevations (BFEs) along the Colorado River were determined by using the HEC-2 hydraulic computer model. The hydraulic analysis was based only on effective flow areas. A floodway was determined by setting the floodway boundaries at the limits of the effective flow model. The base flood elevations shown on the FIRM are both the 100-year natural and floodway elevations. The floodway fringe area (100-year floodplain) was determined using the computed water-surface elevations and topographic mapping. BFEs for the Colorado River are provided on the FIRM. Tropicana Wash and Tributaries The reach of Tropicana Wash located in the unincorporated areas of Clark County, Nevada, from its confluence with Flamingo Wash extending westward to near the base of Spring Mountains was revised based on data submitted by CCRFCD.

69
The flooding sources studied by detailed methods were selected by the CCRFCD and CCPW with priority given to known flood hazard areas and developed areas or areas of proposed construction. The detailed study areas encompass the following: The Central Branch of Tropicana Wash from its confluence with Flamingo Wash to
approximately 2,000 feet west of the UPRR. The North and Central Branches of the wash combine at this point. (Approximate Rivermiles 0.0 to 3.7).
The North Branch of Tropicana Wash from approximately 2,000 feet west of the UPRR to the
Rainbow Boulevard crossing. (Approximate Rivermiles 0.0 to 2.6 on the North Branch).
The Central Branch of Tropicana Wash from approximately 2,000 feet west of the UPRR to the Rainbow Boulevard crossing. (Approximate Rivermiles 3.7 to 7.0).
The South Branch of Tropicana Wash from its confluence with the Central Branch near
Decatur Boulevard to the West Sunset Road crossing. (Approximate Rivermiles 0.0 to 1.9 on the South Branch).
The approximate study reaches were outlined by the CFRFCD in consultation with CCPW. In general, the reaches extend upstream from the limits of the detailed study reaches to a point where the contributing flow is less than 300 cfs. For the purposes of this study, future street and local drainage systems are assumed to convey flows less than 300 cfs. Tributaries of the Tropicana Wash not studied include the unnamed wash and the Airport Channel. The topographic mapping and hydraulic analyses for this study were performed by CH2M Hill for the CCRFCD. Ground control and check surveys were performed by Wesco Surveys, Inc. The work was completed in November 1992. On June 10, 1992, representatives of the CCRFCD, CCPW, and CH2M Hill met for the initial coordination meeting to discuss scheduling, study methods, assumptions, and the format of the deliverable items. Throughout the project, coordination meetings were held to discuss progress and preliminary study results. In general, hydrologic data for the study reaches examined by detailed methods were derived from the “Las Vegas Valley Flood Insurance Study Hydrology Report, 1991” (FIS Hydrology Report) (Reference 55). This report provides 100-year recurrence interval flow rate estimates for floodplain delineation studies in Clark County, Nevada. The report was previously adopted by the CCRFCD. The data is based on HEC-1 computer models prepared for the various watersheds including Tropicana Wash. Where additional hydrologic data at intermediate concentration points were required in the detailed methods study, the adopted HEC-1 model was modified according to procedures in the CCRFCD’s “Hydrologic Criteria and Drainage Design Manual” (Reference 64). The associated flow rates are given in Table 3. For areas studied by detailed methods, water-surface elevations for the 100-year flood were computed using the COE HEC-2 Water Surface Profile computer program (Reference 22). Where otherwise unknown, the starting water-surface elevations were developed using the slope-area method in the program. The Federal Highway Administration’s computer program HY8 (Reference 65) was used to model water-surface elevations and capacities at some of the culvert crossings. Undersized crossings

70
included weir flow calculations over the roadways. The cross-section data for each of the streams were derived from aerial mapping. The mapping was prepared specifically for this project and based on aerial photography dated June 1992 (Reference 66). The cross-section data were digitized directly from the stereographic aerial models. Ground control surveys, check profiles, and establishment of elevation reference marks were completed by Wesco Surveys. Vertical control is based on the National Geodetic Vertical Datum (NGVD 1929) and horizontal control is tied into the Nevada State Plane Coordinate System (NAD 1983). Clark County survey monuments were used for control whenever possible. The topographic mapping used for most of the areas studied by approximate methods were prepared by an earlier study (Reference 67). Dimensions of hydraulic structures were obtained by field surveys. Roughness coefficients (Manning’s “n”) used in the hydraulic analyses were selected based on field inspection of the entire stream reaches and engineering judgment. For Tropicana Wash Central Branch, roughness values range from 0.015 to 0.095 for the channel and from 0.002 to 0.125 for the overbank areas. For Tropicana Wash North Branch, roughness values range from 0.027 to 0.053 for the channel and from 0.025 to 0.085 for the overbank areas. For Tropicana Wash South Branch, roughness values range from 0.032 to 0.038 for the channel and from 0.043 to 0.060 for the overbank areas. These values are summarized in Table 4. Headwater conditions at the Interstate 15/MGM culvert were previously modeled for the 100-year discharge (Reference 68). Since the original study, the potential headwater elevation has been raised by the addition of Jersey barriers. New headwater condiditons were estimated with the Federal Highway Administration computer model HY8. The model was initially calibrated to the previous study and then the allowable headwater condidtions were raised as appropriate. The resulting headwater elevation was used as the starting water-surface elevation for the backwater model. The new culvert flows were subtracted from the flowrate at the head of the culvert to obtain the breakout flows at Interstate 15. The 9.75 foot diameter CMP culvert and a 2-barrel, 36-inch CMP structure at the UPRR crossing, the RCBC culvert at Paradise Road, and the three 10-foot by 6-foot box culverts at Arville Street were also modeled with HY8 and the results inserted into the HEC-2 model using the X5 record option. The hydraulic analysis for the approximate methods were performed by normal depth calculations. The cross sections were constructed from topographic maps (Reference 67) and field reconnaissance. The breakout flow characteristics at Cameron Street, the UPRR, and the Interstate 15/MGM culvert were modeled by approximate methods. Results of the modeling indicate that flow breaks out of the main Tropicana channel in two general areas; namely, at the UPRR culvert and the Interstate 15/MGM culvert. In addition, a flow split occurs at the Arville Street and Cameron Street culverts. At Cameron Street, the wash branches into two channels with one turning approximately 600 feet to the north and the other flowing east to the UPRR grade. The 66-inch RCP culvert under Cameron Street begins upstream of the flow split and outlets into the northern branch. Flow through the culvert was estimated from the hydraulic grade line given in the construction drawings. Flow in excess of the culvert capacity bypassed the culvert, broke over Cameron Street, and split into the two branches previously described. The flow in each branch was estimated by balancing the water-surface elevations in the channels downstream of the flow split. The breakout flows were assumed to rejoin at the UPRR culvert crossing.

71
At the Arville Street crossing of the central branch of Tropicana Wash, a new 3-cell 10-foot by 6-foot RCBC culvert structure was designed and constructed by the CCPW. The culvert as designed does not contain 100-year discharge. A portion of the flow that exceeds the capacity will flow northerly within the Arville right-of-way and then northeasterly as shallow sheetflow to the UPRR railroad bed. The HEC-2 special culvert routine was used in conjuction with a split flow analysis. The floodplain area from the flow which is conveyed in Arville Street was estimated by approximate methods based on topographic information and field evaluations. The culverts at the UPRR were also modeled using HY8 to determine breakout flows at the railroad. The culvert capacity was subtracted from the runoff estimates upstream of the railroad to estimate the breakout discharge to the north. These flows follow north along the railroad grade for several hundred feet and then outlet into Tropicana Avenue. The runoff then flows generally within the Tropicana Avenue right-of-way to Industrial Road. At Industrial Road, the flow splits into two patterns: one flowing north and the other continuing south. Flows to the North follow Industrial Road, eventually crossing the Interstate 15 right-of-way between the Tropicana Avenue and Flamingo Road overpasses. The south branch rejoins Tropicana Wash flows just upstream of the Interstate 15/MGM culvert. Breakout flow at the Interstate 15/MGM culvert generally travels north into the depressed median of Interstate 15. Approximately 100 cfs crosses Interstate 15 and enters ditches in the surrounding areas and is conveyed in the local storm drain system. The balance of the flow travels north in the Interstate 15 right-of-way and joins the breakout flows from Industrial Road. Some runoff continues north in the median, eventually entering the Flamino Wash; however, most of the flows crosses Interstate 15, becomes sheetflow through the city streets and adjacent parking lots in a northeasterly direction, and eventually drains into Flamingo Wash. Floodplain boundaries for the detailed studies were delineated on topographic maps with a scale of 1”=400’ and a contour interval of 4 feet (Reference 66). Supplemental 2-foot contours were plotted in areas requiring greater definition. The boundaries of the 100-year flood were delineated using the elevations computed at each cross section by the HEC-2 models. The delineations were interpolated between cross sections using engineering judgment in conjunction with the topographic map features and known field conditions. The 500-year flood elevations were not determined by this study. The 100-year floodplain boundaries for approximate studies on areas west of Rainbow Boulevard and south of Sunset Road were delineated on topographic maps (Reference 67) prepared for the 1984 FIS. Approximate study boundaries east of Rainbow Boulevard and north of Sunset Road are shown on the 1992 mapping prepared for this study. Existing stream sections affected substantially by backwater conditions include the channel just upstream of the Interstate 15/MGM culvert and the channel just upstream of the UPRR. At both of these locations, limited capacities of the structures cause breakout flows and flooding. For this study, floodways were initially computed using the Method 4 encroachment option in the HEC-2 computer program. This option equally reduces the conveyance on each side of the cross section, thus raising the water-surface elevations, but maintaining it within the specified target value. These initial encroachments were then refined by plotting the floodplains on the mapping, using engineering judgement to adjust the floodplains as appropriate, and verifying the resulting floodplains with the Method 1 encroachment option in HEC-2. With this method, the encroachment stations are input into the model and the results reviewed, to ensure the floodplain water-surface elevation has not been raised more than the specified target value. The resulting floodways are shown on the FIRM.

72
Floodways were not determined on Tropicana Wash where it flows through the Interstate 15/MGM culvert (Interstate 15 to Koval Lane) and through the box culvert between Paradise Road and Swenson Street. Floodways were delineated for these reaches representing the approximate interior conveyance areas of the culvert structures. In addition, at the request of the CCRFCD, a floodway was not computed for the reach of Tropicana Wash Central Branch from upstream of the confluence with Tropicana Wash South Branch. Best Available Data Letter The following information, contained in a Best available Data Letter Dated January 30, 1989, for the City of North Las Vegas, is included in this revision. The Las Vegas Wash Detention Basin is a major flow-reduction facility. It is located several miles north of the UPRR on the main branch of Las Vegas Wash. It has a capacity of 2,430 acre-feet and controls an 880-square-mile watershed. It reduces flows at the UPRR by approximately 50 percent. A TR-20 computer model was prepared by JMM to show the effects of Las Vegas Wash Detention Basin. The reduced flows for Las Vegas Wash and the Union Pacific Overflow were used in the revised HEC-2 hydraulic computer models between Lake Mead Boulevard and Lone Mountain Road and for the UPRR overflow, prepared by JMM. For both streams, the 100- and 500-year floodplain boundaries have been delineated using the BFEs determined at each cross section. Between cross sections, the boundaries were interpolated using topographic maps at a scale of 1:2,400 with a contour interval of 2 feet (Reference 61). The floodways for Las Vegas Wash and Union Pacific Overflow have been revised to reflect the new hydrologic and hydraulic analyses. The revised floodway boundary delineations are reflected on the FIRM for Las Vegas Wash from Las Vegas Boulevard to Lone Mountain Road, and for the overflow reach along the railroad. Table 5, “Floodway Data Table,” also incorporates the revised data. Letter of Map Change (LOMCs) This revision also incorporates the determinations of LOMCs (LOMRs and Letters of Map Amendment) issued by FEMA for the projects listed by community in Table 7, “Letters of Map Change.” These changes are reflected in the Summary of Discharges and Floodway Data Tables and on the Flood Profiles. An Appeal Resolution Letter was issued on February 3, 1995, for the unincorporated areas of Clark County. The resolution of the appeal revised the zone designations of two unnamed tributaries to North Branch Tropicana Wash (NBTW) from Zone A to Zone X (shaded), to reflect areas of 100-year flooding with average depths of less than 1 foot. These modifications are shown on FIRM Panels 2535 D, 2545 D, and 2553 D. In addition, the BFEs, floodway boundaries, and floodplain boundaries were revised along NBTW to reflect a new culvert and channelization of the stream through Castle Vista Estates. The modifications are shown on FIRM Panel 2553 D and Flood Profile Panel 41P and in the Floodway Data Table.

73
TABLE 7 – LETTERS OF MAP CHANGE
PROJECT STREAM DATE
CITY OF BOULDER CITY Hemenway Wash Channelization Hemenway Wash April 19, 1994 Georgia Avenue Wash Georgia Avenue Wash April 20, 1992 CITY OF HENDERSON Lake Mead South – Phase II Box Culvert Unnamed Wash May 2, 2002Traverse Point Apartments Unnamed Tributary to
Pittman WashApril 5, 2002
Stephanie/Arroyo Grande Units 4 and 5 Unnamed Wash February 20, 2002Roma Hills Subdivision Unnamed Wash January 18, 2002Pebble Market Place Unnamed Tributary to
Pittman WashJanuary 18, 2002
Eagleview Phase I Unnamed Wash August 14, 2001Equestrian Detention Basin Unnamed Wash July 18, 2001Montenegro Estates Unit 2 Unnamed Wash June 20, 2001Foothills Highlands Unit 2 and Foothills
Planning Area 4 Unnamed Wash May 31, 2001
Stephanie Carriage Homes (Formerly Heartland IV)
Unnamed Wash February 27, 2001
Black Mountain Vista - Parcels A, B and C Unnamed Wash January 24, 2001Lake Mead South - Phase II, Lot 1 Unnamed Wash January 24, 2001Champion Village - Gibson Channel Unnamed Wash December 20, 2000Stephanie Carriage Homes (Formerly Heartland
IV) Unnamed Wash November 28, 2000
Sun City at McDonald Ranch - Units 4 through 8
Unnamed Tributary to Tropicana Wash - North Branch
October 3, 2000
Foothills at McDonald Ranch Planning Areas 1 and 3 and Highlands Unit 1
Unnamed Wash August 29, 2000
Foothills Ranch - Phase 3 Unnamed Wash August 7, 2000 Duck Creek and Las Vegas Restudy from Lake
Las Vegas to Charleston BoulevardDuck Creek and Las Vegas
WashMarch 21, 2000
Pittman Wash Restudy Pittman Wash and Unnamed Washes
March 21, 2000
Seven Hills Parcel A Unnamed Wash February 24, 2000Green Valley Ranch Phase 4 Unnamed Wash December 28, 1999Champion Homes Gibson Channel Gibson Channel July 23, 1999

74
TABLE 7 – LETTERS OF MAP CHANGE (Cont’d)
PROJECT STREAM DATE
CITY OF HENDERSON (Cont’d)
Southfork Eastern Channel Gibson Channel December 28, 1999Ridgeview Village Unnamed Tributary to
Pittman WashJuly 23, 1999
Ash Creek Units 3 and 4 Unnamed Tributary to Duck Creek
May 25, 1999
Foothills Ranch South, Lots 2,3,4 and 15 through 21
Unnamed Wash May 18, 1999
Green Valley Ranch – Parcels 33, 37, 38 and 40 Unnamed Tributary to Pittman Wash
May 12, 1999
Stephanie/Horizon Apartments Unnamed Tributary to Pittman Wash
November 2, 1998
Trail Side Point Pittman Wash May 20, 1998Lake Las Vegas – Parcels 18, 19, 21, 22 and 32 Unnamed Tributary to The
Lake Las VegasJanuary 28, 1998
Lake Las Vegas Parcel 23 – Barritz Unnamed Tributary to The Lake Las Vegas
January 28, 1998
Candle Creek Unit 1, Block 3, Lots 82 through 86; Unit 3, Block 1, Lots 11 through 14; Units 5A, Lots 1,2 and 3; Unit 6A, Block 7, Lots 1 through 5
Whitney Ranch Channel January 16, 1998
South Green Valley Ranch Channel
Unnamed Wash December 23, 1997
Del Webb Communities Inc. at McDonald Ranch Golf Course Channel
Unnamed Wash December 23, 1997
Lake Las Vegas Southshore Parcel 26 –Monaco
Unnamed Tributary to The Lake Las Vegas
November 26, 1997
Foxfield Estates, Units 1, 2,and 3 Unnamed Wash August 19, 1997South Valley Ranch Unnamed Wash June 23, 1997Newport Townhomes, Block 9, Lots 1 through
6 and Lots 19 through 24; Block 10; Lots 1 through 6 and Lots 19 through 24
Unnamed Wash April 11, 1997
Upper Green Valley Ranch Channel - Parcels 31, 36A and 36B
Unnamed Wash March 14, 1997
Coral Ridge Subdivision Sandwedge Channel February 28, 1997Green Valley Ranch Parcels 40 and 41B Unnamed Wash January 17, 1997Pacific Legends Unnamed Wash December 18, 1996Ocotillo Pointe I, Block 2 Lots 12 through 18;
Ocotillo Pointe II, Block 2 Lots 21 through 35; Block 3, Lots 14 through 17
Pittman Wash November 20, 1996
Tapetio/Falcon Homes - Pecos Townhomes Pittman Wash and Unnamed Tributary to Pittman Wash
November 15, 1996
Augusta Unit 3 Pittman Wash October 31, 1996
Newport Townhomes, Block 1, Lots 1 through 4; Block 2; Lots 1 through 4; Block 7, Lots 1 through 8; Block 8, Lots 1 through 8; and the Clubhouse Area
Unnamed Wash September 23, 1996
Canyon Country Units III and IV C-1 Channel September 6, 1996

75
TABLE 7 – LETTERS OF MAP CHANGE (Cont’d)
PROJECT STREAM DATE
CITY OF HENDERSON (Cont’d)
Lakeside Highlands Unit 4, Block 20, Lots 1 through 13; Block 16, Lots 3 and 27 and Block 19; Lots 2 through 8
Unnamed Wash June 7, 1996
Calico Terrace Unit 3 Unnamed Tributary to Las Vegas Wash
June 7, 1996
Green Valley Ranch South Channel Unnamed Wash May 28, 1996
Augusta Unit 4 Pittman Wash May 13, 1996
Green Valley Pecos Subdivision Unnamed Tributary to Duck Creek
October 17, 1995
Mission Hills Detention Basin Mission Hills Detention Basin October 6, 1995Green Valley Ranch Unnamed Tributary to
Pittman WashOctober 4, 1995
Legacy Estates Subdivision Wash A, Wash B and Wash C October 3, 1995Green Valley Ranch Unnamed Wash September 8, 1995Tapetio/Falcon Homes - Pecos Townhomes Unnamed Tributary to
Pittman WashSeptember 6, 1995
Westwood Village Pittman Wash October 19, 1994 Wash A Channelization Project Wash A July 14, 1994 Lakeside Highlands Zone A June 24, 1994 Parcel K, Golf Village South Unnamed Tributary to Pittman Wash May 3, 1994 Pebble Creek Subdivision Unnamed Tributaries April 28, 1994 to Pittman Wash Lakeside Highlands Unit 1 Zone A April 14, 1994 Country Brook Subdivision C-1 Channel March 29, 1994 Foothills Subdivision Two Unnamed February 15, 1994 Tributaries Union Pacific Railroad Channel Pittman Wash Tributary January 12, 1994 And Union Pacific Railroad Channel Hillsboro Heights Zone A January 11, 1994 Vintage at Grand Legacy Zone A January 6, 1994 Ocotillo Pointe I and II Zone A December 2, 1993 Union Pacific Railroad Channel Pittman Wash September 28, 1993 Tributaries and Union Pacific Railroad Channel Calico Terrace Subdivision Unnamed Tributary to May 27, 1993 Las Vegas Wash Ventana at Green Valley Unnamed Zone A September 8, 1992 Trailside Point Subdivision Zone A January 7, 1992 The Masters Unnamed Zone A December 16, 1991

76
TABLE 7 – LETTERS OF MAP CHANGE (Cont’d)
PROJECT STREAM DATE
CITY OF HENDERSON (Cont’d) Lakeside Highlands Unit 4, Block 20, Lots 1
through 13; Block 16, Lots 3 and 27 and Block 19; Lots 2 through 8
Unnamed Wash June 7, 1996
Calico Terrace Unit 3 Unnamed Tributary to Las Vegas Wash
June 7, 1996
Green Valley Ranch South Channel Unnamed Wash May 28, 1996
Augusta Unit 4 Pittman Wash May 13, 1996La Mancha Townhomes Unnamed Zone A January 4, 1990 Candle Creek Units 3 & 4 Whitney Ranch Channel October 23, 1989 Warm Springs Reserve Unit 10 Zone A October 4, 1989 Creekside Unit 1 Zone A February 10, 1989 Warm Springs Reserve Unit 2 Zone A November 1, 1988 Fox Ridge Terrace Unit 2 Zone A October 18, 1988 Warm Springs Reserve Unit 5 Zone A September 7, 1988 Pardee Green Valley South Wash B July 19, 1988 Warm Springs Reserve Unit 5 Zone A June 28, 1988 Warm Springs Reserve Unit 4 Zone A October 23, 1987 Pueblo Verde II Apartments Unnamed Zone A August 18, 1987 Wilton Commons Zone A December 13, 1985 Summerfield Units 1, 2, & 4 Zone A July 28, 1982 Highland Hills Units 13-18 Zone A June 23, 1982 Green Valley Village Units B & F Zone A February 11, 1982 CITY OF LAS VEGAS Gowan/Bradley Flood Insurance Study Unnamed Wash December 21, 2001 Summerlin Village 3 Subdivision Unnamed Wash February 16, 2001 Summerlin Village 12 Wash Park Unnamed Wash January 30, 2001 Rancho Drive and US 95 Study Flooding along Rancho Drive
and US 95 November 2, 1999
Las Vegas Wash Restudy from Charleston Boulevard to the Upper Las Vegas Detention Basin
Las Vegas Wash September 17, 1999
Resort at Summerlin Unnamed Wash December 30, 1998 Washington Avenue Conveyance System Las Vegas Creek March 31, 1998 Buffalo/Lake Mead Shopping Center Unnamed Wash January 9, 1998 Summerlin Village 1 South Unnamed Wash June 12, 1997 Red Rock Detention Basin Red Rock Fan January 14, 1997 Summerlin Village Unnamed Wash September 30, 1996 Summerlin Village Unnamed Wash September 30, 1996 Craig Road and Rancho Drive Unnamed Wash October 4, 1995

77
TABLE 7 – LETTERS OF MAP CHANGE (Cont’d)
PROJECT STREAM DATE
CITY OF LAS VEGAS (Cont’d) Washington Avenue Unnamed Wash September 20, 1995
Lone Mountain Road and Rancho Drive Kyle Detention Basin September 6, 1995 Carey/Lake Mead Detention Basin Unnamed Wash August 21, 1995 Northshore Lot D Ponding October 27, 1994 Unnamed Zone A Unnamed Zone A September 7, 1994 Country Lane Series II Unnamed Zone A July 19, 1994 Summerlin Parkway Unnamed Zone A September 13, 1993 Rancho Alta Mira Development Unnamed Zone A February 8, 1983 Northwind Subdivision Unnamed Zone A November 28, 1983 Proposed Lake Mead Villa Unnamed Zone A August 14, CITY OF MESQUITE
Abbott Wash Conveyance System Abbott Wash October 27, 2006 Pulsipher Wash at Falcon Ridge Parkway Pulsipher Wash August 28, 2006 Abbott Wash Improvements at Mesquite Vistas Abbott Wash April 28, 2003 Pulsipher Wash Restudy Pulsipher Wash September 10, 2001 Pulsipher Wash Restudy Pulsipher Wash August 29, 2001 Sunset Greens Phase 4, Units 1F and 3 Virgin River March 14, 2001 Abbott Wash Restudy Abbott Wash May 15, 2000 Morning Star Subdivision - Phase 2 Virgin River February 4, 1997 Mesquite Floodplain Study Virgin River and Town Wash September 27, 1996 CITY OF NORTH LAS VEGAS Brentwood Unnamed Wash November 29, 2001N Channel N Channel October 31, 2001Cheyenne Village Unnamed Tributary to
Las Vegas Wash - A Channel April 27, 2001
Vandenberg Detention Basin Range Wash April 2, 2001Del Prado Highlands North Stormdrain Unnamed Wash May 10, 2000Gowan Warehouse Business Park Unnamed Tributary to
Las Vegas WashDecember 2, 1999
Rancho Ridge II Subdivision Unnamed Wash November 30, 1999Las Vegas Wash Restudy from Charleston
Boulevard to the Upper Las Vegas Detention Basin
Las Vegas Wash September 17, 1999
Ranch Ridge II Subdivision Unnamed Wash May 10, 1999Alexander Station Unit II Unnamed Wash March 31, 1999Alexander King Hill Elementary School Unnamed Wash February 11, 1997Brookspark Unnamed Wash October 21, 1996Cheyenne Plateau Unnamed Wash August 14, 1996Terrace Farms Unnamed Wash August 2, 1996
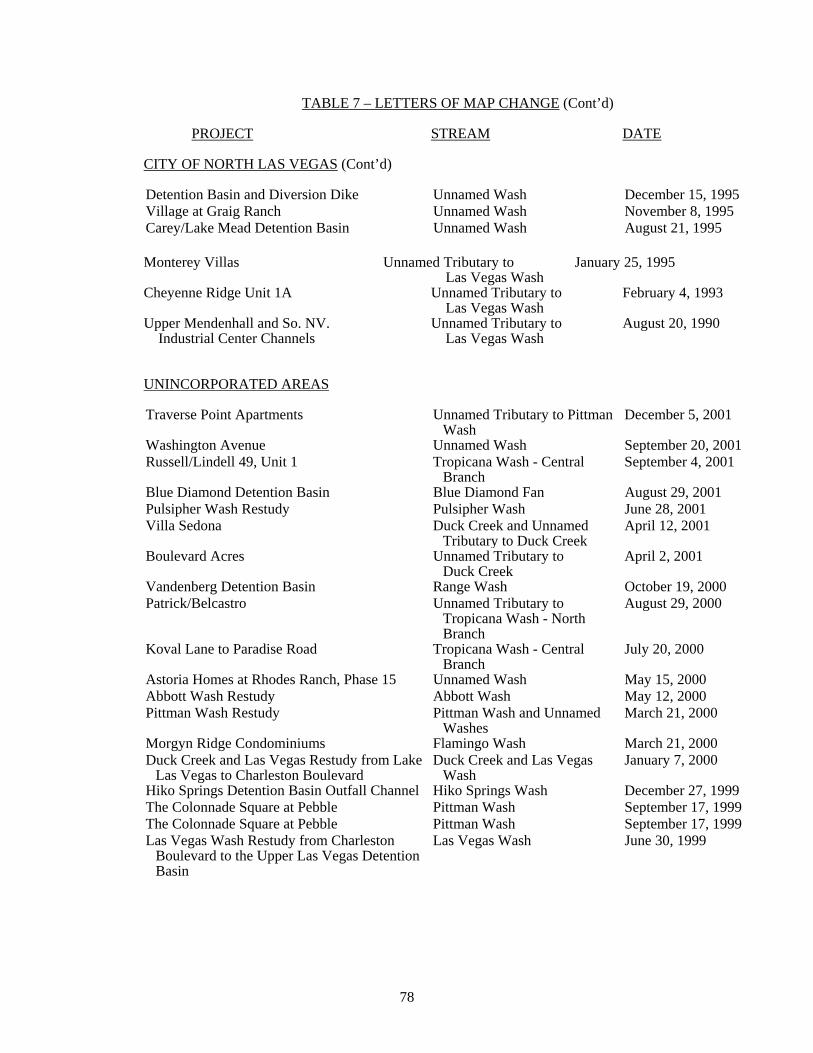
78
TABLE 7 – LETTERS OF MAP CHANGE (Cont’d)
PROJECT STREAM DATE
CITY OF NORTH LAS VEGAS (Cont’d) Detention Basin and Diversion Dike Unnamed Wash December 15, 1995Village at Graig Ranch Unnamed Wash November 8, 1995Carey/Lake Mead Detention Basin Unnamed Wash August 21, 1995 Monterey Villas Unnamed Tributary to January 25, 1995 Las Vegas Wash Cheyenne Ridge Unit 1A Unnamed Tributary to February 4, 1993 Las Vegas Wash Upper Mendenhall and So. NV. Unnamed Tributary to August 20, 1990 Industrial Center Channels Las Vegas Wash UNINCORPORATED AREAS Traverse Point Apartments Unnamed Tributary to Pittman
WashDecember 5, 2001
Washington Avenue Unnamed Wash September 20, 2001Russell/Lindell 49, Unit 1 Tropicana Wash - Central
BranchSeptember 4, 2001
Blue Diamond Detention Basin Blue Diamond Fan August 29, 2001Pulsipher Wash Restudy Pulsipher Wash June 28, 2001Villa Sedona Duck Creek and Unnamed
Tributary to Duck Creek April 12, 2001
Boulevard Acres Unnamed Tributary to Duck Creek
April 2, 2001
Vandenberg Detention Basin Range Wash October 19, 2000Patrick/Belcastro Unnamed Tributary to
Tropicana Wash - North Branch
August 29, 2000
Koval Lane to Paradise Road Tropicana Wash - Central Branch
July 20, 2000
Astoria Homes at Rhodes Ranch, Phase 15 Unnamed Wash May 15, 2000Abbott Wash Restudy Abbott Wash May 12, 2000Pittman Wash Restudy Pittman Wash and Unnamed
WashesMarch 21, 2000
Morgyn Ridge Condominiums Flamingo Wash March 21, 2000Duck Creek and Las Vegas Restudy from Lake
Las Vegas to Charleston BoulevardDuck Creek and Las Vegas
WashJanuary 7, 2000
Hiko Springs Detention Basin Outfall Channel Hiko Springs Wash December 27, 1999The Colonnade Square at Pebble Pittman Wash September 17, 1999The Colonnade Square at Pebble Pittman Wash September 17, 1999Las Vegas Wash Restudy from Charleston
Boulevard to the Upper Las Vegas Detention Basin
Las Vegas Wash June 30, 1999

79
TABLE 7 – LETTERS OF MAP CHANGE (Cont’d)
PROJECT STREAM DATE
UNINCORPORATED AREAS (Cont’d)
Greenfield Estates, Block 1, Lot 3 Muddy River June 1, 1999Rhodes Ranch Golf Course Unnamed Tributary to
Tropicana WashJanuary 12, 1999
Gilespie/Agate Duck Creek and Duck Creek South Channel
December 23, 1998
Duck Creek Landing, Block 1, Lots 93 through 98, Block 4, Lots 166, 167, 169 and 172, Block 5, Lot 143
Duck Creek November 24, 1998
Range Wash Confluence Detention Basin and Sloan Channel
Sloan Channel August 28, 1998
Spring Valley Ranch Units 7 through 11 Tropicana Wash - North Branch
August 7, 1998
Flamingo Wash Restudy Flamingo Wash May 20, 1998
Crystal Springs Tropicana Wash - North Branch
January 28, 1998
Lake Las Vegas - Parcels 18, 19, 21, 22 and 32 Unnamed Tributary to The Lake at Las Vegas
October 27, 1997
Buckingham Estates Blue Diamond Wash - North Branch
August 4, 1997
Red Rock Detention Basin Red Rock Fan January 14, 1997
Magnolia Estates, Lots 1through 92 Sloan Channel January 14, 1997
Upper Flamingo Wash Detention Basin -Outflow Channel
Flamingo Fan and Flamingo Wash
October 31, 1996
CCRFCD FIS Restudy Muddy River, Meadow Valley Wash, West Branch Muddy River, Muddy River Side Channel, Overton Wash
September 27, 1996
Sundance Subdivision Blue Diamond Wash - North Branch
June 27, 1996
Spring Valley Ranch Unit 1 and 2 Tropicana Wash - North Branch
May 7, 1996
Lewis Homes Graig Estates No. 8, Block 1, Lots 6 through 25 and Block 2, Lots 71 through 92
Unnamed Wash March 21, 1996
Sundance Subdivision Blue Diamond Wash - North Branch
October 27, 1995
Spring Valley Ranch Unit 1 and 2 Tropicana Wash - North Branch
May 7, 1996

80
TABLE 7 – LETTERS OF MAP CHANGE (Cont’d)
PROJECT STREAM DATE
UNINCORPORATED AREAS (Cont’d)
Lewis Homes Graig Estates No. 8, Block 1, Lots 6 through 25 and Block 2, Lots 71 through 92
Unnamed Wash March 21, 1996
Sundance Subdivision Blue Diamond Wash - North Branch
October 27, 1995
CCRFCD FIS Restudy Bridge Canyon Wash October 18, 1995 South West Unnamed Fan and
Hiko Springs FanOctober 18, 1995
Green Valley Pecos Subdivision Unnamed Trib to Duck Creek October 17, 1995 Mission Hills Detention Basin Mission Hills Detention Basin October 6, 1995 Gowan Detention Basins - North and South Buffalo Channel October 4, 1995 Mesquite Floodplain Study Virgin River and Town Wash September 20, 1995 Fernwood Subdivision Unnamed Basin February 1, 1995 Woodside Village Apartments Las Vegas Wash and November 11, 1994 Sloan Channel Unnamed Zone A Unnamed Zone A September 7, 1994 Champion Estates Zone A June 17, 1994 Sloan Channel Unnamed Tributary June 8, 1994 to Sloan Channel Parcel 250-560-004 Unnamed Zone A March 8, 1994 Sloan Channel Las Vegas Wash and January 14, 1994 Sloan Channel Mizrachi Property Zone A November 29, 1993 Summerlin Village I Zone A May 18, 1993 Sunrise Valley Homes Sloan Channel May 13, 1993 Rancho Nevada No. 2 Duck Creek March 15, 1993 Summerlin Village 2 Zone A December 18, 1992 Alta View West Zone A July 13, 1992 Realty Executive Plaza Zone A July 8, 1992 Flamingo Wash Flamingo Wash March 23, 1992 Pebble Canyon Pebble Canyon February 21, 1992 Custom Estates East Duck Creek December 12, 1991 Rancho Las Brisas Buffalo Channel October 3, 1991 Hillcrest Manor Zone A August 16, 1991 Sheaker Heights Zone A July 19, 1991 Richard Rundle Elementary School Zone A May 13, 1991 Winterwood Units 1, 2 & 3 Zone A October 15, 1990 Arville Commerce Center Flamingo Wash August 17, 1990 Macchiaverna Villas Flamingo Wash March 30, 1990 Winterwood Sunrise Zone A March 23, 1990 Estates at Spanish Trail No. 1 Red Rock Wash and November 2, 1989 Flamingo Wash Spanish Trail Red Rock Wash and October 11, 1989 Flamingo Wash

81
10.2 Second Revision
This study was revised on September 27, 2002, to reflect the effects of Letters of Map Change (LOMCs), including Letters of Map Revision (LOMRs), mappable Letters of Map Amendment (LOMAs), and Letters of Map Revision Based on Fill issued by FEMA. Some of these LOMCs were issued for Las Vegas Wash, Union Pacific Railroad Overflow, Duck Creek and Unnamed Tributary to Las Vegas Wash and are described in more detail below. The results of the preliminary maps were reviewed at the Community Coordination meeting held on January 23, 2002, and attended by representatives of the Cities of Henderson, Las Vegas, North Las Vegas, CCPW, CCRFCD, FEMA, and MBJ. All issues raised at that meeting have been addressed in this study. Las Vegas Wash and Unnamed Tributary to Las Vegas Wash LOMRs were issued on June 23, 1999 (Case No. 97-09-417P), to incorporate a Limited Map Maintenance Program (LMMP) project and re-issued on September 17, 1999 (Case No. 99-09-936P), for the Cities of Las Vegas and North Las Vegas and the unincorporated areas of Clark County. Authority and Acknowledgments: The hydrologic analyses used as a basis for this study were performed by JMM for CCRFCD (Reference 69). This work was completed in September 1991. The hydraulic analyses for this study were performed by Ensign & Buckley Consulting Engineers (E&B), the Study Contractor for FEMA, under Contract No. EMW-90-C-9133 (Reference 70). This work was completed in March 1996. Coordination: An initial consultation and coordination meeting was held on May 13, 1992, to review the flooding sources to be studied and the limits of the study. Available mapping and other data were identified at this meeting. Representatives from the Cities of Las Vegas and North Las Vegas, the FEMA Region IX Office, and E&B attended the meeting. An intermediate consultation and coordination meeting was held on June 28, 1994, with representatives from CCPW, CCRFCD, the Cities of Las Vegas and North Las Vegas, the FEMA Region IX Office, and E&B. The methodologies, data used, and preliminary results of the study were discussed. A field investigation was also conducted. Additional available mapping was provided by Clark County, and supplemental field surveys were provided by the City of North Las Vegas and E&B. As the study was underway, meetings and telephone discussions were held between representatives from the CCPW, CCRFCD, the Cities of Las Vegas and North Las Vegas, and E&B. CCPW provided available topographic mapping and drawings for site grading and channel modifications. CCRFCD confirmed that the various regional flood-control facilities were installed in accordance it’s Master Plan. These detention and diversion facilities alter the natural discharges to create the discharges used in this study. The Cities of Las Vegas and North Las Vegas provided available topographic mapping, survey data, and drawings of facilities. The cities also participated in the field investigation. Scope: This study was performed to show the effects of flood-control projects along Las Vegas Wash from Charleston Boulevard to the UPRR and an Unnamed Tributary to Las Vegas Wash from its confluence

82
with Las Vegas Wash to the UPRR. The flood-control projects incorporated are: the Upper Las Vegas Detention Basin, the North Las Vegas Detention Basin, the Gowan North Detention Basin, Gowan Outfall to Las Vegas Wash, the Angel Park Detention Basin and Outfall, Buffalo Channel connecting the Angel Park Outfall channel to the Gowan South Detention Basin, King Charles Diversion Channel, the Washington Avenue conveyance system (Las Vegas Creek), the Bonanza Avenue bridge, the Lamb Boulevard bridge, the Civic Center Drive bridge, and the Washington Avenue bridge, channel modifications to Las Vegas Wash just downstream of Lake Mead Boulevard, and realignment of the N Channel and the lining near Washington Avenue and between Charleston Boulevard and Stuart Avenue. The revised hydrology is based on the effects of these flood-control projects. Hydrologic Analysis: The 100-year discharges used for the analyses of Las Vegas Wash were obtained from the CCRFCD report entitled “Las Vegas Valley Flood Insurance Study Hydrology Report,” prepared by JMM, dated September 1991 (Reference 69). The peak discharges were established by using the HEC-1 hydrologic computer model developed by the COE (Reference 71). The methods and parameters used were in accordance with the CCRFCD Hydrologic Criteria and Drainage Design Manual (Reference 72). The watershed areas were determined using the USGS quadrangle mapping. Existing land uses were defined based on the 1986 digitized land use data provided by the county; which were supplemented and updated using a 1990 aerial photograph. The watershed soil types were determined from the SCS soil survey maps. The infiltration losses were determined using the SCS Curve Number (CN) method, with CN values determined based on watershed soil types and SCS guidelines. The SCS unit hydrograph option was used in the HEC-1 model, with a 6-hour duration storm and precipitation totals, distribution, area reduction factors, and basin lag times in accordance with CCRFCD procedure. Channel routing was performed using the HEC-1 Muskingum method. The discharge relationship was determined using multiple-discharge hydraulic computations. In addition, the HEC-1 reservoir storage routine was used for the detention basins. Hydraulic Analysis: Cross-sectional information was obtained from orthophoto topography with a scale of 1 = 400 and 4-foot contour intervals provided by Clark County and the City of Las Vegas (References 67 and 73), topographic mapping with a scale of 1 = 200 and 5-foot contour intervals also provided by Clark County and the City of Las Vegas (Reference 74), orthophoto topography with a scale of 1 = 200 and 2-foot contour intervals provided by the City of North Las Vegas (Reference 75), field-surveyed channel sections from the City of Las Vegas (Reference 76) and Las Vegas Wash Maintenance Plans (Reference 77). Bridge and culvert elevations and dimensions were determined from construction drawings (References 78 through 81) and supplemental surveys. All bridges and culverts were assumed to be unobstructed. Roughness factors (Manning’s “n”) used in the hydraulic computations were chosen by field observations in accordance with COE and USGS guidelines (References 82 and 83). Roughness values ranged from 0.015 to 0.045 for the channels and from 0.02 to 0.08 for the overbank areas. Contraction and expansion coefficients of 0.1 and 0.3 were used for open-channel sections. Contraction coefficients and expansion coefficients and inlet-control parameters were determined in accordance with COE HEC-2 guidelines, based on the structure configurations. Water-surface elevations were computed using the COE HEC-2 step-backwater computer program (Reference 84).

83
The starting water-surface elevations for Las Vegas Wash, Unnamed Tributary to Las Vegas Wash, and the overflow areas were determined either by critical depth or by the slope area method, with the slope estimated from topographic mapping. Flood profiles were drawn to show computer-generated water-surface elevations to an accuracy of 0.5 foot for the 100-year flood for Las Vegas Wash and Unnamed Tributary to Las Vegas Wash. Split-flow routines with a weir coefficient of 2.6 were used to determine overflows or flow diversions at several locations. At several locations, existing concrete block walls will obstruct and divert the shallow overland flow. Because these walls do not meet the requirements of Section 65.10 of the NFIP regulations, analyses were performed with and without walls, and the most conservative scenario was mapped. For the studied reaches, the 100-year floodplain boundaries were delineated using the flood elevations determined at each cross section. Within the City of Las Vegas, the 100-year flood from Las Vegas Wash is contained within the channel banks from Charleston Boulevard to Lake Mead Boulevard. The floodplain area shown on the work maps from Owens Avenue to Nellis Boulevard is a result of overtopping of the channel within the City of North Las Vegas and split flows that start upstream of Las Vegas Boulevard and Carey Avenue. The floodplain boundaries were delineated on topographic mapping with a scale of 1 = 400 and 4-foot contour intervals (Reference 73) and on topographic mapping with a scale of 1 = 200 and 5-foot contour intervals (Reference 74), both provided by Clark County and the City of Las Vegas. Within the City of North Las Vegas, flow splits from Las Vegas Wash at Las Vegas Boulevard, Cheyenne Avenue, and Carey Avenue. The split flows are primarily a result of limited culvert capacity. The split flow at Cheyenne Avenue was analyzed by normal depth calculations and determined to have an average depth of less than 0.5 foot; therefore it is shown as Zone X (shaded). The floodplain area between Las Vegas Boulevard and Pecos Boulevard is a result of the split flows at Las Vegas Boulevard and Carey Avenue. The concrete block wall west of the intersection of Pecos Boulevard and Alta Street does not meet the levee/floodwall requirements of Section 65.10 of the NFIP regulations; therefore, both “with wall” and “without wall” analyses were performed, and the most conservative scenario was mapped. The overflow areas were analyzed using HEC-2. Where average depths are more than 1 foot, the areas were mapped as Zone AO with depths shown. Where the average depth is less than 1 foot, the areas were mapped as Zone X (shaded). The floodplains were mapped on the City of North Las Vegas topographic mapping, with a scale of 1 = 400 and 2-foot contour intervals (Reference 75). Within the unincorporated areas of Clark County, the floodplain boundaries were delineated on topographic mapping with a scale of 1 = 400 and 4-foot contour intervals provided by Clark County and the City of Las Vegas (Reference 73). Because no floodway analyses were performed, the effective regulatory floodway was removed within the study reach along Las Vegas Wash. The regulatory floodway for Unnamed Tributary to Las Vegas Wash was revised. Las Vegas Wash and Union Pacific Railroad Overflow LOMRs were issued on June 23, 1999 (Case No. 97-09-425P), to incorporate a restudy and re-issued

84
on September 17, 1999 (Case No. 99-09-936P), for the Cities of Las Vegas and North Las Vegas and the unincorporated areas of Clark County. Authority and Acknowledgments: The hydrologic analyses used as a basis for this study were performed by the COE in 1988 (Reference 85), by JMM for CCRFCD in 1991 (Reference 69), by Boyle Engineering Corporation in 1991 (Reference 86), and by Black & Veatch in 1993 (Reference 87). The hydraulic analyses for this study were performed by Northwest Hydraulic Consultants, Inc. (NHC), the Study Contractor for FEMA under Contract No. EMW-95-C-4840 (Reference 88). This work was completed in April 1998. Coordination: An initial consultation and coordination meeting was held on September 7, 1994, to review the flooding sources to be studied and the limits of the study. Representatives from the CCRFCD, Clark County, the Cities of Las Vegas and North Las Vegas, the FEMA Region IX Office, and NHC attended the meeting. Additional meetings were held on September 27 and September 28, 1994, in conjunction with field investigations. Throughout the preparation of the study, several field investigations were conducted, and additional information was obtained during meetings. Scope: This study was performed to show the effects of flood-control projects along Las Vegas Wash from Interstate Highway 15 to upstream of the Upper Las Vegas Wash Detention Basin; along UPRR Overflow, also known as King Charles Diversion Channel; and along N Channel Diversion. The flood-control projects incorporated are the Upper Las Vegas Detention Basin and the North Las Vegas Detention Basin. The revised hydrology is based on these flood-control projects. Hydrologic Analysis: The 100-year discharges used for the analyses of Las Vegas Wash were obtained by modifying the hydrologic analyses performed by the COE in 1988 (Reference 85), by JMM for CCRFCD in 1991 (Reference 69), by Boyle Engineering Corporation in 1991 (Reference 86), and by Black & Veatch in 1993 (Reference 87). The following three critical storm centerings were reviewed and accepted for this study: The Spring Mountain Storm produces the highest uncontrolled peak inflows to the Upper Las
Vegas Wash Interception Berm and Detention Basin; The Interbasin Storm produces the highest 100-year peak inflow to the North Las Vegas Detention
Basin; and An unnamed storm in the West Range Wash Tributary area produces the highest peak inflows to
the West Range Wash Diversion Dike, which directs flows into the North Las Vegas Detention Basin.
The peak discharges were established by using the HEC-1 hydrologic computer model developed by the COE (Reference 71). The previously developed HEC-1 models were modified to reflect the

85
presence and current outlet work configurations of the existing flood-control facilities. Changes were also made to reflect as-built stage-storage and stage-discharge relationships for the Upper Las Vegas Detention Basin and to reflect the stage-discharge relationship for the modified three-pipe outlet structure at the North Las Vegas Detention Basin, including the upstream barrier wall. The revised HEC-1 models also included the 10- and 50-year rainfall events for the Interbasin Storm and the 500-year event for the Spring Mountain, Interbasin, and West Range Wash storms. No changes were made to the previously defined runoff and channel routing parameters, such as basin areas, curve numbers, loss rates, channel geometry, channel routing parameters, or rainfall amounts. Hydraulic Analysis: Cross-sectional information was obtained from aerial photogrammetry that was used to develop topographic maps of the study area with a contour interval of 4 feet (Reference 89). Additional field surveys were conducted to obtain elevations for the bridge crossings at Lone Mountain Road, Carey Road, the UPRR bridge, and near the intersection of Losee Road and Lone Mountain Road. As-built plans for flood-control facilities and improvement plans for streets, bridges and development areas also were used. Roughness factors (Manning’s “n”) used in the hydraulic computations were chosen by using standard engineering references (References 82 and 90) and engineering judgement and were based on field observations of the streams and floodplain areas. Roughness values ranged from 0.014 to 0.045 for the channels and from 0.014 to 0.035 for the overbank areas. Water-surface elevations were computed using the COE HEC-2 step-backwater computer program (Reference 84). The model was run in both subcritical and supercritical modes for various reaches of the study area. The results also were supplemented by independent calculations at the bridges and culverts using the Federal Highway Administration HY-8 program (Reference 91) and by hand. In some areas, the depths of the shallow flooding in the overbanks were computed using normal depth calculations from Manning’s equation. The starting water-surface elevations for Upper Las Vegas Wash at the confluence with the Unnamed Tributary to Las Vegas Wash (A Channel) were determined using the slope-area method. For N Channel, the starting water-surface elevation was computed using supercritical profiles that also match the water-surface elevations from King Charles Diversion Channel. The starting water-surface elevations at the Upper Las Vegas Detention Basin and North Las Vegas Detention Basin were derived from the HEC-1 model by using the basin stages at the time of the peak discharge. Flood profiles were drawn showing computer water-surface elevations to an accuracy of 0.5 foot for the 100-year flood along Las Vegas Wash and for the selected recurrence intervals along King Charles Diversion Channel. The hydraulic analyses for this study were based on unobstructed flow through the wash hydraulic structures except at the Lone Mountain Road bridge. The Lone Mountain Road bridge is the first bridge through which Las Vegas Wash passes going downstream and is subject to high debris and sediment loads from the wash. The HEC-2 models and the HY-8 program were used to define the locations where channel and hydraulic structure capacities were inadequate to convey the peak flood discharges. Where the overbank flows remained hydraulically connected to the main wash or channel flows, the overbank flows were modeled with HEC-2, and the results used to delineate the flood zones as Zone AE. Where

86
the breakout flows were determined likely to become hydraulically separated from the main wash or channel, the breakout flows were estimated using normal depth computations and mapped as Zone AO. Breakout flows occur when the 500-year flood discharges near Azure and Losee Road, at Lone Mountain Road, at Craig Road and at the UPPR bridge. A portion of these flows returns to the main channel downstream in various locations within the study area. Overflow magnitudes were determined using HEC-2 and hand calculations. Flows in the downstream direction decrease as overflows are progressively subtracted from the main flow area at subsequent breakout locations. Flood boundaries for the 100- and 500-year flood discharges along Las Vegas Wash were delineated on 1 = 400 topographic maps with contour intervals of 4 feet (Reference 89). Where flood boundaries for the 500-year flood discharge were located outside the extent of this mapping, the boundaries were determined using topographic mapping developed for the City of North Las Vegas with a scale of 1 = 400 and contour intervals of 2 feet (Reference 92) and USGS quadrangle topographic maps with a scale of 1 = 2,000 (References 93 and 94). The lower portion of King Charles Diversion Channel is affected by backwater from A Channel. No floodway analyses were performed for the study reach. Las Vegas Wash LOMRs were issued on January 19, 2000 (Case No. 99-09-1119P), to incorporate a restudy and re-issued on March 21, 2000 (Case No. 00-09-268P), for the Cities of Henderson and Las Vegas and the unincorporated areas of Clark County. Authority and Acknowledgments: The hydrologic analyses used as a basis for this study were performed by JMM for CCRFCD (Reference 69). This work was completed in September 1991. The hydraulic analyses for this study were performed by Nolte and Associates (Nolte), the Study Contractor for FEMA under Contract No. EMW-96-CO-0099 (Reference 95). This work was completed in January 1999. Coordination: An initial consultation and coordination meeting was held on November 2, 1995, to review the scope of work and the flooding sources to be studied. Representatives from the City of Henderson, CCRFCD, CCPW, the FEMA Region IX Office, and Nolte attended the meeting. Nolte contacted FEMA, the COE, the USGS, the Nevada Department of Transportation, the National Weather Service, Natural Resources Conservation Service (formerly the SCS), CCRFCD, and CCPW to obtain any topographic, hydrologic, and hydraulic data pertaining to the study area. Scope: This study was performed along Las Vegas Wash from Lake Las Vegas to Charleston Boulevard. The basin consists of commercial and residential areas at the upstream end, open space and several

87
wastewater treatment plants in the midportion of the basin, and open space with some residential areas at the downstream end. An earthen trapezoidal channel extends from Charleston Boulevard downstream to Sahara Avenue, at which point a concrete trapezoidal channel extends farther downstream to Vegas Valley Road. Downstream of Vegas Valley Road, the channel configuration varies from a small, low-flow type channel to a 50-foot vertical ravine-type channel. The channel is limited to desert shrub vegetation downstream and earth/turf/concrete-lined channel upstream. Hydrologic Analysis: The 100-year discharges used for the analyses of Las Vegas Wash were obtained from the CCRFCD report entitled “Las Vegas Valley Flood Insurance Study Hydrology Report,” prepared by JMM, dated September 1991 (Reference 69). The peak discharges were established by using the HEC-1 hydrologic computer model developed by the COE (Reference 71). The hydrologic model accounted for existing flood-control improvements and detention basins.Hydraulic Analysis: Aerial photogrammetry was used to develop topographic maps with 4-foot contour intervals (Reference 96). Cross-sectional information was digitized from the photogrammetric data and supplemented with field survey data where needed. This information was used to develop the hydraulic models. The hydraulic analyses were performed using the COE HEC-2 computer program (Reference 97). Roughness factors (Manning’s “n”) used in the hydraulic computations were determined by engineering judgement, field investigation, and using tables from the handbook entitled “Open Channel Hydraulics” by Ven Te Chow (Reference 82). The hydraulic control at the downstream end of Las Vegas Wash is a concrete box culvert inlet structure of the existing Lake Las Vegas Stormwater Conveyance System. The Conveyance System was built to transport the 100-year storm under Lake Las Vegas Parkway. Because the box culvert acts as a weir crest, critical depth was used as the starting water-surface elevation, including for the regulatory floodway. Flood profiles were drawn to show computer water-surface elevations to an accuracy of 0.5 foot for the 100-year flood for Las Vegas Wash and Unnamed Tributary to Las Vegas Wash. Hydraulic computations for Las Vegas Wash included modeling of four bridge crossings: at Charleston Boulevard, Nellis Boulevard, Sahara Avenue, and Vegas Valley Road. In addition, two low-flow road crossings are located at Treatment Plant Road and Telephone Line Road. The existing culverts are undersized at these two locations and convey less than 10 percent of the 100-year flood. For the hydraulic analyses, these culverts were assumed to be blocked. Based on the topographic information, a split flow appears to occur just upstream of Sahara Avenue during the 100-year flood. Based on field observations, this split flow runs easterly toward Sloan Channel and then turns south along Stephanie Street. Regulatory floodways for Las Vegas Wash from Lake Las Vegas to Charleston Boulevard were determined assuming that the split flow is confined in the wash. Flood boundaries for the 100-year flood and regulatory floodway were delineated on 1 = 500 scale topographic maps with contour intervals of 4 feet.

88
Duck Creek LOMRs were issued on January 19, 2000 (Case Nos. 97-09-574P and 99-09-230P), to incorporate a restudy for the City of Henderson and the unincorporated areas of Clark County. These LOMRs were re-issued on March 21, 2000 (Case No. 00-09-268P) to incorporate comments received from CCRFCD. The March 21 LOMR was issued for Duck Creek from approximately 300 feet upstream of U.S. Highway 95 (US95) to approximately 1,100 feet upstream of East Robindale Road; along Duck Creek Overflow; and along Rawhide Channel; and to revert to the 100-year floodplain boundary delineations shown on the effective FIRM dated August 16, 1995, as modified by LOMRs dated October 17, 1995, and August 4, 1997. The effective FIRM did not show a 100-year floodplain along Rawhide Channel, and showed 100-year floodplains designated Zone A, for which no Base (100-year) Flood Elevations (BFEs) were determined, along Duck Creek Overflow and along the above-mentioned reach of Duck Creek. The 100-year floodplain and floodway boundary delineations and BFEs along Duck Creek from its confluence with Las Vegas Wash to approximately 300 feet upstream of US95 were not altered from those shown in the January 19 LOMR. Authority and Acknowledgements: The hydrologic analyses for Duck Creek were performed by JMM and were included in the report entitled “Las Vegas Valley Flood Insurance Study Hydrology Report,” dated September 1991 (Reference 69). The hydraulic analyses for this portion of Duck Creek were performed by Nimbus Engineers (Nimbus), the Study Contractor for FEMA, under Contract No. EMW-94-C-4648 (Reference 98). This work was completed in July 1997. Coordination: An initial coordination meeting was held on August 25, 1993, to review the scope of work and the portions of Duck Creek to be studied. Representatives from CCPW, Clark CCRFCD, the City of Henderson, the FEMA Region IX Office, and Nimbus attended the meeting. Scope: This study covered Duck Creek from its confluence with the Las Vegas Wash to Robindale Road. However, as a result of the comments received by CCRFCD, only the reach from the confluence with Las Vegas Wash to approximately 300 feet upstream of US 95 will be discussed further in this Revision Section. The reach from Rebel Road to the confluence with Las Vegas Wash was studied by approximate methods. Hydrologic Analysis: For this reach of Duck Creek, peak discharge values for the 100-year flood were obtained from the report entitled “Las Vegas Valley Flood Insurance Study Hydrology Report,” dated September 1991 (Reference 69). Peak discharges were determined in this study by using the COE HEC-1 hydrologic model (Reference 71) and CCRFCD Hydrologic Criteria and Drainage Design Manual (Reference 72). Hydraulic Analysis: Cross-sectional information for this reach of the Duck Creek was obtained from 2-foot contour interval topographic maps. Aerial topography was developed by Kenny Aerial Mapping, Inc., in November 1994 (Reference 99) for most of the study. Additional topographic mapping was obtained from ADR Associates in February 1995 and February 1997. Information also was obtained from bridge plans and surveyed bridge sections dated 1998 (Reference 100), CCPW, and field

89
investigations conducted in May 1995 and October 1996. The COE HEC-2 hydraulic model (Reference 84) was used to prepare the 100-year flood elevations for the studied reach. The starting water-surface elevation for lower Duck Creek was determined by the slope-area method in HEC-2. The middle reach started with a known water surface elevation from the culvert and weir rating over Stephanie Street. No information regarding measured flooding events was available for calibration of the hydraulic models. Channel roughness values (Manning’s “n”) used in the hydraulic computations were chosen by engineering judgement and based on field observations of the streams and floodplain areas. The channel roughness values ranged from 0.013 to 0.08, and the overbank roughness values ranged from 0.013 to 0.20. Near Morris Street, the channel begins to lose capacity. Energy grades were balanced at Denning Street to determine the amount of flow that remains in the channel and the amount which flows in the left overbank. These flows combine again at Andover Drive. Flow distribution was used at Stephanie Street to determine that approximately 6,340 cfs remains in the channel and right overbank, and 5,160 cfs splits to the north. This 5,160 cfs then turns southeast and weirs over Boulder Highway. Upstream of Emerald Avenue, the remainder of this flow joins the 6,340 cfs in the main channel and continues to weir over Boulder Highway. A portion of the flow that weirs over Boulder Highway divides and creates two flowpaths for approximately 2,500 feet. All divided flow combines approximately 3000 feet upstream of Rebel Road. This is also the beginning of the confluence of Duck Creek and Las Vegas Wash. Flood boundaries for the 100-year flood were delineated on 1” = 500’ scale topographic maps with contour intervals of 2 feet (Reference 99). Regulatory floodways were not developed for this reach of Duck Creek because of continually changing channel capacities, split flows, divided flows, levee failure analysis, and the interdependence of all these conditions. All elevations for the flooding sources within Clark County and Incorporated Areas in this FIS report and on the FIRMs have been converted from the National Geodetic Vertical Datum (NGVD 1929) and are referenced to the North American Vertical Datum of 1988 (NAVD 88). Table 7, Letters of Map Change, has been revised to include the LOMRs and LOMAs that have been incorporated. In addition, changes established by those LOMRs and LOMAs have also been incorporated into Table 3, Summary of Discharges, Table 5, Floodway Data, and Exhibit 1, Flood Profiles, where applicable.
10.3 Third Revision
This study was revised on December 4, 2007, to incorporate new detailed flood hazard information for the Virgin River from approximately half a mile upstream of its confluence with Toquop Wash to the Arizona-Nevada state boundary. This revision affects the City of Mesquite and the Unincorporated Areas of Clark County, Nevada.

90
The hydraulic analysis for this restudy was performed by PBS&J, under agreement with the Clark County Regional Flood Control District (CCRFCD). The hydrology analysis was performed by Michael Baker Jr. Inc, under contract with FEMA. This work was completed in May 2006. Major flooding occurred along the Virgin River within the City of Mesquite in the winter of 2004/2005. The January 2005 flood neared the magnitude of the 1-percent-annual-chance flood. This flood caused an estimated damage of more than one million dollars in public infrastructure and also damaged approximately 80 homes located in the northeast part of Mesquite, just west of the Nevada-Arizona border. The storm resulted in significant loss in vegetation, channel widening, avulsions, excessive floodplain sediment deposition, and lateral erosion of channel banks. The hydraulic model was extended approximately 1.7 miles upstream of the Nevada-Arizona border in order to model the avulsion formed during the January 2005 flood. A separate study has been funded by FEMA for the Virgin River within Mohave County, AZ.
Hydrologic Analyses
The 1- and 0.2-percent-annual-chance flood discharges were developed using the Water Resources Council Bulletin 17B (Reference 18). The analysis used the annual peak discharges from the USGS’ gage located at Littlefield Arizona (Station 0941500) located approximately 9 miles upstream of the Nevada-Arizona Border. The gage records included all annual peak discharges from 1930 through 2003, and the January 2005 peak flood event. The Peak Discharge for 1989 was omitted from the analysis because it was a result of a dam failure. The revised Virgin River discharges are reflected in Table 3, Summary of Discharges. Hydraulic Analyses WSEL’s for the 1- and 0.2-percent-annual-chance recurrence intervals were developed along the Virgin River using the standard step backwater computer program HEC-RAS version 3.1.3. Cross-section data for the Virgin River were obtained from 2-foot contour interval topographic data created from Light Detection and Ranging (LiDAR) data and from construction plans for the Bunkerville Bridge and the Bunkerville diversion structure. The LiDAR data reflects post January 2005 flood conditions and was provided by the Bureau of Reclamations. LiDAR data was provided on Universal Transverse Mercator (UTM) Zone 11, North American Datum 83 (NAD83), and North American Vertical Datum 88 (NAVD 88) coordinate system and datums. All elevations for the flooding sources within Clark County and Incorporated Areas in the FIS report and on the FIRMs are in the same coordinate system and datums as the LiDAR. Starting water surface elevation for the Virgin River was determined using HEC-RAS Normal Depth option with a slope of 0.0025 ft/ft. This slope is associated with the Virgin River’s channel bed just downstream of the limit of detailed study. Composite roughness coefficients (Manning’s “n”) for the main channel and over-bank areas ranged from 0.025 to 0.12. Roughness coefficients for the Virgin River channel and overbank areas are based on field visits, pre- and post-flood aerial photos, and in accordance with recommendations provided in CCRFCD’s Drainage Design Manual. Manning’s n within the active channel and surrounding barren areas was based on pre-2005 flood aerial photos because these areas will eventually re-vegetate. Split flow analyses were conducted for the 1- and 0.2-percent-annual-chance flood events to simulate the

91
avulsion created by the January 2005 storm along the Virgin River. The results of the hydraulic analysis show that based on the initial flow split, 18,038 cfs will be conveyed through the avulsion, while the remaining 21,472 cfs will continue to flow in the main channel. Along the majority of the avulsion reach the WSEL is higher than the WSEL in the main channel. As a result, the flow within the avulsion drains back into the main channel once it overtops the high point between both reaches. The flow in the avulsion gradually reduces over the entire reach until completely returning to the main channel at just upstream of Cross Section AV. Lateral weirs were modeled along the highpoints to simulate the overtopping flow that discharges from the avulsion to the main channel of the Virgin River.
Floodways for this study were initially computed on the basis of equal conveyance reduction, using HEC-RAS’ encroachment Method 4, from each side of the floodplain. The floodway encroachment stations were then adjusted manually, using HEC-RAS’ encroachment Method 1, to provide a smooth floodway boundary. The floodway along the split flow reach was computed by using combined avulsion and main channel cross sections with the full discharge. The floodway elevations were then compared to the 1-percent annual-chance elevations in order to calculate the surcharges. The revised 1- and 0.2-percent annual chance elevations and floodway surcharges are reflected in Table 5, Floodway Data, and in Exhibit 1, Flood Profiles. Letters of Map Change (LOMCs) This revision also incorporates the determinations of LOMRs issued by FEMA for the following cases: LOMR number 03-09-0236P, issued on April 28, 2003, for the City of Mesquite, revised Abbott
Wash from Pioneer Boulevard to just downstream of Hardy Way. LOMR number 06-09-B051P, issued on August 28, 2006, for the City of Mesquite, revised
Pulsipher Wash from just upstream to approximately 6,000 feet upstream of Interstate Highway 15 (I-15).
LOMR number 06-09-BD10P, issued on October 27, 2006, for the City of Mesquite, revised Abbott
Wash from just upstream of Pioneer Boulevard to approximately 1,300 feet downstream of Hafen Lane. This LOMR also superseded a portion of LOMR 03-09-0236P.
Table 7, Letters of Map Change, has been revised to include the LOMRs that have been incorporated. In addition, changes established by those LOMRs have also been incorporated into Table 3, Summary of Discharges, Table 5, Floodway Data, and Exhibit 1, Flood Profiles, where applicable.
10.4 Fourth Revision This study was revised on November 16, 2011 to incorporate new detailed flood hazard information for Las Vegas Wash / Lake Las Vegas and Unnamed Washes along Rancho Drive/US 95. The Las Vegas Wash was studied from Lake Las Vegas to I-15 to and affects the City of Las Vegas, City of North Las Vegas, City of Henderson and the unincorporated areas of Clark County. The Rancho drive/US 95 study incorporates six flood control projects for the Unnamed Washes along US 95, 93 North Rancho Drive, Gowan Road, and Maverick Street and Duncan Road in the City of Las Vegas, Nevada. The hydraulic analysis for these studies was performed by multiple firms including; MHW (Lake Las Vegas), G.C. Wallace (Las Vegas Wash), The Louis Berger Group (Las Vegas Wash and Rancho Drive / US 95). Las Vegas Wash study was completed in November of 2008 and Rancho Drive/US 95Study was completed in November 2006.

92
Base map features were also updated through this revision process. These features include; Transportation, General Structures, Benchmarks, Water Areas and Political Areas. All features were obtained from Clark County. An initial scoping meeting was held April 16th 2009 to review the map revision status / schedule, base map updates, LOMC incorporation and provisionally accredited levee map revisions. Representatives from Clark County, City of Henderson, City of Las Vegas, City of North Las Vegas, FEMA Region IX and RMC 9 attended the meeting. The Clark County Consultation Coordination Officer (CCO) meeting was held on March 1, 2010 at 1:00PM in Las Vegas, NV. Representatives from Clark County, City of Henderson, City of Las Vegas, City of North Las Vegas, FEMA Region IX and RMC 9 attended the meeting. Lake Las Vegas Authority and Acknowledgements: Flood routing analysis performed for Lake Las Vegas in support of the Las Vegas Wash was performed by MWH for the Clark County Regional Flood Control District (CCRFCD). This work was completed in November of 2008. Scope: This study was performed on Lake Las Vegas with authorization from Clark County Regional Flood Control District (CCRFCD). Lake Las Vegas is a man-made lake located on the Las Vegas Wash in the City of Henderson, NV. The limits of the study area extend from the upstream side of the dam to the downstream side of Lake Las Vegas Parkway. Flood Routing Analysis: The revised Lake Las Vegas flood routing model was created by updating the Las Vegas Wash 1% annual chance hydrograph on the previously effective HEC-1 model from LOMR 03-09-0180P, dated January 2004. The revised Las Vegas Wash 1% annual chance hydrograph was created by G.C. Wallace Inc. (GCW) as part of the hydrology task for the Las Vegas Wash Flood Hazard Map Restudy. The revised 1% annual chance water surface elevation for Lake Las Vegas is 1410.0 NAVD. Las Vegas Wash Authority and Acknowledgements: GCW and The Louis Berger Group were authorized by Clark County Regional Flood Control District (CCRFCD) to perform this Flood Hazard Map Restudy under contract, Agreement of Professional Services for the Las Vegas Wash, dated March 8, 2007. All work was completed in November 2008. Scope: The purpose of this study was to investigate the limits of flood hazards caused by the Las Vegas Wash in Clark County, NV. The work consisted of data collection, hydrologic and hydraulic modeling, delineation of the 1% annual chance floodplain, floodway, and determination of base flood elevations.

93
The mapping was performed done using approximate and detailed methods for the study limits shown below;
Hydrologic modeling: 1-15 to Lake Las Vegas (G.C. Wallace Inc.) Hydraulic modeling: CCRFCD Reach from 1-15 to Flamingo Road (G.C. Wallace Inc.) Hydraulic modeling; SNWA Reach from Flamingo Road to Lake Las Vegas (The Louis
Berger Group)
This reach of Las Vegas Wash had maintenance performed to restore the channel section to its original design dimensions and was last studied in the Las Vegas Valley Flood Insurance Study Hydrology Report, September 1991. Hydrologic Analysis: The watershed tributaries to the Las Vegas Wash have undergone significant development since the 1% annual chance effective flow rates were determined in the 1991 Hydrology Report. The current condition of the watershed more closely resembles the ultimate condition model of the 2002 Master Plan Update (MPU) than of the 1991 Hydrology Report, which reflected existing conditions in 1991. Therefore, the HEC-1 modeling for this project was based from the 2002 MPU, and then reduced down to an existing condition by decreasing curve numbers and adjusting lag times and routing to reflect current development. In general, the modeling guidelines followed those used in the 2002 MPU. The selected approach from the 1991 Hydrology Report was to begin at the upstream end of the study each and move downstream, adopting the largest peak tributary flows as Las Vegas Wash peak flows. The “storm centering” approach was chosen for this report to more accurately portray the existing condition 1% annual chance storm flows in the Las Vegas Wash. A study titled, Storm Sizes and Shapes in the Arid Southwest, suggests that the likelihood of a storm greater than 255 square miles is less than 0.2 percent; 50 percent of the storms analyzed were less than 32 square miles, with a mean storm size of 103 square miles. This study was the basis for the storm centering criteria used in the 2002 and 2008 Las Vegas Valley MPUs, which limited storm centerings to a maximum of 200 square miles. A total of nine storm centerings were evaluated to determine controlling flow rates along the study reach of the Las Vegas Wash. Numerous detention basins impact storm flows from a majority of the watershed tributaries. Consequently, in order to estimate the 1% annual chance flow rate in the Las Vegas Wash, the 2002 MPU examined six different storm centerings, each a 200-square mile elliptical-shaped (2:1 axis ratio) storm. The worst-case storm centering from the Black and Veatch Study is also included as one of the nine storm centerings. The storm centering from the 1991 Hydrology Report that had established the adopted 1% annual chance FIS flow for the Lower Las Vegas Wash at Pecos Drive/ Lake Mead Drive and downstream of Las Vegas Creek was also included as a storm centering. The HEC-1 modeling was based on a 1% annual chance storm frequency, 6-hour duration design storm, with an SDN5 storm distribution. Depth-Area-Reduction-Factors (DARF) were applied in the HEC-1 models in relation to the tributary area to each combination point, based on Table 502 of the CCRFCD Manual. The precipitation values were obtained from NOAA Atlas data, and adjusted by a factor of 1.43 as specified in the CCRFCD Manual. The adjusted rainfall depths range from approximately 2.30 inches to 4.30 inches in the Las Vegas Valley watershed. Most areas have a rainfall depth of 2.77 inches or higher except for the extreme northwest portion of the Valley between the Sheep and Spring Mountains. Land use data for the 2002 MPU and associated amendments was based on zoning information

94
obtained from local entities, and was then converted to the established MPU land use categories. Each land use is defined by a specified percentage of impervious ground, landscaped area in good condition, and amount of desert shrub in poor hydrologic condition. Final curve numbers were determined by extracting curve number data from the ultimate condition HEC-1 models from the 2002 MPU, 2004 Upper Duck Creek MPA, and 2005 Pittman West MPA, then reducing them down based on recent aerial photos to reflect a current, existing condition. The percentage developed was assigned values of 0, 25, 50, 75, or 100. Drainage basins with more than 50 percent of total area developed were considered “developed” for determining lag times. Drainage basins with less than 50 percent of total area developed were considered “existing” for determining lag times. Lag times were calculated using Standard Form 4 from the CCRFCD Manual. Lag times were referenced from HEC-1 models in the previous studies listed above and were adjusted to reflect existing conditions. Initial lengths for “existing basins” were extended to 500 feet. Travel lengths were shortened when initial lengths were lengthened to maintain consistent total travel lengths in the lag time analysis. Initial /overland and travel time slopes were not revised. Lag times for basins greater than one square mile which had previously been analyzed using the U.S. Bureau of Reclamation method were not revised in this analysis. Routings were verified by comparing the regional facility alignments from the 2002 MPU with recent aerial photos to determine if flood control facilities were currently operational. Note that in the 2002 MPU, most routings through flood control facilities used the Muskingum-Cunge method. Routings for existing regional facilities were not changed. Routings for proposed regional storm drain facilities were changed to street flow if aerial photos showed existing street alignments. Muskingum routings were used when street alignments did not exist. Routings for proposed regional open channels were revised by adjusting the Manning’s “n” to represent a natural wash or unlined channel, as shown on the aerial photos. Storm drain was assumed to exist if street improvements could be verified by aerial photo. Routings for storm drain was changed to Muskingum routing if no street improvements were shown, thereby assuming that storm drain improvements were not currently in place. HEC-1 models were constructed for each of the storm centerings using the hydrologic parameters described in the previous paragraphs. Of the nine storm centerings in the hydrologic analysis, only three controlled with respect to the 1% annual chance flow rates in the Las Vegas Wash. The storm centering “B-V” from the Black & Veatch study controlled the northern reach from I-15 to Las Vegas Boulevard. Storm centering “MPU6” controlled only at the Flamingo Wash confluence. The remaining study reaches were controlled by storm centering “MPU1”. Note that the computed area of 58.0 square miles to concentration point 2CLV1B-2 at Owens Avenue in HEC-1 model MPU1 does not match the reported area of 43.6 square miles. This is because GCW manually subtracted the area of 14.4 square miles associated with diversion DLVWH from 2CLV1B-2, as HEC-1 conserves area throughout the model and runoff from diversion DLVWH is not returned to the Las Vegas Wash until downstream of Owens Avenue, at Sandhill Road. A qualitative description of flow increases compared to the Effective flows from the 1991 Hydrology Report is outlined below:
Cheyenne Avenue to Owens Avenue reach shows only a minor increase from the 1991 Hydrology Report due to peak reduction from the Cheyenne Peaking Basin.
Sandhill Road to Sahara Avenue reach shows an increase of two times the Effective 1% annual chance flow from the 1991 Hydrology Report.
Flamingo Wash confluence to Tropicana Avenue reach shows an increase of two and half times the effective 1% annual chance flow from the 1991 Hydrology Report.

95
Duck Creek confluence shows an increase of two times the effective 1% annual chance flow
from the 1991 Hydrology Report.
The flow increases compared to the 1991 Hydrology Report are primarily due to watershed development (increased curve numbers) and the methodology of the 2002 MPU that divided the watersheds into smaller subbasins. Note that the results from the 2002 MPU methodology have been confirmed in recent storm events in highly gauged watersheds throughout the Las Vegas Valley. The revised Las Vegas Wash discharges are reflected in Table 3, Summary of Discharges. Hydraulic Analysis – CCRFCD Reach: The CCRFCD Reach of the Las Vegas Wash main channel was modeled by detailed methods and mapped as Zone AE with BFEs. Breakouts from the main channel were modeled by detailed and approximate methods and mapped as Zone A. HEC-RAS (Version 3.1.3) was used to model the CCRFCD Reach of the Las Vegas Wash main channel and some breakouts from the main channel. Topographic mapping with a contour interval of 1-foot was generated specifically for this project by Airborne 1. Horizontal control is constrained to NAD83/ 1999.37 Nevada East Zone (2701) State Plane Coordinates published values for N.G.S. Monuments V 399 and W 51. Public Land Survey System local monuments as referenced to the project control were used for local area control whenever possible. Elevations are controlled by Clark County Public Works Vertical Control v. 2003 published values. Ground control surveys, check cross sections, and establishment of elevation reference markers were completed by GCW. Cross-section locations were initially cut at intervals of 400 feet and aligned normal to the expected direction of flow. Cross sections were then further refined based on preliminary HEC-RAS models which showed major conveyance changes and ineffective flow areas. Additional cross sections were cut to reduce changes to top width, friction slope, and conveyance between cross sections. All cross sections are oriented left to right facing downstream. The cross section data was derived from the topographic mapping and field survey. Bridge modeling was based on field survey data and topographic mapping. Bridge open areas were normalized to the direction of flow. Composite Manning’s “n” roughness coefficients were calculated based on field surveys and aerial photographs. Cowan’s Procedure was used to account for channel material, degree of irregularity, channel cross-section variation, relative affect of obstructions, vegetation, and degree of meandering. The expansion and contraction loss coefficients used in the HEC-RAS modeling area 0.1 and 0.3 for typical riverine cross sections with gradual changes; 0.3 and 0.5 for cross sections at bridges or elevated roadway crossings. Starting water surface elevations and tie-in locations were based on the following:
Upstream: Set at water surface elevation of 1884.4 feet, based on normal depth slope of 0.5 percent. The tie-in to the Effective floodplain is the downstream face of the I-15 culverts.
Downstream: Set at water surface elevation of 1670.7 feet to match the modeling results from
the Southern Nevada Water Authority (SNWA) Reach by LBG. Breakouts from the CCRFCD Reach of the Las Vegas Wash main channel were modeled using the lateral weir capabilities of HEC-RAS, based on computed water surface elevation. The lateral weir

96
elevations were set at the overbank sections. There are two main assumptions of the lateral weir calculation: (1) weir elevations are fixed and do not erode over time; (2) breakout flows occur perpendicular to the flow direction of the main channel. The result of the significant flow increase since the 1991 Hydrology Report is evident in the golf course areas, where modeling results showed flows several feet up against the neighborhood perimeter walls. Initial split flow modeling through the golf course using the standard method of water surface depth over highest end point of a section yielded unreasonably high breakout flows. Through several site investigations, modeling runs, and discussions with CCRFCD staff, it was decided that if flows up against the walls are less than 18 inches, it is assumed that the wall will hold, and no breakout would occur. If the flow is higher than 18 inches up against the wall, it is assumed to fail. In that case, none of the wall height was taken credit for in the split flow calculation. Additionally, it was assumed that the structure (house) would obstruct the breakout flows, only allowing breakout flow between structures. Floodway modeling was based from the main channel floodplain model. Lateral weirs were removed, and flow rates were set at each cross section to match the post-breakout flow rate at each section from the base model. It was necessary to remove the lateral weirs in the floodway model because the rise in water surface elevation during encroachment would have increased the amount of flow breaking out. Whenever possible, floodway analysis was based on Encroachment Method 4. Encroachment Method 1 was employed based on engineering judgment, when further refinement of the floodway was necessary. Hydraulic Analysis – SNWA Reach: A HEC-RAS model (Version 4.0) was developed for the SNWA Reach of the wash from the intake structure for Lake Las Vegas at the downstream end to the Flamingo Road alignment at the upstream end, which is located about 7.0 miles upstream. The model was developed using the HEC-GeoRAS extension developed by U.S. Army Corps of Engineers, Hydrologic Engineering Center (HEC) for ArcView 3.3 and shape files provided by SNWA. The shape files provided included the stream centerline, main channel banks, flow paths, cross section locations, and land use (Manning's roughness coefficients). Because of changes in the wash, the shape files for the main channel banks, flow paths, and cross section locations were revised to reflect the latest conditions of the wash. Topographic data based on 2005 aerial photography, as-constructed Computer-aided Design files for the Powerline Weir and Upper Diversion Weir structures were also used in the development of the model. The output file from HEC-GeoRAS was imported into HEC-RAS and further revisions were made to the geometry file within the HEC-RAS program. These revisions included filtering of cross section points; incorporating the length across the various reach junctions, providing a single roughness coefficient for the main channel, incorporating in-line weir structures to model the existing weir structures, and adjustments to the bank stations, expansion and contraction coefficients, and ineffective flow boundaries. The downstream boundary for the SNWA Reach of the Las Vegas Wash is the inlet structure for Lake Las Vegas. This structure consists of two 84-inch-diameter culverts and seven 16.5-foot-wide by 8-foot-high reinforced concrete box (RCB) culverts. The inlet for the two 84-inch-diameter culverts is near the right hand side of the structure. These culverts outlet downstream of the lake and were designed to convey the more frequent flood flows downstream of the lake. For large flood events, the flood flows eventually flow through twelve upper level openings and then through the seven RCB culverts and into Lake Las Vegas. The upper level openings have bottom elevation of 1419.3 feet North American Vertical Datum of 1988 (NAVD88) and consist of ten 21- feet wide by 8-feet high openings and two 22-feet wide by 8-feet high openings. The starting water surface elevation at this location was determined to be 1431.40 feet NAVD88 using the discharge rating curve calculated for

97
the inlet structure. Three different data sources were used to define the cross sectional geometry within the model. The first source was the 2005 topographic data developed from aerial photography using a horizontal datum of NAD83 Nevada East, a vertical datum of NAVD88, and English units. The cross section data for the entire reach is based on this source except for the reach in the immediate vicinity of the Powerline Weir and Upper Diversion Weir structures. This source was also used to define the geometric data for all of the weir structures existing at the time the data was developed: (1) Firestation Weir, (2) Rainbow Gardens Weir, (3) Demonstration Weir, (4) Calico Ridge Weir, (5) Bostick Weir, (6) Historic Lateral Weir, (7) Pabco Weir, (8) Visitor Center, and (9) Monson Weir. The second source was the as-constructed plans for Powerline Weir. This source was used to define the cross sectional data for the reach of the wash between about 500 feet downstream of the weir crest and about 350 feet upstream of the weir crest. The third source was the as-constructed plans for the Upper Diversion Weir structure and East Outfall Channel. The 2005 topographic data developed from aerial photography does not reflect the submerged portion of the wash as the result of effluent flows existing within the wash when the photographs were taken. This portion of the channel was assumed to be available to convey the base flows. Therefore, no revisions were made to the geometry based on this data and the hydrology considered in the model was not adjusted for base flows. The Manning's roughness coefficients utilized within the model were defined using the shape file for Land Use provided by SNWA. The shape file was modified: (1) to reflect the present boundaries of the active low flow channel of the wash, (2) the area between the old and present boundaries of the active low flow channel was defined as a new classification, and (3) the limits of the rock toe protection constructed by SNWA was defined as a new classification. The roughness coefficients defined in the database file were estimated using Cowan's Method, which is documented in Open Channel Hydraulics, (Chow, 1959), except for the classification defined by the rock toe protection where the roughness coefficient was estimated using Equations 732 and 733 in Hydrologic Criteria and Drainage Design Manual, (CCRFCD, 1999). Roughness coefficients were defined for the more conservative condition associated with vegetation foliage such as summer conditions. The Land Use shape file and the corresponding database file define the roughness coefficients horizontally along each cross section. A single roughness coefficient was defined for the cross sections. The composite roughness coefficient was estimated using the same equation utilized in the HEC-RAS computer program or directly using the Cowan's Method. The equation was proposed independently by Horton and Einstein, and it is based on the assumption that the flow velocity in each area of the channel is equal to the mean velocity of the whole area. The equation is documented in Open-Channel Hydraulics (Chow, 1959), EM 1110-2-1601 (USACE, 1993), and in the HEC-RAS User's Manual (HEC, 2006). As documented in the HEC-RAS User's Manual (HEC, 2006), the composite roughness coefficients calculated using this equation should be checked for reasonableness because the equation can result in extremely high values. Unfortunately, this was the case for several of the cross sections where unreasonable values were determined due to a small amount of vegetation. Therefore, additional adjustments were considered. The first adjustment was that the upper value for the roughness coefficient was set at 0.065. Second, roughness characteristics were defined for reaches of similar characteristics, i.e., a selected roughness coefficient was applied to reach of the wash. Finally, adjustments were made to provide appropriate flow distribution within the channel and the left and right overbanks. Roughness coefficients for the rip rap lined portion of the wash were estimated using Equations 732 and 733 in Hydrologic Criteria and Drainage Design Manual, (CCRFCD, 1999). As discussed below, there are three flow split reaches. In general, the roughness coefficients for the

98
flow split were determined using the same procedure. The roughness coefficients for the overbank areas were based on the Land Use shapefiles, and the coefficients for the channel were estimated using Cowan's Method or the composite technique mentioned above. Cowan's method was used to estimate the main channel roughness coefficient of 0.035 to 0.040 for the split flow through the Nature Center (Split Flow No. 1) and 0.045 to 0.055 for the split flow reach near the Duck Creek confluence (Split Flow No. 3). A composite value ranging from 0.049 to 0.058 was estimated for the channel of the East Diversion Channel (Split Flow No. 2). The East Diversion Channel includes vegetated benches. The benches were assigned a roughness coefficient of 0.08. The revised Las Vegas Wash Manning’s data is reflected in Table 4, Summary of Manning’s “n” Values. The default values of 0.1 and 0.3 for the contraction and expansion coefficients, respectively, were utilized for most of the cross sections. The coefficients were increased to 0.3 and 0.5, respectively, there the floodplain expands or contracts from a wide floodplain to a narrow floodplain, or where the invert of the main channel rapidly drops or rises. Several of the cross sections contain areas that will not actively convey flow. Ineffective flow boundaries were incorporated into the model to accurately simulate the active flow areas. HEC performed a detailed study of flow contraction and expansion using field data and results from a two dimensional analysis of idealized bridge sites to provide guidance to engineers for computing water surface profiles through a bridge. This study is documented in Flow Transitions in Bridge Backwater Analysis, RO-42, (USACE, 1995) and briefly discussed in the HEC-RAS User's Manual. The results of this study indicate that the contraction ratio was below 1 ft in the longitudinal direction to 1 ft in the lateral direction (1:1) for all of the field prototype cases and ranges from 0.7:1 to 2.3:1 for the idealized cases. The mean and median values for the complete data set were determined to be close to 1:1. The results of the study also indicate that the expansion ratio ranges between 1:1 and 2:1 for most cases, and most of the ratios were approximately 2:1. Therefore, the ineffective boundaries within the model were established using a contraction ratio of 1:1 and an expansion ratio of 2:1. There are several existing weir structures located within the SNWA Reach of the Las Vegas Wash. The weir structures simulated in the model include: (1) Firestation Weir, (2) Powerline Weir, (3) Rainbow Gardens Weir, (4) Demonstration Weir, (5) Calico Ridge Weir, (6) Bostick Weir, (7) Historic Lateral Weir, (8) Pabco Weir, (9) Visitor Center Weir, (10) Monson Weir, and (11) Upper Diversion Weir. Six of the structures (Powerline, Rainbow Gardens, Calico Ridge, Bostick, Pabco, and Upper Diversion) were defined within the model using the In-line Weir option. A weir coefficient of 2.6 was assumed for all of the weir structures except for Rainbow Gardens where a value of 3.0 was assumed. The In-line Weir option was used at these structures because the top of the structures protrude above the thalweg of the wash. The three other structures (Firestation, Demonstration, and Historic Lateral) were defined within the model using the actual geometric data of the structure as defined by the survey data. There are three flow splits within the SNWA Reach of the Las Vegas Wash. All of these splits were included in the model. The first split (Split Flow No. 1) is located near the upstream end of the Nature Center, and it is identified in the HEC-RAS model with a River Title of "LV_Wash ROB" and Reach Title of "NC". It is located within the right floodplain of the wash approximately 6.4 miles upstream of Lake Las Vegas. The Nature Center is surrounded by berms that protect the site from frequent flood events. The berm along the northern edge of the Nature Center that terminates near the Upper Diversion Weir is the Monson Berm. The flood control effects of the berms were not considered in the model; however, the berm along the west side of the wash was used as the dividing point between the cross sections of the Las Vegas Wash and the cross sections for Split Flow No. 1. At this flow split, flow in the right overbank upstream of the Monson Berm will overtop the berm and flow in a southeast direction until it flows back into the wash at the downstream end of the Nature Center,

99
which is about 0.5 miles downstream from the upstream end. The split flow was required to provide appropriate flow distribution within this reach. Initially, the cross sections of the wash within this reach included the overbank area of the Nature Center. However, there were several cross sections that had significantly inconsistent flow distributions between the channel and overbank areas. These inconsistencies could not be eliminated even with adjustments to the Manning's roughness coefficients and ineffective flow areas in the right overbank area. Therefore, the overbank area was modeled as separate reach, and the "Split Flow Optimization" option in the HEC-RAS program was used to determine the flow between these reaches. Split Flow No. 2 is located at the Upper Diversion Weir structure, which is located at about 6.3 miles upstream of Lake Las Vegas. This split flow reach is identified in the HEC-RAS model with a River Title of "East Diversion" and Reach Title of "EDC". Water overtopping the Upper Diversion Weir either continues through the active channel of the wash or is conveyed through the East Outfall Channel. The total width of the weir is about 476 feet. About 200 feet of the weir conveys flow to the East Outfall Channel whereas the other 276 feet of the weir conveys flow to the wash. A pedestrian bridge is located on top of the weir crest. This bridge is supported by two vertical abutments and six 4- foot diameter piers. Three of the piers are located within the portion of the weir that conveys flow to the wash, two of the piers are located within the portion of the weir that conveys flow to the East Outfall Channel, and one of the piers is located at the dividing point between the wash and the East Outfall Channel. As in the first split flow location, the "Split Flow Optimization" option in the HECRAS program was used to determine the flow within the two reaches. Split Flow No. 3 is located near the confluence of Duck Creek and the Las Vegas Wash. This split flow is located approximately 5.1 miles upstream of Lake Las Vegas, and it is located just downstream of the where the Duck Creek channel ends at Broadbent Boulevard. At this flow split location, most of the flow within the right overbank will continue to flow in a southeast direction through a channel located approximately 700 ft south of the main channel and eventually flow back into the wash about 0.6 miles downstream. Low flows from Duck Creek are conveyed through this split flow reach. The upstream end of the model was tied into the HEC-RAS model developed for the CCRFCD Reach by using several cross sections from the upstream model. A total of nine cross sections were utilized to ensure no difference in the water surface elevations at the upstream location. A floodway analysis was conducted using HEC-RAS to define the floodway boundaries for the SNWA Reach of the Las Vegas Wash. The analysis was conducted using the following procedure assuming equal conveyance reduction and no encroachment allowed within the main channel. The initial boundaries were defined using a procedure that uses several different targets in Encroachment Methods 4 and 5 available in the HEC-RAS program. Proceeding from downstream to upstream, the initial boundaries were defined by selecting the encroachment method and targets that result in the surcharge being closest to 1 foot without having significant changes in width and velocities. The encroachment method and target are selected within reaches, and the final model is comprised of reaches with different encroachment methods and targets. The initial boundaries defined by the above procedure were then exported to Encroachment Method 1. Modifications were then made to these boundaries to eliminate any surcharges greater than 1 foot or negative surcharges. The resulting boundaries were then imported in ArcGIS, and further revisions were made to fine tune the final floodway boundaries. A hydraulic analysis was conducted to tie-in the floodplain boundaries for the wash to the floodplain boundaries of the Duck Creek channel. Information related to the floodplain boundaries for the Duck Creek channel is provided in Lower Duck Creek LOMR (GC Wallace, 2005). The Duck Creek

100
channel ends just west of Broadbent Boulevard. The hydraulic analysis was conducted using HECRAS. A HEC-RAS model was developed for a 1,200 foot reach immediately downstream of the Duck Creek channel, and it will be referred to as the "Duck Creek tie-in reach" in this report. As in the Las Vegas Wash model, the model for this reach was developed using the HECGeoRAS extension. The Manning's roughness coefficients used in the model are based on the same method considered for the Las Vegas Wash model. Ineffective flow boundaries were reflected in the cross sections since the Duck Creek channel contains the 1% annual chance flood event. The upstream most cross section in the model corresponds to the downstream most cross section used in the effective model for the Duck Creek channel, and there is no difference in the base flood elevations at this location. The hydraulics for the Duck Creek tie-in reach were evaluated for two hydrologic conditions. The first condition consists of the peak discharge for Las Vegas Wash with the coincident discharge for Duck Creek. For this condition, the discharge for Duck Creek was determined to be 1,892 cfs. Using the model developed for Las Vegas Wash, the water surface elevation at the downstream boundary for this condition was determined to be 1603.02 feet NAVD88. The second condition consists of the peak discharge for Duck Creek with no flow contributing from the wash. As defined in the Duck Creek channel LOMR, the 1% annual chance peak discharge for Duck Creek is 11,500 cfs. The Las Vegas Wash model was used to estimate the water surface elevation at the downstream boundary. However, the water surface elevation was below the elevation associated with critical depth, so the downstream boundary for the second condition is based on critical depth. A comparison of the results from these two conditions indicates that the second condition would result in higher water surface elevations. Therefore, the second condition was used to define the 1% annual chance floodplain boundaries within this area. US 95/Rancho Drive Flood Hazard Mapping Restudy Authority and Acknowledgements: The US95/Rancho Drive Flood Hazard Mapping Restudy was performed by the Louis Berger Group for the City of Las Vegas Flood Control Section. This work was completed in November of 2006. Scope: The purpose of this study was to determine the limits of the flood hazards along the reach of Rancho Drive and US-95 as they are affected by new hydrologic modeling, new regional drainage facilities, updated topographic mapping and development within the study area. The restudy updated the Effective Flood Insurance Studies which have already been approved by the Federal Emergency Management Agency (FEMA), the City of Las Vegas and the Clark County Regional Flood Control District (CCRFCD). Modifications were made to the Effective models to reflect the six new flood control projects and to take advantage of the new Lateral Weirs Option in HEC-RAS. The six flood control facilities recently constructed in the study area include: Gowan North System – Phase III: Durango Drive to Lone Mountain Road (herein referred to as the Gowan North-Lone Mountain Channel): This facility consists of a reinforced concrete channel with a base width of 22’ to 24’ and double 16’ x 5’ reinforced concrete boxes (RCB). The facility extends from Lone Mountain Road to the intersection of Alexander Road and Durango Drive. The channel is part of the Gowan North Channel system which ultimately drains into the Gowan North Detention Basin.
Buffalo Drive Cheyenne Avenue to Lone Mountain Road (herein referred to as the Gowan North-Buffalo Branch): The project included the installation of 5,666 ft of RCB storm drain

101
and collection system between Lone Mountain Road and Alexander Road. The storm drain connects to the Gowan North Channel which drains into the Gowan North Detention Basin. The RCB ranges in size from 11’ x 5’ RCB at the upstream end to double 12’ x 6’ at the downstream end. The design flow rate increases from 441 cfs at the upstream end to 909 cfs at the downstream end.
Las Vegas Beltway Ann Road to El Capitan Way (herein referred to as the Beltway Channel):
The Beltway Channel was designed and constructed in conjunction with the Las Vegas Beltway project. The concrete channel is rectangular with a 10 ft bottom and 5 ft walls. The channel was designed to intercept and convey a 1-percent annual chance flow of 313 cfs. The flow ultimately drains into the Fort Apache Detention Basin.
Rancho Drive Drainage Improvements – Smoke Ranch to the Carey-Lake Mead Detention
Basin (herein referred to as the Rancho Drive Storm Drain): This project consists of a double 12’ x 8’ RCB in Rancho Drive between the Peak Channel and Smoke Ranch Drive. At Smoke Ranch the RCBs turn east and discharge into an open channel to the Carey/Lake Mead Detention Basin.
Vegas Drive/Owens Avenue Roadway Improvements (herein referred to as the Vegas Drive
Storm Drain): This storm drain project consists of an 84-inch RCP between Rancho Drive and I-15. The storm drain system was designed to capture a 470 cfs at the intersection of Rancho Drive and Vegas Drive.
Ann Road (CAM-10) Detention Basin: This detention basin was designed to capture and
detain a 1-percent annual chance inflow 3,123 cfs. The 54” RCP outlet pipe with 30-inch orifice plate limits outflow to 156 cfs. The project also includes a 4,665 ft long trapezoidal collector channel designed to convey a flow ranging from 29 cfs to 1,229 cfs. The channel is trapezoidal in shape with a 10 ft bottom and 4:1 (horizontal:vertical) side slopes. The basin has a clear water storage capacity of 305 ac-ft. An additional 40 ac-ft was incorporated into the design to accommodate sediment accumulation. Therefore, the total storage volume of the basin is 345 ac-ft.
Hydrologic Analysis: The restudy used hydrologic models from the US-95/Rancho Drive and North Las Vegas studies in the effective FIS as a base for hydrologic modeling in HEC-1. The drainage basins are the same as those in the effective HEC-1 models except for two changes:
Basin CRAIG from the US 95 and Rancho Drive FISR was subdivided into 10 sub-basins: CAM-10A through CAM-10D, CAMDK1 through CAMDK3, and CRAIG1 through CRAIG5.
Basin HICKAM from the US 95 and Rancho Drive FISR was subdivided into HICKAM1
through HICKAM3. The curve numbers for the new sub-basins are the same as those used in the Effective FISR for CRAIG and HICKAM. Lag times were recalculated for the new sub-basins. Eighteen (18) diversions were added or modified within the effective HEC-1 models to account for the new drainage facilities and application of the new lateral weir option in HEC-RAS.

102
The new flood control projects did not affect flow rates along US 95 north of Red Coach Avenue. Therefore, for this Restudy, Red Coach Avenue is the northern limit of study along US 95. US 95 was the eastern limit of study and Gowan Road was the southern limit. South of Red Coach Avenue, the flows were significantly reduced due to diversions into the Ann Road (CAM10) Detention Basin, Beltway Channel, Gowan North Lone Mountain Channel, Gowan North Buffalo Branch and Ann Road (CAM10) Detention Basin. The 1% annual chance flood flow along US 95 was reduced on average by approximately 40 percent. For example, the effective base flow at Alexander Road was 2,640 cfs compared to the proposed base flow of 1,679 cfs. The base flow along Gowan Road was reduced by approximately 35 percent. There are three locations where flow breaks out of Gowan Road: 1) Maverick Street; 2) Jones Boulevard, and 3) the True Value Hardware alleyway. At Maverick Street, neither of the effective studies had a diversion. A diversion was added in this Restudy based on the HE-CRAS model for Gowan Road. In the proposed HEC-1 models, 188 cfs is diverted north on Maverick Street to Duncan Road then east to Rancho Drive. At Jones Boulevard, flow breaks out from Gowan Road, turns east on the first two streets parallel to Gowan, and eventually drains to the intersection of Rancho Drive and Michael Way. The Jones Boulevard diversion rating curve from the effective FIS was not revised for this Restudy. The flow diversion in the effective FIS HEC-1 model is 871 cfs compared to 442 in the proposed model. Along Rancho Drive, the flood control projects did not affect flow rates north Craig Road. Therefore, Craig Road is the northern limit of the Restudy. Rancho Drive was the eastern limit of the Restudy. The boundary of the Effective Zone A south of Vegas Drive is the southern limit of the Restudy. Between Craig Road and Alexander Road, the proposed base flow is within 30 cfs of the effective flow. Significant reductions occur south of Alexander Road where the proposed base flow is up to 60 percent less than the effective flow. For example, south of Alexander Road the effective flow is 1,353 cfs and the proposed base flow is 541 cfs. Downstream of Gowan Road, the base flow rates were decreased significantly. For example, the base flow rate at Cheyenne Avenue decreased from 2,018 cfs in the effective FIS to 617 cfs. The Peak Diversion Channel which flows into the new 12’ x 8’ RCB in Rancho Road intercepts 100 percent of the 1%-annual-chance flood flow and conveys it to the Carey-Lake Mead Detention Basin. The RCB begins approximately 3,300 feet north of the Smoke Ranch-Rancho Drive intersection. It runs south to Smoke Ranch and turns east out of the study area to the Carey-Lake Mead Detention Basin. Further downstream, 100 percent of the 1%-annual-chance flow along Rancho Drive is intercepted by storm drains in Smoke Ranch Road and Lake Mead Drive. Finally, 350 cfs is diverted into the new Vegas Drive storm drain. Only 7 cfs bypasses the Vegas Drive intersection and continues south along Rancho Drive. Hydraulic Analysis – US-95 Reach: The Louis Berger Group merged the three effective HEC-RAS models along US 95 into one. In the effective FIS, separate HEC-RAS models were used for different segments. Physical changes to the HEC-RAS model were minimal. Due to development in the vicinity, new aerial topographic data was collected for the Craig Road intersection in October 2004. New cross

103
sections (from Station 39+14 to Station 66+27, inclusive) were extracted from the new topographic data using GEO-HECRAS. All other geometric data for the model is identical to the effective model. The proposed and effective flows are identical upstream of Station 64+06. The reduction in flow at that point affects the BFEs up to Station 77+37. The difference is less than 0.5 feet at Station 69+82. This is the point Berger recommends the new floodplain mapping should tie into the existing floodplain. From Station 69+82 to Station 0+00 the proposed BFE is lower than the effective BFE by up to 2.52 feet. The decreases of BFE are mostly because 1) At Alexander Road, the flow has been reduced by approximately 50 percent, and 2) the flow over West Alexander Road and US 95 has been eliminated. Hydraulic Analysis – Gowan Road Reach: A new HEC-RAS model was created for Gowan Road Reach. GEO-HECRAS was used to extract cross section data from the topographic data. Ineffective areas were used to limit active flow to Gowan Road due to the presence of walls on either side of the road. In areas where homes face the streets, many homes have decorative walls or fences that limit the conveyance outside of the street right-of-way. A roughness coefficient of 0.02 was chosen for the street. Flows were obtained from the proposed HEC-1 model. There are no bridges or culverts in this model. The Gowan HECRAS model begins at the Rancho Drive intersection and ends immediately downstream of the US 95 overpass. The water level in Gowan Road does not impact the water surface profile along US 95 because there is a four foot drop over a retaining wall behind the north sidewalk along Gowan Road. With the completion of the recent flood control projects, the flooding along Gowan Road should be limited to street and nuisance flooding in the yards. The maximum proposed 1%-annual-chance depth of flooding is 2.65 feet. Throughout the model, the water surface elevation was at or below critical depth. Therefore, critical depth was used for the proposed BFE. A sensitivity run was made using a roughness of 0.03 instead of 0.02. The flow was very near critical depth. Therefore, the BFEs would change very little even if the higher roughness were used. Hydraulic Analysis – Upper Rancho Drive (North of Gowan Road) Reach: Berger merged two effective HEC-RAS models into a single model. No modifications to cross sections or other geometric data in the Effective model were made. New flows were developed using HEC-1 and these flows were input into the proposed HEC-RAS model. Upstream of Station 70+16 the flows in the proposed model are identical to the effective model flows, therefore, no changes were made on floodplain mapping. The difference between the effective BFE and the proposed BFE exceeds 0.5 feet between Station 67+63 and Station 66+09 (170 to 325 feet south of Craig Road) and between Station 52+64 and Station 36+66 (1,300 feet north to 200 feet south of Alexander Road). The total length of channel where the effective BFE is more than 0.5 feet less than the proposed BFE is only approximately 1,800 feet out of 13,266 feet of stream. The maximum difference in BFE is a 1.77 feet reduction in depth at Station 67+63. Hydraulic Analysis – Lower Rancho Drive (South of Gowan Road) Reach: A new HEC-RAS model was created for Lower Rancho Drive Reach. GEO-HECRAS was used to extract cross-section from the new topographic data and create a HEC-RAS model. The upstream end of the Lower Rancho Drive Reach model exactly matches the downstream end of Upper Rancho Drive

104
Reach model. Driveway culverts were field measured (not surveyed) and included in the proposed model. The land slopes from east to west in the vicinity of this study. The east side of Rancho Drive is lower than the road and continues to fall for several miles to Lake Mead. Ineffective flow areas at the east curbline were used to prevent HEC-RAS from using the area east of Rancho Drive as effective flow area. The cross sections were not cut off at that curbline because this would have caused errors in the Triangulated Irregular Network (TIN) surface. The effective SFHA for the Lower Rancho Drive Reach is designated as Zone A. The recent flood control projects have reduced the base flow south of the Gowan Road intersection from 1,207 cfs to 439 cfs. Several large regional flood control facilities along streets running perpendicular to Rancho Drive collect Rancho Drive flows. The flow that exited Gowan Road at Jones joins Rancho Drive near the intersection of Michael Way. There is a flood control channel with a double 6’ x 2’ RCB crossing under Rancho Drive just south of the Michael Way intersection that captures a portion of this flow. The Rancho Drive - Michael Way intersection flooded during the 2003 flood and most of the water flowed south on Michael Way to Arlene Way and Maxine Place. A portion of the flow entered the channel behind Sterling Auto and the remainder flooded apartments on Maxine Place that were built on grade then flowed south to West Cheyenne Avenue. The flow flows on Rancho Drive have been reduced by 67 percent. Approximately 87 percent of the proposed flow is diverted down Michael Way. Approximately 800 feet south of the Michael Way intersection (at Station 157+07) the ground slopes west away from Rancho Drive. Any flow higher than the top of curb line in Rancho Drive will flow west to the parking lot behind the Sterling Auto Body Center. The development provided a 70-foot wide flood easement over their parking lot. The total proposed base flow in both Rancho Drive and Michael Way is 723 cfs. The parking lot has capacity to convey the base flood through the site. The depth of the proposed 1% annual chance flow through the parking lot is approximately 1.4 feet. All of the flow from Michael Way and the flow in the Sterling Auto Body Center parking lot will eventually flow to West Cheyenne Avenue and turn east towards Rancho Drive. At Cheyenne, the water has three potential flow paths. A portion of the flow will split down Hazelnut Lane, a portion will flow through the shopping center parking lot and a portion will continue to Rancho Drive. The shopping center buildings are elevated at least a foot above the parking lot. The flow through the shopping center will be intercepted by a ditch along the south line of the shopping center parking lot and be diverted east the ditch along the west side of Rancho Drive. The flow down Hazelnut will flow through the parking lot of the new commercial buildings and into a ditch along the sound walls to rancho Drive at Station 130+38. Just north of the southern Decatur intersection the 20’ wide Peak Channel intercepts all of the flow in the excess of the gutter flow in Rancho Drive (Station 113+00). The City constructed a 12’ x 8’ RCB under Rancho Drive from that point down to Smoke Ranch. At Smoke Ranch this RCB discharges to an 11’ x 11’ RCB that runs down Carey to the Lake Mead Carey Detention Basin (Station 79+50). The design capacity of the 12’ x 8’ RCB is 1,256 cfs. The proposed 1% annual chance flow is only 742 cfs. A normal depth calculation for the 742 cfs shows that the depth of flow in the RCB is less than four feet. Below Peak Drive, the flows along Rancho Drive never build up enough to justify maintaining the

105
Zone A floodplains. An existing 84” RCP in Lake Mead Boulevard diverts water from Rancho Drive to the Carey-Lake Mead Detention Basin (Station 79+50). There is no flow along Rancho Drive south of Lake Mead Boulevard. Levee Hazard Analysis Some flood hazard information presented in prior FIRMs and in prior FIS reports for Clark County and its incorporated communities was based on flood protection provided by levees. Based on the information available and the mapping standards of the National Flood Insurance Program (NFIP) at the time that the prior FISs and FIRMs were prepared, FEMA accredited the levees as providing protection from the flood that has a 1-percent annual chance of being equaled or exceeded in any given year. For FEMA to continue to accredit the identified levees with providing protection from the base flood, the levees must meet the criteria of the Code of Federal Regulations, Title 44, Chapter I, Section 65.l0 (44 CFR 65.l0), titled "Mapping of Areas Protected by Levee Systems." On August 22, 2005, FEMA issued "Procedure Memorandum No. 34 - Interim Guidance for Studies Including Levees." The purpose of the memorandum was to help clarify the responsibility of community officials or other parties seeking recognition of a levee by providing information identified during a study/mapping project. Often, documentation regarding levee design, accreditation, and the impacts on flood hazard mapping is outdated or missing altogether. To remedy this, Procedure Memorandum No. 34 provides interim guidance on procedures to minimize delays in near-term studies/mapping projects, to help our mapping partners properly assess how to handle levee mapping issues. While documentation related to 44 CFR 65.10 is being compiled, the release of a more up-to-date FIRM for other parts of a community or county may be delayed. To minimize the impact of the levee recognition and certification process, FEMA issued "Procedure Memorandum No. 43 - Guidelines for Identifying Provisionally Accredited Levees" on March 16, 2007. These guidelines allow issuance of the FIS and FIRM while levee owners or communities compile full documentation required to show compliance with 44 CFR 65.10. The guidelines also explain that a FIRM can be issued while providing the communities and levee owners with a specified timeframe to correct any maintenance deficiencies associated with a levee and to show compliance with 44 CFR 65.10. FEMA contacted the communities within Clark County to obtain data required under 44 CFR 65.10 to continue to show the levees as providing protection from the flood that has a 1-percent annual chance of being equaled or exceeded in any given year. FEMA understood that it may take time to acquire and/or assemble the documentation necessary to fully comply with 44 CFR 65.10. Therefore, FEMA put forth a process to provide the communities with additional time to submit all the necessary documentation. For a community to avail itself of the additional time, it had to sign an agreement with FEMA. Levees for which such agreements were signed are shown on the final effective FIRM as providing protection from the flood that has a 1-percent annual chance of being equaled or exceeded in any given year and labeled as a Provisionally Accredited Levee (PAL). Communities have two years from the date of FEMA's initial coordination to submit to FEMA final accreditation data for all PALs. Following receipt of final accreditation data, FEMA will revise the FIS and FIRM as warranted. FEMA coordinated with the local communities and other organizations to compile a list of levees, based on information from the FIRM and community provided information. Approximate analyses of "behind levee" flooding were conducted for the levees which were not certified, to indicate the extent of the "behind levee" floodplains. If base flood elevations were not available they were estimated from effective FIRM maps and available information. Topographic features such as highways, railroads and high ground were used to refine approximate floodplain boundary limits.

106
The methodology used in these analyses is discussed below. See Table 8 for the list of levees requiring flood hazard revisions. Levee Inventory IDs 800, 1400, and 2100, were approved as PALs. Based on 5 foot contours from Clark County, the approximate areas of 1-percent annual chance flooding in the event of failure of the levees were determined based on engineering judgment and mapped as areas protected from the 1- percent annual chance flood. Levee Inventory IDs 700 and 2200 were declined PAL offers. As a result, the historic Zone X (shaded) delineation adjacent to the Muddy River (Levee 700) was converted to an approximate Zone A. For Levee 2200, the water surface elevations from the Colorado River were used in conjunction with 10 meter U.S.G.S. NED data to refine the boundaries of the along the right overbank to reflect levee failure conditions. The Levee along Drake Channel was accredited through LOMR 03-09-0270P. As a result, the approximate area of 1-percent annual chance flooding located behind the levee was revised to show the area as protected from the 1-percent annual chance flood. Since sending out letters to the Cities of Las Vegas, North Las Vegas, Henderson and the U.S. Bureau of Reclamation in September 2008, to provide the opportunity to receive a PAL, FEMA and the Clark County Regional Flood Control District (CCRFCD) have identified an additional levee in the unincorporated area of Clark County (adjacent to Tributary K). Based on coordination with CCRFCD, the structure with identification number 4000 does not meet FEMA mapping criteria found in the Code of Federal Regulations, Title 44, Section 65.10 (44 CFR 65.10) . Therefore, this levee was not provisionally accredited, and has been deaccredited on the new DFIRM panels. The approximate area of 1-percent annual chance flooding in the event of failure was determined based on engineering judgment and mapped as an area not protected from the 1-percent annual chance

Community Flood Source Levee Inventory IDCoodinate
Latitude/LongitudeFIRM Panel USACE Levee
City of Las Vegas Las Vegas Wash 800(‐115.272, 36.334) (‐115.240, 36.334)
1734F, 1735F No
City of North Las Vegas Range Wash Fan 1400(‐115.115, 36.307) (‐115.033, 36.326)
1786F, 1790F, 1800E No
City of Henderson Unnamed Washes 2100(‐114.992, 36.014) (‐114.921, 35.987)
2620F, 2975F No
City of Henderson Drake Channel None(‐114.922, 36.035) (‐114.916, 36.028)
2620F No
Clark County Unincorporated Area
Colorado River 2200(‐114.639, 35.093) (‐114.629, 35.045)
4060F, 4080F, 4070F, 4090F
No
Clark County Unincorporated Area
Muddy River 700(‐114.498, 36.621) (‐114.494, 36.615)
1105F No
Clark County Unincorporated Area
Tributary K None(‐114.639, 35.123) (‐114.637, 35.122)
4060F No
Table 8 ‐ LIST OF LEVEES REQUIRING FLOOD HAZARD REVISIONS

108
Letters of Map Change (LOMCs)
Table 9, Letters of Map Change, includes the LOMRs that have been incorporated through this revision. In addition, changes established by these LOMRs have also been incorporated into Table 3, Summary of Discharges, Table 5, Floodway Data, and Exhibit 1, Flood Profiles, where applicable. Table 7, Letters of Map Change, includes previously incorporated LOMR’s.
TABLE 9 – LETTERS OF MAP CHANGE
PROJECT STREAM DATE
CITY OF HENDERSON Green Valley Crossing Unnamed Tributary to Pittman
WashDecember, 30, 2009
Duck Creek Channel Improvements Duck Creek September 16, 2009Monument at Calico Ridge Unnamed Tributary to C-1
ChannelJune 17, 2009
Pittman-Pecos Conveyance System East Tributary to Pittman Wash, Tributary 1 to East Tributary to Pittman Wash
February 26, 2009
Gibson Channel To Desert Canyon Open Space Unnamed Tributary 1 & 2 to Las Vegas Wash
December 29, 2008
Eastside Manor Master Plan Unnamed Tributary 1 & 2 to Las Vegas Wash
December 5, 2008
Pittman Wash Eastern Arch Culvert Unnamed Tributary 1 & 2 to Pittman Wash
November 10, 2008
Calico Terrace Unit 3 Unnamed Tributary to Las Vegas Wash
September 17, 2008
Hilton Grand Vacations Club Unnamed Tributary to Las Vegas Wash
June 26, 2008
Arroyo Grande & Sunset Unnamed Wash April 29, 2008BLM 115 Channel Pittman Wash April 28, 2008Horizon Foothills Market Place Unnamed Tributary to Pittman
WashFebruary 27, 2008
Coronado Canyon Unnamed Tributary to Pittman Wash
January 29, 2008
Cornerstone Development Unnamed Tributary to Pittman Wash
September 10, 2007
Stephanie and Arroyo Grande Unnamed Tributary to Pittman Wash
August 29, 2007
Jubilee Heights Unnamed Tributary to Pittman Wash
July 31, 2007
Lake Las Vegas Parcel 17 Las Vegas Wash, Unnamed Tributary to Las Vegas Wash
June 8, 2007
St. Rose Court Unnamed Tributary to Pittman Wash
February 28, 2007
Clear River Falls Unnamed Wash February 16, 2007Lake Mead Commons Unnamed Tributary to C-1
ChannelJanuary 19, 2007
Boulder Creek Phase 1 Unnamed Tributary to C-1 Channel
December 18, 2006

109
TABLE 9 – LETTERS OF MAP CHANGE (Cont’d)
PROJECT STREAM DATE
CITY OF HENDERSON (Cont’d) Ladera Villas Unnamed Tributary to Pittman
WashNovember 3, 2006
St. Rose/Seven Hills Commercial Center Unnamed Tributary to Pittman Wash
October 26, 2006
Green Valley 45 Unnamed Tributary to Pittman Wash
September 8, 2006
Stone Lake Village Unnamed Tributary to Pittman Wash
August 31, 2006
Mission Drive C-1 Channel August 24, 2006Tuscany Master Planned Community C-1 Channel March 13, 2006Upper and Middle Reaches of the C-1 Channel-
Phase II C-1 Channel February 8, 2006
Boulder Highway Channel Unnamed Tributary 1 and 2 to C-1 Channel
February 8, 2006
Pittman Wash Vicinity of Eastern Avenue and 215 Beltway
Pittman Main Wash, Tributary of East Tributary (ET), Tributary 1 and 2 of East Tributary (T1ET) (T2ET), Tributary 1 - 4 of Pittman Main Wash (T1PMW) (T2PMW) (T3PMW) (T4PMW)
February 8, 2006
Lower Duck Creek LOMR Duck Creek, Pittman Wash February 2, 2006Foxhall/Skyline Phase II LOMR Unnamed Wash December 7, 2005Eagle Crest Townhomes Unnamed Tributary to Las
Vegas WashDecember 5, 2005
Traverse Pointe Unnamed Tributary to Pittman Wash
September 8, 2005
Astoria at Horizon Ridge Arch Storm Drain (CCRFCD Facility PTPW 0110)
Unnamed Tributary to Pittman Wash
August 2, 2005
Terrazzo II Unnamed Tributary to Pittman Wash
July 21, 2005
Concordia at Arroyo Grande Unnamed Tributary to Pittman Wash
April 11, 2005
Green Valley Area Unnamed Wash 1-4 November 22, 2004Stephanie/1-215 Unnamed Tributary to Pittman
WashAugust 19, 2004
Pittman East Detention Basin Pittman Wash June 3, 2004The Golf Course at Foothills Unnamed Wash June 3, 2004Lake Las Vegas Spillway Improvements Blue Diamond Wash-Middle
and North Branch, Duck Creek, Duck Creek South Channel, Duck Creek Tributary
February 12, 2004
Boulder Creek Phase 2 Unnamed Tributary to C-1 Channel
The Gables Condominiums Unnamed Wash January 30, 2004Indian Row Court Pittman Wash Unnamed
Tributary to C-1 Channel January 16, 2004

110
TABLE 9 – LETTERS OF MAP CHANGE (Cont’d)
PROJECT STREAM DATE
CITY OF HENDERSON (Cont’d) C-1 Channel System FIS Restudy C-1 Channel, Henderson Basin,
Unnamed Tributary to C-1 Channel
November 6, 2003
Lake Valley Estates Unnamed Wash November 6, 2003Balboa South (Residential Development) C-1 Channel November 6, 2003Resort at Green Valley Ranch – Carnegie Road Pebble Creek Channel March 19, 2003Resort at Green Valley Ranch Pebble Creek Pebble Creek Channel,
Unnamed TributaryMarch 19, 2003
Inspiration at Green Valley Ranch Unnamed Tributary to Pittman Wash
March 19, 2003
Pioneer Detention Basin Unnamed Tributary to Pittman Wash
January 14, 2003
Horizon/Cielo Abierto Apartments Unnamed Wash July 18, 2002Maryland Hills Pitman Wash – Eastern (PETA)
Unnamed WashJuly 15, 2002
CITY OF LAS VEGAS Rancho Roadway Improvements Unnamed Wash May 9, 2007 Village at Queensridge Unnamed Wash October 19, 2006 Queensridge Place Unnamed Wash September 21, 2006 Kermit Booker Elementary School Unnamed Tributary to Las
Vegas Wash June, 23 2006
Lone Mountain Apartments Unnamed Wash Along North Rancho Drive
January 12, 2006
300 Elliott Unnamed Wash Along US HWY 95
December 31, 2003
Summerlin Village 3 Parcel C (Canyon Terrace) Unnamed Wash (Angel Park) August 18, 2003 Gowan/Bradley Flood Insurance Study Unnamed Wash July 9, 2002
CITY OF NORTH LAS VEGAS Deer Springs Town Center Las Vegas Wash June 8, 2009“A” Channel – Craig Confluence Project Unnamed Tributary to
Unnamed Tributary to Las Vegas Wash
August 29, 2008
Southern Nevada Lumber Unnamed Tributary to Range Wash
October 31, 2007
Upper Las Vegas Wash Channel Las Vegas Wash September 28, 2007Laurel Canyon Drainage Facilities Unnamed Wash August 29, 2007Bruce and Hammer Las Vegas Wash, Unnamed
Tributary to Las Vegas Wash June 29, 2007
Update to Interim Northern Beltway Improvements
Unnamed Wash June 25, 2007

111
TABLE 9 – LETTERS OF MAP CHANGE (Cont’d)
PROJECT STREAM DATE
CITY OF NORTH LAS VEGAS (Cont’d) Walnut and Mitchell Unnamed Tributary to Range
WashMarch 27, 2007
Collins Development Las Vegas Wash January 31, 2007Villages at Sierra Ranch Unnamed Tributary to Las
Vegas WashJuly 19, 2006
Centennia/Clayton Unnamed Wash March 30, 2006Aliante Parcel 31 Unnamed Wash January 26, 2006Alexander Channel – Commerce Street to the
Western Tributary Unnamed Tributary to A Channel
January 19, 2006
Eldorado No. 17 Improvements Unnamed Washes May 3, 2005Eldorado No. 18 Improvements Unnamed Wash November 10, 2004Northstar Estates Unnamed Tributary to Las
Vegas WashSeptember 27, 2004
Walnut Green Unnamed Wash June 15, 2004Gowan Detention Basin Outfall Unnamed Tributary to Las
Vegas WashFebruary 26, 2004
Las Vegas Wash and Unnamed Tributary to Las Vegas Wash
Unnamed Tributary to Las Vegas Wash
December 11, 2003
Commerce / Western Tributary Unnamed Tributary to Las Vegas Wash
June 26, 2003
Interim Northern Beltway Improvements / NLV 1905 Acre
Unnamed Watershed February 20, 2003
UNINCORPORATED AREAS Duck Creek Channel – Las Vegas Blvd Lower Duck Creek Detention Basin P&S Metals Duck Creek Channel Improvements
Duck Creek, Duck Creek Tributary, Duck Creek South Channel, Park Tributary to Duck Creek
Tropicana Wash – North Branch
Duck Creek
October 15,2010 June 28, 2010 September 16, 2009
Hard Rock Channel Tropicana Wash – Central Branch
June 29, 2009
Silverado/Shelbourne Channel Culvert Blue Diamond Wash Middle Branch Right Bank Overflow
June 25, 2009
Pittman-Pecos Conveyance System East Tributary to Pittman Wash, Tributary 1 to East Tributary to Pittman Wash
February 26, 2009
Blue Diamond Springs Blue Diamond Wash Middle Branch and Left Bank Overflow
November 12, 2008
Silverado Ranch Courts Duck Creek, Duck Creek South Channel
October 14, 2008
F4 Basin and Channel Unnamed Tributary to Flamingo Wash
September 30, 2008
Cactus Detention Basin and Outfall Pittman Wash July 28, 2008
TABLE 9 – LETTERS OF MAP CHANGE (Cont’d)

112
PROJECT STREAM DATE UNINCORPORATED AREAS (Cont’d) Robindale Ranch Blue Diamond Wash North
BranchJune 26, 2008
BLM 115 Channel Pittman Wash April 28, 2008Hard Rock Casino Hotel Tropicana Wash Central
Branch Upstream and Downstream
February 14, 2008
Sunset and Jones Tropicana Wash South Branch September 12, 2007
Lake Las Vegas Parcel – 17 Las Vegas Wash, Unnamed Tributary to Las Vegas Wash
June 8, 2007
Panorama Towers I, II and III Tropicana Wash Central
Branch – Breakout Flow May 18, 2007
Ford / Conquistador Blue Diamond Wash April 20, 2007Midbar Drainage Facility Blue Diamond Wash Middle
BranchMarch 22, 2007
St. Rose Court Unnamed Tributary to Pittman Wash
February 28, 2007
Green Park, South Box Structure Duck Creek February 15, 2007Upper Flamingo Diversion Channel Tropicana Wash North Branch December 11, 2006Robindale / Royal Oaks Unnamed Tributary to Duck
CreekNovember 22, 2006
Grande Point Duck Creek, Duck Creek South Channel
October 31, 2006
Vegas Grand Flamingo Wash, Tropicana Wash – Central Branch
October 24, 2006
Upper Blue Diamond Diversion Channel and Rainbow Boulevard Collector
Blue Diamond Wash, Tributary 1 – 5 to Tropicana Wash, Virgin River
September 6, 2006
Villages at Sierra Ranch Unnamed Tributary to Las Vegas Wash
July 19, 2006
Adam and Eve Night Club Tropicana Wash Central Branch
June 22, 2006
Lower Flamingo Diversion Channel Corrections
Tropicana Wash North / Central / South
April 27, 2006
Tuscany Master Planned Community C-1 Channel March 13, 2006Santa Margarita/Patrick Unnamed Tributary to
Tropicana Wash North Branch
February 28, 2006
Rhodes Ranch Golf Country Club and Parcel 14 Unnamed Tributary to Tropicana Wash
February 23, 2006
Central Branch of Tropicana Wash LOMR Reissues
Central Branch of Tropicana Wash
February 13, 2006
Silverado Pines Unit No. 3 Duck Creek South Channel February 9, 2006Lower Duck Creek Duck Creek, Pittman Wash February 2, 2006

113
TABLE 9 – LETTERS OF MAP CHANGE (Cont’d)
PROJECT STREAM DATE UNINCORPORATED AREAS (Cont’d) Pittman Wash Vacinity of Eastern Ave and 215 Beltway
Pitman Main Wash, Tributary of East Tributary, Tributary 1 of East Tributary, Tributary 1 of Pittman Wash, Tributary 2 of East Tributary, Tributary 2 of Pittman Wash
December 29, 2005
Green Park, North Box Structure Duck Creek, Duck Creek Tributary
December 1, 2005
Tropicana Detention Basin Tropicana Wash June 20, 2005Warmington Homes at Section 10 – Hampton
Villages Unnamed Tributary to
Tropicana WashApril 19, 2005
C-1 Channel System FIS Restudy C-1 Channel, East C-1 Detention Basin, Henderson Basin, Unnamed Tributary to C-1 Channel
November 6, 2003
Silver Springs – Unit C Duck Creek September 11, 2003Hollywood Highlands East Nos. 6 & 9 Unnamed Wash to Slone
ChannelSeptember 8, 2003
Duck Creek/Blue Diamond Washes FIS Restudy
Blue Diamond Wash Mid and North Branch, Duck Creek, Duck Creek South Channel, Duck Creek Tributary
August 13, 2003
Tropicana Wash & Tributaries Upstream of Proposed Lower Flamingo Diversion Channel
North, Central and South Branch of Tropicana Wash
June 19, 2003
Southern Vista Estates Diversion Channel and Berm
Unnamed Wash January 27, 2003
Orleans Hotel and Casino – Flamingo Wash Box Culvert
Flamingo Wash August 1, 2002
Range Wash Confluence Detention Basin and Sloan Channel
Sloan Channel May 28, 2002
Pittman Stephanie Regional Facility (Horizon Ridge to Paseo Verde)
Existing Stormdrain May 21, 2002


![NON-RELOCATION AGREEMENT by and between CLARK …...DRAFT 1.10.2018 NON-RELOCATION AGREEMENT by and between CLARK COUNTY STADIUM AUTHORITY, and [TEAMCO] Clark County, Nevada](https://img.dokumen.tips/doc/110x75/5e4a6798dd7aee229466bddf/non-relocation-agreement-by-and-between-clark-draft-1102018-non-relocation.jpg)