Embed Size (px)
Citation preview
Selection indexes such as Net Merit $ (NM$) are important
components of any genetic selection strategies to provide
a path for dairy producers to rank and select animals
for comprehensive genetic improvement across a host
of traits. Once traits are chosen and weighted based on
economic importance in an index, producers can rank
animals according to the index value and make specific
management and breeding decisions that impact future
herd health and performance and profitability.
CLARIFIDE Plus is the first genomic test in the U.S. that
delivers information on six cow wellness traits—mastitis,
lameness, metritis, retained placenta, displaced abomasum
and ketosis—and three calf wellness traits — calf livability,
respiratory disease and scours — previously unavailable
to dairy producers in one comprehensive offering. Zoetis
developed the Wellness Trait Index (WT$), Calf Wellness
Index (CW$) and Dairy Wellness Profit Index (DWP$) to
provide the appropriate weighting and economic relevance
to these trait predictions while helping dairy producers
utilize these new wellness traits in effective genomic herd
strategies.
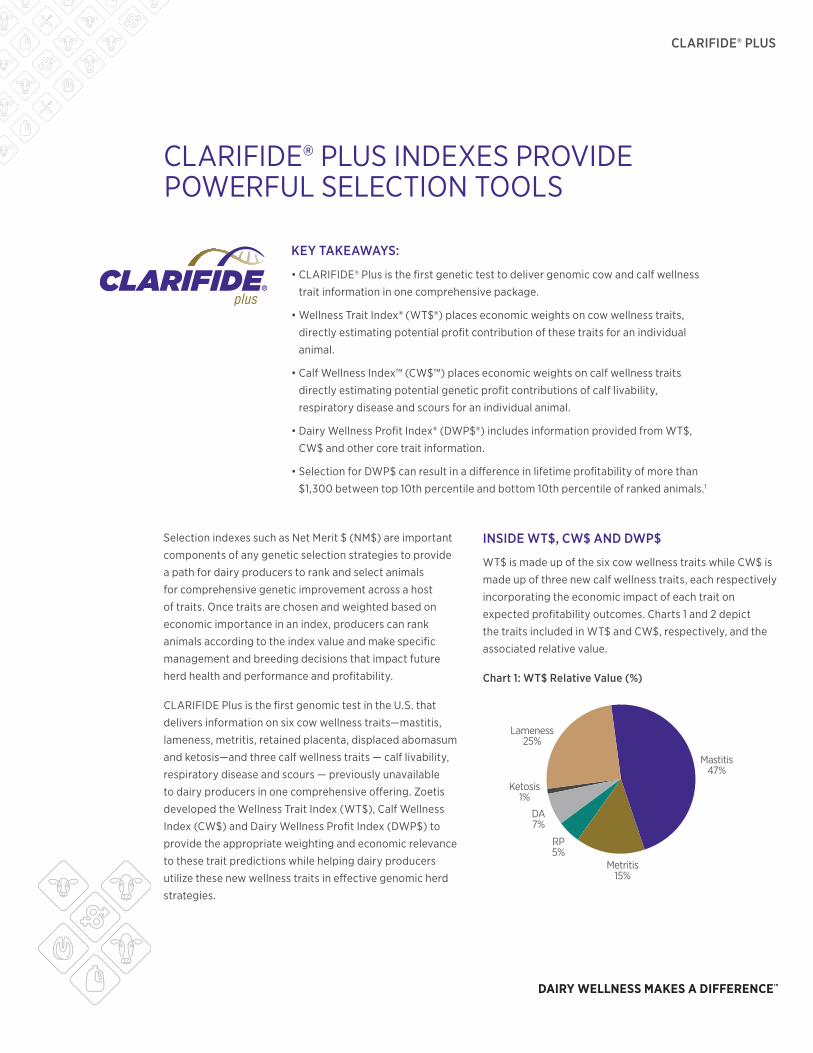
INSIDE WT$, CW$ AND DWP$
WT$ is made up of the six cow wellness traits while CW$ is
made up of three new calf wellness traits, each respectively
incorporating the economic impact of each trait on
expected profitability outcomes. Charts 1 and 2 depict
the traits included in WT$ and CW$, respectively, and the
associated relative value.
Chart 1: WT$ Relative Value (%)
KEY TAKEAWAYS:
• CLARIFIDE® Plus is the first genetic test to deliver genomic cow and calf wellness
trait information in one comprehensive package.
• Wellness Trait Index® (WT$®) places economic weights on cow wellness traits,
directly estimating potential profit contribution of these traits for an individual
animal.
• Calf Wellness Index™ (CW$™) places economic weights on calf wellness traits
directly estimating potential genetic profit contributions of calf livability,
respiratory disease and scours for an individual animal.
• Dairy Wellness Profit Index® (DWP$®) includes information provided from WT$,
CW$ and other core trait information.
• Selection for DWP$ can result in a difference in lifetime profitability of more than
$1,300 between top 10th percentile and bottom 10th percentile of ranked animals.1
CLARIFIDE® PLUS INDEXES PROVIDE POWERFUL SELECTION TOOLS
CLARIFIDE® PLUS
Lameness25%
Mastitis47%
Metritis15%
RP5%
DA7%
Ketosis1%
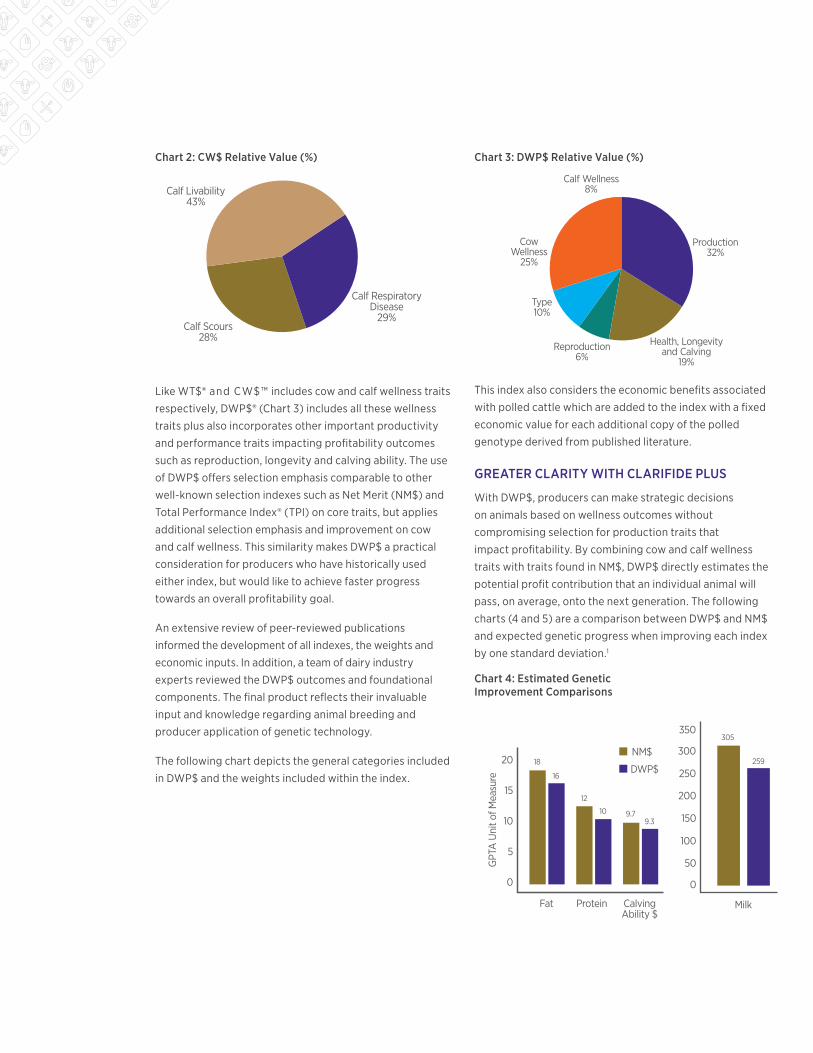
Chart 2: CW$ Relative Value (%)
Like WT$® and CW$™ includes cow and calf wellness traits
respectively, DWP$® (Chart 3) includes all these wellness
traits plus also incorporates other important productivity
and performance traits impacting profitability outcomes
such as reproduction, longevity and calving ability. The use
of DWP$ offers selection emphasis comparable to other
well-known selection indexes such as Net Merit (NM$) and
Total Performance Index® (TPI) on core traits, but applies
additional selection emphasis and improvement on cow
and calf wellness. This similarity makes DWP$ a practical
consideration for producers who have historically used
either index, but would like to achieve faster progress
towards an overall profitability goal.
An extensive review of peer-reviewed publications
informed the development of all indexes, the weights and
economic inputs. In addition, a team of dairy industry
experts reviewed the DWP$ outcomes and foundational
components. The final product reflects their invaluable
input and knowledge regarding animal breeding and
producer application of genetic technology.
The following chart depicts the general categories included
in DWP$ and the weights included within the index.
Chart 3: DWP$ Relative Value (%)
This index also considers the economic benefits associated
with polled cattle which are added to the index with a fixed
economic value for each additional copy of the polled
genotype derived from published literature.
GREATER CLARITY WITH CLARIFIDE PLUS
With DWP$, producers can make strategic decisions
on animals based on wellness outcomes without
compromising selection for production traits that
impact profitability. By combining cow and calf wellness
traits with traits found in NM$, DWP$ directly estimates the
potential profit contribution that an individual animal will
pass, on average, onto the next generation. The following
charts (4 and 5) are a comparison between DWP$ and NM$
and expected genetic progress when improving each index
by one standard deviation.1
Chart 4: Estimated Genetic Improvement Comparisons
CowWellness
25%
Production32%
Health, Longevityand Calving
19%Reproduction
6%
Type10%
Calf Wellness8%Calf Livability
43%
Calf RespiratoryDisease
29%Calf Scours
28%
Fat Protein CalvingAbility $
20
15
10
5
0
18
16
12
10 9.79.3
NM$
DWP$
0
200
300
Milk
100
250
150
50GPT
A U
nit o
f Mea
sure
350305
259

CLARIFIDE® PLUS
Chart 5: Estimated Genetic Improvement
PL
NM$ DWP$
2.5
2
1.5
1
0.5
0
-0.5
1.94
-0.06
SCS UDC FLC BDC DPR HCR CCR MAST MET RP DA KET
1.96
-0.070.40
0.36
0.250.24
0.51
0.57
0.550.52
0.85
0.89
0.27
1.63 1.58
2.01
0.52
0.86 0.92
1.24
1.822.00
Gen
etic
Uni
t of M
easu
re
-0.06-0.04
LAME
0.07
0.94
LIV
0.67
0.78
C_LIV C_RESP C_SCOUR
0.93
1.53
0.02
0.50
1.36
1.64
Through examining the response of selection between DWP$ and NM$ it was found that DWP$
offers largely the same selection response for production traits, but with greater emphasis in cow and calf wellness traits.
INDEX ACCOUNTS FOR SIGNIFICANT GENETIC VARIATION IN PROFITABILITY, LEADING TO GREATER PROFIT POTENTIAL WITH DWP$
DWP$ describes variation in expected
profitability of dairy animals attributed to
differences in genetic potential for production,
fertility, longevity and risk of disease. The
index differs from other economic indexes by
including direct predictions for health events
that have significant economic implications.
By including more characteristics affecting
profitability, DWP$ describes more genetic
variation in profitability than other indexes.
The more variation present within the
population for an index or trait of interest, the
greater the impact of selection decisions.
10th 30th 50th
Percentile70th 90th
(Top 10th
Percentile)
DWP$ Breeding Value BV = $484
~$272DWP$
~$272DWP$
~$670 DWP$BV di�.
~$670 DWP$BV di�.
$1340 BV di�erence in DWP$
Chart 6 shows the expected difference in lifetime profitability between the top 10th percentile
and bottom 10th percentile animals ranked by DWP$ in a given population is more than $1,340.
For reference, the expected difference in profitability between the top 10th percentile and bottom
10th percentile of animals ranked by NM$ is approximately $1,110.1
Chart 6: Dairy Wellness Profit Index (DWP$) expressed in breeding value

CLARIFIDE® PLUS
Chart 7: Increase in Average Lifetime Profitability* The impact of DWP$®, when used as a primary
ranking tool, has benefits over other ranking
methods that employ NM$. Chart 7 compares the
projected direct increase in lifetime profitability
between female genetic selection based on NM$
genomic predictions and DWP$ when selecting
the top 85% of heifers to keep as replacements,
compared to no selection strategy ($0).
The values in the chart represent direct differences
in selected heifers only. Genetic merit will become
greater with subsequent progeny creating
additional value with each generation.1
The wellness traits delivered through
CLARIFIDE® Plus and the DWP$ index (which
includes CW$™ and WT$®) offer dairy producers
unprecedented opportunities to select heifers
based on predicted future cow and calf health and
lifetime profitability. The economic values placed
on these traits, coupled with the greater level of
variation accounted for, give dairy producers a greater edge to make faster, more significant, profitable genetic progress toward a healthier, more trouble-free herd by using DWP$ in their animal ranking decisions, which is only found in CLARIFIDE Plus.
0
$100.00
$150.00
DWP$ GPTA
NM$ GPTA
$50.00
$85.37
$104.03
*Assumes selection of top 85% of females as replacements as compared to no selection. Does not account for increases in profitability from progeny of selected animals.
1. Data on file, January 2018 Data Package, Zoetis Inc.
All trademarks are the property of Zoetis Services LLC or a related company or a licensor unless otherwise noted. © 2018 Zoetis Services LLC. All rights reserved. CLR-00117