Embed Size (px)
Citation preview

CLA: Facts & Fantasies
1 of 21
The Collegiate Learning Assessment: Facts and Fantasies
Stephen Klein, Richard Shavelson, Roger Benjamin, and Roger Bolus
January 26, 2007
Not to be Quoted without Permission
The Secretary of Education’s Commission on the Future of Higher Education (U.S. Department of Education, 2006), which is come to be known as the “Spellings Commission,” identified the Collegiate Learning Assessment (CLA) as one of “the most comprehensive national efforts to measure how much students actually learn at different campuses” and that the CLA, “promotes a culture of evidence-based assessment in higher education” (p. 22). The Commission went on to recommend that “higher education institutions should measure student learning using quality assessment data from instruments such as, for example, the Collegiate Learning Assessment, which measures the growth of student learning taking place in colleges…” (p. 23). The Association of American Colleges and Universities concurred, as did the American Association of State Colleges and Universities (AASCU) (2006, p. 4):
The best example of direct value-added assessment is the Collegiate Learning Assessment (CLA), an outgrowth of RAND’s Value Added Assessment Initiative (VAAI) that has been available to colleges and universities since spring 2004. The test goes beyond a multiple-choice format and poses real-world performance tasks that require students to analyze complex material and provide written responses (such as preparing a memo or policy recommendation).
When a relatively novel assessment of student learning receives this kind of praise
and attention, it rightfully gets put under the microscope. Questions are raised about what it measures, its technical qualities, and its usefulness. Committees review the instruments, and opinions are formed about their strengths and weaknesses, sometimes by their competitors, rightly or wrongly. The CLA is a case in point. For example, Banta and Pike (2007) have raised questions about the appropriateness of the CLA’s value added approach to learning assessment. And Kuh (2006) has expressed concerns about the CLA’s reliability and utility.
Consequently, the time seems right to present, albeit briefly, the approach the
CLA program takes to assessment and score reporting, the types of measures it uses, the similarities and differences between the CLA approach and the methods used by other large-scale programs, and finally, some of the important statistical properties of the CLA’s measures, including their reliability.

CLA: Facts & Fantasies
2 of 21
CLA Approach to Assessment
Here we describe the learning outcomes the CLA does and does not measure. We
also discuss the CLA’s approach to assessing learning outcomes which, while having a long and distinguished history (Shavelson, 2007a,b), is somewhat unique among current general education1 measures, such as ETS’ more traditional Measure of Academic Proficiency and Progress (MAPP). What the CLA Does and Does Not Measure
A truly comprehensive assessment of learning outcomes could very well include most or perhaps all of the capacities shown in Figure 1. While no one program can realistically measure all the important outcomes of post secondary education, that should not preclude assessing at least some of them. With that principle in mind, the CLA was designed to test a student’s critical thinking, analytic reasoning, problem solving, and written communications competencies. The CLA elected to focus (at least initially) on these “broad abilities” because they cut across academic majors and they are mentioned in almost every college’s mission statement. These abilities are developed over time by the interplay between discipline-oriented education, general education, and the general abilities students have developed and bring to higher education (Shavelson, 2007a).
Intelligence
General Fluid Crystallized
General Reasoning
Verbal Quantitative Spatial
Example: Graduate Record Examination
Broad Abilities
Reasoning Critical Thinking Problem Solving Decision Making
Communicating
In Broad Domains
(Disciplinary—Humanities, Social Sciences, Sciences—
And Responsibility—Personal, Social, Moral, and Civic)
Example: Collegiate Learning Assessment
Knowledge, Understanding and Reasoning
In Major Fields and Professions (American Literature, Business)
Example: ETS’ Major Field Tests
Abstract, Process Oriented
Inheritance x Accumulated Experience
Concrete Content-Oriented
Direct Experience
1 We speak of general education with some hesitation because typically educators and the public think this refers to the first two years of college. However, we refer to the general education provided throughout the undergraduate experience.

CLA: Facts & Fantasies
3 of 21
Figure 1. Schematic of learning outcomes (from Shavelson, 2007a).
The CLA program does not measure general intellectual ability or intelligence,
nor does it aspire to. Moreover, the CLA program does not measure content or procedural knowledge, reasoning, or understanding in the various academic disciplines. We also agree with Dwyer, Millet, and Payne (2006) that it would be useful to have inter-institutional measures of these and other important post-secondary outcomes. Consequently, the CLA program is exploring the feasibility of constructing such instruments in a way that would make them compatible with the approach the CLA program uses with its current menu of measures. It is anticipated that such measures would be used in conjunction with (rather than as a replacement for) the CLA’s tests.
The CLA focuses on the institution (rather than the student) as the unit of
analysis. Its goal is to provide a summative assessment of the value added by the school’s instructional and other programs (taken as a whole) with respect to certain important learning outcomes. The results with these measures are intended to send a signal to administrators, faculty, and students about some of the competencies that need to be developed, the level of performance attained by the students at their institution, and most importantly, whether that level is better, worse, or about what would be expected given the ability level of its incoming students.
The CLA itself does not identify the reasons why a school’s students do better or
worse than expected nor does it suggest what curricular or other changes the school should implement to improve student performance. A college must turn to its faculty, reviews from accrediting agencies, data from locally constructed measures, and other sources to determine what it can and should do to raise scores. However, because CLA scores are standardized across administrations, they can be used (along with other indicators) to examine the overall effects on student performance of the reforms and policies an institution implements.2
In short, the CLA’s main goal is to provide information that will help colleges and
universities determine how much their students are improving and whether that improvement is in line with the gains of comparable students at other institutions. Some leading colleges also are using the CLA to examine the effects of alternative instructional programs within their institution.
Ideally, assessment of learning outcomes should go beyond the CLA’s direct
measures of learning to tap some of the other areas shown in Figure 1. By direct measures we mean students actually have to perform some cognitively demanding task and the quality of that performance is graded on a numerical scale (Carroll, 1993). In
2 CAE researchers are working with many institutions using the CLA, grouped within consortia to identify and implement the best practices that produce better CLA results. These include the Council of Independent Colleges, the University of Texas system, the Higher Education Commission of West Virginia, public research universities, and the Lumina longitudinal group.
CLA: Facts & Fantasies
4 of 21
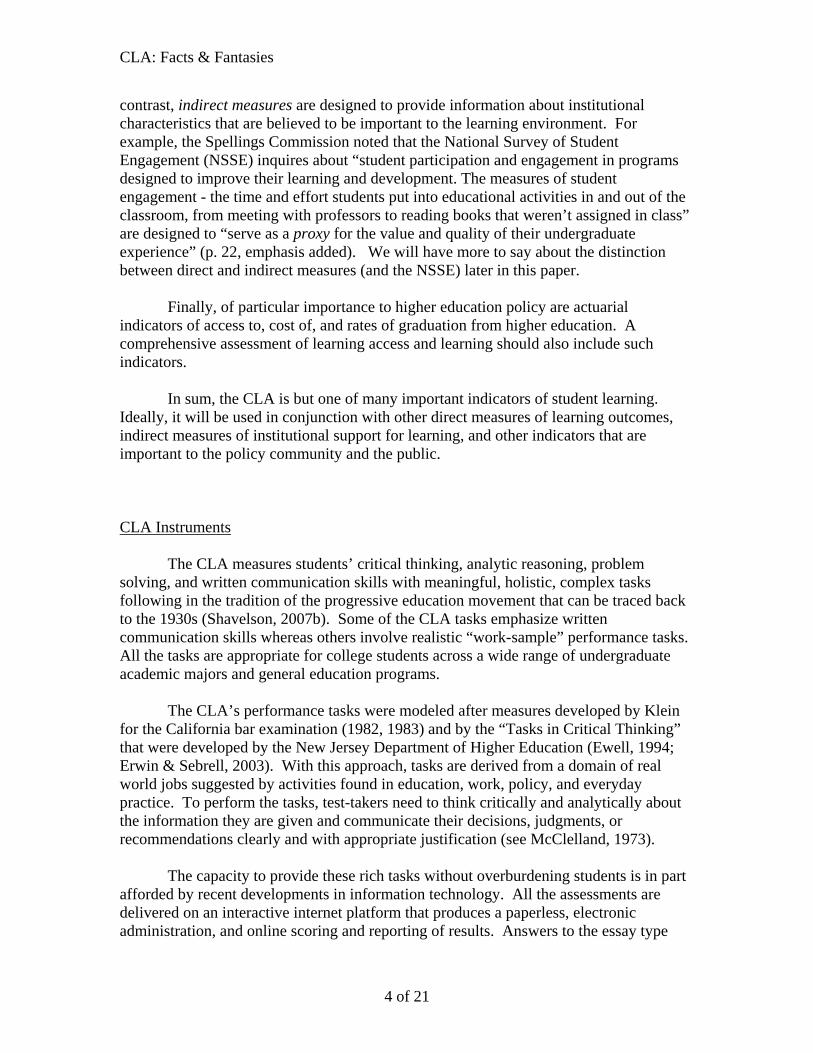
contrast, indirect measures are designed to provide information about institutional characteristics that are believed to be important to the learning environment. For example, the Spellings Commission noted that the National Survey of Student Engagement (NSSE) inquires about “student participation and engagement in programs designed to improve their learning and development. The measures of student engagement - the time and effort students put into educational activities in and out of the classroom, from meeting with professors to reading books that weren’t assigned in class” are designed to “serve as a proxy for the value and quality of their undergraduate experience” (p. 22, emphasis added). We will have more to say about the distinction between direct and indirect measures (and the NSSE) later in this paper.
Finally, of particular importance to higher education policy are actuarial
indicators of access to, cost of, and rates of graduation from higher education. A comprehensive assessment of learning access and learning should also include such indicators.
In sum, the CLA is but one of many important indicators of student learning.
Ideally, it will be used in conjunction with other direct measures of learning outcomes, indirect measures of institutional support for learning, and other indicators that are important to the policy community and the public.
CLA Instruments
The CLA measures students’ critical thinking, analytic reasoning, problem solving, and written communication skills with meaningful, holistic, complex tasks following in the tradition of the progressive education movement that can be traced back to the 1930s (Shavelson, 2007b). Some of the CLA tasks emphasize written communication skills whereas others involve realistic “work-sample” performance tasks. All the tasks are appropriate for college students across a wide range of undergraduate academic majors and general education programs.
The CLA’s performance tasks were modeled after measures developed by Klein
for the California bar examination (1982, 1983) and by the “Tasks in Critical Thinking” that were developed by the New Jersey Department of Higher Education (Ewell, 1994; Erwin & Sebrell, 2003). With this approach, tasks are derived from a domain of real world jobs suggested by activities found in education, work, policy, and everyday practice. To perform the tasks, test-takers need to think critically and analytically about the information they are given and communicate their decisions, judgments, or recommendations clearly and with appropriate justification (see McClelland, 1973).
The capacity to provide these rich tasks without overburdening students is in part
afforded by recent developments in information technology. All the assessments are delivered on an interactive internet platform that produces a paperless, electronic administration, and online scoring and reporting of results. Answers to the essay type

CLA: Facts & Fantasies
5 of 21
tasks are scored using natural language processing software. Answers to the performance tasks are currently scored by human raters who after extensive training and calibration, grade the answers on line. The whole system, then, is paperless, which significantly reduces costs. We anticipate that within the next few years, the performance tasks also will be scored by computer software.
Figure 2 illustrates one performance task. In this task, students are asked to
assume they work for DynaTech—a company that produces electronic navigational and communication equipment for small aircraft—and have been asked by their boss to evaluate the pros and cons of purchasing a plane (called the “SwiftAir 235”) for the company. Concern about this purchase has risen with the report of a recent SwiftAir 235 crash. In evaluating the situation, students are given a library of information about the SwiftAir 235 in particular and airplane accidents in general. Some of the information is relevant and sound, but some is not. Part of the problem is for students to decide what information to use and what to ignore. Students integrate these multiple sources of information to arrive at a problem solution, decision, or recommendation.
Students respond in a real-life manner by, for example, writing a memorandum to
their boss analyzing the pros and cons of alternative solutions, anticipating possible problems and solutions to them, recommending what the company should do, and marshalling the evidence to support their opinions and recommendations. In scoring performance, alternative justifiable solutions to the problem and alternative solution paths are recognized and evaluated.3 With this particular task, some students, quite perceptively, recognized that there might be undesirable fallout if DynaTech's own airplane crashed while flying with DynaTech instruments.
3 All the hand scoring is done anonymously. Readers do not have any information about the characteristics of the students whose answers they grade. Handwriting is not an issue because all students key enter their answers.

CLA: Facts & Fantasies
6 of 21
You are the assistant to Pat Williams, the president of DynaTech, a company that makes precision electronic instruments and navigational equipment. Sally Evans, a member of DynaTech's sales force, recommended that DynaTech buy a small private plane (a SwiftAir 235) that she and other members of the sales force could use to visit customers. Pat was about to approve the purchase when there was an accident involving a SwiftAir 235. You are provided with the following documentation:
1: Newspaper articles about the accident 2: Federal Accident Report on in-flight breakups in single engine planes 3: Pat's e-mail to you & Sally's e-mail to Pat 4: Charts on SwiftAir's performance characteristics 5: Amateur Pilot article comparing SwiftAir 235 to similar planes 6: Pictures and description of SwiftAir Models 180 and 235
Please prepare a memo that addresses several questions, including what data support or refute the claim that the type of wing on the SwiftAir 235 leads to more in-flight breakups, what other factors might have contributed to the accident and should be taken into account, and your overall recommendation about whether or not DynaTech should purchase the plane.
Figure 2. Collegiate Learning Assessment performance task. (http://www.cae.org/content/pdf/CLA.in.Context.pdf)
The CLA program also uses two types of essay questions. The 30-minute break-
an-argument type prompts present an argument and asks students to critique it, including their analysis of the validity of the author’s arguments, rather than simply agreeing or disagreeing with the author’s position (see Figure 3 for an example).
The 45-minute make-an-argument type prompts present students with a point-of-
view about a topic of general interest and asks them to respond to it from any perspective(s) they wish. One of these prompts is: “In our time, specialists of all kinds are highly overrated. We need more generalists -- people who can provide broad perspectives.” Students are instructed to provide relevant reasons and examples to explain and justify their views. The answers to the break-an-argument and make-an-argument prompts are machine scored.
Figure 3. Example of a 30-Minute Break-An-Argument Prompt The University of Claria is generally considered one of the best universities in the world because of its instructors' reputation, which is based primarily on the extensive research and publishing record of certain faculty members. In addition, several faculty members are internationally renowned as leaders in their fields. For example, many of the English Department’s faculty members are regularly invited to teach at universities in other countries. Furthermore, two recent graduates of the physics department have gone on to become candidates for the Nobel Prize in

CLA: Facts & Fantasies
7 of 21
Physics. And 75 percent of the students are able to find employment after graduating. Therefore, because of the reputation of its faculty, the University of Claria should be the obvious choice for anyone seeking a quality education.
All of the machine and reader assigned “raw” scores are converted to a common
scale of measurement. Consequently, an answer that receives a given scale score on one task reflects about the same level of relative proficiency as answers that received that same scale score on another task. This feature permits combining and averaging scores from different tasks to obtain overall school means. Moreover, by anchoring this scale to the SAT, the CLA program can compare scale scores over time, such as for measuring improvement between entering first year students and graduating seniors.4
The CLA approach recognizes that critical thinking, analytic reasoning, problem
solving, and written communication skills are inherently complexly intertwined in the task and response demands. The performance tasks in particular need to be drawn from real-world domains of activities to preserve their integrity. To pull the tasks apart and index critical thinking, analytic reasoning, and communication separately would be impossible with the complexity and wholeness of these tasks. To do so would give up their work-sample flavor and create artificial tasks that are stripped of their real-world complexity. Nevertheless, that is what measures like the MAPP do. Their approaches to assessment grew out of the Carnegie Foundation’s pioneering work in the measurement of undergraduates’ learning at the beginning of the 20th century and were greatly influenced by the behaviorists, most notably by E.L. Thorndike (Shavelson, 2007b). These assessments take a multidimensional “construct” such as the one the CLA deals with and try to break it down into its component parts—critical thinking, analytic reasoning, and communication. Then individual test items, subtests or tests are constructed to tap each component. Finally the components are put back together again to provide a total score.
This “construct oriented” approach assumes that one can get an accurate picture
of the whole by stitching components together. The primary advantages of this strategy are that it can be used to generate separate scores for each construct and at least in theory, be more diagnostic in isolating problems. The chief disadvantage—and one of the main reasons the CLA does not use it—is that it is often artificial and neglects the fact that the whole is usually much greater than the sum of its parts; just as being able to drive a car safely involves much more than knowing the rules of the road and being able to read gauges, steer, accelerate, and brake.
Although the CLA’s approach is fundamentally different than that used with the MAPP and other large-scale multiple choice tests, it does employ some of their other features. For example, the CLA measures are given under standardized conditions across schools and raw scores are converted to scale scores that can be compared across
4 Students who took the ACT rather than the SAT have their ACT scores converted to the SAT’s scale of measurement. This is done using the standard cross-walk between these two exams that most colleges use in their admissions process. The analyses conducted by the CLA program and those presented in this paper do not distinguish between actual SAT scores and those converted from ACT scores.

CLA: Facts & Fantasies
8 of 21
administrations. These features of the CLA program allow schools to examine how well their students are doing over time and relative to similarly situated students at other institutions.
Banta and Pike (2006) assert that “testing students’ generic as well as discipline
specific knowledge and skills in their major fields of study provides a much more promising avenue for assessing growth and development in college than do today’s most commonly discussed tests of generic skills alone.” We agree that the assessment of student outcomes could be improved by including measures of discipline specific outcomes, but this should not be done at the expense of assessing the broad skills that colleges say they are trying to develop in their students and employers value. Moreover, the average improvement in scores between entering freshmen and graduating seniors on the CLA is more than one standard deviation. By any standard, this is a very large effect size, and one that suggests the CLA is sensitive to the effects of a college education. Some of the CLA’s Other Distinguishing Features
As noted above, the CLA approach differs from the ones used in most other large- scale testing programs. For example, all CLA measures are administered on line, all the questions are open-ended (there are no multiple choice items), and all the students’ responses are scored by machine or by a trained cadre of readers who grade the answers on-line. In addition, students are assigned randomly to tasks so that a given student answers only a small portion of the full complement of tasks, but all the tasks are given at each school.5 This “matrix sampling” strategy greatly reduces the testing burden on individual students while still using the same set of measures across institutions.
Unlike large-scale testing programs at the elementary and secondary school
levels, the CLA program tests only a sample of a school’s students. Moreover, student participation in this program is typically voluntary rather than required. Although it certainly would be more desirable to test all or a truly random sample of students at each school, neither of these options is feasible on most college campuses. MAPP and NSSE, for example, face the same problem.
Colleges and universities use a variety of methods to encourage their students to
take the CLA tests, such as giving them bookstore gift cards, preference in registration, and prizes. However, at least so far, there does not appear to be any meaningful relationship between the type of inducement used and participation rates, student motivation to do well on the tests, or scores. For example, students who take a performance task complete a post-assessment questionnaire that asks them how hard they tried to do well on the task. Analyses of these data indicate that once there is control on
5 Students who participate in the CLA program more than once, such as freshmen and later as seniors, are automatically assigned to different tasks between administrations. The program currently uses eight different performance tasks and several of each type of essay prompt.

CLA: Facts & Fantasies
9 of 21
SAT scores, self reported ratings of effort account for only about five percent of the variance in mean school scores, which is too small to have much impact on results.6
Students also report the primary motivating factor for taking the CLA. Their
responses are categorized into the following three groups: (1) Personal Development (understanding my strengths and weaknesses or how my score compares to those of other students); (2) Remuneration (stipends, gift certificates, lottery for large prize); and (3) Requirement (embedded in a class or campus-wide assessment activity). After controlling on their SAT scores, which type of factor they mention accounts for only one percent of the variance in student level CLA scores.
Reporting Results in Terms of Value Added
One of the most important features of the CLA program is its policy of reporting results in terms of whether an institution’s students are doing better, worse, or about the same as would be expected given the level of their entering competencies. The program also examines whether the improvement in average student performance between entry and graduation at a school is in line with the gains of comparable students at other colleges. The program is therefore able to inform schools about whether the progress their students are making is consistent with the gains at other institutions. Thus, the CLA program adheres to the principle that post-secondary assessment programs should focus on measuring and contributing to improvement in student learning.7
A “value-added” approach to assessing improvement was adopted because (a) the
sample of students tested at a school may be somewhat more or less able than their classmates, (b) the incoming characteristics of a school’s students who participate in one year may be different from the characteristics of those who participate in another year, and (c) schools differ markedly in the competencies of their entering students.8 These complicating factors preclude making simple comparisons of mean scores between schools. Thus, to provide a reasonable, practical method for measuring improvement 6 When the school is the unit of analysis, the SAT by itself accounts for about 70% of the variance in performance task scores. The SAT plus self-reported effort accounts for another 3% to 7%, depending on the sample (e.g., freshmen vs. seniors). Self-reports of effort may, of course, be influenced by the students’ sense of how well they did on the task, such as by saying they did not try hard if they felt they did not do well. An argument also could be made that the CLA is a measure of typical rather than maximum performance (Cronbach, 1990). If so, then student motivation can be viewed as an outcome in that some schools may be more successful than others in instilling in their students the attitude that they should take pride in their work and always try to do their best. 7 This is the opposite of the philosophy underlying the national No Child Left Behind (NCLB) program at the elementary and secondary level where the focus is on the percentage of a school’s students who achieve a certain level of proficiency (i.e., regardless of how much improvement they made). 8 Indeed, the entering students at some schools are so able that they out perform the graduates at other institutions. However, by using a value added approach to assessment, schools with relatively less able entering classes can show as much improvement in student learning as institutions with the most able entering classes. Moreover, even at the colleges with the highest scoring students, student scores are well below the maximum possible score. In other words, ceiling effects are not a concern because there is plenty of room for growth for everyone.

CLA: Facts & Fantasies
10 of 21
between schools as well as within a school over time, it is first necessary to adjust the scores for the entering competencies of the students who actually participate in the testing program at each institution.
Operationally, this adjustment is made by calculating the difference between a
school’s actual mean CLA score and the mean its students would be expected to earn. For this purpose, the expected mean is derived from the strong empirical relationship between mean CLA and SAT scores across all the schools in the CLA program (see CLA Sample Institutional Report (2006) for details of this methodology).
To be sure, there are potential problems with value added (and other) learning-
assessment scores if the assumptions underlying these methods are substantially violated (Banta & Pike, 2007; Braun, 2005). For example, the CLA approach assumes that the relationship between CLA and SAT scores in the sample of students tested at a school is generally representative of the relationship between these variables among all the students at that school. The analysis also assumes that the sample of schools participating in the CLA program is generally representative of a national sample of schools. As noted in the CLA Institutional Report (CLA, 2006), there is empirical evidence to indicate that both of these conditions are being met. For example, when the school is used as the unit of analysis, there is a 0.96 correlation between the mean freshmen SAT score in the sample of students taking the CLA and the mean SAT score for all the freshmen at the school. Thus, some schools are clearly not selecting their best students to take the CLA while other schools are selecting their typical or worst students to participate.
In addition, there is a close correspondence between the characteristics of the
approximately 1400 institutions in the Education Trust’s IPEDS database and the characteristics of the over 100 schools participating in the CLA program.9 For instance, as noted in Table 1, during the 2005-2006 school year, the mean four-year graduation rates at the two sets of institutions were 36% and 38%, respectively; and both sets had the same mean Barron’s selectivity rating of 3.5.
9 The College Results Online does not include every 4-year Title-IV eligible higher education institution in the United States. It only contains institutions that meet all of the following criteria: 1) They fall in the public or private not-for-profit sector. This excludes for-profit 4-year institutions like the University of Phoenix. 2) They reported Graduate Rate Survey data for the 2004 cohort. 3) They were assigned a selectivity rating in Barron’s Profiles of American Colleges 2005 Edition. These restrictions limit the universe of 4-year institutions being analyzed to approximately 1,400 institutions. Accordingly, the results of statistical analyses and descriptions of this universe of institutions may vary from the results of corresponding descriptions of all 4-year institutions. However, because the institutions covered in that universe enrolled 96% of all students in the total 4-year non-profit bachelor’s degree seeking GRS cohort, such variance is likely to be small.

CLA: Facts & Fantasies
11 of 21
Table 1. Four-year institutions in the CLA and nation by key school characteristics
School Characteristic Nation CLA
Percent public 36% 42%
Percent Historically Black College or University (HBCU) 6% 10%
Mean percentage of undergraduates receiving Pell grants 33% 32%
Mean four-year graduation rate 36% 38%
Mean six-year graduation rate 52% 55%
Mean first-year retention rate 75% 77%
Mean Barron's selectivity rating 3.5 3.5
Mean estimated median Freshmen SAT score 1061 1079
Mean number of FTE undergraduate students (rounded) 4500 6160
Mean student-related expenditures per FTE student (rounded) $12,230 $11,820
Source: College Results Online dataset, managed by the Education Trust, covers most 4-year Title IV-eligible higher-education institutions in the United States. Data were obtained with permission from the Education Trust and constructed from IPEDS and other sources. For details see www.collegeresults.org/aboutthedata.aspx. Because all schools did not report on every measure in the table, the averages and percentages may be based on slightly different denominators.
Value-added scores assume that selection bias has been controlled—that is,
comparing seniors’ performance among benchmark institutions is “fair” and any or all differences among those seniors other than their performance on the assessment has been controlled. This is simply impossible to do without randomization, and adjustment procedures that attempt to approximate randomization would be extremely difficult to use in the construction of value-added or any other scores (e.g., Braun, 2005). Nevertheless, our analysis of IPEDS data found that CLA scores were not significantly related to a wide variety of school characteristics (such as size, Carnegie classification, and control—private, public, or religious) once there was control on the school’s mean SAT score. Thus, while far from perfect, this finding supports the thesis that CLA scores are not being driven by some set of important but extraneous unmeasured factors.
Finally, the assumption that an institution or a program-within-an institution was
the sole “cause” of the change in students’ performance on the CLA or any other learning assessment is not tenable. While higher education is a major force in college students’ lives, other factors (such as maturation) may have contributed to the improvement in student scores between entry and graduation. We simply cannot tell how much of this improvement can be attributed to the collegiate experience and how much to other factors. However, because the magnitude of the gain between freshmen and senior years on the CLA is generally so much larger than that reported with other measures, we suspect that a substantial portion of this improvement is likely to be a function of the learning opportunities provided by a college education.10
Given the considerations discussed above, there is a choice to be made: to report
or not to report value-added scores. The CLA comes down on the side of reporting such scores, but always with the caveats mentioned above because the value added approach,
10 The CLA program is currently conducting an empirical study of the effects of maturation on scores.

CLA: Facts & Fantasies
12 of 21
when these caveats are noted, provides an important way for institutions to judge their performance. Moreover, the CLA program stresses that its scores are not the only types of information about student learning that should be used in examining and improving student and institutional performance. Rather, CLA scores are but one source of information about institutional or program performance. They should be used in conjunction with other student learning information as noted above and suggested in Figure 1.
Banta and Pike (2006) based their criticism of the CLA’s use of value added
scores in part on a quote from ETS President and CEO Kurt Landgraf’s statement that “Results from value-added models should not serve as the primary basis for making consequential decisions. Other measures must be included in any fair and valid teacher evaluation system.” We do not disagree. Value-added results should be used in conjunction with other indicators, but there is no reason to exclude them. In fact, we argue the competencies the CLA measures are a critical part of higher education and the value added approach is most suitable for measuring them. Moreover, Landgraf was referring to using value added scores to make important decisions about individual instructors, which is not something the CLA program recommends nor are its results used for that or similar purposes by any of the institutions participating in the CLA program.
The CLA’s and the NSSE’s Similarities and Differences The Spellings Commission mentioned the CLA, MAPP, and NSSE as measures
schools should consider. We have already discussed differences between the CLA and MAPP approaches, which are both direct measures of learning. Consequently, we now turn to some of the important similarities and differences between the CLA and NSSE programs and in doing so, compare and contrast direct and indirect measures of learning.
The CLA and NSSE programs are both limited to the sample of students who agree to participate. The CLA addresses this constraint by using a value-added model, as described above. NSSE takes a different tack. It selects a random sample of the school’s students, but many of those students do not take or complete the survey. Consequently, the NSSE program has to work with voluntary samples, just like the CLA.
However, unlike the CLA, NSSE does not adjust for the relevant background characteristics of those who do respond which leads to interpretive challenges. For example, at one school, the students who say on the NSSE that they often read books that were not assigned in class may have been reading unassigned books long before they ever went to college whereas the students at another school who say they are reading unassigned books may be doing it for the first time.
It turns out that NSSE has no way of identifying let alone adequately adjusting for
such differences. Simple comparisons between schools in the degree to which their students say they are “engaged” in the educational process is therefore analogous to comparing mean CLA scores between schools without controlling for differences in the

CLA: Facts & Fantasies
13 of 21
average academic ability level of their students before they ever set foot in the classroom. Moreover, the students who choose to participate in the NSSE at one school may be more “engaged” than their classmates while those who participate at another school may be less engaged than their classmates. The NSSE program has no way to control or adjust for such differences.
The CLA (and other direct measures of learning) pose questions or tasks for
which students’ responses can be evaluated against known standards for accuracy. In contrast, the accuracy of student responses to the NSSE cannot be verified. To illustrate, the NSSE contains about 85 questions that ask students how often they engage in various activities. Some of these questions do a good job of being concrete if not verifiable. For example, one question asks how many papers or reports the student wrote of 20 pages or more. The choices are: none, 1-4, 5-10, 11-20, and more than 20. This question is unambiguous and the choices are clear and explicit. However, most of the NSSE’s questions do not share these characteristics. For instance, one item asks students to report how often they “used an electronic medium (listserv, chat group, Internet, instant messaging, etc.) to discuss or complete an assignment.” The choices are: very often, often, sometimes, and never. The choices for other items are: very much, quite a bit, some, and very little. However, what constitutes “very often” (or “very much”) for one student may correspond to “sometimes” (or “very little”) for another student; i.e., even though both students may engage in the activity equally often.
The NSSE implicitly assumes that such differences in the interpretation of the
choices are randomly distributed across students. However, if they are not random but instead are related to differences in the background characteristics and experiences of the students going to different schools, then this would seriously cloud the interpretation of the NSSE results. This is not an issue with CLA or other direct-measures.
Perhaps the most important difference between the CLA and NSSE is that the
CLA is a direct measure of student learning whereas the NSSE is at best an indirect measure or proxy. This distinction is analogous to assessing a baseball player’s ability to hit home runs based on the number of home runs the player actually hit versus on the player’s strength, hand-eye coordination, physical build, and other characteristics that are presumably related to hitting ability. The latter indirect approach, which is the one adopted by the NSSE, might make sense if the combination of these characteristics was strongly related to the number of home runs hit. However, there is little empirical evidence to suggest that student responses to the NSSE are in fact even moderately related to college grades, CLA scores or CLA value added scores (Klein, Kuh, Chun, Hamilton, & Shavelson, 2005).
Given these considerations, it is probably best to view the NSSE as a measure of
the degree to which students engage in activities that are important in and of themselves; i.e., rather than as proxies for learning outcomes. This suggestion is consistent with the one made in the ETS Culture of Evidence report (Dwyer, Millett, & Payne, 2006).

CLA: Facts & Fantasies
14 of 21
The CLA’s Statistical Properties Banta and Pike (2006) as well as Kuh (2006) have raised questions about whether
CLA scores, and in particular the value-added (“residual”) scores, can be trusted. In this section, we review some of the relevant statistical characteristics of the CLA scores that bear on this question. Specifically, we examine the comparability between hand and machine assigned scores, the degree to which different readers assign the same score to a given answer, the extent to which school mean and residual scores are affected by chance, the effect of using the school as the unit of analysis, and the degree to which a student’s CLA scores are a function of that student’s demographic characteristics.
Klein (forthcoming) found a 0.78 correlation between hand and machine assigned
mean scores on the make-an-argument and break-an-argument tasks. This is close to the 0.80 to 0.85 correlation between two hand readers on these prompts. In addition, the method used to grade the answers (i.e., hand versus machine) had little or no effect on the correlation of the resulting scores with other measures, such as SAT scores and college grades (see Table 7 in Klein et al., 2005). These findings are consistent with those reported by others with similar tasks (e.g., Powers et al., 2000, 2001).
All the performance task answers are hand scored. Readers do not have any
information about the characteristics of the students whose answers they grade. A random sample of 10 percent of the hand graded answers is automatically and independently graded by a second reader to monitor and assess inter-reader consistency. The median correlation between two hand scorers on the 90-minute performance tasks is 0.80, which is comparable to that obtained with grading bar examination essay answers (Klein & Bolus, 2003).
Kuh (2006) was critical of the CLA for aggregating individual student scores up
to the school level. Specifically, he said that when this is done, “The amount of error in student scores compounds and introduces additional error into the results, which makes meaningful interpretation difficult" (p. 9). Actually, measurement theory would predict just the opposite (see Brennan, 1995); namely, that scores would become much more rather than less reliable when results are aggregated to the school level if sample sizes are adequate and there is sufficient variation among institutions which there is on the CLA. If so, this increase in reliability would lead to higher correlations among measures (provided there is reasonable variability in scores among campuses).11
To examine Kuh’s ideas about aggregation effects, we computed the correlation
of SAT scores with CLA scores using the student as the unit of analysis and again using the school as the unit. This analysis was conducted with data from the fall 2005 testing of over 10,000 freshmen from 113 schools and from the spring 2006 testing of over 4,000 seniors from 90 schools. In most instances, a given student took either one performance task question or the combination of the two types of essay prompts. Thus, a school’s total score was simply the average of its performance task and essay scale scores. 11 There is plenty of variation in school level CLA and SAT scores, with school level mean scores ranging from 900 to 1400.

CLA: Facts & Fantasies
15 of 21
As is clear from Table 2, and contrary to Kuh’s expectation but consistent with
psychometric theory, correlations are about 0.35 higher (and explain three times as much variance) when the college rather than the student is used as the unit of analysis. This huge increase stems from the much higher reliability of the school level scores.
Table 2. Correlation of CLA scale scores with SAT scores by class (freshmen vs. seniors) and unit of analysis (students vs. schools)12
Unit = Students Unit = Colleges
CLA Score Freshmen Seniors Freshmen Seniors
Performance .56 .54 .91 .88
Essay .44 .46 .79 .83
Total NA NA .88 .88 Kuh also expressed concerns about the CLA using value-added (residual) scores.
Specifically, he said that the use of such scores is “especially problematic when comparing institutional performance [because of] the amount of error (or inaccuracy) associated with a test score due to such vagaries as the testing situation, student frame of mind, and a host of other factors. This means there is a certain amount of unknown error in the test result because a student's ‘true’ score may vary from one day to the next.” (p. 9). Kuh (2006, p. 9) goes on to say that:
“These are not merely hypothetical musings. NSSE experimented with its version of value added to calculate predicted institution-level scores. After a thorough review … we no longer provide this information because it can be potentially misleading when used to distinguish institutions.” To investigate whether Kuh’s problems with the NSSE apply to the CLA, we
identified all the schools where at least 80 students took at least one performance task or at least both types of essay prompts. We then drew two random samples (without replacement) with 40 students per sample from each school and designated them as sample A and sample B. Finally, using the school as the unit of analysis, we computed 12 The high college-level correlations in Table 3 are sometimes misinterpreted to mean that the CLA is just another SAT. If we have the SAT, the reasoning goes, why do we need the CLA? However high correlations do not imply two tests are measuring the same thing—i.e., the same thinking or reasoning, or “cognitive processing.” Consider the following. If we were going to teach to the CLA, our CLA preparation would look a lot different from that used by Princeton Review to train students to take the SAT. That is, if college instructors trained students to work through CLA tasks, they would be teaching the kind of critical thinking, analytic reasoning, and communication skills their colleges’ mission statements say they are teaching. Or put another way, even if the CLA correlates highly with the SAT, we would not take a student’s SAT score as a proxy for his or her grade or performance in, say, an American history course—the SAT doesn’t say anything about the student’s history knowledge and reasoning just as the SAT doesn’t say anything about a student’s reasoning on the CLA.

CLA: Facts & Fantasies
16 of 21
the correlation between the sample A and B mean CLA scores and between the sample A and B value added (residual) scores. This analysis was conducted separately for the 62 schools that tested enough freshmen in the fall of 2005 and the 44 schools that tested enough seniors in the spring of 2006 to meet the sampling requirements noted above.
Table 3 shows that the CLA mean and residual scores are sufficiently reliable for
informing policy decisions about schools even when only 40 students per school are tested (and most of those students took only one half of the full three-hour CLA test battery).13 Note also that the coefficients in Table 3 underestimate the actual level of reliability of the school means because each sample contained no more than half of the total number of students tested at each school.
Table 3. Correlation between sample A and B school means and residual scores by class
Type of score Freshmen (N = 62 colleges) Seniors (N = 44 colleges)
Mean total scale score .94 .86
Residual score .77 .70
We used a similar strategy as that employed to construct Table 3 to examine the school level reliability of the difference in value added (residual) scores between freshmen and seniors. This analysis began by identifying all of the 91 colleges that tested at least 10 freshmen in the fall of 2005 and also tested at least 10 seniors in the spring of 2006. Next, we randomly assigned half the freshmen at a college to sample A and the other half to sample B. We then randomly assigned half the seniors to sample A and the other half to sample B. Finally, we computed the difference in school mean value added (residual) scores between classes within each sample. For example, if the mean value added score for freshmen in a college’s sample A was 0.20 standard errors below expected and the mean for seniors in sample A at this school was 0.15 standard errors above expected, then the net difference between these two classes in sample A was 0.35 standard errors. We then made the same calculations for sample B.
The correlation between the two sets of residualized difference scores across the
91 schools was 0.63, which is quite high given the small number of students in each sample at each school (i.e., as few as 5 students per sample per class within a college) and theoretical concerns about the unreliability of difference scores and especially residualized difference scores.
Differences in mean test scores and grades between racial and ethnic groups as
well as between gender groups often raise questions about possible bias. To explore those concerns, we constructed two regression equations to predict a student’s CLA performance task score. One of these equations used SAT score as the sole predictor.
13 The CLA program recommends that schools test 100 students per class with the full battery, but recognizes that many schools cannot meet this target.

CLA: Facts & Fantasies
17 of 21
The other equation used the student’s SAT score plus racial/ethnic group, gender, and whether English was the primary language spoken in the home. A second pair of equations with the same set of independent variables was constructed to predict total CLA essay scores. These analyses were conducted with the roughly 10,000 freshmen who took the CLA in the fall of 2005 and the approximately 4,000 seniors who took it in the spring of 2006.
Table 4 shows that including student demographic characteristics in the regression
model had little or no effect on predictive accuracy for either class or with either type of CLA test score. This finding supports the thesis that the CLA’s measures do not favor one group over another.
Table 4. Percentage of variance in CLA scores that is explained by SAT scores alone and by the combination of SAT scores and demographic variables
SAT plus CLA Score and Class SAT Only Demographics Difference Essay Freshmen 20 22 2 Seniors 23 25 2 Performance Task Freshmen 32 33 1 Seniors 30 30 0
Summary & Conclusions The Spellings Commission reaffirmed the importance of learning assessment for
both campus improvement and accountability purposes. In doing so, it highlighted the CLA as an exemplary measure of learning; and, that publicity has rightfully placed this assessment program under the microscope. Initial reports from this inspection have made claims, some based on fact and others on fantasy. Consequently, in this paper we attempted to point out: (a) what the CLA does and does not measure, (b) how dependably it measures what it claims to measure, and (c) how it can be distinguished from other direct (e.g., MAPP) and indirect (e.g., NSSE) measures of student learning.
The CLA program views its current assessment as but one (albeit a very important
and essential) measure in an overall system of higher education indicators. Other measures, such as performance in an academic discipline, in social, moral, and personal situations along with policy relevant measures of student access, instruction and graduation should be incorporated in a truly comprehensive indicator system.
The CLA’s importance lies in its focus on the broad abilities that colleges and
universities almost universally claim to instill in their students: critical thinking, analytic reasoning, problem solving, and communication skills. Its novelty lies in the fact that it

CLA: Facts & Fantasies
18 of 21
samples holistically “real-world” tasks that educators, students, and the public consider important outcomes of college education. In addition, and in contrast to other direct measures of student learning, the CLA relies entirely on open-ended measures and it does not break a complex task into constituent competencies so as to report separate ability scores. This is because the CLA believes that to do so would remove the assessment from reality and that the sum of the parts of such an assessment does not capture the complexity of the whole. Consequently, the CLA is an entirely constructed response assessment on realistic performance and written tasks. The advent of new technologies, including internet administration and scoring, as well as availability of natural language processing software for scoring, make this assessment cost and time feasible where in the past such assessments were not.
The CLA and other assessment programs along with the colleges and universities
where they are used, all face the challenge of obtaining student cooperation in taking the measures which in turn means that the sample of students participating may not be truly representative. The CLA addresses this problem by taking a value added approach; i.e., it adjusts college-performance scores for differences in the entry level abilities of the students who do participate (as indicated by their SAT scores). This approach assumes that the relationship between CLA and SAT scores in the sample of students tested at a school is generally representative of the relationship between these variables among all the students at that school. The analysis also assumes that the sample of schools participating in the CLA program is generally representative of a national sample of schools. There is empirical evidence to indicate that both of these conditions are being met (CLA, 2006). While this approach is not optimal and selectivity is always a concern, it is pragmatic, practical, and the value of such information, we believe, outweighs the alternative of making no adjustment for input or relying on indirect measures of questionable validity.
The caveats discussed above establish the limits of certainty in educational assessment. In the real world of educational assessment, the question becomes how to develop approaches that maximize the likelihood of identifying policy relevant relationships and patterns among variables so as to provide educators with information that is useful for improving teaching and pedagogy. Such approaches can only be judged as credible if they show how they deal with the implications of these caveats in terms of the methods of assessment used, the unit of analysis chosen, what analyses are conducted, and how the results of those analyses are interpreted and used. The approaches must also provide practical protocols that assist the educational community for whom the approaches are developed to address concerns about possible sample and selection bias, misunderstandings, and misstatements of the results. Finally, it is important to make explicit all aspects of one’s approach so as to invite suggestions for improvements based on the distinction between the methodological constraints involved in all educational assessment from specific strategies, some of which are better than others.
The CLA signals a campus as to how it is performing relative to benchmark
campuses. Other information, such as campus assessments and IPEDS data, along with this signal are needed for campuses to identify possible challenges that should be

CLA: Facts & Fantasies
19 of 21
addressed. A number of campuses also are using the CLA to assess improvements they have made to see if such “experiments” worked.
Issues have been raised about the technical characteristics of the CLA. Some
have claimed that having computers score writing tasks is unreliable or that CLA scores are unreliable. However, these claims are contradicted by the empirical data reported here and elsewhere. The reliability of rater and machine scoring is roughly the same; the reliability of mean college CLA scores and residual scores is quite adequate (above 0.80 in the former and 0.70 in the latter). Finally, the reliability of the difference in mean residual scores between classes within a school is adequate as well.
In summary, the CLA appears to reliably measure certain important learning
outcomes of undergraduate education. Its approach differs from other direct measures of learning in that holistic, open-ended real-world tasks are sampled on the assessment and students construct their responses in a manner similar to those expected in real life situations. This approach differs from other direct measures of learning, such as those that use selected-response (multiple-choice) tests that break down complex tasks into sets of subtasks and then sum them up in an attempt to capture the whole. Life does not come packaged as a multiple-choice question; we do not believe the whole is simply the sum of the parts. Moreover, the CLA and other direct measures of learning are quite distinct from indirect measures, such as the NSSE, in that they do not rely on students’ self-report of experiences or performance but instead, directly measure what a student is able to do when confronted with a meaningful cognitive task. And contrary to rhetoric, both direct and indirect measures of student learning can be affected by which students do and do not choose to participate in the assessment, but only direct assessments have a viable statistical means for addressing this concern. Finally, the statistical characteristics of the CLA’s measures meet or exceed technical quality standards. This said, there is always room for research and improvement of any assessment system, and the CLA is pursuing that R&D agenda.
References
AAC&U. (2005). Liberal education outcomes. Washington, DC: Association of American Colleges and Universities.
AASCU. (Spring 2006). Value-added Assessment. Perspectives. Washington, DC: American Association of State Colleges and Universities.
Banta, T.W., & Pike, G.R. (Jan-Feb. 2007). Revisiting the blind alley of value added. Assessment Update, 19(1), pre publication version.
Braun, H.J. (2005). Using student progress to evaluate teachers: A primer on value-added models. New Jersey: Educational Testing Service.

CLA: Facts & Fantasies
20 of 21
Brennan, R.L. (1995). The conventional wisdom about group mean scores. Journal of Educational Measurement, 32(4), 385-396.
CLA (2006) Sample Institutional Report.www.cae.org/cla
Carroll, J.B. (1993). Human cognitive abilities: A survey of factor-analytic studies. New York: Cambridge University Press.
Cronbach, L.J. (1990). Essential of psychological and educational testing. 5th edition. New York: Harper Collins.
Dwyer, C. A., Millett, C. M., & Payne, D. G. (2006). A Culture of Evidence: Postsecondary assessment and learning outcomes. Princeton, N.J.: Educational Testing Service.
Erwin, D., & Sebrell, K.W. (2003). Assessment of critical thinking: ETS’s tasks in critical thinking. The Journal of General Education, 52(1), 50-70.
Ewell, P. T. (1994). A policy guide for assessment: Making good use of the Tasks in Critical Thinking. Princeton, NJ: Educational Testing Service.
Klein, S., Kuh, G., Chun, M., Hamilton, L., & Shavelson, R. (2005). An approach to measuring cognitive outcomes across higher-education institutions. Research in Higher Education, 46, 3, 251-276.
Klein, S. & Bolus, R. (1982). An analysis of the relationship between clinical skills and bar examination results. Report prepared for the Committee of Bar Examiners of the State Bar of California and the National Conference of Bar Examiners.
Klein, S. (1983). Relationship of bar examinations to performance tests of lawyering skills. Paper presented to the American Educational Research Association, Montreal, April. (reprinted in Professional Education Researcher Notes, 1982, 4, 10-11).
Klein, S. (Forthcoming). Characteristics of hand and machine-assigned scores to college students’ answers to open-ended tasks. In Festschrift for David Freedman, D. Nolan and T. Speed, editors: Beachwood, OH. Institute for Mathematical Statistics.
Kuh, G. (2006). Director’s Message in: Engaged Learning: Fostering Success for All Students. Bloomington, Indiana: National Survey of Student Engagement.
Landgraf, K. (2005). Cover letter accompanying the distribution of Braun (2005) report.
McClelland, D.C. (1973). Testing for competence rather than for “intelligence.” American Psychologist, 28(1), 1-14.

CLA: Facts & Fantasies
21 of 21
Powers, D., Burstein, J., Chodorow, M., Fowles, M., & Kukich, K. (2000). Comparing the validity of automated and human essay scoring (GRE No. 98-08a, ETS RR-00-10). Princeton, NJ: Educational Testing Service.
Powers, D., Burstein, J., Chodorow, M., Fowles, M., & Kukich, K. (2001). Stumping e-rater: Challenging the validity of automated scoring. (GRE No. 98-08Pb, ETS RR-01-03). Princeton, NJ: Educational Testing Service.
Shavelson, R.J. (2007a). Assessing student learning responsibly: From history to an audacious proposal. Change. forthcoming January/February.
Shavelson, R.J. (2007b). Student learning assessment: From history to an audacious proposal. AAC&U.
U.S. Department of Education (2006). A test of leadership: Charting the Future of U.S. Higher Education. Washington, D.C.