Embed Size (px)
Citation preview
National Fire Data Center16825 S. Seton Ave.Emmitsburg, MD 21727https://www.usfa.fema.gov/data/statistics/
July 2017 | Volume 18, Issue 5Topical Fire Report Series
Civilian Fire Injuries in Residential Buildings (2013-2015)
These topical reports are designed to explore facets of the U.S. fire problem as depicted through data collected in the U.S. Fire Administration’s National Fire Incident Reporting System. Each topical report briefly addresses the nature of the specific fire or fire-related topic, highlights important findings from the data, and may suggest other resources to consider for further information. Also included are recent examples of fire incidents that demonstrate some of the issues addressed in the report or that put the report topic in context.
Findingsĵ Seventy-six percent of all civilian fire injuries occurred in residential buildings.ĵ Residential building fires resulting in injuries occurred most frequently in the late
afternoon and early evening hours.ĵ At 11 percent, January had the highest incidence of residential building fires
resulting in injuries.ĵ Cooking was the leading cause of residential building fires that resulted in injuries.ĵ Of the civilian fire injuries that occurred in residential buildings, 35 percent resulted
from trying to control a fire; an additional 26 percent occurred while the victim was attempting to escape.
ĵ Smoke inhalation and thermal burns were the primary symptoms resulting in injury, accounting for 78 percent of all injuries resulting from residential building fires.
ĵ The leading human factor contributing to injuries in residential building fires was being “asleep” (52 percent).
ĵ Bedrooms (34 percent) were the leading specific location where civilian injuries occurred in residential building fires.
Fires can strike anywhere — in structures, buildings, automobiles and the outdoors. Fires that affect our homes are often the most tragic and the most preventable. While the loss of our possessions can be upsetting, the physical injuries and psychological impacts that fires can inflict on our lives are often far more devastating. It is a sad fact that each year, over 70 percent of all civilian fire injuries occurred as a result of fires in residential buildings — our homes.1,2
From 2013 to 2015, 76 percent of all civilian fire injuries occurred in residential buildings.3 This topical fire report focuses on the characteristics of these injuries as reported to the National Fire Incident Reporting System (NFIRS) from 2013 to 2015.4 NFIRS data is used for the analyses presented throughout this report.
By definition, civilian fire injuries involve people who are injured as a result of a fire and are not on active duty with a firefighting organization.5 These injuries generally occur from activities of fire control, escaping from the dangers of fire, or sleeping. Fires resulting in injuries are those fires where one or more injuries occur.
Annually, from 2013 to 2015, an estimated 12,000 civilian fire injuries resulted from an estimated 7,700 residential building fires resulting in injuries and 380,200 total residential building fires.6 On average, someone is injured in a residential building fire every 44 minutes.
For the purpose of this report, the term “residential building fires resulting in injuries” is synonymous with “residential fires resulting in injuries” and the term “residential building fires” is synonymous with “residential fires.” The term “residential fires resulting in injuries” is used throughout the body of this report; the findings, tables, charts, headings and endnotes reflect the full category, “residential building fires resulting in injuries.”
TFRS Volume 18, Issue 5 | Civilian Fire Injuries in Residential Buildings (2013-2015)
2
Civilian injury rates for residential building firesNot all fires produce injuries. When civilian fire injuries were averaged over reported residential fires, the overall injury rate was nearly three civilian injuries per 100 residential fires (Table 1).7 Residential fires that resulted in injuries, however, had 130 injuries for every 100 fires. Of the residential fires resulting in injuries, 82 percent resulted in one civilian injury, 13 percent resulted in two civilian injuries, and 5 percent resulted in three or more civilian injuries.
Table 1. Civilian injury rates for residential building fires per 100 fires (2013-2015)
Injuries per 100 injury-producing residential building fires Injuries per 100 residential building fires
129.8 2.6Source: NFIRS 5.0.
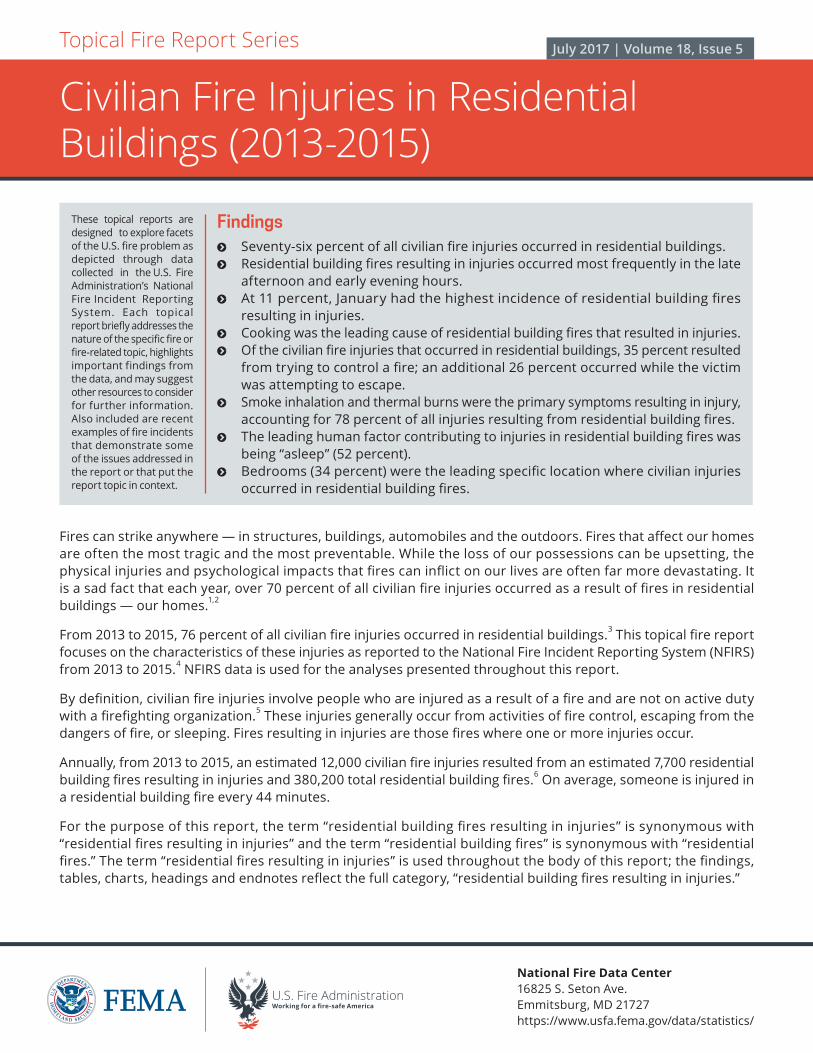
When residential building fires resulting in injuries occurResidential fires resulting in injuries follow a daily pattern.8 In addition, unlike fatal residential fires which occurred most frequently late at night or in the very early morning hours,9 residential fires resulting in civilian injuries follow a pattern similar to that of all residential fires. As shown in Figure 1, residential fires resulting in injuries occurred most frequently in the late afternoon and early evening hours, when many people are expected to be cooking dinner. The time period from 4 to 8 p.m. accounted for 23 percent of the residential fires resulting in injuries. Cooking, discussed later in the “Causes of residential building fires resulting in injuries” section, was the primary cause (37 percent) for residential fires that resulted in injuries. In general, residential fires resulting in injuries decreased to the lowest point of the day, between 5 and 8 a.m., and then steadily increased during the daytime hours until reaching the daily peak.
Figure 1. Residential building fires resulting in injuries by time of alarm (2013-2015)
0.0
1.0
2.0
3.0
4.0
5.0
6.0
7.0
8.0
11 p
.m. -
Mid
10 -
11 p
.m.
9 - 1
0 p.
m.
8 - 9
p.m
.
7 - 8
p.m
.
6 - 7
p.m
.
5 - 6
p.m
.
4 - 5
p.m
.
3 - 4
p.m
.
2 - 3
p.m
.
1 - 2
p.m
.
12 -
1 p.
m.
11 a
.m. -
12
p.m
.
10 -
11 a
.m.
9 - 1
0 a.
m.
8 - 9
a.m
.
7 - 8
a.m
.
6 - 7
a.m
.
5 - 6
a.m
.
4 - 5
a.m
.
3 - 4
a.m
.
2 - 3
a.m
.
1 - 2
a.m
.
Mid
- 1
a.m
.
3.9 4.13.5
2.73.1
3.6 3.84.1 4.4
4.8 4.6 4.95.5 5.5
5.9 5.85.4
4.74.0 4.2
2.6
Perc
ent o
f fire
s
Time of alarm
Residential building fires resulting in injuriesResidential building fires
3.4 3.12.7
Source: NFIRS 5.0.Note: Total does not add up to 100 percent due to rounding.

TFRS Volume 18, Issue 5 | Civilian Fire Injuries in Residential Buildings (2013-2015)
3
Residential fires resulting in injuries also follow a yearly pattern similar to that of all residential fires. In addition, residential fires resulting in injuries tend to follow a seasonal trend, with more fires taking place during the colder months than the warmer months (Figure 2). January, peaking at 11 percent, had the highest incidence of residential fires resulting in injuries. June through September resulted in the least amount of residential fires resulting in injuries. This drop may be explained by a decrease in residential heating fires and their associated injuries during the warmer months.10 Similar to all fires in residential buildings, residential fires resulting in injuries occurred most often on Saturdays and Sundays (Figure 3).
Figure 2. Residential building fires resulting in injuries by month (2013-2015)
0.0
2.0
4.0
6.0
8.0
10.0
12.0
14.0
Dec
embe
r
Nov
embe
r
Oct
ober
Sept
embe
r
Augu
st
July
June
May
Apri
l
Mar
ch
Febr
uary
Janu
ary
11.1
9.5
8.07.0 7.3 7.1 6.6
7.68.7 8.7
9.88.5
Perc
ent o
f fire
s
Month of year
Residential building fires resulting in injuries
Residential building fires
Source: NFIRS 5.0.Note: Total does not add up to 100 percent due to rounding.
Figure 3. Residential building fires resulting in injuries by day of week (2013-2015)
0.0
5.0
10.0
15.0
20.0
25.0
SaturdayFridayThursdayTuesdayMondaySunday
14.813.5 14.2 14.2 14.2 15.014.1
Perc
ent o
f fire
s
Wednesday
Day of week
Residential building fires resulting in injuries
Residential building fires
0.0
5.0
10.0
15.0
20.0
25.0
SaturdayFridayThursdayTuesdayMondaySunday
Source: NFIRS 5.0.

TFRS Volume 18, Issue 5 | Civilian Fire Injuries in Residential Buildings (2013-2015)
4
Cause of injuryThe predominant cause of residential fire injuries, by far, involved exposure to fire products (80 percent), such as flame, heat, smoke or gas (Figure 4). The next two leading causes were exposure to toxic fumes other than smoke (8 percent) and other, unspecified causes (4 percent).
Figure 4. Civilian fire injuries in residential buildings by cause of injury (2013-2015)
4.0
Percent of fire injuries in residential buildings0.0 10.0 20.0 30.0 40.0 50.0 60.0 70.0 80.0 90.0
Structural collapse
Caught or trapped
Overexertion or strain
Multiple causes
Fell, slipped or tripped
Struck by or contact with object
Jumped in escape attempt
Other
Exposed to toxic fumes other than smoke
Exposed to fire products 79.6
7.5
2.4
2.1
1.6
1.2
1.0
0.5
0.1
Source: NFIRS 5.0.Note: Percentagescomputedforonlythoseinjurieswherecauseswerespecified.Thecauseofinjurywasspecifiedin70percentofreportedinjuries.
Primary symptoms of civilian fire injuriesSmoke inhalation and thermal burns were the primary symptoms of reported injuries, accounting for 78 percent of all injuries resulting from residential fires (Figure 5). Smoke inhalation alone accounted for 41 percent of residential fire injuries. Thermal burns (as opposed to scalds or chemical or electrical burns) accounted for another 24 percent, and burns combined with smoke inhalation accounted for an additional 13 percent. Breathing difficulty was reported for only 6 percent of injuries. Scalds (4 percent) and cuts or lacerations (3 percent) accounted for an even smaller proportion of the injuries.
Thermal burns are caused by contact with flames, hot liquids, hot surfaces, and other sources of high heat. Of the thermal burns to the body, 71 percent were to the upper and lower extremities (56 percent and 15 percent, respectively).
Of the smoke inhalation injuries, 70 percent were internal injuries, which are particularly critical, as they can lead to lung damage. The inflammation and damage caused by smoke inhalation to delicate breathing sacs in the lungs actually grow worse in the hours after the incident. A chest X-ray can look clear, and oxygen levels in the blood may appear normal in the first few hours after a fire. A day or two later, however, the victim can suddenly take a turn for the worse as the lungs become unable to properly exchange oxygen.11
Based on the severity of the injury, 57 percent of the civilian fire injuries in residential fires were deemed minor. Only 14 percent of the injuries were considered serious or life-threatening.

TFRS Volume 18, Issue 5 | Civilian Fire Injuries in Residential Buildings (2013-2015)
5
Figure 5. Civilian fire injuries in residential buildings by primary symptoms (2013-2015)
Percent of fire injuries in residential buildings0.0 5.0 10.0 15.0 20.0 25.0 30.0 35.0 40.0 45.0 50.0
Cut or laceration
Burns, scald
Breathing difficulty or shortness of breath
All other symptoms
Burns and smoke inhalation
Burns only, thermal
Smoke inhalation 40.9
24.1
13.1
8.3
6.2
4.2
3.1
Source: NFIRS 5.0.Notes: 1.Percentagescomputedforonlythoseinjurieswheresymptomswerespecified.Theprimarysymptomswerespecifiedin64percentofreportedinjuries. 2. Total does not add up to 100 percent due to rounding.
Areas of the body affectedThe body parts affected most by residential fire injuries (Figure 6) included internal parts (32 percent) and the upper extremities (25 percent). As discussed, the types of injuries that affected most areas of the body consisted of smoke inhalation, thermal burns, or a combination of both.
Figure 6. Civilian fire injuries in residential buildings by part of body injured (2013-2015)
11.3
Percent of fire injuries in residential buildings0.0 5.0 10.0 15.0 20.0 25.0 30.0 35.0
Spine
Abdomen
Neck and shoulder
Lower extremities
Thorax, includes chest and back, excludes spine
Head
Multiple body parts
Upper extremities
Internal 31.8
25.1
10.5
10.3
8.7
1.4
0.5
0.3
Source: NFIRS 5.0.Notes: 1. Percentagescomputedforonlythoseinjurieswherepartofbodyinjuredwasspecified.Thepartofbodyinjuredwasspecifiedin58percentofreportedinjuries. 2. Total does not add up to 100 percent due to rounding.
TFRS Volume 18, Issue 5 | Civilian Fire Injuries in Residential Buildings (2013-2015)
6
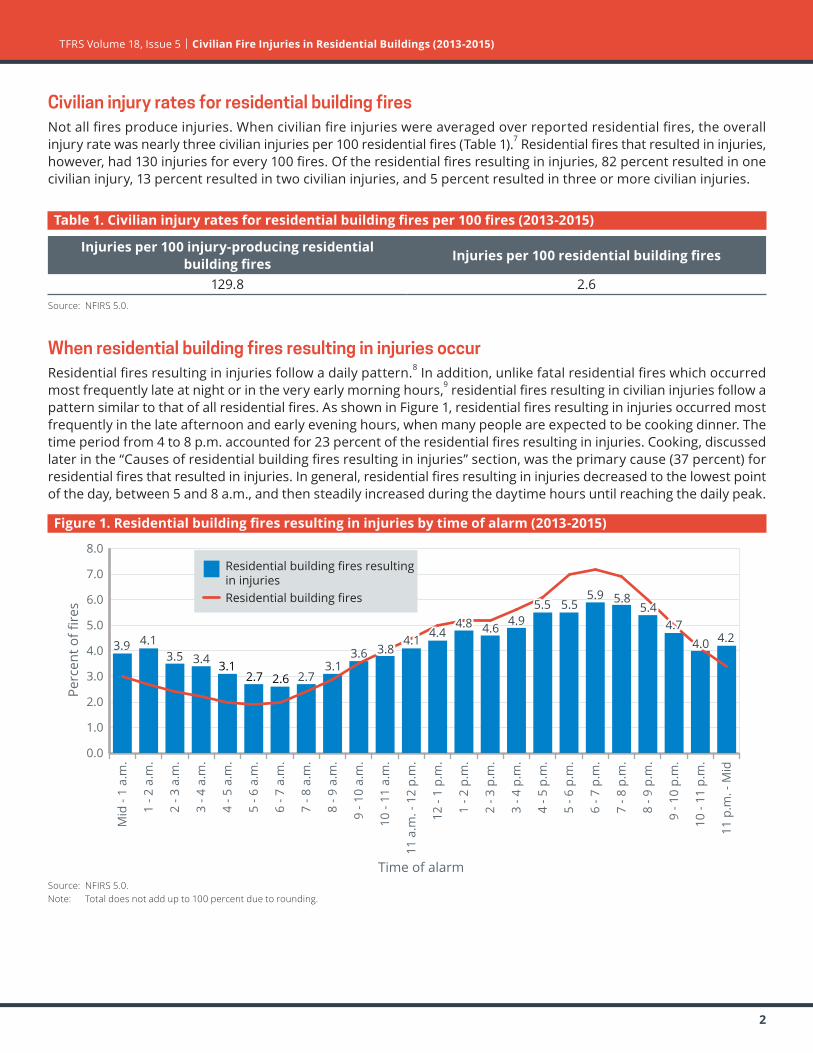
Factors contributing to civilian fire injuriesAs shown in Figure 7, the most notable factors contributing to civilian fire injuries (outside of “other (unspecified) factors”) involved escape (27 percent), fire pattern (24 percent), and equipment-related factors (17 percent). Escape factors include unfamiliarity with exits, excessive travel distance to the nearest clear exit, a choice of an inappropriate exit route, re-entering the building, and clothing catching fire while escaping. Fire pattern factors involve such situations as exits are blocked by smoke and flame, vision is blocked or impaired by smoke, and civilians are trapped above or below the fire. Equipment-related problems include such factors as the improper use of cooking or heating equipment and the use of unvented heating equipment.
Figure 7. Factors contributing to civilian fire injuries in residential buildings (2013-2015)
Percent of fire injuries in residential buildings0.0 5.0 10.0 15.0 20.0 25.0 30.0
Vehicle-related factors
Collapse
Other special factors
Egress problem
Equipment-related factors
Fire pattern
Other (unspecified) factor
Escape 26.5
25.5
16.7
9.3
7.3
0.7
0.3
23.7
Source: NFIRS 5.0.Notes: 1. Includesincidentswherefactorscontributingtoinjurywerespecified.Factorscontributingtoinjurywerespecifiedin30percentofreportedinjuries. 2. As multiple factors contributing to injury may be noted for each injury, the total sums to more than 100 percent.
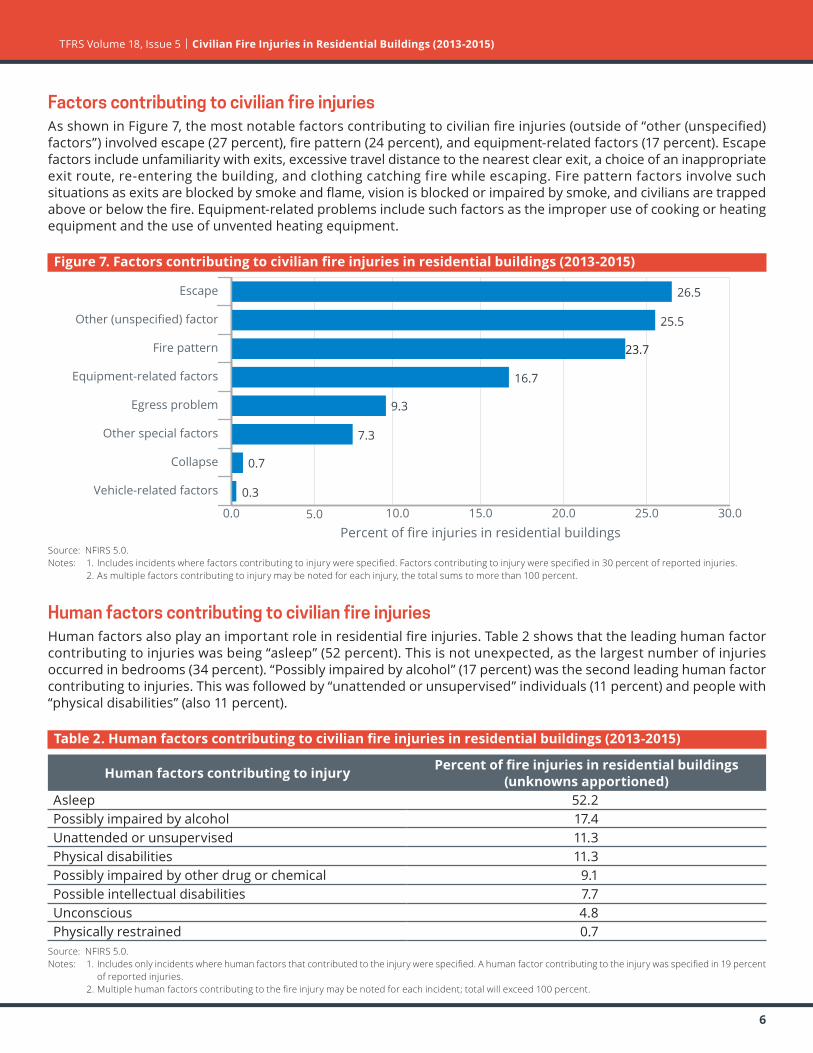
Human factors contributing to civilian fire injuriesHuman factors also play an important role in residential fire injuries. Table 2 shows that the leading human factor contributing to injuries was being “asleep” (52 percent). This is not unexpected, as the largest number of injuries occurred in bedrooms (34 percent). “Possibly impaired by alcohol” (17 percent) was the second leading human factor contributing to injuries. This was followed by “unattended or unsupervised” individuals (11 percent) and people with “physical disabilities” (also 11 percent).
Table 2. Human factors contributing to civilian fire injuries in residential buildings (2013-2015)
Human factors contributing to injury Percent of fire injuries in residential buildings (unknowns apportioned)
Asleep 52.2Possibly impaired by alcohol 17.4Unattended or unsupervised 11.3Physical disabilities 11.3Possibly impaired by other drug or chemical 9.1Possible intellectual disabilities 7.7Unconscious 4.8Physically restrained 0.7
Source: NFIRS 5.0.Notes: 1. Includesonlyincidentswherehumanfactorsthatcontributedtotheinjurywerespecified.Ahumanfactorcontributingtotheinjurywasspecifiedin19percent
of reported injuries. 2.Multiplehumanfactorscontributingtothefireinjurymaybenotedforeachincident;totalwillexceed100percent.
TFRS Volume 18, Issue 5 | Civilian Fire Injuries in Residential Buildings (2013-2015)
7
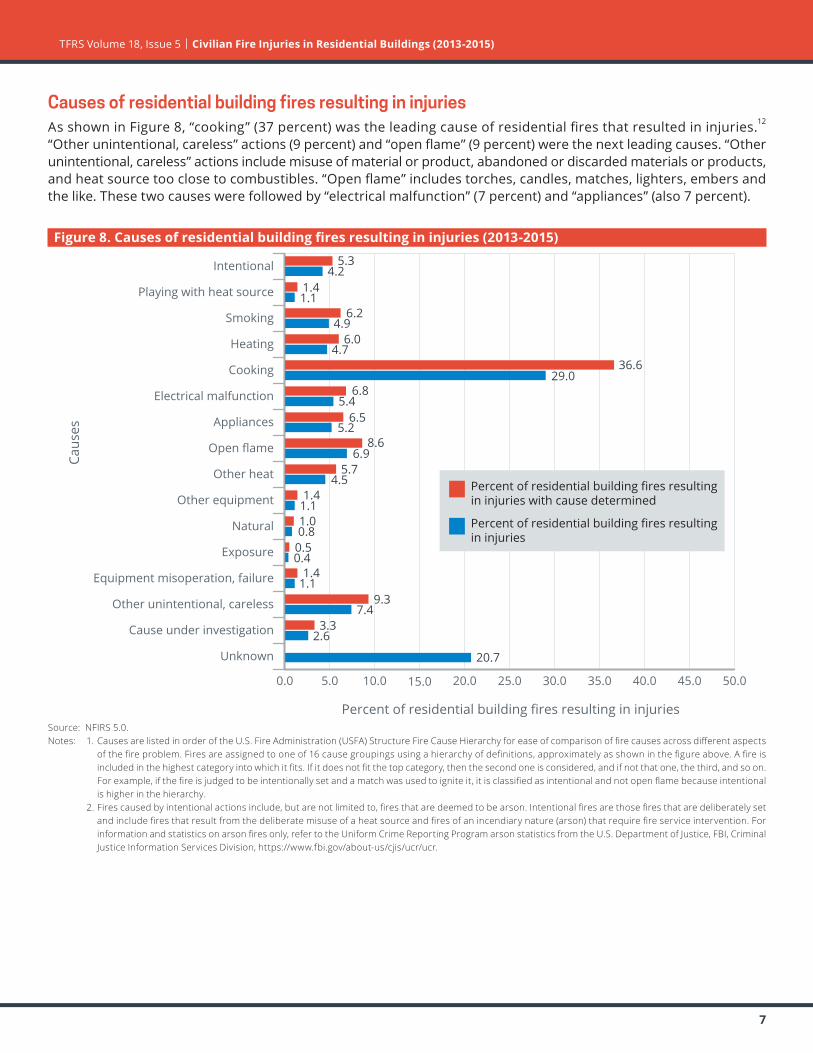
Causes of residential building fires resulting in injuriesAs shown in Figure 8, “cooking” (37 percent) was the leading cause of residential fires that resulted in injuries.12 “Other unintentional, careless” actions (9 percent) and “open flame” (9 percent) were the next leading causes. “Other unintentional, careless” actions include misuse of material or product, abandoned or discarded materials or products, and heat source too close to combustibles. “Open flame” includes torches, candles, matches, lighters, embers and the like. These two causes were followed by “electrical malfunction” (7 percent) and “appliances” (also 7 percent).
Figure 8. Causes of residential building fires resulting in injuries (2013-2015)
Caus
es
Percent of residential building fires resulting in injuries
0.0 5.0 10.0 15.0 20.0 25.0 30.0 35.0 40.0 45.0 50.0
Unknown
Cause under investigation
Other unintentional, careless
Equipment misoperation, failure
Exposure
Natural
Other equipment
Other heat
Open flame
Appliances
Electrical malfunction
Cooking
Heating
Smoking
Playing with heat source
Intentional
Percent of residential building fires resulting in injuries with cause determined
Percent of residential building fires resultingin injuries
5.34.2
1.41.1
6.24.9
6.0
36.629.0
6.85.4
6.55.2
8.66.9
5.74.5
1.41.11.00.8
0.50.4
1.41.1
9.37.4
3.32.6
20.7
4.7
Source: NFIRS 5.0.Notes: 1.CausesarelistedinorderoftheU.S.FireAdministration(USFA)StructureFireCauseHierarchyforeaseofcomparisonoffirecausesacrossdifferentaspects
ofthefireproblem.Firesareassignedtooneof16causegroupingsusingahierarchyofdefinitions,approximatelyasshowninthefigureabove.Afireisincludedinthehighestcategoryintowhichitfits.Ifitdoesnotfitthetopcategory,thenthesecondoneisconsidered,andifnotthatone,thethird,andsoon.Forexample,ifthefireisjudgedtobeintentionallysetandamatchwasusedtoigniteit,itisclassifiedasintentionalandnotopenflamebecauseintentionalis higher in the hierarchy.
2.Firescausedbyintentionalactionsinclude,butarenotlimitedto,firesthataredeemedtobearson.Intentionalfiresarethosefiresthataredeliberatelysetandincludefiresthatresultfromthedeliberatemisuseofaheatsourceandfiresofanincendiarynature(arson)thatrequirefireserviceintervention.Forinformationandstatisticsonarsonfiresonly,refertotheUniformCrimeReportingProgramarsonstatisticsfromtheU.S.DepartmentofJustice,FBI,CriminalJusticeInformationServicesDivision,https://www.fbi.gov/about-us/cjis/ucr/ucr.

TFRS Volume 18, Issue 5 | Civilian Fire Injuries in Residential Buildings (2013-2015)
8
Civilian activity when injuredMost civilian fire injuries occurred when the victim was attempting to control the fire (35 percent), followed by attempting to escape (26 percent) and sleeping (11 percent), as shown in Figure 9. The USFA recommends leaving fighting a fire to trained firefighters and that efforts be focused on following a preset escape plan. To escape a fire, many civilians make the mistake of fleeing through the area where the fire is located. That area of a fire has tremendous heat, smoke and a toxic atmosphere that can render a person unconscious. As a result, it is imperative that an escape plan be prepared and practiced. With a well-thought out plan that includes multiple escape options, the chances of survival and escaping without injuries greatly increase. In addition, it has been demonstrated that people may not wake up from the smell of smoke while sleeping. Therefore, it is also vital that smoke alarms are installed in homes to alert sleeping people to the presence of fire.13
Figure 9. Civilian fire injuries in residential buildings by activity when injured (2013-2015)
Percent of fire injuries in residential buildings0.0 5.0 10.0 15.0 20.0 25.0 30.0 35.0 40.0
Returning to vicinity of fire after control of fire
Unable to act
Irrational act
Returning to vicinity of the fire before control of fire
Rescue attempt
Activity, other
Sleeping
Escaping
Fire control 34.7
25.9
8.2
7.0
6.6
3.0
3.0
0.4
11.2
Source: NFIRS 5.0.Note: Percentagescomputedforonlythoseinjurieswhereactivityinformationwasavailable.Theactivitywheninjuredwasspecifiedin56percentofreportedinjuries.
Gender, race and ethnicity of civilian fire injuriesMales accounted for 54 percent and females accounted for 46 percent of residential fire injuries. Figure 10 shows the percentage distribution of civilian fire injuries by race. Where racial information was provided, Whites constituted 62 percent of the injuries, followed by Blacks or African-Americans (30 percent); other, including multiracial (6 percent); Asians (1 percent); American Indians or Alaska Natives (less than 1 percent); and Native Hawaiians or other Pacific Islanders (also less than 1 percent).
The ethnicity element shows that 87 percent of the injuries occurred to non-Hispanics or non-Latinos, compared to Hispanics or Latinos (13 percent). Ethnicity was specified for 40 percent of reported injuries.

TFRS Volume 18, Issue 5 | Civilian Fire Injuries in Residential Buildings (2013-2015)
9
Figure 10. Civilian fire injuries in residential buildings by race (2013-2015)
Percent of fire injuries in residential buildings0.0 10.0 20.0 30.0 40.0 50.0 60.0 70.0
Native Hawaiian or other Pacific Islander
American Indian or Alaska Native
Asian
Other, includes multiracial
Black or African-American
White 62.4
5.5
1.4
0.7
0.2
29.7
Source: NFIRS 5.0.Notes: 1.Percentagescomputedforonlythoseinjurieswhereraceinformationwasavailable.Racewasspecifiedin53percentofreportedinjuries. 2. Total does not add up to 100 percent due to rounding.
Age of civilians injured and activity when injuredCivilians between the ages of 20 and 49 accounted for 46 percent of injuries in residential fires (Figure 11). An additional 17 percent of those with injuries were less than 20 years old. Adults aged 50 and over accounted for 38 percent of those with injuries.14
With the exception of children aged 9 or younger, the first reaction of civilians is either to try to control or escape the fire (Table 3). At the time of injury, for those aged 10 and over, trying to control the fire and escaping were the two leading activities that resulted in injuries. Those aged 10 to 69 primarily got injured trying to control the fire (38 percent), followed by trying to escape the fire (24 percent). Those aged 70 and over primarily got injured trying to escape the fire (34 percent), followed by trying to control the fire (24 percent).
For children aged 0 to 9, escaping and sleeping were the two leading activities that resulted in injuries. Those aged 0 to 9 primarily got injured when trying to escape the fire (37 percent), followed by sleeping (27 percent).
The young and the very old are less likely to be as mobile or ready to act in a fire situation. Infants, young children and older adults may require special provisions in a fire or emergency situation. Thus, it is not surprising that these individuals are less likely to attempt to control the fire.
Figure 11. Civilian fire injuries in residential buildings by age group (2013-2015)
0.0
2.0
4.0
6.0
8.010.0
12.0
14.0
16.0
18.0
20.0
90+80-8970-7960-6950-5940-4930-3920-2910-190-9
8.6 7.9
14.916.1
11.1
5.9
3.4
1.2
15.6 15.4
Perc
ent o
f inj
urie
s in
resi
dent
ial b
uild
ing
fires
AgeSource: NFIRS 5.0.Notes: 1.Percentagescomputedforonlythoseinjurieswhereagewasvalid.Avalidagewasprovidedfornearlyall(99.8percent)reportedinjuries. 2. Total does not add up to 100 percent due to rounding.

TFRS Volume 18, Issue 5 | Civilian Fire Injuries in Residential Buildings (2013-2015)
10
Table 3. Leading activities resulting in civilian fire injuries in residential buildings by age group (2013-2015)
Percent of fire injuries where age and activity reported (2013-2015)Age group Fire control Escaping Sleeping
0-9 8.8 37.2 27.010-19 37.8 28.3 8.820-29 42.1 22.1 9.130-39 40.9 22.4 9.240-49 38.4 22.9 9.450-59 35.7 24.5 10.960-69 29.4 27.8 11.970-79 26.3 34.3 12.480-89 22.3 35.1 10.7
90+ 20.5 31.3 10.7Overall 34.7 25.9 11.2
Source: NFIRS 5.0.Note: Percentages computed for only those injuries where age was valid and activity was reported.
Specific location at time of fire injuryBedrooms (34 percent) were the leading specific location where civilian fire injuries occurred in residential buildings (Table 4). Family rooms and living rooms (10 percent) and kitchens and cooking areas (10 percent) were the next leading specific locations.
While not specific rooms in the home, egress areas were the specific locations where 18 percent of fire injuries occurred. Exits (such as corridors, stairways and doors) can get filled with smoke, fire or extreme heat, making escape routes treacherous.
Table 4. Leading specific location of civilian fire injuries in residential buildings (2013-2015)
Specific location at time of injury Percent (unknowns apportioned)
Bedrooms 33.8Common room, den, family room, living room, lounge 10.3Kitchens and cooking areas 9.8
Source: NFIRS 5.0.Note: Percentagescomputedforonlythoseinjurieswherethespecificlocationatthetimeofinjurywasspecified.Thelocationwasspecifiedfor19percentof
reported injuries.

TFRS Volume 18, Issue 5 | Civilian Fire Injuries in Residential Buildings (2013-2015)
11
ExamplesThe following are some recent examples of civilian fire injuries reported by the media:
ĵ February 2017: Two people were injured as a result of a Monday morning house fire that broke out in Salt Lake City, Utah. Firefighters arrived on scene to find the front of the two-story house engulfed in heavy smoke and flames. A woman in her early twenties suffered severe smoke inhalation and second-degree burns to her face and shoulders. In addition, a male occupant of the home was transported to a local hospital for his injuries. Three other residents of the home escaped the fire uninjured. The blaze appeared to be accidental, but no cause was determined.15
ĵ January 2017: Firefighters rescued four severely burned children from a single-story house fire in South Los Angeles, California. Fire crews were called to the scene at 10:51 p.m. Upon arrival, firefighters found heavy fire coming from the front of the residence with occupants trapped inside. The house was secured with window security bars and steel screen doors; however, one unbarred window was discovered which allowed firefighters to rescue three boys ages 2, 3 and 5 and one 7-year old girl. The children were transported to a local hospital in critical condition. No other injuries were reported. One smoke alarm was found in the home, but its operational status at the time of the fire was unknown. The cause of the fire remains under investigation.16
ĵ January 2017: Two people were treated for smoke inhalation injuries resulting from an East Bronx, New York, building fire. The fire started in the basement of the mixed-use building around 2 a.m. and spread to the upper floors and roof. The building was home to a first floor restaurant and second and third floor apartments. No other injuries were reported.17
ĵ January 2017: A fire that destroyed a house in South Wichita, Kansas, injured two occupants of the home. The fire started around 5 a.m. on Monday and was reported to have been caused by several space heaters that were plugged into extension cords. The residents received minor injuries from broken glass as they escaped out a window.18
Escape planning for residential buildingsEveryone should know how to escape from a burning home. The USFA recommends leaving fighting a fire to trained firefighters. Instead, efforts should be focused on escaping.
Smoke is very dangerous. It blocks vision, and the poisonous gases can cause dizziness, disorientation and ultimately death. These conditions can result in becoming lost or trapped in a home. Because many people die trying to escape from a fire, everyone should practice a home escape plan.
Put working smoke alarms on every level of the home, as well as inside and outside of sleeping areas. Everyone should create a home escape plan and know two safe ways out of each room. Establish a family meeting place outside the home. In addition, because young children, older adults, and individuals with disabilities may need help getting out of the home, the plan should include who will assist them in a fire. Practice the plan with everyone in the home at least two times a year.
For more information on preparing and practicing a fire escape plan, visit https://www.usfa.fema.gov/prevention/outreach/escape.html.
Alerting/Suppression systems in residential buildingsFire fatalities and injuries have declined over the last 35 years, partly due to new technologies to detect and extinguish fires. Smoke alarms are present in most homes. In addition, the use of residential sprinklers is widely supported by the fire service and is gaining support within residential communities.
Nationally, only 3 percent of households do not have smoke alarms.19 If a fire occurs, properly installed and maintained smoke alarms provide an early warning signal to everyone in a home. Smoke alarms help save lives and property.

TFRS Volume 18, Issue 5 | Civilian Fire Injuries in Residential Buildings (2013-2015)
12
The USFA continues to partner with other government agencies and fire service organizations to improve and develop new smoke alarm technologies. More information on smoke alarm technologies, performance, disposal and storage, training bulletins, and public education and outreach materials is available at https://www.usfa.fema.gov/prevention/technology/smoke_fire_alarms.html. Additionally, the USFA’s position statement on smoke alarms is available at https://www.usfa.fema.gov/about/smoke_alarms_position.html.
Residential sprinkler systems help to reduce the risk of deaths and injuries, homeowner insurance premiums, and uninsured property losses. Yet many homes do not have automatic extinguishing systems, although they are often found in hotels and businesses. Sprinklers are required by code in hotels and many multifamily residences. There are major movements in the U.S. fire service to require sprinklers in all new homes. At present, however, they are largely absent in residences nationwide.20
The USFA and fire service officials across the nation are working to promote and advance residential fire sprinklers. More information on costs and benefits, performance, training bulletins, and public education and outreach materials regarding residential sprinklers is available at https://www.usfa.fema.gov/prevention/technology/home_fire_sprinklers.html. Additionally, the USFA’s position statement on residential sprinklers is available at https://www.usfa.fema.gov/about/sprinklers_position.html.
NFIRS data specifications for civilian fire injuries in residential buildingsData for this report were extracted from the NFIRS annual Public Data Release files for 2013, 2014 and 2015. Only Version 5.0 data were extracted.
Civilian injuries in residential building fires are defined using the following criteria:
ĵ Aid Types 3 (mutual aid given) and 4 (automatic aid given) were excluded to avoid double counting of incidents.
ĵ Incident Types 111 to 123 (excluding Incident Type 112):
Incident Type Description111 Building fire113 Cooking fire, confined to container114 Chimney or flue fire, confined to chimney or flue115 Incinerator overload or malfunction, fire confined116 Fuel burner/boiler malfunction, fire confined117 Commercial compactor fire, confined to rubbish118 Trash or rubbish fire, contained120 Fire in mobile property used as a fixed structure, other121 Fire in mobile home used as fixed residence122 Fire in motor home, camper, recreational vehicle123 Fire in portable building, fixed location
Note:IncidentTypes113to118donotspecifyifthestructureisabuilding.
TFRS Volume 18, Issue 5 | Civilian Fire Injuries in Residential Buildings (2013-2015)
13
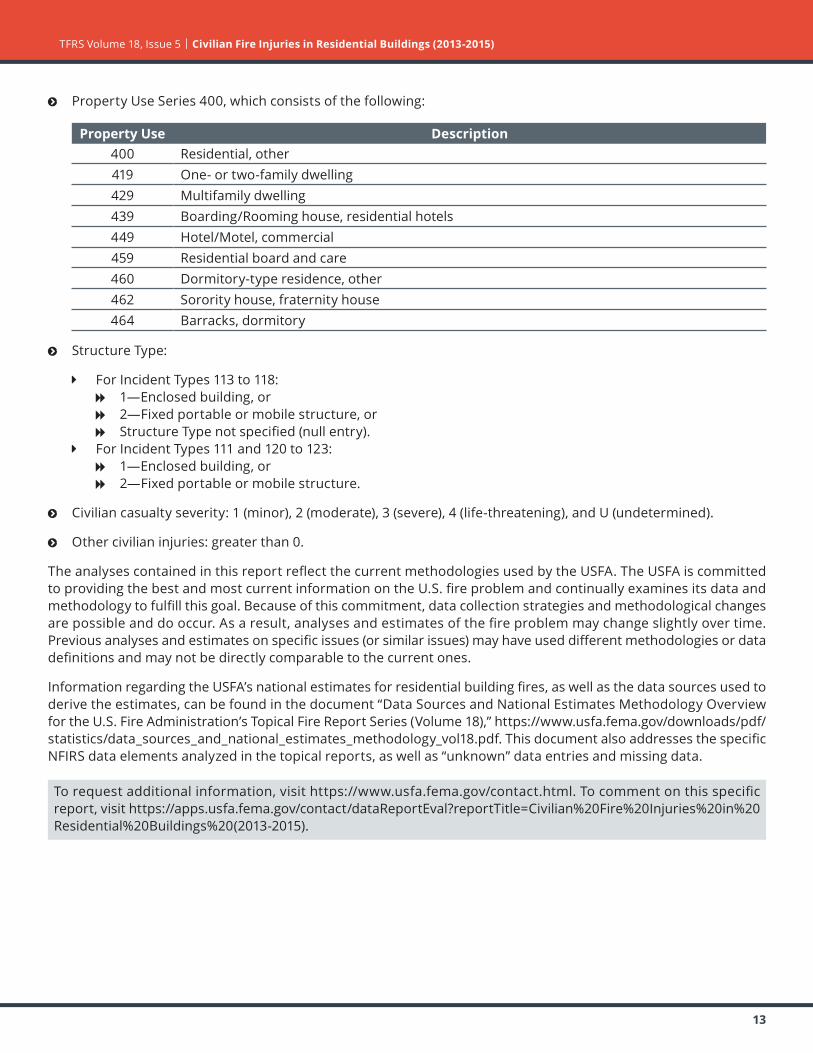
ĵ Property Use Series 400, which consists of the following:
Property Use Description400 Residential, other419 One- or two-family dwelling429 Multifamily dwelling439 Boarding/Rooming house, residential hotels449 Hotel/Motel, commercial459 Residential board and care460 Dormitory-type residence, other462 Sorority house, fraternity house464 Barracks, dormitory
ĵ Structure Type:
Ý For Incident Types 113 to 118: f 1—Enclosed building, or f 2—Fixed portable or mobile structure, or f Structure Type not specified (null entry).
Ý For Incident Types 111 and 120 to 123: f 1—Enclosed building, or f 2—Fixed portable or mobile structure.
ĵ Civilian casualty severity: 1 (minor), 2 (moderate), 3 (severe), 4 (life-threatening), and U (undetermined).
ĵ Other civilian injuries: greater than 0.
The analyses contained in this report reflect the current methodologies used by the USFA. The USFA is committed to providing the best and most current information on the U.S. fire problem and continually examines its data and methodology to fulfill this goal. Because of this commitment, data collection strategies and methodological changes are possible and do occur. As a result, analyses and estimates of the fire problem may change slightly over time. Previous analyses and estimates on specific issues (or similar issues) may have used different methodologies or data definitions and may not be directly comparable to the current ones.
Information regarding the USFA’s national estimates for residential building fires, as well as the data sources used to derive the estimates, can be found in the document “Data Sources and National Estimates Methodology Overview for the U.S. Fire Administration’s Topical Fire Report Series (Volume 18),” https://www.usfa.fema.gov/downloads/pdf/statistics/data_sources_and_national_estimates_methodology_vol18.pdf. This document also addresses the specific NFIRS data elements analyzed in the topical reports, as well as “unknown” data entries and missing data.
To request additional information, visit https://www.usfa.fema.gov/contact.html. To comment on this specific report, visit https://apps.usfa.fema.gov/contact/dataReportEval?reportTitle=Civilian%20Fire%20Injuries%20in%20Residential%20Buildings%20(2013-2015).
TFRS Volume 18, Issue 5 | Civilian Fire Injuries in Residential Buildings (2013-2015)
14
Notes:1In the NFIRS Version 5.0, a structure is a constructed item of which a building is one type. In previous versions of the NFIRS, the term “residential structure” commonly referred to buildings where people live. To coincide with this concept, the definition of a residential structure fire for the NFIRS 5.0 includes only those fires where the NFIRS 5.0 structure type is 1 or 2 (enclosed building and fixed portable or mobile structure) with a residential property use. Such structures are referred to as “residential buildings” to distinguish these buildings from other structures on residential properties that may include fences, sheds and other uninhabitable structures. In addition, confined fire incidents that have a residential property use but do not have a structure type specified are presumed to occur in buildings. Nonconfined fire incidents that have a residential property use without a structure type specified are considered to be invalid incidents (structure type is a required field) and are not included. 2The percentage presented here is based on the analysis of residential building fire injuries since 2003, the first year for which residential building estimates are available (https://www.usfa.fema.gov/data/statistics/order_download_data.html) and the National Fire Protection Association’s (NFPA’s) annual estimates of fire injuries (http://www.nfpa.org/research/reports-and-statistics/fires-in-the-us/overall-fire-problem/overview-of-the-us-fire-problem). The consistency of the percentage of residential building fire injuries leads analysts to believe this proportion has most likely been stable for some time. 3Residential buildings include, but are not limited to, one- or two-family dwellings, multifamily dwellings, manufactured housing, boarding houses or residential hotels, commercial hotels, college dormitories, and sorority/fraternity houses.4Fire department participation in the NFIRS is voluntary; however, some states do require their departments to participate in the state system. Additionally, if a fire department is a recipient of a Fire Act Grant, participation is required. From 2013 to 2015, 67 percent of the NFPA’s annual average estimated 1,294,500 fires to which fire departments responded were captured in the NFIRS. Thus, the NFIRS is not representative of all fire incidents in the U.S. and is not a “complete” census of fire incidents. Although the NFIRS does not represent 100 percent of the incidents reported to fire departments each year, the enormous dataset exhibits stability from one year to the next, without radical changes. Results based on the full dataset are generally similar to those based on part of the data.5Civilians also include emergency personnel who are not members of the fire department, such as police officers or utility workers.6In this topical report, fires are rounded to the nearest 100 and injuries to the nearest 25. National estimates are based on 2013 to 2015 native Version 5.0 data from the NFIRS, residential structure fire loss estimates from the NFPA’s annual surveys of fire loss, and the USFA’s residential building fire loss estimates: https://www.usfa.fema.gov/data/statistics/order_download_data.html. Further information on the USFA’s residential building fire loss estimates can be found in the “National Estimates Methodology for Building Fires and Losses,” August 2012, https://www.usfa.fema.gov/downloads/pdf/statistics/national_estimate_methodology.pdf. For information on the NFPA’s survey methodology, see the NFPA’s report “Fire Loss in the United States During 2015,” September 2016, http://www.nfpa.org/research/reports-and-statistics/fires-in-the-us/overall-fire-problem/fire-loss-in-the-united-states. 7The average fire injury rates computed from national estimates do not agree with average fire injury rates computed from NFIRS data alone. The fire injury rate for fires with injuries computed from national estimates is 100 x (12,000/7,700) = 155.8 injuries per 100 injury-producing residential building fires. The fire injury rate for all residential building fires computed from national estimates is 100 x (12,000/380,200) = 3.2 injuries per 100 residential building fires.8For the purposes of this report, the time of the fire alarm is used as an approximation for the general time at which the fire started. However, in the NFIRS, it is the time at which the fire was reported to the fire department.9The USFA, “Civilian Fire Fatalities in Residential Buildings (2013-2015),” Volume 18, Issue 4, July 2017, https://www.usfa.fema.gov/downloads/pdf/statistics/v18i4.pdf. 10The USFA, “Heating Fires in Residential Buildings (2010-2012),” Volume 15, Issue 7, December 2014, https://www.usfa.fema.gov/downloads/pdf/statistics/v15i7.pdf. 11Ubelacker, Sheryl, “Doctors: Smoke inhalation victim can seem fine, go into lung failure suddenly,” EMS Responder, October 2004, (Toronto, Canada), http://www.emsworld.com/news/10341024/doctors-smoke-inhalation-victim-can-seem-fine-go-into-lung-failure-suddenly (accessed April 20, 2017).12The USFA Structure Fire Cause Methodology was used to determine the cause of residential building fires resulting in injuries. The cause methodology and definitions can be found in the document “National Fire Incident Reporting System Version 5.0 Fire Data Analysis Guidelines and Issues,” July 2011, https://www.usfa.fema.gov/downloads/pdf/nfirs/nfirs_data_analysis_guidelines_issues.pdf.13Brown University, “Scents will not rouse us from slumber, says new Brown University study,” Science Daily, May 2004, (Providence, Rhode Island), http://www.sciencedaily.com/releases/2004/05/040518075747.htm (accessed April 20, 2017).14Total does not add up to 100 percent due to rounding.15“Update: Woman suffers burns, severe smoke inhalation in Salt Lake City house fire,” gephardtdaily.com, February 13, 2017, http://gephardtdaily.com/local/breaking-salt-lake-city-house-fire/ (accessed April 20, 2017). 16“LAFD firefighters dramatically rescue 4 children from South L.A. fire,” www.lafd.org, January 17, 2017, http://www.lafd.org/news/lafd-firefighters-dramatically-rescue-4-children-south-la-fire (accessed April 20, 2017).17Brito, Chris, “2 treated for smoke inhalation after fire ravages Bronx building,” pix11.com, January 6, 2017, http://pix11.com/2017/01/06/two-treated-for-smoke-inhalation-after-fire-ravages-bronx-building/ (accessed April 20, 2017).18“Two injured in South Wichita house fire,” ksn.com, January 3, 2017, http://ksn.com/2017/01/02/two-injured-in-south-wichita-house-fire/ (accessed April 20, 2017).19Greene, Michael and Craig Andres, “2004-2005 National Sample Survey of Unreported Residential Fires,” Division of Hazard Analysis, Directorate for Epidemiology, U.S. Consumer Product Safety Commission, July 2009.20U.S. Department of Housing and Urban Development and U.S. Census Bureau, American Housing Survey for the United States: 2011, September 2013, “Health and Safety Characteristics-All Occupied Units (National),” Table S-01-AO, https://www.census.gov/content/dam/Census/programs-surveys/ahs/data/2011/h150-11.pdf (accessed April 20, 2017).