Embed Size (px)
Citation preview

U.I.-Covered Employment & Wages by NAICS SectorThird Quarter 2005 - Summary by City & Town
Rhode Island Department of Labor Training
* Data not shown due to the possibility of identifying data with a single employer.** Statewide - employment in multiple towns, at unknown locations, or outside RI.
Data compiled March 2006, subject to revisions.
Sectors Rhode Island Total BarringtonNumber Average Total Number Average Total of Units Employment Wages of Units Employment Wages
Total Private & Government 35,825 479,634 $ 4,584,179,001 457 2,857 $ 22,828,944 Total Private Only 35,149 422,376 3,854,621,594 446 2,324 16,155,689
Agriculture, Forestry, Fishing & Hunting 169 1,067 7,077,665 * * *Mining 23 279 3,138,780 0 0 0Utilities 29 1,145 18,940,602 0 0 0Construction 4,268 23,485 259,982,997 60 227 2,264,777Manufacturing 2,212 54,256 571,090,220 14 81 649,743Wholesale Trade 2,898 16,761 219,628,092 50 77 1,346,444Retail Trade 4,104 52,225 337,570,326 42 371 1,815,549Transportation & Warehousing 754 9,272 75,929,891 3 5 18,414Information 625 10,744 149,245,774 10 22 197,630Finance & Insurance 1,722 26,102 346,412,148 15 82 973,818Real Estate & Rental & Leasing 1,206 6,912 60,703,116 12 31 259,503Professional & Technical Services 3,802 20,968 280,409,305 64 103 1,001,967Management of Companies & Enterprises
192 8,825 141,419,732* *
*Administrative & Waste Services 2,239 26,674 171,750,468 31 76 590,172Educational Services 459 16,784 172,955,529 10 110 858,858Health Care & Social Assistance 2,977 73,082 685,262,741 36 376 2,695,548Arts, Entertainment, & Recreation 549 8,938 47,667,528 9 190 1,222,658Accommodation & Food Services 2,846 45,667 180,462,897 23 261 896,563Other services, 3,350 18,643 115,444,655 63 295 1,248,188 (except Public Administration)Unclassified Establishments 725 549 9,529,128 0 0 0
Government 676 57,258 $ 729,557,407 11 533 $ 6,673,255

U.I.-Covered Employment & Wages by NAICS SectorThird Quarter 2005 - Summary by City & Town
Rhode Island Department of Labor Training
* Data not shown due to the possibility of identifying data with a single employer.** Statewide - employment in multiple towns, at unknown locations, or outside RI.
Data compiled March 2006, subject to revisions.
Sectors
Total Private & GovernmentTotal Private Only
Agriculture, Forestry, Fishing & HuntingMiningUtilitiesConstructionManufacturingWholesale TradeRetail TradeTransportation & WarehousingInformationFinance & InsuranceReal Estate & Rental & LeasingProfessional & Technical ServicesManagement of Companies & Enterprises
Administrative & Waste ServicesEducational ServicesHealth Care & Social AssistanceArts, Entertainment, & RecreationAccommodation & Food ServicesOther services, (except Public Administration)Unclassified Establishments
Government
Bristol BurrillvilleNumber Average Total Number Average Total of Units Employment Wages of Units Employment Wages
605 7,722 $ 64,786,501 313 2,841 $ 22,476,610 590 6,645 52,510,868 299 2,292 16,124,867
* * * * * *0 0 0 0 0 00 0 0 * * *
94 522 5,252,725 77 230 2,277,69371 1,300 12,528,866 15 415 3,935,98937 135 2,198,055 24 57 644,85273 806 5,116,978 17 162 759,657
7 47 432,289 5 14 137,4863 79 756,843 7 21 148,179
23 135 1,317,210 6 20 259,27118 67 490,130 8 20 123,49242 81 662,608 21 50 624,280
* * * * * *43 201 1,646,996 16 79 552,18910 1,296 12,235,042 4 19 109,02840 852 5,201,987 19 490 3,067,95710 88 299,867 7 90 289,17451 755 2,861,854 29 443 1,489,56764 266 1,350,185 39 123 718,051
1 1 1,930 0 0 0
15 1,077 $ 12,275,633 14 550 $ 6,351,743

U.I.-Covered Employment & Wages by NAICS SectorThird Quarter 2005 - Summary by City & Town
Rhode Island Department of Labor Training
* Data not shown due to the possibility of identifying data with a single employer.** Statewide - employment in multiple towns, at unknown locations, or outside RI.
Data compiled March 2006, subject to revisions.
Sectors
Total Private & GovernmentTotal Private Only
Agriculture, Forestry, Fishing & HuntingMiningUtilitiesConstructionManufacturingWholesale TradeRetail TradeTransportation & WarehousingInformationFinance & InsuranceReal Estate & Rental & LeasingProfessional & Technical ServicesManagement of Companies & Enterprises
Administrative & Waste ServicesEducational ServicesHealth Care & Social AssistanceArts, Entertainment, & RecreationAccommodation & Food ServicesOther services, (except Public Administration)Unclassified Establishments
Government
Central Falls CharlestownNumber Average Total Number Average Total of Units Employment Wages of Units Employment Wages
266 3,118 $ 24,860,659 244 1,611 $ 13,302,593 255 2,388 17,109,335 232 1,439 11,371,124
0 0 0 * * *0 0 0 * * *0 0 0 0 0 0
33 167 1,400,503 54 172 1,792,70237 728 6,218,927 6 264 2,687,92611 180 1,467,677 10 33 539,63033 209 1,293,530 25 196 1,234,142
6 82 273,002 7 82 385,2120 0 0 4 15 48,306
14 122 1,072,164 4 29 310,4508 51 287,558 14 26 323,0479 15 146,769 24 48 478,068
0 0 0 0 0 014 244 1,877,411 22 88 694,119
* * * 0 0 021 230 1,468,213 16 174 1,511,755
* * * 5 6 20,57036 221 713,611 22 271 1,148,58931 120 667,694 17 32 168,392
0 0 0 0 0 0
11 730 $ 7,751,324 12 174 $ 1,931,469

U.I.-Covered Employment & Wages by NAICS SectorThird Quarter 2005 - Summary by City & Town
Rhode Island Department of Labor Training
* Data not shown due to the possibility of identifying data with a single employer.** Statewide - employment in multiple towns, at unknown locations, or outside RI.
Data compiled March 2006, subject to revisions.
Sectors
Total Private & GovernmentTotal Private Only
Agriculture, Forestry, Fishing & HuntingMiningUtilitiesConstructionManufacturingWholesale TradeRetail TradeTransportation & WarehousingInformationFinance & InsuranceReal Estate & Rental & LeasingProfessional & Technical ServicesManagement of Companies & Enterprises
Administrative & Waste ServicesEducational ServicesHealth Care & Social AssistanceArts, Entertainment, & RecreationAccommodation & Food ServicesOther services, (except Public Administration)Unclassified Establishments
Government
Coventry CranstonNumber Average Total Number Average Total of Units Employment Wages of Units Employment Wages
753 7,911 $ 62,731,660 2,566 36,036 $ 339,844,484 733 6,451 48,459,319 2,546 29,847 259,403,470
* * * 7 25 180,7010 0 0 * * *0 0 0 0 0 0
176 775 7,434,012 305 1,766 19,261,30347 792 10,216,286 208 4,752 49,131,89749 242 2,384,497 196 1,737 20,005,29991 1,464 9,332,133 308 4,339 28,279,53820 167 1,513,881 60 690 6,794,303
4 18 145,344 28 1,550 22,254,17523 134 1,095,162 157 1,489 19,351,27922 77 505,214 95 575 5,374,78660 171 1,684,557 256 1,397 16,875,284
* * * 16 299 4,698,01750 221 1,541,560 175 2,632 15,737,471
7 86 499,250 35 413 2,470,96937 856 6,399,009 255 3,522 28,138,576
7 58 155,549 24 339 1,573,92565 1,022 3,066,222 173 2,792 9,610,02069 294 1,896,988 244 1,528 9,650,222
0 0 0 * * *
20 1,461 $ 14,272,341 20 6,186 $ 80,441,014

U.I.-Covered Employment & Wages by NAICS SectorThird Quarter 2005 - Summary by City & Town
Rhode Island Department of Labor Training
* Data not shown due to the possibility of identifying data with a single employer.** Statewide - employment in multiple towns, at unknown locations, or outside RI.
Data compiled March 2006, subject to revisions.
Sectors
Total Private & GovernmentTotal Private Only
Agriculture, Forestry, Fishing & HuntingMiningUtilitiesConstructionManufacturingWholesale TradeRetail TradeTransportation & WarehousingInformationFinance & InsuranceReal Estate & Rental & LeasingProfessional & Technical ServicesManagement of Companies & Enterprises
Administrative & Waste ServicesEducational ServicesHealth Care & Social AssistanceArts, Entertainment, & RecreationAccommodation & Food ServicesOther services, (except Public Administration)Unclassified Establishments
Government
Cumberland East GreenwichNumber Average Total Number Average Total of Units Employment Wages of Units Employment Wages
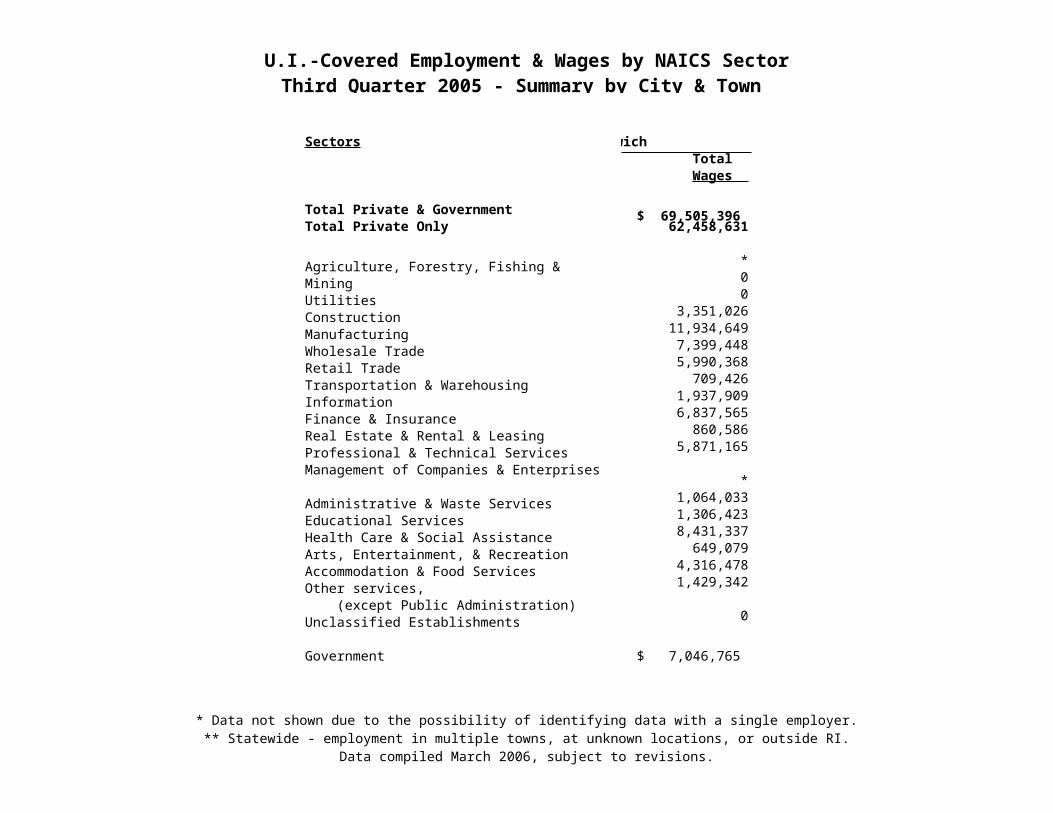
860 9,427 $ 80,450,298 737 7,507 $ 69,505,396 843 8,234 70,410,678 723 6,762 62,458,631
* * * * * ** * * 0 0 0* * * 0 0 0
140 1,183 14,892,032 52 289 3,351,02644 1,693 14,700,346 26 1,004 11,934,64984 439 5,910,164 88 424 7,399,44883 988 5,437,466 77 783 5,990,36823 449 4,230,840 10 85 709,42617 77 623,454 21 38 1,937,90938 247 2,739,866 52 529 6,837,56536 126 973,685 33 104 860,58678 255 2,591,808 97 415 5,871,165
* * * * * *50 204 1,568,837 33 115 1,064,033
8 97 442,960 17 185 1,306,42370 1,079 8,375,417 81 1,161 8,431,33713 76 329,451 15 129 649,07960 614 1,674,833 54 1,185 4,316,47893 505 3,401,061 62 274 1,429,342
* * * 0 0 0
17 1,194 $ 10,039,620 14 746 $ 7,046,765

U.I.-Covered Employment & Wages by NAICS SectorThird Quarter 2005 - Summary by City & Town
Rhode Island Department of Labor Training
* Data not shown due to the possibility of identifying data with a single employer.** Statewide - employment in multiple towns, at unknown locations, or outside RI.
Data compiled March 2006, subject to revisions.
Sectors
Total Private & GovernmentTotal Private Only
Agriculture, Forestry, Fishing & HuntingMiningUtilitiesConstructionManufacturingWholesale TradeRetail TradeTransportation & WarehousingInformationFinance & InsuranceReal Estate & Rental & LeasingProfessional & Technical ServicesManagement of Companies & Enterprises
Administrative & Waste ServicesEducational ServicesHealth Care & Social AssistanceArts, Entertainment, & RecreationAccommodation & Food ServicesOther services, (except Public Administration)Unclassified Establishments
Government
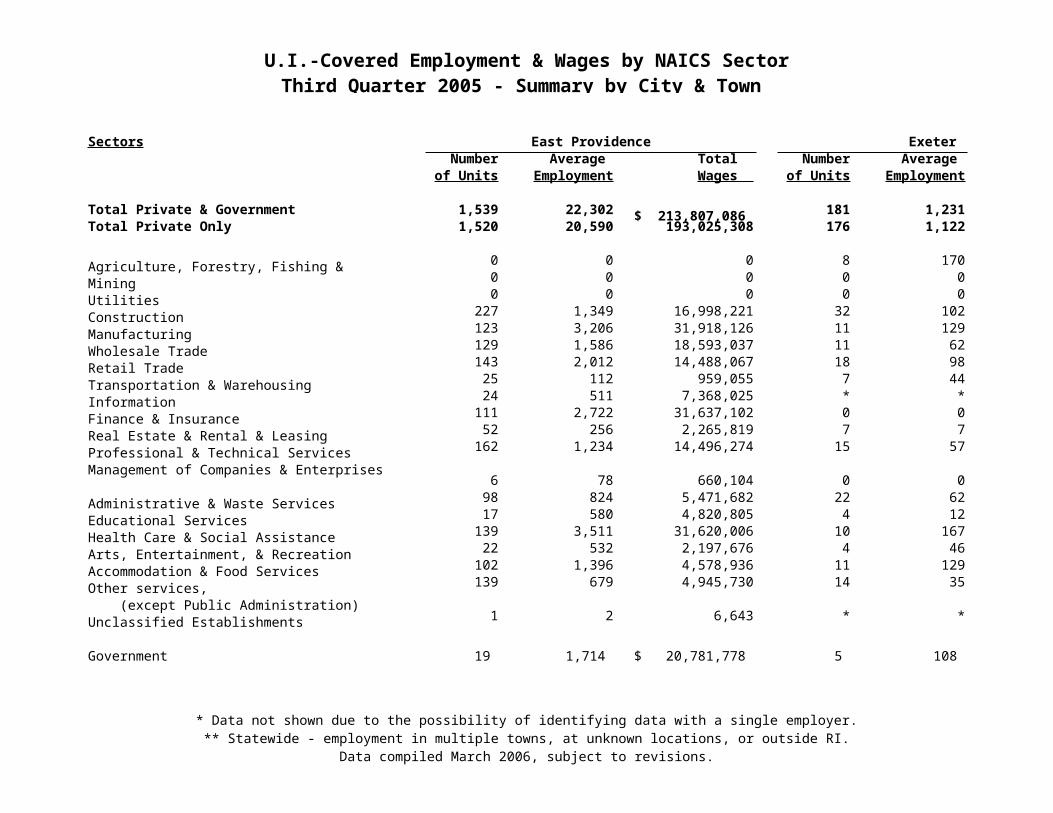
East Providence ExeterNumber Average Total Number Average Total of Units Employment Wages of Units Employment Wages
1,539 22,302 $ 213,807,086 181 1,231 $ 8,722,193 1,520 20,590 193,025,308 176 1,122 7,649,004
0 0 0 8 170 727,5350 0 0 0 0 00 0 0 0 0 0
227 1,349 16,998,221 32 102 970,016123 3,206 31,918,126 11 129 1,421,861129 1,586 18,593,037 11 62 565,646143 2,012 14,488,067 18 98 512,726
25 112 959,055 7 44 265,70924 511 7,368,025 * * *
111 2,722 31,637,102 0 0 052 256 2,265,819 7 7 68,833
162 1,234 14,496,274 15 57 583,335
6 78 660,104 0 0 098 824 5,471,682 22 62 479,43517 580 4,820,805 4 12 126,132
139 3,511 31,620,006 10 167 1,169,92722 532 2,197,676 4 46 262,053
102 1,396 4,578,936 11 129 350,095139 679 4,945,730 14 35 119,369
1 2 6,643 * * *
19 1,714 $ 20,781,778 5 108 $ 1,073,189

U.I.-Covered Employment & Wages by NAICS SectorThird Quarter 2005 - Summary by City & Town
Rhode Island Department of Labor Training
* Data not shown due to the possibility of identifying data with a single employer.** Statewide - employment in multiple towns, at unknown locations, or outside RI.
Data compiled March 2006, subject to revisions.
Sectors
Total Private & GovernmentTotal Private Only
Agriculture, Forestry, Fishing & HuntingMiningUtilitiesConstructionManufacturingWholesale TradeRetail TradeTransportation & WarehousingInformationFinance & InsuranceReal Estate & Rental & LeasingProfessional & Technical ServicesManagement of Companies & Enterprises
Administrative & Waste ServicesEducational ServicesHealth Care & Social AssistanceArts, Entertainment, & RecreationAccommodation & Food ServicesOther services, (except Public Administration)Unclassified Establishments
Government
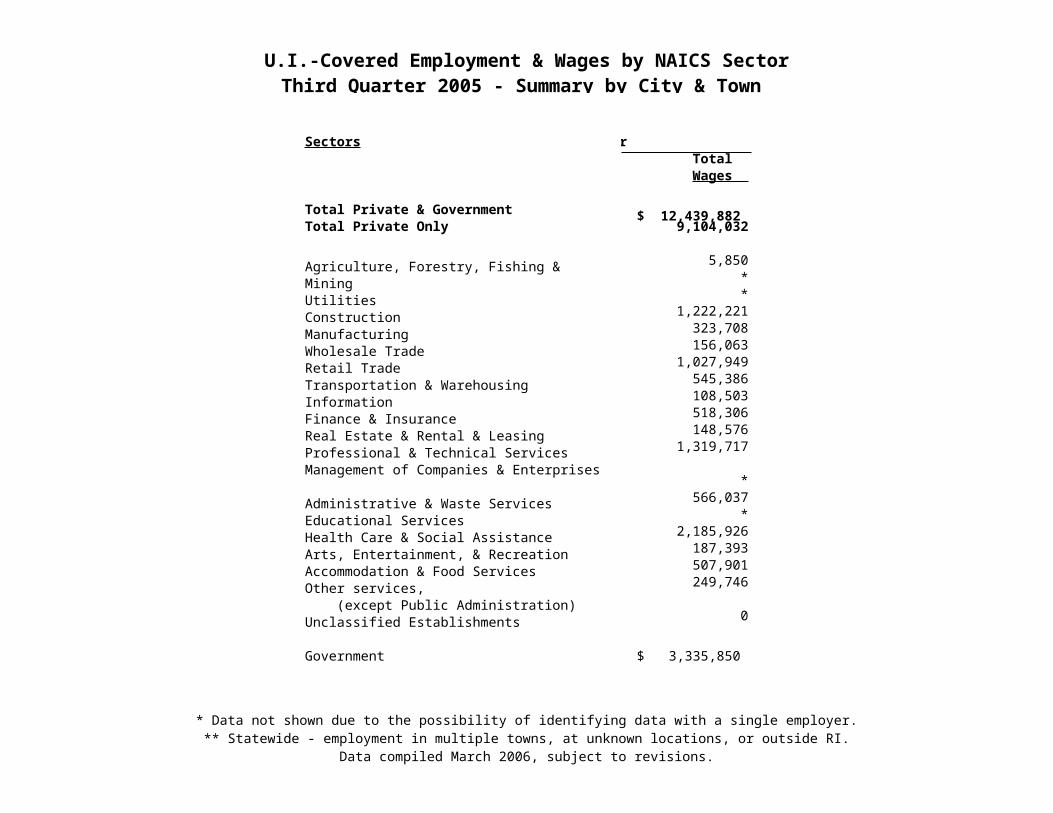
Foster GlocesterNumber Average Total Number Average Total of Units Employment Wages of Units Employment Wages
107 456 $ 2,872,520 216 1,535 $ 12,439,882 101 399 2,334,293 201 1,223 9,104,032
6 24 101,204 3 2 5,8500 0 0 * * *0 0 0 * * *
31 85 633,297 57 148 1,222,2215 14 73,343 6 38 323,7086 15 59,242 9 13 156,0634 5 26,507 20 215 1,027,9494 24 128,481 11 62 545,3863 14 24,612 5 22 108,503* * * 7 33 518,306* * * 3 2 148,576
12 17 227,458 10 104 1,319,717
0 0 0 * * *8 18 113,731 14 64 566,0370 0 0 * * *5 54 395,842 13 270 2,185,926* * * 3 29 187,3938 43 144,687 16 167 507,9014 5 77,490 20 49 249,746
0 0 0 0 0 0
6 58 $ 538,227 15 314 $ 3,335,850

U.I.-Covered Employment & Wages by NAICS SectorThird Quarter 2005 - Summary by City & Town
Rhode Island Department of Labor Training
* Data not shown due to the possibility of identifying data with a single employer.** Statewide - employment in multiple towns, at unknown locations, or outside RI.
Data compiled March 2006, subject to revisions.
Sectors
Total Private & GovernmentTotal Private Only
Agriculture, Forestry, Fishing & HuntingMiningUtilitiesConstructionManufacturingWholesale TradeRetail TradeTransportation & WarehousingInformationFinance & InsuranceReal Estate & Rental & LeasingProfessional & Technical ServicesManagement of Companies & Enterprises
Administrative & Waste ServicesEducational ServicesHealth Care & Social AssistanceArts, Entertainment, & RecreationAccommodation & Food ServicesOther services, (except Public Administration)Unclassified Establishments
Government
Hopkinton JamestownNumber Average Total Number Average Total of Units Employment Wages of Units Employment Wages
188 1,290 $10,043,942 209 1,365 $10,778,206 178 1,188 9,016,806 196 1,116 8,425,039
4 7 27,916 3 7 50,645* * * 0 0 00 0 0 0 0 0
56 173 1,654,220 40 123 1,249,26317 380 3,418,558 3 17 126,528
6 16 288,682 15 36 540,56518 115 502,618 13 96 448,701
4 22 215,323 5 10 173,173* * * * * *6 4 90,001 6 19 320,1915 9 44,351 12 60 334,0918 21 235,523 31 100 1,190,741
0 0 0 * * *8 21 131,997 13 54 375,1190 0 0 * * *
15 174 1,032,529 11 112 801,3026 75 262,522 10 154 836,0866 63 271,864 11 209 981,344
14 91 766,651 18 99 675,217
0 0 0 0 0 0
10 103 $ 1,027,136 13 250 $ 2,353,167

U.I.-Covered Employment & Wages by NAICS SectorThird Quarter 2005 - Summary by City & Town
Rhode Island Department of Labor Training
* Data not shown due to the possibility of identifying data with a single employer.** Statewide - employment in multiple towns, at unknown locations, or outside RI.
Data compiled March 2006, subject to revisions.
Sectors
Total Private & GovernmentTotal Private Only
Agriculture, Forestry, Fishing & HuntingMiningUtilitiesConstructionManufacturingWholesale TradeRetail TradeTransportation & WarehousingInformationFinance & InsuranceReal Estate & Rental & LeasingProfessional & Technical ServicesManagement of Companies & Enterprises
Administrative & Waste ServicesEducational ServicesHealth Care & Social AssistanceArts, Entertainment, & RecreationAccommodation & Food ServicesOther services, (except Public Administration)Unclassified Establishments
Government
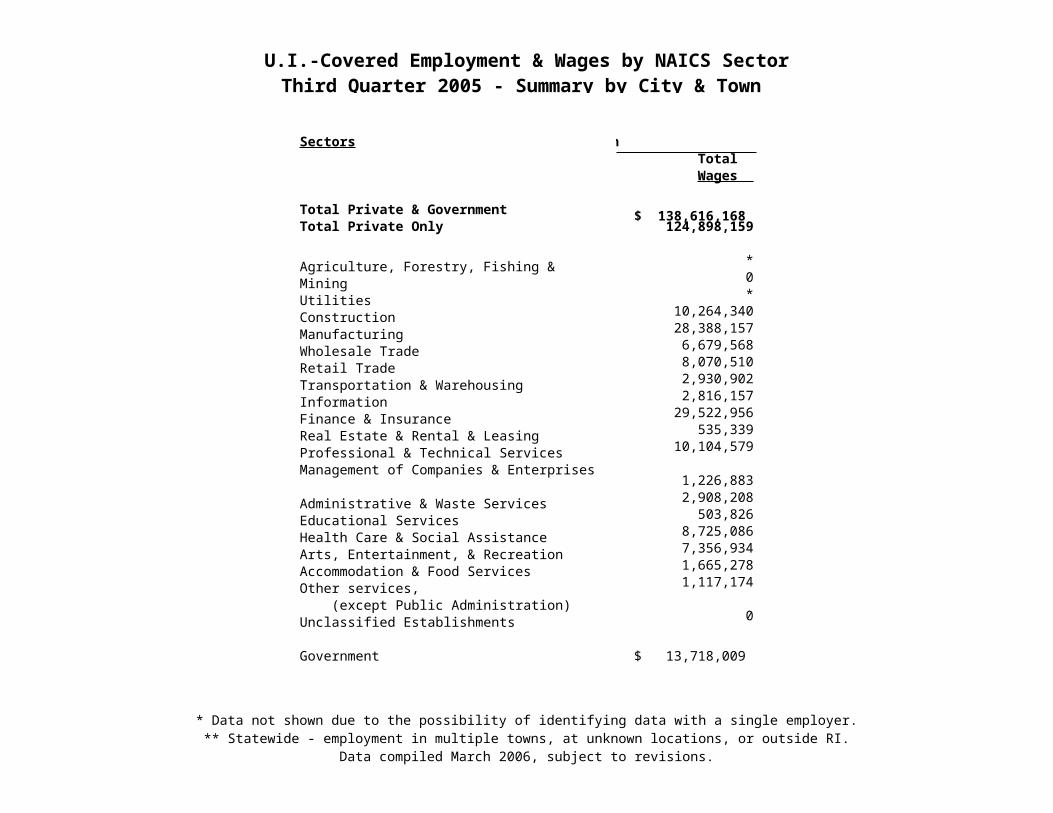
Johnston LincolnNumber Average Total Number Average Total of Units Employment Wages of Units Employment Wages
1,141 12,271 $ 105,980,242 779 13,893 $ 138,616,168 1,128 11,232 96,310,414 757 12,725 124,898,159
7 25 72,490 * * ** * * 0 0 0* * * * * *
196 944 10,055,453 102 853 10,264,340103 1,447 10,165,576 54 2,862 28,388,157
61 475 5,375,150 80 540 6,679,568143 1,572 11,257,266 60 792 8,070,510
38 261 2,009,594 18 292 2,930,90211 388 5,437,623 11 220 2,816,15744 1,202 16,903,608 58 2,656 29,522,95641 268 2,083,291 24 67 535,33967 254 2,238,147 102 717 10,104,579
* * * 9 97 1,226,883124 1,643 11,946,657 37 488 2,908,208
12 28 189,964 10 58 503,82694 1,275 11,870,591 69 1,092 8,725,086
4 34 150,894 23 1,120 7,356,93480 908 3,199,290 45 564 1,665,27894 472 2,810,477 52 185 1,117,174
4 2 8,100 0 0 0
13 1,037 $ 9,669,828 22 1,167 $ 13,718,009
U.I.-Covered Employment & Wages by NAICS SectorThird Quarter 2005 - Summary by City & Town
Rhode Island Department of Labor Training
* Data not shown due to the possibility of identifying data with a single employer.** Statewide - employment in multiple towns, at unknown locations, or outside RI.
Data compiled March 2006, subject to revisions.
Sectors
Total Private & GovernmentTotal Private Only
Agriculture, Forestry, Fishing & HuntingMiningUtilitiesConstructionManufacturingWholesale TradeRetail TradeTransportation & WarehousingInformationFinance & InsuranceReal Estate & Rental & LeasingProfessional & Technical ServicesManagement of Companies & Enterprises
Administrative & Waste ServicesEducational ServicesHealth Care & Social AssistanceArts, Entertainment, & RecreationAccommodation & Food ServicesOther services, (except Public Administration)Unclassified Establishments
Government
Little Compton MiddletownNumber Average Total Number Average Total of Units Employment Wages of Units Employment Wages
131 801.6 $ 4,976,607 784 11,310 $103,746,381 125 663 3,979,210 770 10,706 97,583,573
6 54 227,769 5 87 587,736* * * * * *0 0 0 * * *
36 153 1,226,709 95 489 5,185,729* * * 20 425 5,027,4103 3 32,987 41 180 2,053,5036 32 106,452 94 1,582 11,924,478* * * 7 59 360,5880 0 0 20 338 7,062,4902 32 318,392 27 453 6,894,5044 8 72,674 36 189 1,386,439
12 17 245,025 92 1,765 26,994,482
* * * 6 178 1,956,21812 28 180,138 44 372 3,136,587
* * * 10 398 3,477,1363 15 103,788 80 1,506 9,622,8678 111 644,229 16 210 1,058,9189 122 331,040 89 1,878 7,259,619
18 53 241,001 86 559 3,032,252
0 0 0 0 0 0
6 137 $ 997,397 14 604 $ 6,162,808
U.I.-Covered Employment & Wages by NAICS SectorThird Quarter 2005 - Summary by City & Town
Rhode Island Department of Labor Training
* Data not shown due to the possibility of identifying data with a single employer.** Statewide - employment in multiple towns, at unknown locations, or outside RI.
Data compiled March 2006, subject to revisions.
Sectors
Total Private & GovernmentTotal Private Only
Agriculture, Forestry, Fishing & HuntingMiningUtilitiesConstructionManufacturingWholesale TradeRetail TradeTransportation & WarehousingInformationFinance & InsuranceReal Estate & Rental & LeasingProfessional & Technical ServicesManagement of Companies & Enterprises
Administrative & Waste ServicesEducational ServicesHealth Care & Social AssistanceArts, Entertainment, & RecreationAccommodation & Food ServicesOther services, (except Public Administration)Unclassified Establishments
Government
Narragansett NewportNumber Average Total Number Average Total of Units Employment Wages of Units Employment Wages
494 4,958 $ 35,005,062 1,284 18,618 $ 200,519,581 475 3,833 23,302,927 1,259 14,026 107,128,851
6 29 281,564 6 57 492,8430 0 0 0 0 00 0 0 0 0 0
50 123 981,839 102 684 6,509,81621 130 1,661,738 34 281 2,719,31733 99 1,015,818 68 184 2,390,32149 678 3,877,003 229 1,660 9,457,21011 194 1,261,306 34 295 1,572,698
* * * 19 251 2,571,37718 54 741,206 36 162 1,860,22933 103 700,497 61 419 3,794,21748 135 1,579,553 169 854 12,404,043
* * * 5 37 496,20732 107 768,982 64 511 4,462,047
5 4 33,975 14 506 4,918,46937 346 2,631,268 86 1,995 17,943,64014 308 1,489,212 45 1,330 8,265,40465 1,244 4,680,816 175 4,096 22,740,40647 277 1,528,628 112 704 4,530,607
0 0 0 0 0 0
19 1,123 $ 11,702,135 25 4,590 $ 93,390,730

U.I.-Covered Employment & Wages by NAICS SectorThird Quarter 2005 - Summary by City & Town
Rhode Island Department of Labor Training
* Data not shown due to the possibility of identifying data with a single employer.** Statewide - employment in multiple towns, at unknown locations, or outside RI.
Data compiled March 2006, subject to revisions.
Sectors
Total Private & GovernmentTotal Private Only
Agriculture, Forestry, Fishing & HuntingMiningUtilitiesConstructionManufacturingWholesale TradeRetail TradeTransportation & WarehousingInformationFinance & InsuranceReal Estate & Rental & LeasingProfessional & Technical ServicesManagement of Companies & Enterprises
Administrative & Waste ServicesEducational ServicesHealth Care & Social AssistanceArts, Entertainment, & RecreationAccommodation & Food ServicesOther services, (except Public Administration)Unclassified Establishments
Government
New Shoreham North KingstownNumber Average Total Number Average Total of Units Employment Wages of Units Employment Wages
207 1489 $11,239,896 1,030 14,449 $ 140,882,839 191 1,343 10,078,326 1,012 12,913 123,489,118
* * * 9 68 842,8370 0 0 0 0 0* * * * * *
34 94 1,011,228 130 497 4,698,7605 21 168,099 67 4,592 56,830,2710 0 0 113 463 6,605,910
40 166 1,095,681 106 1,951 13,083,0684 10 33,385 37 384 2,993,7934 14 115,991 22 112 1,456,990* * * 53 381 4,951,110
13 51 403,289 32 107 714,6434 19 84,511 134 405 5,554,027
* * * * * *11 32 323,239 61 321 2,266,669
* * * 16 90 585,083* * * 64 1,112 8,023,9199 77 577,757 26 279 1,475,382
47 794 5,698,597 65 1,078 3,413,14512 30 152,618 68 380 2,101,582
0 0 0 0 0 0
16 146 $ 1,161,570 18 1,534 $ 17,393,721

U.I.-Covered Employment & Wages by NAICS SectorThird Quarter 2005 - Summary by City & Town
Rhode Island Department of Labor Training
* Data not shown due to the possibility of identifying data with a single employer.** Statewide - employment in multiple towns, at unknown locations, or outside RI.
Data compiled March 2006, subject to revisions.
Sectors
Total Private & GovernmentTotal Private Only
Agriculture, Forestry, Fishing & HuntingMiningUtilitiesConstructionManufacturingWholesale TradeRetail TradeTransportation & WarehousingInformationFinance & InsuranceReal Estate & Rental & LeasingProfessional & Technical ServicesManagement of Companies & Enterprises
Administrative & Waste ServicesEducational ServicesHealth Care & Social AssistanceArts, Entertainment, & RecreationAccommodation & Food ServicesOther services, (except Public Administration)Unclassified Establishments
Government
North Providence North SmithfieldNumber Average Total Number Average Total of Units Employment Wages of Units Employment Wages
761 8,555 $ 69,554,936 374 4,075 $ 33,383,572 750 7,738 58,700,725 363 3,813 30,552,613
0 0 0 3 12 37,8510 0 0 * * *0 0 0 0 0 0
85 297 2,785,021 62 353 3,941,08653 579 4,890,804 29 646 5,483,85537 147 1,766,990 30 206 2,577,267
108 1,265 7,705,057 40 587 4,334,69118 77 633,749 10 198 1,026,854
9 28 265,613 6 27 168,19141 400 4,435,958 14 70 991,37131 129 929,361 14 25 173,49361 243 2,731,074 37 232 2,900,055
* * * 0 0 059 477 2,472,024 15 46 335,202
8 12 43,467 * * *80 2,796 25,153,617 38 793 5,905,741
5 103 267,484 4 27 135,00476 837 2,752,101 21 414 1,234,74977 329 1,750,762 35 124 669,437
* * * 0 0 0
11 817 $ 10,854,211 11 263 $ 2,830,959
U.I.-Covered Employment & Wages by NAICS SectorThird Quarter 2005 - Summary by City & Town
Rhode Island Department of Labor Training
* Data not shown due to the possibility of identifying data with a single employer.** Statewide - employment in multiple towns, at unknown locations, or outside RI.
Data compiled March 2006, subject to revisions.
Sectors
Total Private & GovernmentTotal Private Only
Agriculture, Forestry, Fishing & HuntingMiningUtilitiesConstructionManufacturingWholesale TradeRetail TradeTransportation & WarehousingInformationFinance & InsuranceReal Estate & Rental & LeasingProfessional & Technical ServicesManagement of Companies & Enterprises
Administrative & Waste ServicesEducational ServicesHealth Care & Social AssistanceArts, Entertainment, & RecreationAccommodation & Food ServicesOther services, (except Public Administration)Unclassified Establishments
Government
Pawtucket PortsmouthNumber Average Total Number Average Total of Units Employment Wages of Units Employment Wages
1,607 27,075 $ 240,053,923 502 5,880 $ 67,481,260 1,582 24,998 213,952,266 488 5,459 61,646,940
0 0 0 16 60 318,7880 0 0 0 0 03 7 126,168 * * *
167 1,249 13,851,136 92 386 3,808,918189 5,690 51,658,886 32 2,336 38,819,700
89 585 6,383,563 31 117 1,361,765204 2,101 13,731,981 59 521 3,406,780
39 424 4,325,188 7 36 138,20827 745 8,086,182 11 75 917,07757 932 8,860,760 23 91 995,50251 263 2,330,888 12 119 725,162
118 542 5,271,314 50 126 1,359,535
11 1,211 22,415,139 * * *92 2,087 9,632,458 19 121 866,88121 372 3,024,321 9 185 1,566,774
180 5,181 47,266,835 29 395 2,474,76713 473 3,333,633 11 164 895,666
141 1,696 5,073,704 34 536 2,634,311179 1,440 8,570,110 48 187 1,328,790
1 0 10,000 0 0 0
25 2,078 $ 26,101,657 14 421 $ 5,834,320

U.I.-Covered Employment & Wages by NAICS SectorThird Quarter 2005 - Summary by City & Town
Rhode Island Department of Labor Training
* Data not shown due to the possibility of identifying data with a single employer.** Statewide - employment in multiple towns, at unknown locations, or outside RI.
Data compiled March 2006, subject to revisions.
Sectors
Total Private & GovernmentTotal Private Only
Agriculture, Forestry, Fishing & HuntingMiningUtilitiesConstructionManufacturingWholesale TradeRetail TradeTransportation & WarehousingInformationFinance & InsuranceReal Estate & Rental & LeasingProfessional & Technical ServicesManagement of Companies & Enterprises
Administrative & Waste ServicesEducational ServicesHealth Care & Social AssistanceArts, Entertainment, & RecreationAccommodation & Food ServicesOther services, (except Public Administration)Unclassified Establishments
Government
Providence RichmondNumber Average Total Number Average Total of Units Employment Wages of Units Employment Wages
5,759 112,337 $ 1,193,498,729 149 1,814 $ 13,666,328 5,655 97,400 995,970,791 141 1,356 9,041,866
0 0 0 5 48 374,944* * * * * *7 530 9,138,088 0 0 0
329 3,129 42,574,645 22 90 775,958376 7,003 56,628,164 6 102 973,345277 2,300 28,404,361 10 47 690,457669 7,157 42,231,759 25 345 1,933,88169 759 6,760,371 * * *
152 3,883 60,303,627 3 7 81,605355 5,739 94,720,569 5 50 440,550200 1,453 15,872,237 * * *897 6,265 85,432,410 6 31 246,204
45 1,962 36,145,826 0 0 0325 8,771 53,709,054 8 66 892,43495 10,028 115,175,567 * * *
595 24,126 273,359,210 9 78 561,83053 962 4,448,072 7 127 460,971
514 8,604 37,364,722 14 262 794,178692 4,726 33,684,906 15 47 265,224
* * * 0 0 0
104 14,935 $ 197,527,938 8 458 $ 4,624,462

U.I.-Covered Employment & Wages by NAICS SectorThird Quarter 2005 - Summary by City & Town
Rhode Island Department of Labor Training
* Data not shown due to the possibility of identifying data with a single employer.** Statewide - employment in multiple towns, at unknown locations, or outside RI.
Data compiled March 2006, subject to revisions.
Sectors
Total Private & GovernmentTotal Private Only
Agriculture, Forestry, Fishing & HuntingMiningUtilitiesConstructionManufacturingWholesale TradeRetail TradeTransportation & WarehousingInformationFinance & InsuranceReal Estate & Rental & LeasingProfessional & Technical ServicesManagement of Companies & Enterprises
Administrative & Waste ServicesEducational ServicesHealth Care & Social AssistanceArts, Entertainment, & RecreationAccommodation & Food ServicesOther services, (except Public Administration)Unclassified Establishments
Government
Scituate SmithfieldNumber Average Total Number Average Total of Units Employment Wages of Units Employment Wages
274 1,667 $ 13,780,197 804 12,429 $ 115,836,143 263 1,111 7,197,972 788 11,954 110,865,604
13 99 361,603 * * *0 0 0 * * *0 0 0 0 0 0
65 159 1,483,501 139 1,082 11,173,20413 54 309,002 83 1,208 12,010,02016 34 367,107 72 806 9,941,91221 221 1,282,638 107 2,325 13,113,52217 63 380,686 18 130 1,208,971
3 28 126,386 12 155 1,723,3507 21 215,917 37 2,048 31,549,3378 23 209,172 15 77 817,021
27 68 686,016 61 218 2,828,736
0 0 0 5 51 1,075,83821 50 293,249 47 345 2,926,950
3 15 61,405 9 686 7,786,52914 124 731,916 47 1,245 8,510,838
* * * 10 43 126,95011 88 302,951 59 1,199 4,272,75721 63 381,349 62 318 1,656,143
* * * 0 0 0
11 557 $ 6,582,225 16 474 $ 4,970,539

U.I.-Covered Employment & Wages by NAICS SectorThird Quarter 2005 - Summary by City & Town
Rhode Island Department of Labor Training
* Data not shown due to the possibility of identifying data with a single employer.** Statewide - employment in multiple towns, at unknown locations, or outside RI.
Data compiled March 2006, subject to revisions.
Sectors
Total Private & GovernmentTotal Private Only
Agriculture, Forestry, Fishing & HuntingMiningUtilitiesConstructionManufacturingWholesale TradeRetail TradeTransportation & WarehousingInformationFinance & InsuranceReal Estate & Rental & LeasingProfessional & Technical ServicesManagement of Companies & Enterprises
Administrative & Waste ServicesEducational ServicesHealth Care & Social AssistanceArts, Entertainment, & RecreationAccommodation & Food ServicesOther services, (except Public Administration)Unclassified Establishments
Government
South Kingstown TivertonNumber Average Total Number Average Total of Units Employment Wages of Units Employment Wages
1,017 13,678 $ 131,243,884 415 2,782 $ 21,258,689 996 10,036 88,671,783 400 2,306 17,046,783
19 141 1,654,759 11 40 160,165* * * 3 33 437,751* * * * * *
131 453 4,322,377 65 297 2,539,92931 942 13,239,070 13 74 563,99571 755 13,205,805 31 116 1,038,463
115 1,544 10,392,347 56 565 4,762,43612 110 493,425 12 46 345,90015 151 1,627,279 4 3 46,77241 278 3,518,555 13 55 585,54732 135 1,148,745 11 26 212,954
100 359 4,428,156 42 154 1,927,604
6 15 245,916 * * *67 301 2,743,122 28 73 523,44121 231 1,567,551 * * *97 2,279 19,828,781 26 293 2,031,50338 242 1,143,416 6 40 113,97597 1,340 4,637,552 29 353 1,151,701
100 731 4,126,595 46 134 592,112
0 0 0 0 0 0
21 3,642 $ 42,572,101 15 477 $ 4,211,906
U.I.-Covered Employment & Wages by NAICS SectorThird Quarter 2005 - Summary by City & Town
Rhode Island Department of Labor Training
* Data not shown due to the possibility of identifying data with a single employer.** Statewide - employment in multiple towns, at unknown locations, or outside RI.
Data compiled March 2006, subject to revisions.
Sectors
Total Private & GovernmentTotal Private Only
Agriculture, Forestry, Fishing & HuntingMiningUtilitiesConstructionManufacturingWholesale TradeRetail TradeTransportation & WarehousingInformationFinance & InsuranceReal Estate & Rental & LeasingProfessional & Technical ServicesManagement of Companies & Enterprises
Administrative & Waste ServicesEducational ServicesHealth Care & Social AssistanceArts, Entertainment, & RecreationAccommodation & Food ServicesOther services, (except Public Administration)Unclassified Establishments
Government
Warren WarwickNumber Average Total Number Average Total of Units Employment Wages of Units Employment Wages
393 4,442 $ 34,557,482 3,348 52,741 $ 469,773,429 384 4,272 32,288,922 3,317 48,931 417,739,837
* * * * * *0 0 0 * * *0 0 0 * * *
51 235 2,036,690 341 2,514 29,509,01051 1,143 10,645,565 201 4,201 43,965,20723 215 3,075,421 275 1,968 24,627,90646 275 1,515,371 477 8,848 54,048,01010 387 2,176,427 106 2,274 18,917,451
4 41 363,969 43 528 5,527,80718 179 1,725,224 220 3,792 47,756,880
8 20 129,805 131 1,613 13,175,80921 75 705,478 380 1,650 20,075,676
* * * 17 2,073 25,775,21021 153 990,120 195 2,901 18,956,536
5 63 563,942 36 773 6,449,36734 633 5,367,142 323 8,231 75,328,440
5 36 118,300 37 631 2,978,40844 672 1,983,032 240 5,151 20,190,21937 134 715,143 290 1,764 10,305,948
0 0 0 0 0 0
9 168 $ 2,268,560 31 3,810 $ 52,033,592

U.I.-Covered Employment & Wages by NAICS SectorThird Quarter 2005 - Summary by City & Town
Rhode Island Department of Labor Training
* Data not shown due to the possibility of identifying data with a single employer.** Statewide - employment in multiple towns, at unknown locations, or outside RI.
Data compiled March 2006, subject to revisions.
Sectors
Total Private & GovernmentTotal Private Only
Agriculture, Forestry, Fishing & HuntingMiningUtilitiesConstructionManufacturingWholesale TradeRetail TradeTransportation & WarehousingInformationFinance & InsuranceReal Estate & Rental & LeasingProfessional & Technical ServicesManagement of Companies & Enterprises
Administrative & Waste ServicesEducational ServicesHealth Care & Social AssistanceArts, Entertainment, & RecreationAccommodation & Food ServicesOther services, (except Public Administration)Unclassified Establishments
Government
Westerly West GreenwichNumber Average Total Number Average Total of Units Employment Wages of Units Employment Wages
869 10,819 $ 81,014,869 219 4,341 $ 73,851,003 850 10,064 73,650,455 211 3,990 70,296,171
5 12 55,969 * * ** * * 0 0 0* * * 0 0 0
108 359 3,232,360 55 220 2,025,94932 944 8,761,336 12 1,506 34,052,48528 56 738,741 17 220 3,523,736
139 2,306 13,887,708 10 67 340,19213 54 347,829 9 191 1,750,10114 316 3,412,096 4 9 109,91029 319 3,219,058 5 28 373,25528 110 674,664 5 2 18,28869 210 1,910,783 27 1,115 24,152,501
4 248 2,991,787 * * *45 228 1,871,198 25 290 2,227,701
7 44 197,370 * * *104 1,970 17,469,439 8 64 446,48834 575 3,163,327 * * *
100 1,753 8,466,977 14 197 744,97988 466 2,185,493 12 29 146,000
0 0 0 0 0 0
19 757 $ 7,364,414 8 352 $ 3,554,832

U.I.-Covered Employment & Wages by NAICS SectorThird Quarter 2005 - Summary by City & Town
Rhode Island Department of Labor Training
* Data not shown due to the possibility of identifying data with a single employer.** Statewide - employment in multiple towns, at unknown locations, or outside RI.
Data compiled March 2006, subject to revisions.
Sectors
Total Private & GovernmentTotal Private Only
Agriculture, Forestry, Fishing & HuntingMiningUtilitiesConstructionManufacturingWholesale TradeRetail TradeTransportation & WarehousingInformationFinance & InsuranceReal Estate & Rental & LeasingProfessional & Technical ServicesManagement of Companies & Enterprises
Administrative & Waste ServicesEducational ServicesHealth Care & Social AssistanceArts, Entertainment, & RecreationAccommodation & Food ServicesOther services, (except Public Administration)Unclassified Establishments
Government
West Warwick WoonsocketNumber Average Total Number Average Total of Units Employment Wages of Units Employment Wages
625 9,443 $ 85,183,370 881 14,853 $ 142,424,922 610 8,511 75,338,337 862 13,567 126,678,343
0 0 0 0 0 0* * * 0 0 00 0 0 0 0 0
96 427 4,338,175 84 391 3,544,00139 1,822 20,815,969 76 1,300 12,820,26336 362 4,308,725 55 366 4,282,77797 1,212 8,596,747 131 1,990 12,908,87713 280 2,637,839 18 801 6,213,814
* * * 9 59 670,50134 1,051 10,413,602 30 273 2,639,29622 78 518,299 33 108 771,12438 73 731,633 59 402 6,009,622
0 0 0 6 1,671 34,212,53824 187 968,020 32 635 4,766,952
7 34 137,692 18 354 2,876,53645 806 6,435,151 102 3,428 28,675,455
8 60 291,048 9 72 498,77564 915 2,867,309 98 1,155 3,400,79582 345 1,817,174 100 554 2,314,549
0 0 0 2 8 72,468
15 932 $ 9,845,033 19 1,283 $ 15,746,579

U.I.-Covered Employment & Wages by NAICS SectorThird Quarter 2005 - Summary by City & Town
Rhode Island Department of Labor Training
* Data not shown due to the possibility of identifying data with a single employer.** Statewide - employment in multiple towns, at unknown locations, or outside RI.
Data compiled March 2006, subject to revisions.
Sectors
Total Private & GovernmentTotal Private Only
Agriculture, Forestry, Fishing & HuntingMiningUtilitiesConstructionManufacturingWholesale TradeRetail TradeTransportation & WarehousingInformationFinance & InsuranceReal Estate & Rental & LeasingProfessional & Technical ServicesManagement of Companies & Enterprises
Administrative & Waste ServicesEducational ServicesHealth Care & Social AssistanceArts, Entertainment, & RecreationAccommodation & Food ServicesOther services, (except Public Administration)Unclassified Establishments
Government
Statewide **Number Average Total of Units Employment Wages
2,737 7,704 $ 97,198,515 2,733 7,408 94,653,145
* * *0 0 0* * *
197 697 7,453,152* * *
676 1,466 27,080,538108 602 8,240,732
35 48 606,01379 118 2,125,09691 264 6,152,28832 83 1,080,412
292 971 11,818,587
16 149 1,902,519234 1,540 9,171,810
25 45 275,233* * *
22 31 206,55548 242 990,10586 195 2,056,255
707 531 9,419,214
4 296 $ 2,545,370