Embed Size (px)
Citation preview

City, University of London Institutional Repository
Citation: Javdani, S., Fabian, M., Carlton, J., Sun, T. & Grattan, K. T. V. (2016). Underwater free-vibration analysis of full-scale marine propeller using a Fibre Bragg Grating-based sensor system. IEEE Sensors Journal, 16(4), pp. 946-953. doi: 10.1109/JSEN.2015.2490478
This is the accepted version of the paper.
This version of the publication may differ from the final published version.
Permanent repository link: http://openaccess.city.ac.uk/12797/
Link to published version: http://dx.doi.org/10.1109/JSEN.2015.2490478
Copyright and reuse: City Research Online aims to make research outputs of City, University of London available to a wider audience. Copyright and Moral Rights remain with the author(s) and/or copyright holders. URLs from City Research Online may be freely distributed and linked to.
City Research Online: http://openaccess.city.ac.uk/ [email protected]
City Research Online

1
Underwater free-vibration analysis of full-scale marine propeller
using a Fibre Bragg Grating-based sensor system Saeed Javdani, Matthias Fabian, John S. Carlton, Tong Sun, and Kenneth T. V. Grattan
Abstract—A detailed study has been carried out on
instrumented, full-scale marine propeller blades in order to
investigate their vibration behaviour, both in air and underwater.
In order to do so and to obtain data with minimum perturbation
to the characteristics of the blades, a Fibre Bragg Grating-based
sensor network system was designed and implemented, for the
first time. The individual vibration frequencies at each
measurement point and thus the broader vibration patterns seen
for each of the blades were obtained, with excitation both in air
and in water and the results are compared to those obtained from
Finite Element (FE) analysis. The vibration patterns obtained
show that the same modes of vibration occur in air and in water,
although in some natural frequencies the mode order is seen to
change from one blade to another on the same propeller.
The extensive performance survey carried out has also shown
that while the effect of the added mass of water on the natural
frequencies of the blades in the fundamental modes is
considerable, this effect diminishes as the natural frequencies of
the blades increase. The results obtained from the optical fibre
sensor network were compared to those from previous work in
this area using different and less satisfactory techniques and it
was confirmed that the ratio of the natural frequencies in water to
those in air increases in a linear manner as the frequencies were
increasing. Additionally, the natural frequencies of a blade were
measured under different depths of propeller immersion.
Index Terms—Fibre Bragg Grating (FBG)-based sensor
network, full-scale propeller, vibration sensor, mode shape,
natural frequency
I. INTRODUCTION
The research described in this paper forms part of an on-
going investigation into achieving better means of
measurement of the vibrational characteristics of full-scale
marine propellers, both in air and under water, and thus to
achieve a better understanding of their performance by
comparing the results obtained from experimental
measurements with the outputs of advanced numerical
analysis. To do so, the effectiveness and accuracy of a FBG-
based multi-sensor system which had been designed
specifically for the purpose and implemented was investigated
and examined. The aim has been to achieve a more accurate
measurement of the frequencies and modes of vibration of the
complex geometries that particularly characterize large marine
propeller blades. The key purpose underpinning the tests
carried out was to provide better answers to the key questions
posed by the marine industry in the characterization of such
propeller blades – to understand, for example, the effect of
added mass of water on the frequencies and modes of vibration
of these propeller blades, of modern design and manufacture
and considerable unit cost.
In the case of marine propellers, blades rotate slowly
compared for example to blades in fans, jets and in turbines
and hence, the centrifugal forces on the blades and therefore
the stiffness increase that would result can be ignored, as it is
minimal. In a series of experiments and subsequent
calculations carried out by Conn [1], it was concluded that it is
mainly the flexural frequencies that are affected by the
centrifugal forces. The flexural frequencies of a rotating blade
can be calculated from the following relationship:
(1)
where is natural frequency of the rotating blade (Hz), is
the natural frequency of a non-rotating blade, is the angular
velocity (in revolutions per second (rps), this normally having
a value of around 5 to 10 in the case of marine propellers) and
is a constant which has the values 0.35 and 1.35 for vibration
parallel and perpendicular to the blade breadths. It can be seen
from the relationship that the effect of rotation on the
frequencies of the blades is negligible. This was confirmed in
work carried out by Castellini and Santolini [2], where they
measured the natural frequencies of a small-scale, model
propeller underwater using a non-contact tracking laser
vibrometer. They concluded that under rotating conditions, the
bending modes were observed to be the most important
vibration modes, since excitation due to hydrodynamic effects,
gas bubbles or cavitation induces hardly any torsion effects on
the blade structure.
The principal effect of immersing a propeller in water is to
cause a reduction in the frequencies at the particular mode at
which the vibration occurs. However, this reduction is not
constant and appears to be greater for lower modes of
vibration, when compared to higher modes. In order to
investigate this effect, Carlton [3] has defined the frequency
reduction ratio as
Ʌ =
(2)
Considering a blade as a system with a single degree of
freedom, the relationship between the motion of such a system
under an undamped situation (while the stiffness remains
unchanged) can be presented as a simple mass ratio equation,
as shown in equation 3:
Ʌ = (
)
(3)
where is the equivalent mass of the blade and is the
added mass of water.
A previous investigation by Burrill into this relationship on
model and full scale propellers, references [4 and 5], showed
that the value of Ʌ increases with the modal number, as
illustrated in Table 1.
Looking at a propeller with a higher blade area ratio (BAR
= 0.85), the work of Hughes [6] has confirmed the results
obtained by Burrill which show an increase in the values of Ʌ
with increasing the mode number. It has also been shown by
Burrill and Hughes and others [7 and 8] that changes in mode

2
shapes of vibration due to immersion in water are generally
small, although a shift in position of the modal lines on the
blade can be seen in some modes, as illustrated in Figure 1.
Table 1. The effect on modal frequency of immersion in
water for a four-bladed propeller with a Blade Area Ratio
(BAR) of 0.526 and Mean Pitch (P/D) of 0.65
Flexural vibration modes
Frequency (Hz)
Ʌ
In air In Water
Fundamental 160 100 0.625
One-node mode 230 161 0.700
Two-node mode 460 375 0.815
Three-node mode 710 625 0.880
Four-node Mode 1020 1000 0.980
Torsional vibration modes
One-node mode 400 265 0.662
Two-node mode 670 490 0.731
Three-node mode 840 - -
Fig. 1. Mode shapes in air and water for the two different propeller
forms and Blade Area Ratio (BAR). Source: Carlton 2012 [3]
The present work seeks to make a significant advance on
work previously reported and thus is a study of the application
of a FBG-based sensor network system for the direct
acquisition of natural frequencies and mode shapes of
vibrations of a full-scale marine propeller of modern design in
water and in air. The FBG-based sensors show the major
advantages of being minimally invasive on the blade itself and
its performance, whist allowing a very large number of sensing
points to be investigated, unlike the use of for example
electronic strain gauges. Further, these FBG-based sensors can
be applied with a high degree of dimensional precision (±
1mm) to those points on the blades where measurements are
desired and measurements from all the sensing points could, in
principle, be obtained simultaneously. There is no electrical
hazard with the use of these sensors in air, or more particularly
in highly conductive sea water, unlike the case with electronic
strain gauges and when comparing to the use of non-contact
laser-based methods to target specific points (usually one-by-
one) in water, there is no need to consider refractive effects on
the probe light when attempting to direct a laser beam with
high precision to a specific part of the surface of blade – indeed
there is no need for the blade to be visible to the operator.
II. EXPERIMENTAL ASPECTS
The propeller selected for investigation in this experiment
is a left-handed propeller designed for a twin-screw ship. The
fixed pitch propeller blades had a diameter of 1900 mm with a
variable pitch distribution of the blade. Table 2 presents the
principal characteristics of propeller blade geometry and the
material properties of the propeller. Figure 2 shows a
photograph of the propeller immersed in a water tank of base
size 4 4 meters (and wall height of 2 meters), as used in this
experiment with the blades instrumented with the optical FBG-
based sensor network designed for this work, showing the
minimally-invasive nature of the >300 sensors attached to the
propeller used for this test.
The FBG-based sensors used as the basis of each sensor
element were as follows. Each individual sensor was created
using a Type I FBG (of 6 mm length), fabricated using the
conventional zero-order nulled diffraction phase mask
technique [9]. To do so, 248 nm laser pulses (12 mJ at 300 Hz)
from an ATLEX-300-SI Excimer laser were focussed via a 20
mm focal length plano-cylindrical lens through a series of
commercially available phase masks (Oe-land, QPS) into the
core of a photosensitive fibre (Fibercore PS1250). The sensors
were configured into a number of individual channels for
convenience and to minimize the number of external optical
fibre leads coming from the blade (as can be seen from Figure
2). Thus in each channel seven different FBG wavelengths, set
to be between 1525 nm and 1565 nm were chosen, to ensure
that there was no spectral overlap from one sensor to the next,
even when each sensor responds over its maximum range of
vibration-induced strain to avoid any ambiguity in the
measurement. These FBG-based channels then formed the
Table 2. Characteristics of propeller in this experiment
Diameter,
Mean Pitch
Expanded Area Ratio
Modulus of Elasticity, E
Poisson Ratio, ν
Density, ρ
1900 mm
1631 mm
0.765
121 GPa
0.33
7650 kg.m3

3
network of sensors on each blade – a pattern that was repeated
for each of the five blades of the propeller.
Fig. 2. Left-handed propeller in water tank; 5 blades instrumented
with a network of 67 sensors attached onto each blade. The total
number of FBG-based sensors used on the propeller was 335.
The dynamic Bragg wavelength shifts, monitored from
each FBG from all the channels comprising the entire sensor
network and caused by the vibrations detected when the
propeller blades were excited were captured simultaneously
using a Micron Optics SM130-700 sensing interrogator unit,
operating at a sampling rate of 2000 Hz. In processing these
signals, all the DC components were then removed from the
transient signals before a Fast Fourier Transform (FFT)
algorithm was applied to extract the frequency components
from each of the sensor data sets, with the maximum detectable
vibration frequency being 1000 Hz (half the sampling rate). In
order to determine the most significant spectral features for all
frequencies in the FFT spectra detected, the sampling interval
was chosen to be 2 s. In tests carried out, longer sampling
intervals were found not to be beneficial as they resulted in
lower amplitudes for the higher frequencies detected, as they
typically dampen faster than low frequency vibrations. This
sampling interval (2 seconds) resulted in maximum detectable
vibration frequency being 900Hz. The frequency resolution,
Δf, of the FFT spectra depends on the sampling frequency, fs,
and the number of sample values, N, taken (where Δf = fs/N),
where N is a product of the sampling frequency and the
sampling interval ts. Thus, Δf = 1/ts = 0.5 Hz for the chosen
sampling interval of 2 s. A band-pass filtering approach was
also applied to tenable the relative wavelength shifts measured
at each point where a FBG-based sensor was mounted to be
tracked, showing the natural frequencies of there and thus to
obtain the strain mode profile of the blade at that specific
frequency. For each of the detected frequency components, the
amplitudes and relative wavelength shifts at the different
sensor locations were then used to plot the deflection charts
(the mode maps) for each blade.
To create a sufficient pattern of frequency information in
the experiment carried out, each blade was instrumented with a
10 channel network of sensors on the fibre, with each
containing between 5-7 FBG-based sensors (depending on the
shape of the blade at that position), each using different
wavelengths to allow individual sensor identification. The
FBG spectral characteristics were each centred at a specific,
known wavelength in the spectral region between 1525 nm and
1565 nm and they were written into optical fibres channels,
each of lengths between 450 mm to 900 mm to suit the position
on which they were mounted on the blade, in the manner as
was discussed earlier. The sensor locations on the expanded
outline of the one of the blade surfaces is shown in Figure 3 –
this pattern was repeated for all five blades as they were
similar in shape and size.
Each of the sensors in the optical fiber channels used was
attached to the blade surface, in a way designed to be as far as
possible normal to the chordal lines, to enable the results
obtained from any individual sensor to be as closely
comparable to those obtained from the other sensors. The
modes of vibration of the blades, in air, were excited by
striking the blades at various known locations on the propeller
with a hammer with a relatively hard rubber tip, in order to
excite the vibration of the blade across the full vibrational
frequency range. Since the sensing interrogator unit was able
to read data from 4 fibres simultaneously, first the optical fibre
array next to the trailing edge of the blades was used as a
reference for normalizing the captured amplitudes of the strain
data. Therefore, when capturing data in this way, a series of
three tests was necessary to obtain all the data for all the
sensing locations for the blade shown in Figure 3. This was
not difficult to do quickly and reproducibly. Then the
amplitudes determined from the data from each set of tests
were normalized to those obtained from the 1st sensor of the
first fibre array, to allow the amplitude then to be comparable.
Fig. 3. Schematic of the instrumented propeller blade showing the
sensor location points (numbered) as used for the optical sensor
vibrational analysis, using the Fibre Bragg Grating-based sensor
network. The sensor locations are shown in an expanded view of one
of the blades.
Mode orders were tracked using a strain mode shape-based
(SMSB) method. Hence the strain mode shapes were
generated using the normalized data obtained from each sensor
location and the results were mapped onto an expanded surface
of the blade and cross-compared with data obtained from
across the different blades. In order to compare the
experimental results with those from a simulation carried out,
these results were then compared to those obtained from an
extensive Finite Element (FE) analysis, carried out using
Abaqus software. This is discussed below.
III. SIMULATION SETUP AND RESULTS
4
In the simulation carried out, in order to obtain the
eigenfrequencies and the mode shapes in water, an Acoustic
Fluid-Structure Coupling (AFSC) approach was used. Since
the vibration amplitudes are small, a linear theory can be
applied, and as the water is quiescent, the influence of fluid
viscosity and the shear layers are negligible. Thus the Fluid-
Structure Interaction (FSI) technique, using acoustic elements,
can be applied efficiently to compute the natural frequencies of
the blades. For a coupled fluid-structure interaction problem,
the fluid pressure load acting at the interface can be added to
the structure equation of motion as follows:
[ ]{ ̈ } + [ ]{ ̇ } + [ ]{ } = { } + { } (4)
where Me is the structural mass matrix, Ce is the structural
damping matrix, is the structural stiffness matrix, is the
nodal displacement vector, is the structural load vector and
is the fluid pressure load vector at the interface. In the
case of coupled modal analysis, the water pressure could be
described by use of the Helmohltz acoustic wave equation:
(5)
where c is the acoustic wave speed (c2 = k/ρ, in which k is the
fluid bulk modulus and ρ is the fluid density); p is acoustic
pressure, t is time and the Laplace operator. At the interface
between the blade surface and the water, the relationship
between the normal pressure gradient of the fluid and the
normal acceleration of the structure is governed by the
following equation [10]:
{ } { } { }
(6)
where U is the displacement vector of the interface of the
structure and is the density of the fluid. From the above
equations, a complete set of finite element discretized
equations for the fluid-structure interaction problem can be
derived; it is, however, not the purpose of this paper to discuss
the details of the finite element formulation of FSI modeming
(further information can be found in theory manual of Abaqus
package).
In order to ensure accuracy of the profile of each blade used
in the simulation, for the FE modelling purposes for the full-
scale propeller in the simulation package, the actual propeller
was scanned using an industrial 3D scanning device and the
point cloud data generated were transformed into surface
bodies to provide the CAD model which could then be
imported in Abaqus software for modal analysis. It was not
possible to take advantage of the cyclic symmetry condition in
this simulation since the manufactured blades have small
discrepancies in their geometry which must be reflected in the
model as they affect their natural frequencies in an important
way- measuring these differences is an important feature of the
approach taken in this work. Therefore, the full propeller had
to be simulated to provide the data needed on its properties.
For the modal analysis in air, the structure of the propeller was
‘meshed’ (that is a mesh grid was established covering the
structure) with 3D tetrahedral elements of type C3D10. The
full discretized model contained 90154 nodes and 51739
elements and the modal characteristics of the blades were
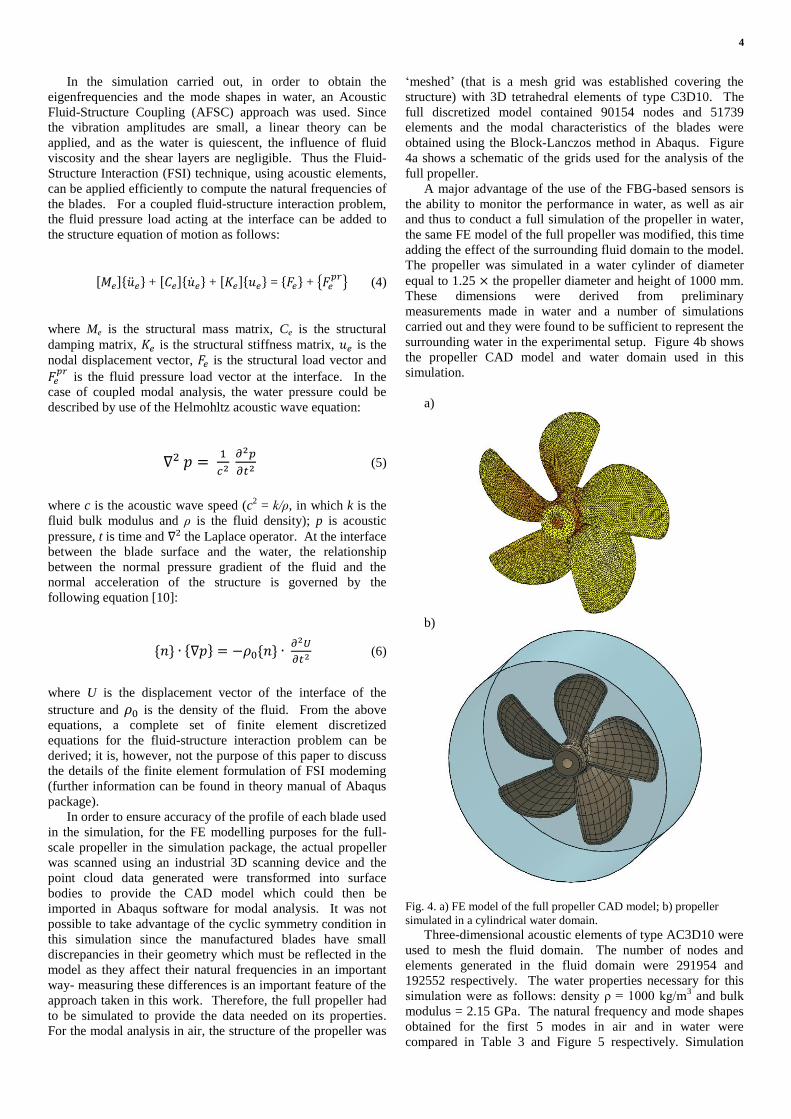
obtained using the Block-Lanczos method in Abaqus. Figure
4a shows a schematic of the grids used for the analysis of the
full propeller.
A major advantage of the use of the FBG-based sensors is
the ability to monitor the performance in water, as well as air
and thus to conduct a full simulation of the propeller in water,
the same FE model of the full propeller was modified, this time
adding the effect of the surrounding fluid domain to the model.
The propeller was simulated in a water cylinder of diameter
equal to 1.25 the propeller diameter and height of 1000 mm.
These dimensions were derived from preliminary
measurements made in water and a number of simulations
carried out and they were found to be sufficient to represent the
surrounding water in the experimental setup. Figure 4b shows
the propeller CAD model and water domain used in this
simulation.
a)
b)
Fig. 4. a) FE model of the full propeller CAD model; b) propeller
simulated in a cylindrical water domain.
Three-dimensional acoustic elements of type AC3D10 were
used to mesh the fluid domain. The number of nodes and
elements generated in the fluid domain were 291954 and
192552 respectively. The water properties necessary for this
simulation were as follows: density ρ = 1000 kg/m3 and bulk
modulus = 2.15 GPa. The natural frequency and mode shapes
obtained for the first 5 modes in air and in water were
compared in Table 3 and Figure 5 respectively. Simulation
5
could be repeated for sea water, having a slightly different
fluid density and bulk modulus. However, the results will not
change notably.
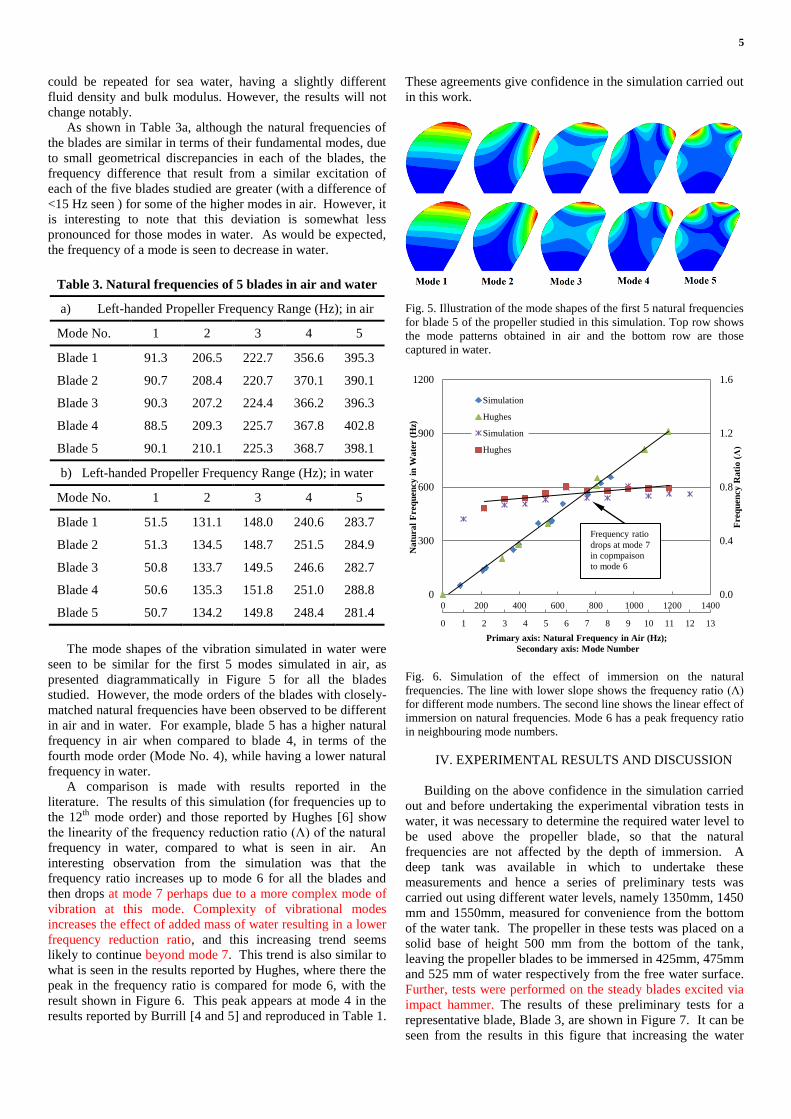
As shown in Table 3a, although the natural frequencies of
the blades are similar in terms of their fundamental modes, due
to small geometrical discrepancies in each of the blades, the
frequency difference that result from a similar excitation of
each of the five blades studied are greater (with a difference of
<15 Hz seen ) for some of the higher modes in air. However, it
is interesting to note that this deviation is somewhat less
pronounced for those modes in water. As would be expected,
the frequency of a mode is seen to decrease in water.
Table 3. Natural frequencies of 5 blades in air and water
a) Left-handed Propeller Frequency Range (Hz); in air
Mode No. 1 2 3 4 5
Blade 1 91.3 206.5 222.7 356.6 395.3
Blade 2 90.7 208.4 220.7 370.1 390.1
Blade 3 90.3 207.2 224.4 366.2 396.3
Blade 4 88.5 209.3 225.7 367.8 402.8
Blade 5 90.1 210.1 225.3 368.7 398.1
b) Left-handed Propeller Frequency Range (Hz); in water
Mode No. 1 2 3 4 5
Blade 1 51.5 131.1 148.0 240.6 283.7
Blade 2 51.3 134.5 148.7 251.5 284.9
Blade 3 50.8 133.7 149.5 246.6 282.7
Blade 4 50.6 135.3 151.8 251.0 288.8
Blade 5 50.7 134.2 149.8 248.4 281.4
The mode shapes of the vibration simulated in water were
seen to be similar for the first 5 modes simulated in air, as
presented diagrammatically in Figure 5 for all the blades
studied. However, the mode orders of the blades with closely-
matched natural frequencies have been observed to be different
in air and in water. For example, blade 5 has a higher natural
frequency in air when compared to blade 4, in terms of the
fourth mode order (Mode No. 4), while having a lower natural
frequency in water.
A comparison is made with results reported in the
literature. The results of this simulation (for frequencies up to
the 12th
mode order) and those reported by Hughes [6] show
the linearity of the frequency reduction ratio (Ʌ) of the natural
frequency in water, compared to what is seen in air. An
interesting observation from the simulation was that the
frequency ratio increases up to mode 6 for all the blades and
then drops at mode 7 perhaps due to a more complex mode of
vibration at this mode. Complexity of vibrational modes
increases the effect of added mass of water resulting in a lower
frequency reduction ratio, and this increasing trend seems
likely to continue beyond mode 7. This trend is also similar to
what is seen in the results reported by Hughes, where there the
peak in the frequency ratio is compared for mode 6, with the
result shown in Figure 6. This peak appears at mode 4 in the
results reported by Burrill [4 and 5] and reproduced in Table 1.
These agreements give confidence in the simulation carried out
in this work.
Fig. 5. Illustration of the mode shapes of the first 5 natural frequencies
for blade 5 of the propeller studied in this simulation. Top row shows
the mode patterns obtained in air and the bottom row are those
captured in water.
Fig. 6. Simulation of the effect of immersion on the natural
frequencies. The line with lower slope shows the frequency ratio (Ʌ)
for different mode numbers. The second line shows the linear effect of
immersion on natural frequencies. Mode 6 has a peak frequency ratio
in neighbouring mode numbers.
IV. EXPERIMENTAL RESULTS AND DISCUSSION
Building on the above confidence in the simulation carried
out and before undertaking the experimental vibration tests in
water, it was necessary to determine the required water level to
be used above the propeller blade, so that the natural
frequencies are not affected by the depth of immersion. A
deep tank was available in which to undertake these
measurements and hence a series of preliminary tests was
carried out using different water levels, namely 1350mm, 1450
mm and 1550mm, measured for convenience from the bottom
of the water tank. The propeller in these tests was placed on a
solid base of height 500 mm from the bottom of the tank,
leaving the propeller blades to be immersed in 425mm, 475mm
and 525 mm of water respectively from the free water surface.
Further, tests were performed on the steady blades excited via
impact hammer. The results of these preliminary tests for a
representative blade, Blade 3, are shown in Figure 7. It can be
seen from the results in this figure that increasing the water
0 1 2 3 4 5 6 7 8 9 10 11 12 13
0.0
0.4
0.8
1.2
1.6
0
300
600
900
1200
0 200 400 600 800 1000 1200 1400
Freq
uen
cy
Ra
tio (Ʌ)
Na
tura
l F
req
uen
cy
in
Wa
ter (
Hz)
Primary axis: Natural Frequency in Air (Hz);
Secondary axis: Mode Number
Simulation
Hughes
Simulation
Hughes
Frequency ratio
drops at mode 7
in copmpaison
to mode 6

6
level from 1350 mm to 1550 mm does not affect the natural
frequencies measured. Therefore it was considered
unnecessary to increase the water level further and it was thus
decided to conduct further tests in the tank using a 1350 mm
water level.
Fig. 7. Natural frequencies measured at different water levels (shown
below the x-axis). Natural frequencies (Hz) up to the 10th mode (the
top numbers on the x-axis) are presented in the table, for three
different water levels, 1350, 1450 and 1550 mm from the tank bottom
Examples of experimentally determined FFT spectra of
transient time domain signals for the first set of fibre-based
sensors (in fibre networks 1 to 4) on blade 1 and blade 5 are
shown in Figure 8. A number of tests were conducted on the
networks forming this set of fibre networks and these showed
that the amplitudes of the individual FFT features depended on
the location at which the blades were being excited. It was
found that for this set of fibre networks, the optimum
excitation location on the blades to capture the strong
amplitudes and the natural frequencies in a single test lies
somewhere between the centre line of the blade and trailing
edge, close to the 0.9 radius position of the propeller. This was
used in subsequent experiments.
A direct comparison was made of the results of the
simulation and the experimental measurements, for each blade
and for air and water, looking at the natural frequencies of
vibration of the blade. This has resulted in a considerable
volume of data, but here, for simplicity representative data are
shown which illustrate the accuracy of the sensors used and
thus the value of the approach.
Figure 9 shows a direct comparison of one of these
representative sets of experimental and simulation results – this
being obtained for blade 3 and acting as an illustration. The
results show an excellent agreement for the first 12 natural
frequencies, illustrating fully the capability of the specially
designed optical FBG-based sensor network in capturing the
vibration behaviour of a complex structure, such as a marine
propeller. This has been done over a wide frequency range, at
multiple positions, and both in air and water. This cannot be
achieved with conventional sensors and under water.
Following the procedure explained in prior work from the
authors [11], in order to investigate the mode orders, strain data
captured from each sensor were plotted on an expanded area of
the blade according to the sensor grid presented in Figure 3.
Knowing the effective magnitude of stain and frequency at
each location known, an interpolation of the strain data
obtained from all the sensors at each natural frequency, has
enabled the extensive 2D strain mode shapes shown (for blade
5) in Figure 10 to be created. The high number of sensors
permitted using the optical approach has enabled this to be
possible. Thus comparing the experimental and FE-based
simulation results, it can be seen that excellent agreement
between the two sets of data presented has been achieved. The
optical FBG-based sensor network designed and used here has
again showed itself to be the basis of a unique and reliable
technique for the measurement of strains of full-sized marine
propellers, both in water and in air.
a)
b)
Fig. 8. FFT spectra calculated for captured signals from experimental
tests in water on blade 1 (spectrum (a)) and blade 5 (spectrum (b)).
V. CONCLUSION
A novel approach to the generation of accurate information
for the analysis and thus better understanding of the
displacement mode shapes of a full-sized actual marine
propeller using a specially-designed optical fibre sensor
network allowing monitoring in real-time of the associated
Bragg wavelength shifts from arrays (networks) of FBG
sensors has been reported. The results of simulation using
finite element techniques with a theoretical model which was
created using Abaqus FE software were verified through a
comparison of the results obtained with those obtained through
experimental measurements. The results were found to be in
very good agreement, within experimental error. It was also
confirmed that the location of the excitation on the blades, as
expected, directly affected the amplitudes of the various
frequencies that were detected in the experimental work.
The results of this work have shown the potential for the
use of these advanced optically-based experimental techniques,
coupled to advanced FE models to allow the most
comprehensive investigation of actual multiple blade propellers
of different types and sizes. This is the subject of on-going
0
100
200
300
400
500
600
1 2 3 4 5 6 7 8 9 10
1350 mm 52 137 151 250 286 406 419 426 495 568
1450 mm 52 137 149 251 286 408 419 425 494 567
1550 mm 51 137 150 251 287 408 420 426 495 568
Fre
qu
ency
(H
z)

7
research. However, clearly the outcome of this work has
shown the value of innovative use of FBG-based sensor
networks for this purpose in different applications in marine
technology.
Fig. 9. Natural frequencies obtained from a series of tests, both experimental and simulation, both in air and in water, for blade 1.
Fig. 10. First 5 natural frequencies strain mode shapes created from experimental data comparing to those obtained from FE analysis for blade 5.
First row shows the strain mode shapes captured in air tests. Second row shows the results in water for the same blade. Third row shows the
results of simulation in air and fourth row shows the calculated strain modes in water using Abaqus software for relatively similar natural
frequencies.
ACKNOWLEDGMENTS
The support of the Royal Academy of Engineering and the
George Daniels Educational Trust for K. T. V. Grattan is
gratefully acknowledged.
REFERENCES
[1] Conn, J.F.C. Marine propeller blade vibration. Trans.
IESS, 1939.
[2] P. Castellini and C. Santolini, Vibration
measurements on blades of naval propeller rotating in water
with tracking laser vibrometer, Measurement, 24, 43–54, 1998.
[3] Carlton J. S., Propeller blade vibration in Marine
Propeller and Propulsion, 3rd ed., Butterworth-Heinemann,
Oxford, UK, 2012, ch. 21, pp. 421-429
0
100
200
300
400
500
600
700
800
900
1000
0 1 2 3 4 5 6 7 8 9 10 11 12 13
Natu
ral
Fre
qu
ency
(H
z)
Mode Number
Experiment-Air
Simulation-Air
Experiment-Water
Simulation-Water
8
[4] Burrill, L. C., Underwater propeller vibration tests.
Trans. NECIES, 65, 1949
[5] Burrill, L. C., Marine propeller blade Vibrations: full
scale tests. Trans. NECIES, 62, 1946
[6] Hughes, W. L., Propeller blade vibrations. Trans.
NECIES, 65, 1949
[7] Lockwood Taylor, J., Propeller blade vibrations.
Trans. RINA, 1945
[8] Holden, K., Vibrations of marine propeller blades,
Norwegian Mar. Res., 3, 1974
[9] K. O. Hill and G. Meltz, Fiber Bragg Grating
Technology Fundamentals and Overview, J. Lightwave Tech.
15(8), pp. 1263-1276, 1997
[10] O. C. Zienkiewicz, and R. E. Newton, “Coupled
Vibrations of a Structure Submerged in a Compressible Fluid,”
Sym-posium on Finite Element Techniques, S 196 9, pp. 360-
378.
[11] S. Z. S. Javdani, M. Fabian, J. Carlton, T. Sun, K.T.V.
Grattan, Fibre Bragg Grating-based system for measurement of
vibrational characteristics of full-scale marine propeller blades,
J. International Shipbuilding Progress, 2015, [to be published]
Saeed Javdani received his first M.S. degree from School of
Engineering and Mathematical Sciences (SEMS), City University
London, UK, in Maritime Operation and Management and his second
M.S. degree in Maritime Transport and Economics from University of
Antwerp, Belgium, in June and October 2011, respectively. He is
currently pursuing his Ph.D. in mechanical engineering at SEMS, City
University London, UK. His current research interests include
vibration and transient signal analysis of marine structures using Fibre
Bragg Grating (FBG) sensors.
Matthias Fabian Dr Matthias Fabian received a degree (Dipl.-Ing.
(FH)) in Electronics from Hochschule Wismar, Germany, in 2006. He
spent a semester at the Tokyo University of Science (TUS) in Tokyo,
Japan, in 2005 gaining practical experience with microwave and
optical devices. He was awarded his PhD in Fibre Optic Sensors from
the University of Limerick, Ireland, in 2012. In 2010 he was awarded
a short term visiting researcher grant from the Italian National
Research Council for a stay at the National Institute of Optics in
Naples, Italy, where he worked on fibre-loop cavity ringdown
spectroscopy. He was a Systems Engineer intern at Intel Corporation
for a year in 2011 writing software for wireless sensors connected to
Android devices. He is currently a post-doctoral research fellow at
City University London, UK, working on optical fibre sensors for a
variety of applications in the civil engineering, marine and power
electronics sector.
John Carlton Following training as a mechanical engineer and
mathematician, Professor Carlton served in the Royal Naval Scientific
Service undertaking research into underwater vehicle hydrodynamic
design and propulsors. In 1975, he joined Lloyds Register, first in the
Technical Investigation Department and after nine years transferred to
the Advanced Engineering Department as its Deputy Head. He later
moved to the newly formed Performance Technology Department
where he initiated and led several research and development activities
in the fields of ship hydrodynamics, diesel engine technology,
machinery condition monitoring and control technology. In 1992 he
returned to the Technical Investigation Department as the Senior
Principal Surveyor and Head of Department in which capacity he
served for 11 years and then, in 2003, Professor Carlton was invited to
become the Global Head of Marine Technology for Lloyds Register.
After 35 years within Lloyds Register, Professor Carlton was then
invited to become Professor of Marine Engineering at the City
University London in which capacity he now serves and is responsible
for the postgraduate maritime studies. He is also closely involved with
the newly formed International Institute for Cavitation Research at the
University.
During his career he has presented and published around 120
technical papers and articles as well as having written a textbook
entitled Marine Propellers and Propulsion which is now in its 3rd
Edition. He is also a contributing author to the Marine Engineering
Reference Book. Professor Carlton has been awarded the Denny Gold
Medal of the Institute of Marine Engineering, Science and
Technology twice and has also won the Stanley Gray Award for
Marine Technology twice. Additionally, he is active in a number of
research groups and has sat on several international and government
committees. In 2006 he was awarded the honorary degree of Doctor of
Science for his contribution to marine technology. Professor Carlton
was the 109th President of the Institute of Marine Engineering,
Science and Technology in 2011/12 and was elected a Fellow of the
Royal Academy of Engineering in 2011.
Tong Sun Professor Tong Sun was awarded the degrees of Bachelor
of Engineering, Master of Engineering and Doctor of Engineering
from the Department of Precision Instrumentation of Harbin Institute
of Technology, Harbin, China in 1990, 1993 and 1998 respectively.
She was awarded the degree of Doctor of Philosophy at City
University in applied physics in 1999 and was an Assistant Professor
at Nanyang Technological University in Singapore from year 2000 to
2001 before she re-joined City University in 2001 as a Lecturer.
Subsequently she was promoted to a Senior Lecturer in 2003, a
Reader in 2006 and a Professor in 2008 at City University, London.
Prof. Sun is currently the Director of Research Centre of Sensors and
Instrumentation and is leading a research team focused on developing
a range of optical fibre sensors for a variety of industrial applications,
including structural condition monitoring, early fire detection,
homeland security, process monitoring, food quality and
environmental monitoring. She has been working closely with
partners across disciplines from academia and industry, both in the
UK and overseas. Prof. Sun is a member of the Institute of Physics
and a Fellow of the Institution of Engineering and Technology and a
Chartered Physicist and a Chartered Engineer in the United Kingdom.
She has authored or co-authored some 230 scientific and technical
papers.
Kenneth T. V. Grattan Professor Grattan graduated in Physics from
Queens University Belfast with a BSc (First Class Honours) in 1974,
followed by a PhD in Laser Physics in the use of laser-probe
techniques for measurements on potential new dye laser systems. In
1978 he became a Research Fellow at the Imperial College of Science
and Technology, to work on advanced photolytic drivers for novel
laser systems. In 1983 he joined City University as a new blood
Lecturer in Physics, being appointed Professor of Measurement and
Instrumentation and Head of the Department of Electrical, Electronic
and Information Engineering in 1991. His research interests have
expanded to include the use of fibre optic and optical systems in the
measurement of a range of physical and chemical parameters for
industrial applications. He obtained a DSc from City University in
1992 for his work in sensor systems was President of the Institute of
Measurement and Control during the year 2000. He was awarded the
Callendar Medal and the Honeywell Prize of the Institute of
Measurement and Control and was Dean of the School of Engineering
& Mathematical Sciences and the School of Informatics at City
University from 2008-12. He was appointed Dean of the City
Graduate School in 2012. He was elected a Fellow of the Royal
Academy of Engineering in 2008. He is the author of over seven
hundred publications in major international journals and conferences
and is the co-editor of a five volume topical series on Optical Fibre
Sensor Technology.