Embed Size (px)
Citation preview

CITY-REGION PLANNING IN LONDON: TOWARDS A SUB-REGIONAL TRANSPORT FRAMEWORK
Richard McGreevy, Transport for London
Robin Hickman and Tim Pharoah, Llewelyn-Davies 1. INTRODUCTION “Make no little plans for they have no magic to stir men’s blood and probably will themselves not be realised.” So said Daniel Burnham, that great American planner and designer of cities in the early 1900s, architect of the City Beautiful Movement, and most famous for his visionary Chicago plan of 1909. And this, in essence, is the challenge for sub-regional city-regional planning in London; major strategic thinking is required, particularly in the East Sub-Region. Although this time we will, of course, aim for uni-sex approval. The draft Spatial Development Strategy for London (the London Plan, June 2002) proposes five sub-regional planning areas in London. In this paper, we examine how the issues of transport, urban planning and regeneration interact in one of these areas – the East London Sub-Region – and consider how city-region spatial planning can lead to sustained economic performance, social cohesion and urban/environmental attractiveness. We structure our thoughts into three parts: first, the East Sub-Region context, followed by an overview of the proposed integrated land use and transport strategy and, finally, implementation mechanisms. 2. EAST LONDON SUB-REGION: THE CONTEXT The East Sub-Region covers nine London boroughs, including Barking & Dagenham, Bexley, Greenwich, Hackney, Havering, Lewisham, Newham, Redbridge, Tower Hamlets and, interestingly, the City of London. Figure 1: The East Sub-Region
2.1 Drivers of Change The East Sub-Region is the largest of London’s sub-regions and includes a major part of the Thames Gateway. The draft London Plan identifies the sub-region as the Mayor’s priority area for development, regeneration and infrastructure improvement. Key drivers of future transport demand are population and employment growth. The sub-region is expected to accommodate almost a third of the total population growth in London up to 2016. In line with regional guidance this is seen as part of a key drive to shift development pressure to the East of London.

Achieving this level of population growth is a major challenge: the East Sub-Region’s population has grown from just over 1.8 million in 1981 to nearly 2 million in 2001, yet this is still below 1961 levels of over 2.1 million. The aspiration for 2016 is nearly 2.2 million: a rise of over 200,000 people from current levels; this is equivalent to a town the size of Milton Keynes. Figure 2: Population Trends and Forecasts (1961-2016)
The East Sub-Region incorporates the City of London, which is part of the Central Activities Zone (CAZ) and also London Docklands. In the City employment density is the greatest found in London, reaching over 1,000 employees per hectare. The remainder of the CAZ falls in the Central Sub-Region, but of course is also an important source of employment and other activities for residents of the East Sub-Region. Figure 3: Employment Density (2001)
The sub-region contains a number of opportunity sites, forming zones of change, including the Royal Docks, London Riverside, Greenwich Peninsular and the Lower Lee Valley. These underused areas are planned to be the sites of future employment and household increases.
0
500
1000
1500
2000
2500
1961Census
1971MYE
1981MYE
1991MYE
2001MYE
2011 2016
Popu
latio
n (0
00s)
Havering
Hackney
Lew isham
Tow er Hamlets
Redbridge
New ham
Greenw ich
Bexley
Barking and Dagenham
City of London

Development in the sub-region will continue well beyond the London Plan period (2016) as the impact of new transport infrastructure and programmes of land assembly come together. Figure 4: Opportunity and Intensification Areas (from the draft London Plan) Key Development Areas Opportunity Areas Area (ha) New Jobs to
2016 New Homes to
2016 Bishopsgate/ South Shoreditch
35 16,000 800
Whitechapel/ Aldgate 31 14,000 700 Isle of Dogs 100 100,000 3,500 Stratford 124 30,000 4,500 Lower Lee Valley 250 8,500 6,000 Royal Docks 368 11,000 5,500 Barking Reach 210 200 10,000 Dagenham Riverside 99 4,000 3,000 Deptford Creek/ Greenwich Riverside
72 5,500 1,000
Greenwich Peninsular 104 15,000 7,500 Belvedere/Erith 242 5,000 1,400 Thamesmead 121 1,500 3,000 Ilford 56 - 5,500 Areas for Intensification
Area (ha) New Jobs to 2016
New Homes to 2016
Beckton 80 1,500 500 Woolwich Arsenal 40 1,000 1,000 Kidbrooke 103 - 2,200
2.2 The Deprivation Link Deprivation in the East Sub-Region is the most acute of all the five sub-regions in London. Indices of income, employment, health, education and housing all score poorly. The only positive note is in terms of accessibility, where scores are higher, particularly in terms of public transport accessibility to and from the City of London. Transport investments should target these deprived areas, linking significant areas of deprivation with key employment sites. Figure 5: Index of Deprivation (2001)

2.3 Transport Patterns and Trends The City and Docklands both attract a significant amount of inward commuting from the rest of London and indeed the rest of south-east England, and this dominates the pattern of peak hour travel, especially by rail. Public transport in this part of the sub-region is intensive, both in terms of routes and service frequencies. Recent and planned rail schemes (such as the Jubilee Line Extension and Docklands Light Railway) are tending to shift the area of high public transport accessibility eastwards beyond Canary Wharf to parts of Greenwich and Newham. In the boroughs further east, the density of jobs and homes decreases, deprivation is less apparent and the public transport network is less developed, especially in non-radial directions. There is a heavier reliance on bus than in the inner boroughs. This is reflected in the relatively low public transport accessibility scores for areas around some of the sub-region’s centres, such as Catford and Ilford. In some centres it appears that the public transport accessibility offers potential for more intensive use. For example, Barking has more areas with good public transport accessibility than Ilford, yet Ilford is designated (and functions) as the Metropolitan centre. In a similar manner, Woolwich has higher accessibility than would be anticipated from its relatively weak position as an employment and retail centre. The point is also relevant at a smaller scale, with reasonable accessibility to public transport in Erith failing to counteract the economic decline of its centre. Figure 6: Public Transport Accessibility (2001)
The breakdown of weekday travel patterns is also illuminatingi. As we can see overleaf: The great majority of trips (74%) are internal to the sub-region. The main movement out of the sub-region, unsurprisingly, is to the Central Sub-Region,
reflecting the high proportion of jobs and other facilities located there. The majority of this travel is undertaken by public transport, reflecting the high costs and difficulties associated with using private motorised transport in the centre of London.
The next largest inter sub-regional movement is to areas outside London, and the majority is undertaken by private motorised transport, probably reflecting a diversity of origins and destinations.
There is relatively much less travel to the North and South sub-regions, for which private motorised transport is predominant.

There is relatively little movement to the West Sub-Region, though the majority is made by public transport.
Figure 7: Weekday Travel Patterns (1991)
North-south movement across the sub-region is restricted by the severance effect of the River Thames and the lack of any river crossing for either car or public transport between the Blackwall Tunnel and the Dartford crossings beyond the London boundary. Local travel in the outer areas is on foot or by bus and, predominantly, by car. The Underground and National Rail networks do serve parts of the sub-region, extending out to Romford, Upminster and beyond, but lack the scale and integration of the Underground network found in the North and West sub-regions and the rail network of the South. 3. AN INTEGRATED LAND USE AND TRANSPORT STRATEGY “Whether by the crudest of speculative mechanisms or the guiding hand of social purpose, transport did prove to be the maker of cities – and also, if it failed, its breaker.” Colin Clark, 1957. So, is it that simple? Provide the appropriate transport network, and sit back and relax? Well, unfortunately not, a whole host of complementary measures are also required if transport investment is to impact on urban performance in the East. For example, top-down sectoral trends and macro influences, employment rates, productivity ratios, innovative and learning capacities, improved business environments and appropriate company characteristics all need to be in place, and working in the same directionii. Begg (1999) provides a good summary of the wider factors involved in urban performance, see Figure 8. Land use and transport integration is also critical, and next we explore how that can be achieved.

Figure 8: The Urban Competitiveness Maze
3.1 The Principles The wisdom of contemporary best practice tells us a number of things about the possible planning of such a city-region. There are at least three key sources to innovative solutions: history, current academic practice and current planning practiceiii. We consider these, in brief, below: First, the most relevant historical lesson is found in Scandinavia, way back in the 1950s.
Both Copenhagen and Stockholm were extended with new settlements strung as ‘beads’ along suburban railway spines. This is a direct model for growth in the East Sub-Region.
Second, contemporary academic knowledge on the topic of land use and transport
integration has been developing over the last 20 years. The most well-known study is from Newman and Kenworthy (1989 and updated in 2000). Their key thesis is that European cities are denser than Australian and American ones, and that this is systematically associated with lower energy consumption per capita. Cities with strong concentrations of central jobs, and accordingly a better developed public transport system, have much lower energy use than cities where jobs are scattered. Despite being criticised by some authors (see, for example, Gordon and Richardson, 1989) the principle of compaction retains strong credence and has been acknowledged in governmental guidance, such as PPG13, in the UK. Others such as Breheny and Rookwood (1993), Owens (1992), Headicar and Curtis (1995) and Banister (1998) have progressed these ideas, and have developed a relatively consistent storyline: locate developments along strong public transport corridors and close to towns that will offer sources of employment.

Figure 9: Breheny and Rookwood’s Sustainable Development
Finally, in terms of contemporary planning practice, Calthorpe (1993 and 2001) has
developed interesting ideas in the USA. For example, he proposes walking scale suburban developments around public transport stops, the clustering of some job and service opportunities at the nodes, and high density housing with street parking. Similar ideas have been proposed by Llewelyn-Davies (2000) and are indeed embedded in much of the better master planning practice in the UK.
3.2 Theory into Practice in the East Sub-Region So what does all this mean for the East Sub-Region in London? Next we explore how the proposed sustainable transport and land use strategy for the East Sub-Region draws on these good practice principles. As we have seen, the draft London Plan sets out the policy directions for each of London’s five sub-regions. These in turn are being developed in more detail as supplementary planning guidance for each sub-region within five Sub-Regional Development Framework documents. The East Sub-Region contains the London portion of the Thames

Gateway regeneration area, an area of national importance and a resource to accommodate a significant proportion of London’s future employment and housing growth. In February 2003, the Office of the Deputy Prime Minister launched ‘Sustainable Communities: Building for the Future’ (the Sustainable Communities Action Plan). This confirmed that the Thames Gateway would be one of four priority areas for the development of new residential communities. Because of the urgency, size and complexity of the Thames Gateway regeneration task, complementary, but more spatially detailed advice has been drafted in the Thames Gateway Development and Delivery Strategy (GLA and TfL, 2003). This has necessarily meshed local and strategic objectives and interventions through a partnership between local and regional London governance. The following overarching vision provides the future direction for the East Sub-Region: “By 2020, Thames Gateway London should be a destination of choice for living and working, with a balanced and well-designed housing stock, a range of job opportunities and good connections to the rest of London, south east England and Europe. We will build new residential communities that reflect East London’s existing character, that centre on hubs served by new and existing public transport, and that are designed to include buildings and public space of the highest quality. These will deliver improved quality of life and integrated social, environmental and economic revitalisation to existing communities…” This vision is translated into a series of principles, drawing on national guidance found in publications such as the Urban White Paper and Communities Plan, etc. and as outlined below, which are used to inform the detailed planning of areas within the sub-region.
A) Providing a mix of uses at all scales, with shops, open space and local services within walking distance of all homes, and workplaces, retail centres, and cultural and leisure facilities easily accessible by public transport;
B) Developing at densities that make best use of land, and strengthen the viability of public transport and facilities;
C) Providing access to a range of employment opportunities, both locally and across London and the south east, with the training provision that will give local people the skills to access these opportunities;
D) Valuing and consolidating existing assets (such as the River Thames, London marshes and the green belt) to provide a high quality public realm, with squares, parks, and walking and cycling routes that are safe and enjoyable for all;
E) A social mix, through managed integration of different tenure types and values of housing;
F) Environmental sustainability, through good public transport links, environmentally sound construction methods, a sustainable mix of uses, and an open space strategy that values biodiversity and nature conservation;
G) Exhibiting excellent architectural and urban design, to provide the balance of uses set out above, to consolidate and support existing centres, to focus higher density development around transport nodes, and to make London Thames Gateway an attractive and enjoyable place to live, work and visit; and
H) Delivering excellent public services, particularly education and health services, to ensure a high quality of life for all.
A key theme emerging from the principles and vision set out above is the issue of linking public transport and development along corridors and around transport centres and hubs. This draws directly on Scandinavian experience in the 1950s and more recent academic thinking from Newman and Kenworthy, Hall, Banister and Breheny et al. Public transport accessibility is measured using a number of techniques – such as PTALs, CAPITAL and LTSiv – resources which are particularly well developed in London. Areas of existing and forecast good public transport accessibility are matched relatively easily to population, employment and other services.
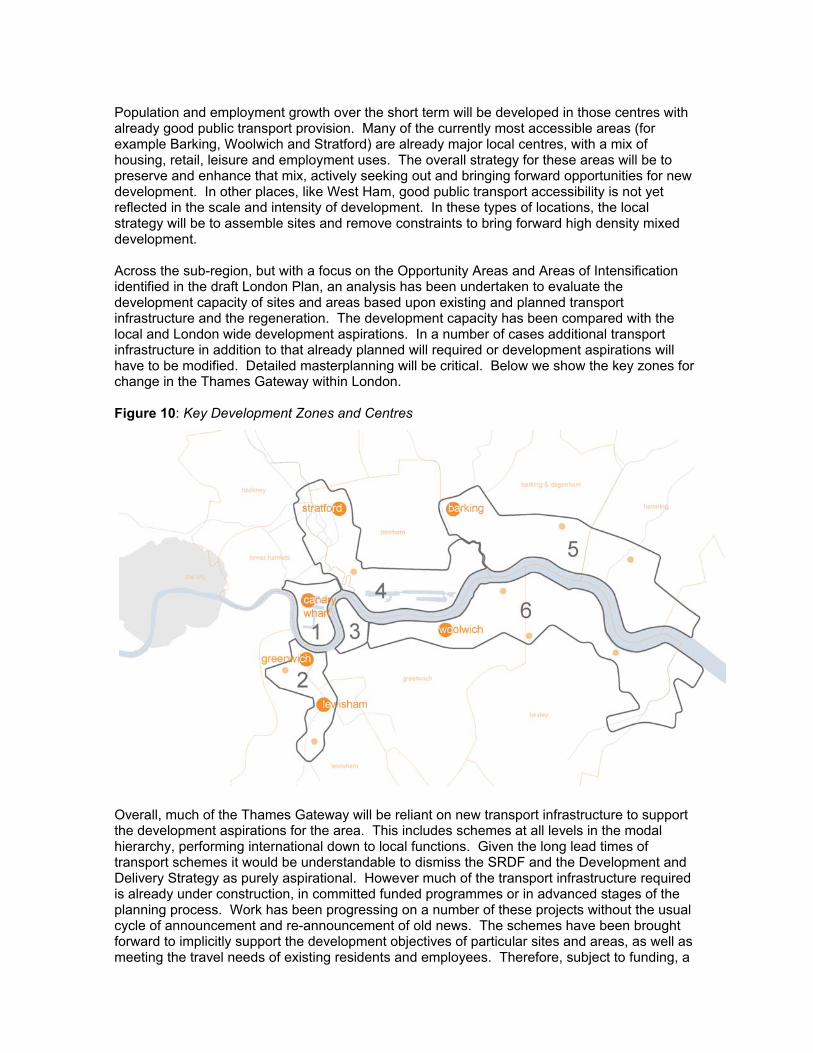
Population and employment growth over the short term will be developed in those centres with already good public transport provision. Many of the currently most accessible areas (for example Barking, Woolwich and Stratford) are already major local centres, with a mix of housing, retail, leisure and employment uses. The overall strategy for these areas will be to preserve and enhance that mix, actively seeking out and bringing forward opportunities for new development. In other places, like West Ham, good public transport accessibility is not yet reflected in the scale and intensity of development. In these types of locations, the local strategy will be to assemble sites and remove constraints to bring forward high density mixed development. Across the sub-region, but with a focus on the Opportunity Areas and Areas of Intensification identified in the draft London Plan, an analysis has been undertaken to evaluate the development capacity of sites and areas based upon existing and planned transport infrastructure and the regeneration. The development capacity has been compared with the local and London wide development aspirations. In a number of cases additional transport infrastructure in addition to that already planned will required or development aspirations will have to be modified. Detailed masterplanning will be critical. Below we show the key zones for change in the Thames Gateway within London. Figure 10: Key Development Zones and Centres
Overall, much of the Thames Gateway will be reliant on new transport infrastructure to support the development aspirations for the area. This includes schemes at all levels in the modal hierarchy, performing international down to local functions. Given the long lead times of transport schemes it would be understandable to dismiss the SRDF and the Development and Delivery Strategy as purely aspirational. However much of the transport infrastructure required is already under construction, in committed funded programmes or in advanced stages of the planning process. Work has been progressing on a number of these projects without the usual cycle of announcement and re-announcement of old news. The schemes have been brought forward to implicitly support the development objectives of particular sites and areas, as well as meeting the travel needs of existing residents and employees. Therefore, subject to funding, a
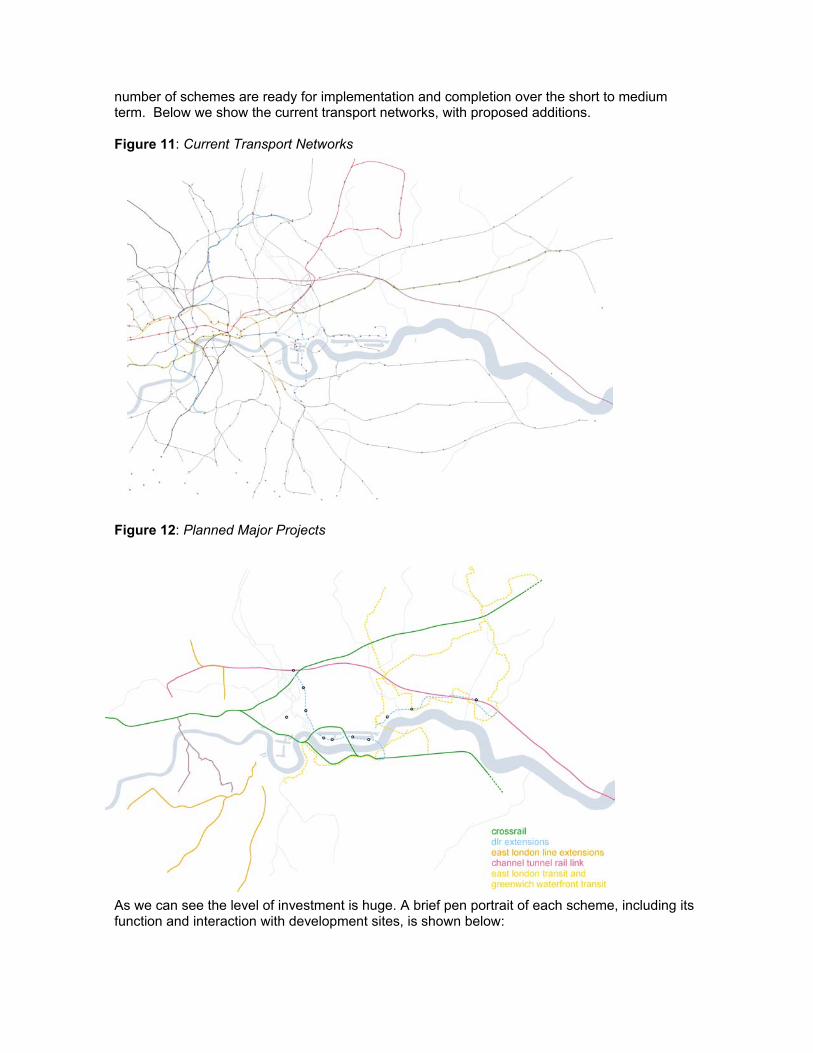
number of schemes are ready for implementation and completion over the short to medium term. Below we show the current transport networks, with proposed additions. Figure 11: Current Transport Networks
Figure 12: Planned Major Projects
As we can see the level of investment is huge. A brief pen portrait of each scheme, including its function and interaction with development sites, is shown below:
International links Channel Tunnel Rail Link (CTRL 2) – a 39km extension from the existing high speed rail link
between London and the Channel Tunnel. Route will further reduce journey times between London and Europe; the international and domestic services will serve Stratford International station in the heart of the ‘Stratford City’ development area (programmed opening date 2007)
Regional links The National Rail C2C network operating on the Fenchurch Street, Tilbury and Southend
line has been the subject of a recent programme of signalling, station and rolling stock enhancements. South of the river, on the north Kent network, belated work is being planned to upgrade the power supplies to allow the realisation of the benefits of investment in new rolling stock. Crossrail Line 1
Crossrail 1 - high capacity rail link with the City, Isle of Dogs, the West End and Heathrow (programmed opening date 2012)
Crossrail 2 - high capacity rail link between Victoria and Kings Cross. In addition, would allow existing north-east and south west suburban rail services to be linked across London (programmed opening date 2016).
East London Line – integration of National Rail services north and south of the Thames. Involves a northwards extension from the current LU terminus of Shoreditch to Highbury and Islington, where the route will link with the North London Line. At a later stage the route will be extended south to link with the National Rail network. This scheme forms part of what is known as “orbirail”.
Sub-Regional links Thames Gateway Bridge - six lane dual carriageway bridge between Barking and
Thamesmead. Four general traffic lanes and two busway lanes. (programmed opening date 2010)
Silvertown - a single carriageway tunnel between North Greenwich and Silvertown (programmed opening date 2013/2015)
Various DLR extensions: (1) DLR Woolwich - a 2.5km extension mainly in bored tunnel from King George V station to Woolwich Arsenal. (2) DLR Stratford International - a 4.5/5km extension from Custom House to Stratford International and possibly Temple Mills via Canning Town and West Ham. (3) DLR Dagenham Dock - A 5.5 km mainly elevated extension of the DLR from Gallions Reach through Barking Reach to Dagenham Dock station. (4) DLR City Airport - a 4.4km mainly elevated extension from Canning Town to North Woolwich (King George V).
East London Transit - a bus based transit scheme to be implemented in phases. The first phase will operate between Ilford, Barking, Barking Reach and Dagenham Dock Station (programmed opening date 2006).
Greenwich Waterfront Transit - Phase one of the bus based transit scheme will operate between North Greenwich and Abbey Wood using 1.8km of busway already in place on the Greenwich Peninsula and 6km of new busway to be built from Woolwich Town Centre through Thamesmead to Abbey Wood (programmed opening date 2008).
Putting all these together, and mapped onto the key development aspirations, we get the following integrated transport and land use strategy.

Figu
re 1
3: A
n In
tegr
ated
Lan
d U
se a
nd T
rans
port
Stra
tegy
for t
he E
ast S
ub-R
egio
n

Further work is required to ascertain the detailed land use and transport network fit; in terms of capacity, etc. But the overall strategy is now in place. The improvement in public transport accessibility will be significant, as shown below. Figure 14: Current Public Transport Hubs
Figure 15: Planned Public Transport Hubs

3.4. Expected Results So what will happen to traffic flows in the future? Extensive modelling of future transport and development scenarios in the East Sub-Region has been carried out by Transport for London. Highway and public transport performance summary statistics for 2001 and 2016 are shown below. The predicted highway changes by 2016 are consistent with the large amount of growth in both homes and jobs in the sub-region. There is a substantial forecast increase in flow (17%) which is greater than the pan-London increase of 11%. Vehicle travel time is forecast to increase by 22% (compared to 16% London-wide), vehicle speeds to decrease by 4% (the same as 4% London-wide) and delays increase by 34% (compared to 27% London-wide). Bearing in mind that the increase in population in the sub-region is forecast to be 200,000 more people from 2001-2016, an increase of 10% on the 2 million person base, even this huge level of investment in the transport network leads to a worsened traffic situation compared to the present day. And the close integration of planning, development and transport is critical to even this scenario being achieved. The plan is that the East Sub-Region will play a disproportionately beneficial role in meeting the objective of transport sustainability across London. The level of transport investment required may appear to be high in absolute terms, but it is critical to the future quality of life in the sub-region and in London as a whole. Figure 17: Highway Forecasts
2016 Forecast Highway Performance 2001 Base
Planned % Change Vehicle travel distance (km) East Sub-Region 1,373,088 1,602,227 17% London 5,114,774 5,694,543 11% Vehicle travel time (hours) East Sub-Region 47,581 58,018 22% London 203,642 237,095 16% Vehicle speeds (km/h) East Sub-Region 28.9 27.6 -4% London 25.1 24.0 -4% Free-flow vehicle time (hours) East Sub-Region 30,735 35,375 15% London 125,861 138,396 10% Delay vehicle time (hours) East Sub-Region 16,846 22,643 34% London 77,780 98,699 27% Delay rate (mins/km) East Sub-Region 0.74 0.85 15% London 0.91 1.04 14%
(LTS data, Average Morning Peak Hour)

Predicted public transport movements show even greater growth levels. Passenger km on National Rail are forecast to grow by 60% by 2016 (greater than the London average of 48%), on the Underground/DLR and CTL by a collective 21% (compared to 23% London wide) and bus 15% (22% London wide). The predicted changes in traffic movements are thus huge. Figure 18: Public Transport Forecasts: East Sub-Region
2016 Forecast Highway Performance 2001 Base
Planned % Change National Rail Passenger km 3,746,232 6,007,894 60% Total seats km 5,590,167 10,068,911 80% Crowded hours 37,386 49,844 33% Uncrowded hours 75,644 126,141 67% Underground/DLR/CTL Passenger km 2,093,352 2,524,757 21% Total seats km 2,216,918 2,905,623 31% Crowded hours 26,828 24,864 -7% Uncrowded hours 63,726 72,608 14% Bus Passenger km 887,987 1,017,082 15% Total seats km 3,387,308 4,594,649 36% Total passenger hours 65,449 73,964 13%
4. HOW DO WE GET THERE? “Nobody heard him, the dead man, but still he lay moaning: I was much further out than you thought and not waving but drowning.” From Stevie Smith, Not Waving but Drowning (1957) and quoted in Buck et al (2002) Working Capital. So, is the implementation gap too great? Is governance ‘drowning’ in the weight of local problems and the actual size of the task ahead? Is it ineffective in responding to the issues? Buck et al (2002) suggest the jury is still out, but that the potential for effective urban leadership is certainly there amongst the current institutions. As ever in a city the size of London, the difficulties are immense. The sub-region is certainly not short of stakeholders; co-ordination is the main issue. The main players include: The Mayor of London and Greater London Authority are the strategic planning body; the
London boroughs (and the urban development corporation when established) set planning policy and give planning permission for new development;
Within the GLA, the Mayor of London’s Architecture and Urbanism Unit works with the London Development Agency and others to develop design-led masterplans and strategies for key development sites and locations, which will be taken forward by the LDA’s new International Design Committee, and panel of design advisors;
The London boroughs are the local planning authority, delivering housing, social and educational services and local transport initiatives, and are responsible for the quality of the local environment;
The London Development Agency (and the urban development corporation when established) invests in social, economic and environmental regeneration;
Transport for London strategic transport authority, makes the case for and promotes new road and public transport projects;
The Housing Corporation, working with the London boroughs and the Mayor of London, agrees priorities for housing investment;
English Partnerships, the Governments development agency, are a major land owner in the area;
London Development Agency (and the UDC when established) can buy land, using compulsory purchase powers where necessary, and can prepare land for development.

Thames Gateway London Partnership Government Office for London Transport Department for Transport Office of the Deputy Prime Minister
In order to address the co-ordination issue, the Communities Plan set out proposals for new delivery mechanisms for bringing forward development in Thames Gateway, notably an Urban Development Corporation (UDC) within London and a new London Thames Gateway Partnership Board, to be jointly chaired by the Mayor of London and the Minister for London. The Board would co-ordinate and oversee the activity of delivery agencies (including the new UDC) within the London Thames Gateway and will have representatives from all three tiers of London government, public and private interests. 5. FINAL THOUGHTS In any city-region strategy of this dimension and complexity there will remain ongoing issues which need resolution. Below we end our paper with a number most pertinent to the East Sub-Region: The East Sub-Region has some of London’s largest development sites and also has the
largest number of transport schemes planned in London. The key issue is the extent to which these schemes are sufficiently well aligned, in terms of scale, type and timing, to the growth and development programme.
The current forecasted employment growth figures exceed household growth, meaning that there may be an increase in travel to work from outside as well as inside the sub-region. A substantial proportion of the employment increase will be in Central London (including the City) and Docklands, requiring additional radial commuter (peak hour) rail capacity. This will be addressed by the major strategic rail schemes, especially Crossrail. The travel to work within the sub-region and from sub-regions to the north and south is harder to address, as it will create tangential patterns of movement, currently mostly served by buses.
There are development capacity issues elsewhere in the sub-region. A key example is Greenwich / Bexley Riverside which has potential for considerable growth extra to that identified in the DLP. Large scale growth in this area has the potential to create a new “linear city” which could enable the revitalisation of Woolwich, Thamesmead and Edith town centres.
The rate of traffic generation is currently the lowest of the sub-regions. By 2016 changes will have pushed it into second place behind Central Sub-Region. Even so, despite being earmarked for the largest amount of population growth, the additional traffic generated will be little more than the West and South sub-regions (whose growth will amount to less than half that in East Sub-Region). If this scenario can be achieved, it means that the East Sub-Region will play a disproportionately beneficial role in meeting the objective of transport sustainability across London.
If London were to win the hosting of the 2012 Olympic Games, this would have major implications for the East Sub-Region including the transport investment required and its timing/phasing. A general issue at this stage is whether and how the bid would affect the nature and timing of both development and transport proposals. For example, location of the Olympic Village would affect the sites that are available for other uses in the interim period (housing and employment). The imperative of providing any additional transport facilities to serve the Games would inevitably have an impact on the priority attached to other schemes in the sub-region, if not in London as a whole.
Big plans have (almost) been made, now it is time for detailed local masterplanning and, critically, implementation.

6. SELECTED BIBLIOGRAPHY Banister, D. (1998) Transport Policy and the Environment. Breheny, M. and Rockwood. R. (1993). Planning the Sustainable City Region. In: Blowers, A. (ed.) Planning for a Sustainable Environment. Breheny, M. (1995). Counterurbanisation and Sustainable Urban Forms. In: Brotchie, J. et al (eds.) Cities in Competition. Productive and Sustainable Cities for the 21st Century. Buck et al (2002) Working Capital: Life and Labour in Contemporary London. Calthorpe, P. (2001) The Regional City. Cervero, R. (1998) The Transit Metropolis. Curtis. C and Headicar, P. (1995). Reducing the Need to Travel: Strategic Housing Location and Travel Behaviour. In: Earp, J.H, Reducing the Need to Travel: Some Thoughts on PPG13. Oxford Planning Monographs. Vol. 1, No. 2. GLA (2002) The Draft London Plan. Gordon, P. and Richardson, H. W. (1989) Gasoline Consumption and Cities – A Reply, Journal of American Planning Association Vol. 53. Gordon, P. and Richardson, H.W. 1996. Employment Decentralization in U.S. Metropolitan Areas: Is Los Angeles an Outlier or Norm? Environment and Planning A 28. Hall, P. (1999) Cities in Civilisation. Hall, P. and Ward, C. (2000) Sociable Cities: The Legacy of Ebenezer Howard. Jenks, M., Burton, E. and Williams, K. (1997) The Compact City: A Sustainable Urban Form? LeGates, R. and Stout, F. (1996) The City Reader. Llewelyn-Davies for English Partnerships (2000) The Urban Design Compendium. Llewelyn-Davies for NRPF and ODPM (2002) Going to Town: Improving Town Centre Access. Llewelyn-Davies for DfT and ODPM (2003) Transport and City Competitiveness. Llewelyn-Davies for TfL (2003) London Plan Sub-Regional Development Frameworks: East Sub-Region. Llewelyn-Davies for ODPM (as yet unpublished) Transport and Sustainable Access. Llewelyn-Davies for ODPM (as yet unpublished) Relationship Between Transport and Development in the Thames Gateway. Newman, J. and Kenworthy, P. (1999) Sustainability and Cities. Owens, S. (1986) Energy Planning and Urban Form. TfL and GLA (2002) The Mayor’s Transport Strategy. This paper reports on a research study on sub-regional development frameworks in London undertaken by Llewelyn-Davies for Transport for London. Many thanks also to Sejal Ram and Jeff Nottage who provided invaluable research assistance during the study. i Using 1991 LATS data and main mode trips originating in the sub-region. ii For further discussion see Llewelyn-Davies for DfT (2003) Transport and City Competitiveness iii See Hall, P. and Ward, C. (2000) for more extensive discussion iv The techniques measure local accessibility/accessibility to the network (PTAL) and network accessibility/accessibility through the network (CAPITAL or LTS)