Embed Size (px)
Citation preview
City of Palo Alto (ID # 12099)
Utilities Advisory Commission Staff Report
Report Type: New Business Meeting Date: 6/2/2021
City of Palo Alto Page 1
Summary Title: Utilities Quarterly Report for Q1&2 FY21 (Info)
Title: Informational Update on the Utilities Quarterly Report for Q1&2 of FY 2021
From: City Manager
Lead Department: Utilities
Recommendation This report is for information only. No action is required.
Executive Summary This is an update on water, gas, electric, wastewater collection and fiber utilities, efficiency programs, legislative/regulatory issues, utility-related capital improvement programs, operations reliability impact measures and a utility financial summary, and is for the City Council’s information. This update Attachment A (Linked Report) has been prepared to keep the Council and Utilities Advisory Commission apprised of the major issues that are facing the water, gas, electric, wastewater collection and fiber utilities.
Items of special interest for Q1 and Q2 FY 2021 include:
• COVID-19 Impacts: The COVID-19 shelter in place order affected utility loads in Q1 and Q2of FY 2020:o Electric utility loads for CY 2020 were 7% to 10% below the average of CY 2018 and CY
2019 loads. Lower electric loads were accounted for in FY 2021 and FY 2022 financialforecasts. (page 6)
o Gas utility loads for CY 2020 were as much as 18% below the average of CY 2018 and CY2019 sales in April of 2020 and continued to be low through the summer. But byDecember 2020 loads had returned to normal levels. (page 9)
o Water loads (demands) for CY 2020 roughly matched the average of CY 2018 and CY2019 sales. (page 14)
o Q1 and Q2 Wastewater sales revenues were nearly 5% lower than projected in the FY2021 Financial Plan. This reflects lower sales revenue from the commercial sector.These sales declines have been accounted for in the FY 2022 Financial Plan forecast.(page 28)
Staff: Eric Wong
CITY OF
PALO ALTO

City of Palo Alto Page 2
• Electric Utility: As of the end of Q2 FY 2021 the electric utility reserves are forecasted to decline by $6.3 million by end of FY 2021. This is compared to the reserve forecast decline of $4.0 million projected in the FY 2021 Financial Plan. While retail sales are higher than forecasted, and wholesale sales revenue is also higher than forecasted due to the REC exchange program, this is offset by increased expenses from low hydroelectric supply, increased administrative expenses, and increased spending on electric vehicle programs. Precipitation has been roughly 50% of average for the year in the watersheds associated with the City’s hydroelectric projects, so hydroelectric generation in calendar year 2021 will be lower than average. However, these effects will be felt more in FY 2022 than in FY 2021, and are taken into account in the forecast. (See pages 3, 25-26, 28)
• Gas Utility: Gas supply prices were higher than forecasted in November and December of 2021, and are expected to be above forecasts through the end of the fiscal year. These cost increases are passed through to customers through a variable gas commodity rate that adjusts monthly, but are offset in part by a discounted gas agreement that has reduced customer gas supply costs by about $354,000 through Q2 FY 2021. Aside from these commodity cost increases, gas utility costs are roughly in line with the FY 2021 Financial Forecast (See pages 9-11, 26, 28)
• Water Utility: Precipitation has been low in California in the 2020-2021 water year. Total storage in the Hetch Hetchy system was 83% full as of March 29, 2021. Precipitation is roughly 50% of average, though snowpack was more favorable. Water consumption and costs for FY 2021 are forecasted to be roughly 5% higher than forecasted in the FY 2021 Financial Plan because forecasted sales decreases from the pandemic shelter in place orders have not materialized. The small commercial sector saw some declines, but water use did not decline for residential use and commercial irrigation. However, the cost and revenue impacts from higher sales have been offset by declines in other revenues, including interest income, and cost savings due to delays in a project to install additional backup generators at water pumping stations. As a result, costs and revenues roughly align with the FY 2021 Financial Forecast. (See pages 11-14, 26-27, 28)
• Wastewater Utility: The Wastewater Collection Utility is projected to realize a $2.9 million surplus rather than $200,000 loss, as projected in the FY 2021 Financial Plan. Sales are lower due to lower non-residential sewer charges (these are based on non-residential water use, so decreases in water consumption can lead to decreases in sewer revenues). However, costs were significantly lower due to one-time treatment cost reductions and collection system CIP deferrals. These surplus funds are expected to be expended on deferred CIP. (See pages 27, 28)
• Fiber Utility: Magellan Advisors has been hired to perform a four-phase Fiber Network Expansion assessment. In Q4 2020, work commenced on phase one of a high-level design to support internal City services including Advanced Metering Infrastructure (AMI), Supervisory Control and Data Acquisition (SCADA) Systems, and wireless communication. Phase three of the project to develop a fiber-to-the-home (FTTH) business case and high-level design was accelerated and is being worked on in parallel with phase one tasks. Preliminary findings and recommendations of the fiber network expansion and FTTH business case were made available to the Utilities Advisory Commission on April 21, 2021.
City of Palo Alto Page 3
Fiber utility revenue for FY 2021 is projected to be $430,000 (7%) lower than forecasted in the FY 2021 Financial Plan due to the impact of business closures related to the economic impacts of the pandemic. Fiber capital expenses are projected to be $900,000 lower than expected, primarily due to delays in the Fiber Optic System Rebuild, which is on hold pending the results of the Fiber to the Home study. As a result, the Fiber Optic Utility’s net position is expected to increase, with a total of $34.7 million in reserves expected at year-end. (See pages 27, 28)
• Customer Programs: The report contains descriptions of efficiency programs (pages 16-17), innovation programs (page 19), and sustainability programs (pages 20-25). Many energy efficiency programs were suspended due to shelter in place orders. Programs that can be executed outdoors or on commercial properties in compliance with County health orders have been restarted, but programs that require entering residences remain suspended. In the meantime CPAU is providing tips and tricks electronically to residents and businesses on reducing energy and water use while sheltering in place or during a suspension of business. CPAU has also launched a virtual program delivery option for its Home Efficiency Genie service, and recently expanded it to low-income customers. The City also continues to promote its multi-family and workplace EV charger programs, which are summarized on pages 22-24.
• Communications: A digest of major outreach efforts is provided on pages 17-18, including outreach related to building and vehicle electrification and water conservation.
• Legislative and Regulatory: Major legislative and regulatory items are summarized on pages 25-26, with a more detailed list of potential bills in Attachment B (Linked Document).
Attachments:
• Attachment A: Quarterly Report for Q1 and Q2
• Attachment B: Bill Sample
Utilities Quarterly Update First & Second Quarters of Fiscal Year 2021
June 2021
Attachment A
Quarterly Update for First & Second Quarters of FY 2021 June 2021
i
Utilities Quarterly Update Table of Contents
i. Electricity ................................................................................................................... 3 Electric Supplies ............................................................................................................................................ 3 Electric Budget and Portfolio Performance .................................................................................................. 7
ii. Natural Gas................................................................................................................. 9 Gas Supply ..................................................................................................................................................... 9 Gas Budget and Portfolio Performance ...................................................................................................... 10
iii. Water ....................................................................................................................... 11 Water Availability ........................................................................................................................................ 11 Water Use ................................................................................................................................................... 13 Water Budget and Portfolio Performance .................................................................................................. 14
iv. Fiber Optics .............................................................................................................. 15 Commercial Dark Fiber Service: .................................................................................................................. 15 Phased Fiber Optics Expansion: .................................................................................................................. 15
v. Efficiency Programs .................................................................................................. 16 Events and Workshops ................................................................................................................................ 17
vi. Communications Highlights ....................................................................................... 17
vii. Innovation and Pilot Programs .................................................................................. 19 Program for Emerging Technologies ........................................................................................................... 19
viii. Sustainability ............................................................................................................ 20 Electrification .............................................................................................................................................. 20 Electric Vehicles .......................................................................................................................................... 21
ix. Legislative and Regulatory Issues .............................................................................. 24 State legislation ........................................................................................................................................... 24 State regulatory proceedings ...................................................................................................................... 26
x. Utility Financial Summary ......................................................................................... 26 Electric Utility Overview .............................................................................................................................. 27 Gas Utility Overview.................................................................................................................................... 27 Wastewater Collection Utility Overview ..................................................................................................... 28 Fiber Optic Utility Overview ........................................................................................................................ 28 Residential Bill Comparisons ....................................................................................................................... 31
Quarterly Update for First & Second Quarters of FY 2021 June 2021
ii
List of Figures Figure 1: Electric Supply Resource Actual and Projection, 2020 to 2022 ..................................................... 4 Figure 2: CY 2021 Monthly Electric Supply Resource Projection .................................................................. 5 Figure 3: Northern California Peak Electric Prices ........................................................................................ 6 Figure 4: CY 2020 Electric Load, compared with CY 2018-19 Average ......................................................... 6 Figure 5: FY 2021 Electric Load and Resource Balance ................................................................................. 7 Figure 6: FY 2021 Electric Market Prices ....................................................................................................... 8 Figure 7: CY 2020 Gas Usage, compared with CY 2018-19 Average ............................................................. 9 Figure 8: CPAU’s Gas Commodity Rates ...................................................................................................... 9 Figure 9: FY 2020 Natural Gas Volumes and Costs .................................................................................... 10 Figure 10: FY 2020 Natural Gas Prices ........................................................................................................ 11 Figure 11: California Drought Monitor ....................................................................................................... 11 Figure 12: Hetch Hetchy Snowpack ............................................................................................................ 12 Figure 13: SFPUC Water Deliveries ............................................................................................................. 13 Figure 14: Potable Water Use ..................................................................................................................... 13 Figure 15: CY 2020 Water Usage, compared with CY 2018-19 Average ..................................................... 14 Figure 16: FY 2020 Water Volumes and Costs ............................................................................................ 14 Figure 17: History of LCFS Credits Earned Per Quarter ............................................................................... 21
List of Tables Table 1: FY 2021 Electric Load and Generation Compared to Budget Projections ....................................... 7 Table 2: FY 2021 Electric Utility Supply Cost Summary ................................................................................ 8 Table 3: Status to date of all applications to the Program for Emerging Technologies ............................. 19 Table 4: Notable EV Charger Projects Completed ...................................................................................... 22 Table 5: Utilities Financials, FY 2021 Projections ........................................................................................ 30 Table 6: Operations Reserves, FY 2021 Q2 ................................................................................................. 30 Table 7: Residential Electric Bill Comparison .............................................................................................. 31 Table 8: Residential Natural Gas Bill Comparison ....................................................................................... 31 Table 9: Residential Water Bill Comparison ................................................................................................ 31 Table 10: Residential Wastewater Collection (Sewer) Bill Comparison ..................................................... 31 Table 11: Median Residential Overall Bill Comparison ............................................................................... 32 Table 12: FY 2021 Q1&2 Reserve Report from the City’s Financial System ............................................... 33

Quarterly Update for First & Second Quarters of FY 2021 June 2021
3
i. Electricity Electric Supplies
Western Area Power Administration (Western) Issues Water year 20211 is shaping up to be the state’s second consecutive dry year, with significantly below-average precipitation levels (with cumulative precipitation at 50% of average for April 29). For Q1 of FY 2021, Western delivered 121 GWh to the City (82% of long-term average levels, which is about 88% of the amount that was delivered in Q1 of FY 2020). For Q2 of FY 2021, Western delivered 33 GWh to the City (75% of long-term average levels, which is about 48% the amount that was delivered in Q2 of FY 2020). Based on the April 2021 WAPA forecast, Western is projected to generate a total of 285 GWh (71% of long-term average supply levels, and 72% of FY 2020 levels) in FY 2021. Calaveras Hydroelectric Project Issues New Spicer Meadow Reservoir (NSMR) storage as of February 28, 2021 was 64,116 ac-ft. The historical average storage level for NSMR for the end of February is 75,340 ac-ft. Water year 2021 has been dry so far, with cumulative precipitation currently at about 51% of average for this date, tracking just above the levels of 2015 (a serious drought year). For Q1 FY 2021, the Calaveras project generated 17 GWh (44% of long-term average levels, which is about 48% of the amount that was delivered in Q1 of FY 2020). For Q2 FY 2021, the Calaveras project generated 9 GWh (55% of long-term average levels, which is about 47% of the amount that was delivered in Q2 of FY 2020). Based on the March 2021 forecast, for FY 2021 as a whole, Calaveras is projected to generate 62 GWh (53% of long-term average levels, and 60% of FY 2020 supply levels). Electric Load and Resource Balance Palo Alto’s electric supply portfolio for CY 2020 saw significant surplus energy positions in some periods, largely owing to the previous year being an above-average hydro year. However, there were other periods that saw deficit positions as well. The City sold, on a forward basis, nearly 58 GWh of surplus energy during Q1 of FY 2021 (Jul 2020 – Sep 2020) to manage the surplus position, while it purchased about 60 GWh in Q2 of FY 2021 (Oct 2020 – Dec 2020) to manage the deficit position. The City also purchased, on a forward basis, about 35 GWh of surplus energy during Q3 of FY 2021 (Jan 2021 – Mar 2021) to manage the deficit position. In addition, due to the availability of surplus carbon neutral supplies, as well as the updated Carbon Neutral Plan that was approved by Palo Alto City Council in August 2020, the City is authorized to sell all Bucket 1 RECs exceeding the amount required to comply with the City's RPS requirements, and to replace them with Bucket 3 REC purchases. Accordingly, the City sold Bucket 1 RPS resources and purchased Bucket 3 RECs in Q1-Q2 of FY 2021. While this plan causes the City’s RPS levels to decrease, the City still remains in compliance with 1 A “water year” is defined as the 12-month period from October 1 through September 30. “Water year 2021” refers to the period from October 1, 2020 through September 30, 2021.

Quarterly Update for First & Second Quarters of FY 2021 June 2021
4
its RPS requirements. RPS compliance is based on aggregate RPS procurement over the entire compliance period (2017-2020), which ensures that the City is still in compliance with the state RPS requirements. Also, since these transactions were index-based (plus a REC premium), they did not impact the City’s energy price exposure (and are therefore not reflected in the load-resource balance charts shown in Figure 1 and Figure 2 below). CY 2021 has been a second consecutive dry year after CY 2020. The overall electric supply resources are 15% deficit to load in CY 2021 including forward market transactions (and 2% deficit to load excluding forward market transactions). The overall electric supply resources are projected to be equal to load for CY 2022. Figure 2 below shows the monthly load and resource balance for CY 2021. As mentioned earlier, some of the monthly surplus/deficit positions were sold/purchased as generic energy ahead of time, while the rest were settled in the spot market through the California Independent System Operator. Figure 1: Electric Supply Resource Actual and Projection, 2020 to 2022 (as of April 14, 2021)
19' S\lrph,1,s 15% Di!!ftat o,ti:Jlt1rnlus IZl Net Pl:a,nned 1,200
Mar~et Transaction,
1.000 Net Committed
Marltiet Tran5att1Qll'ls
800 So >ar
600
j Wind
"' ~00 ,111 ~ i;: II;
II Landfill G a:s: "' 200
0 calavera~
•100
West,ern
-400
i020 2021 2i022
cal~ncl!ar 'fear
Quarterly Update for First & Second Quarters of FY 2021 June 2021
5
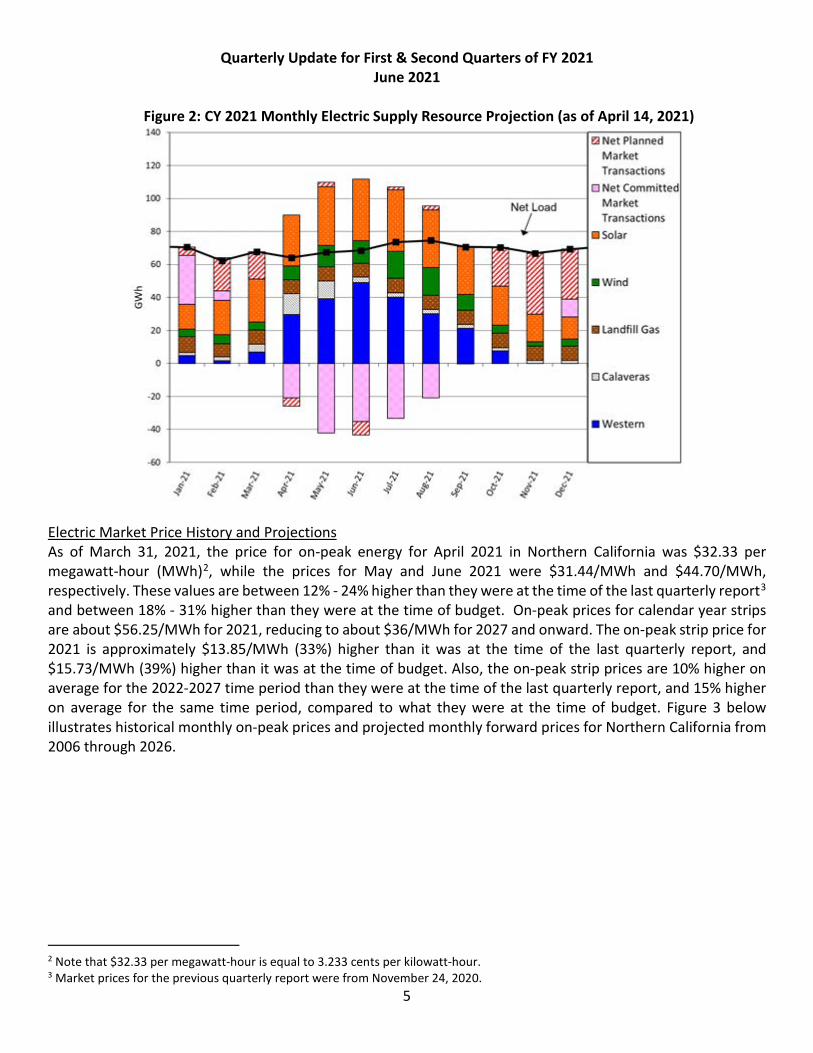
Figure 2: CY 2021 Monthly Electric Supply Resource Projection (as of April 14, 2021)
Electric Market Price History and Projections As of March 31, 2021, the price for on-peak energy for April 2021 in Northern California was $32.33 per megawatt-hour (MWh)2, while the prices for May and June 2021 were $31.44/MWh and $44.70/MWh, respectively. These values are between 12% - 24% higher than they were at the time of the last quarterly report3 and between 18% - 31% higher than they were at the time of budget. On-peak prices for calendar year strips are about $56.25/MWh for 2021, reducing to about $36/MWh for 2027 and onward. The on-peak strip price for 2021 is approximately $13.85/MWh (33%) higher than it was at the time of the last quarterly report, and $15.73/MWh (39%) higher than it was at the time of budget. Also, the on-peak strip prices are 10% higher on average for the 2022-2027 time period than they were at the time of the last quarterly report, and 15% higher on average for the same time period, compared to what they were at the time of budget. Figure 3 below illustrates historical monthly on-peak prices and projected monthly forward prices for Northern California from 2006 through 2026.
2 Note that $32.33 per megawatt-hour is equal to 3.233 cents per kilowatt-hour. 3 Market prices for the previous quarterly report were from November 24, 2020.
~
i
.140 ---------------------------------------.......
no +--------------------------------
100 +-----------~
80
60
~
20
0
-20
-«I
E.l Net Pia,rmed
Market Transaction$
Net Committed Market ransactions
Snlar
-'60 ....._ ______________________________________ ____.
Quarterly Update for First & Second Quarters of FY 2021 June 2021
6
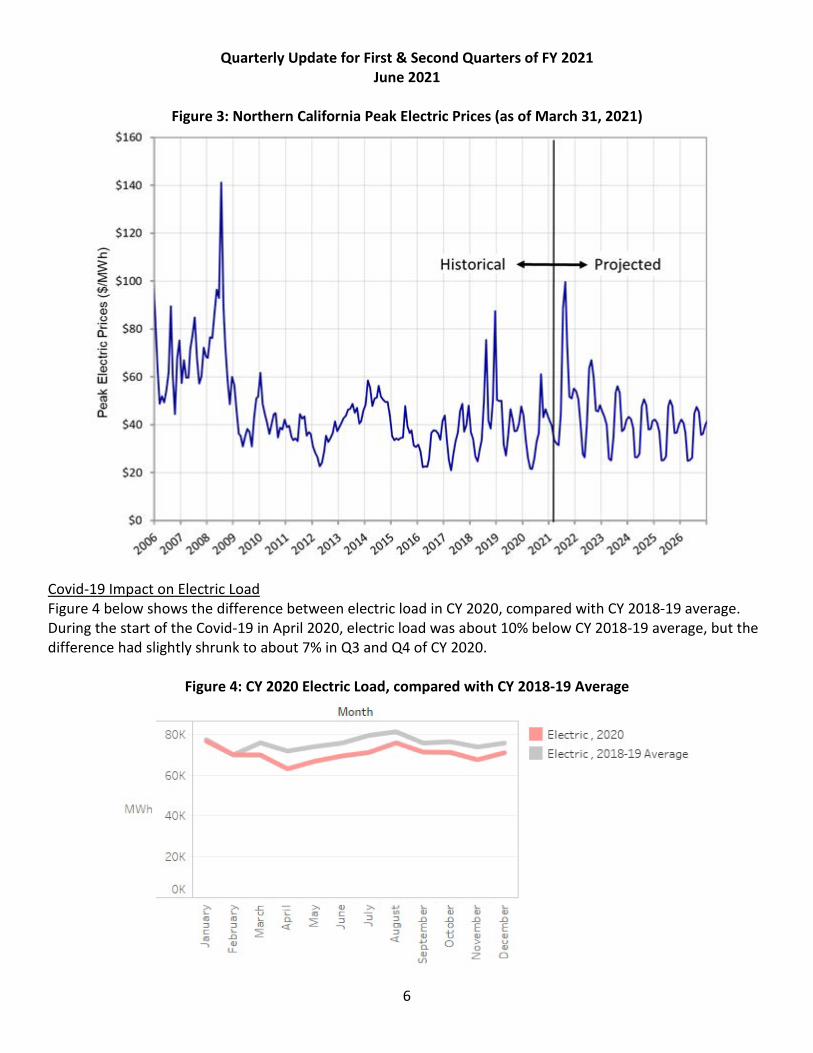
Figure 3: Northern California Peak Electric Prices (as of March 31, 2021)
Covid-19 Impact on Electric Load Figure 4 below shows the difference between electric load in CY 2020, compared with CY 2018-19 average. During the start of the Covid-19 in April 2020, electric load was about 10% below CY 2018-19 average, but the difference had slightly shrunk to about 7% in Q3 and Q4 of CY 2020.
Figure 4: CY 2020 Electric Load, compared with CY 2018-19 Average
$160 ...... ------------------------.....----------
$140
$120
HI isto.ri ca I +---+-+ Projected
$0 --..-----------------....... -----------.~·-----..---....--# #,, ~ ~ # ~ ~ # ~ ~ ~ ~ # ~ # ~ ~, ~ 'V '\: -i.: · -v '\: ·1,; 'VT'\: 'V ~ 'V· ri; '\: 'V '): ' ,:'VT 'V 'V
80K
60K
MWh 40K
20K
OK ::,.,. ... Ill :::J C Ill -,
::,.,. ..c ... u Ill ... :::J Ill ... ~ .n ii
LL
Mont h
::,.,. 41 ::,.,. i: 113 C (l_
~ :::J :::J
-=.r -. -.
Electric , 2020
Electric , 20 8-19 Average
.µ ... ... ... ... u, 41 41 41 41 :::J ..[l ..[l ..[l .Ll Ol E 0 E E :::J tl -=i 41 41 ii
.µ 0 ;;,, u 0. D ii
41 LEI z 0
Quarterly Update for First & Second Quarters of FY 2021 June 2021
7
Electric Budget and Portfolio Performance
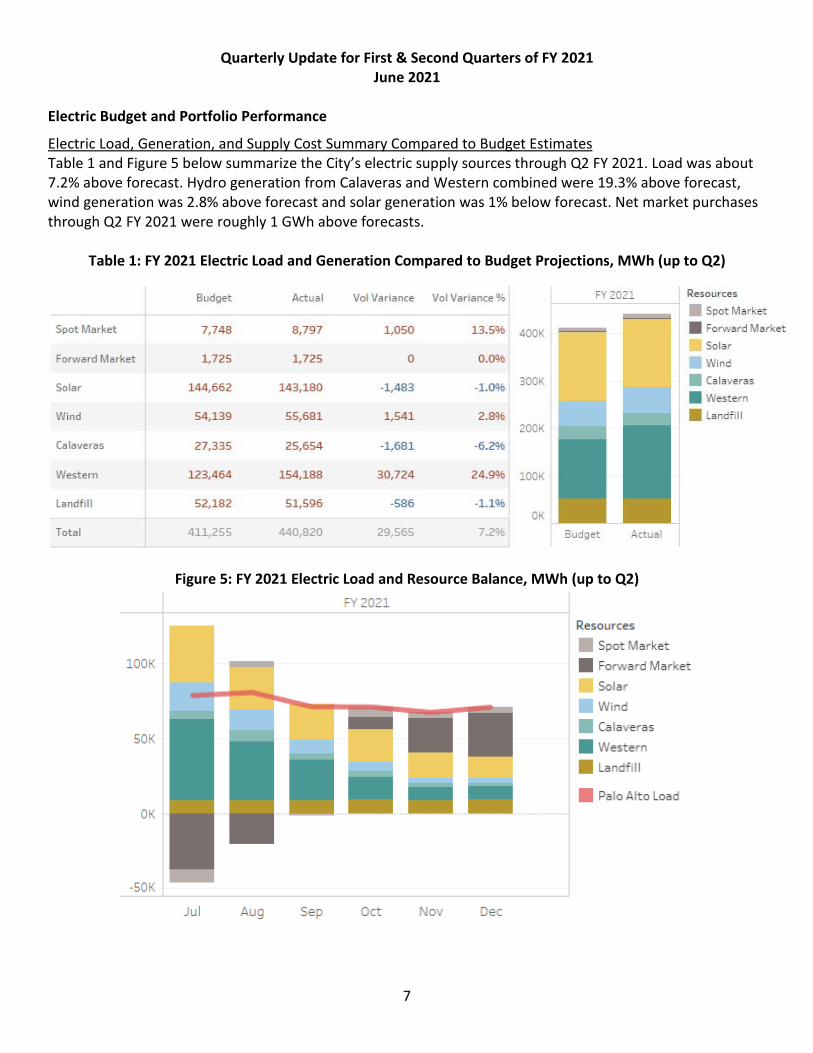
Electric Load, Generation, and Supply Cost Summary Compared to Budget Estimates Table 1 and Figure 5 below summarize the City’s electric supply sources through Q2 FY 2021. Load was about 7.2% above forecast. Hydro generation from Calaveras and Western combined were 19.3% above forecast, wind generation was 2.8% above forecast and solar generation was 1% below forecast. Net market purchases through Q2 FY 2021 were roughly 1 GWh above forecasts.
Table 1: FY 2021 Electric Load and Generation Compared to Budget Projections, MWh (up to Q2)
Figure 5: FY 2021 Electric Load and Resource Balance, MWh (up to Q2)
Budget Actua l Vol Variance
Spot Ma rket 7,748 8,797 1,050
forward Market 1,725 1,725 0
Solar 144,662 143,180 -1,483
Wind 54,139 55,681 1,541
Calaveras 27,335 25,654 -1,681
Western 123,464 154,188 30,724
landfil l 52,182 51,596 -586
Total 411,255 440,820 29,565
-='(2021
_QOK
SOK
OK
-50K
Jul Aug Se Oct
Vol Variance%
13.5% 400K
0.0%
-1 .0% 300K
2.8% 200K
-6 .2%
24.9% '.!.00K
-1.1% OK
7.2%
Nov ec
FY 202'.!. Reso urces
Spo Market
Forward Mar et
Solar
Win.
Ca laveras
Western
La ndfi ll
Budget Actual
Reso urces
Spo- M arket
Forward M ar et
Sollar
Win Ca laveras
Wester
Land il l
Pa lo Alt o oa d
Quarterly Update for First & Second Quarters of FY 2021 June 2021
8
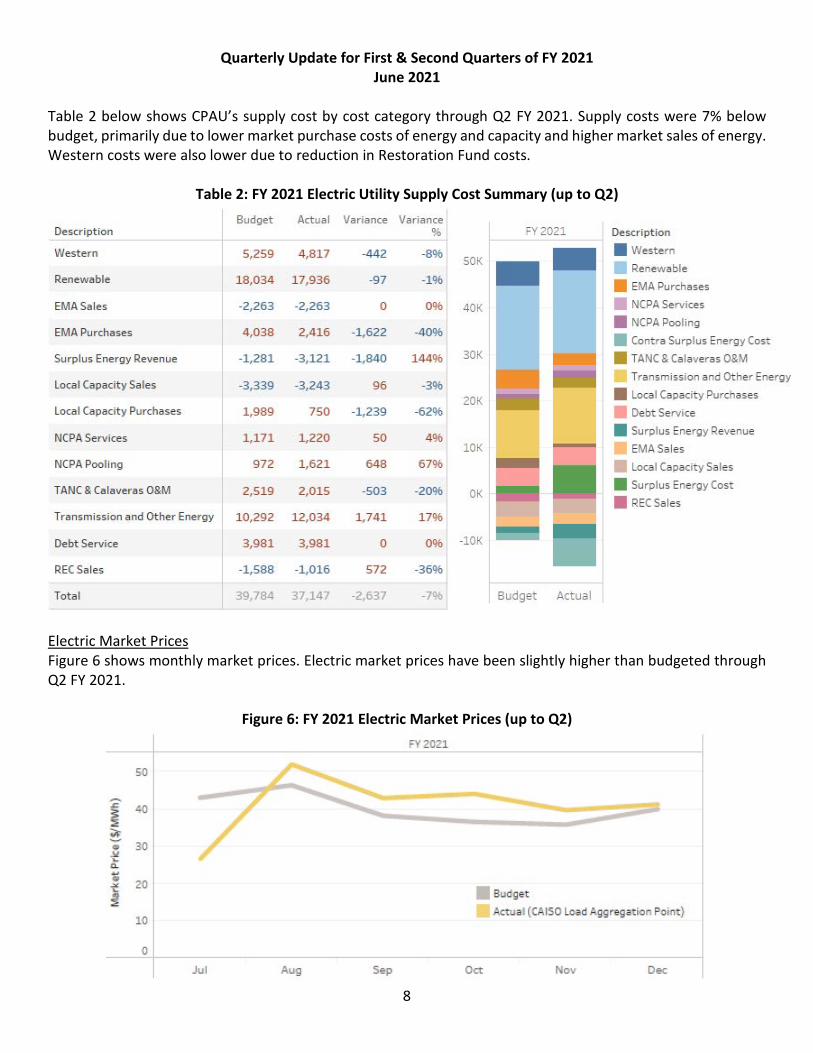
Table 2 below shows CPAU’s supply cost by cost category through Q2 FY 2021. Supply costs were 7% below budget, primarily due to lower market purchase costs of energy and capacity and higher market sales of energy. Western costs were also lower due to reduction in Restoration Fund costs.
Table 2: FY 2021 Electric Utility Supply Cost Summary (up to Q2)
Electric Market Prices Figure 6 shows monthly market prices. Electric market prices have been slightly higher than budgeted through Q2 FY 2021.
Figure 6: FY 2021 Electric Market Prices (up to Q2)
~ "'''' Actual Variance Varia nce
so.I Description % - y 2021
Western 5,259 4,817 -442 -8% Re e wa ble
Rene wable 18,034 17,936 -97 -1% EMA Purchas.es
EMA Sales -2,263 -2,263 0 0% 40K NC PA Services
EMA Pu rchases 4,038 2,416 -1,622 -40% NC PA Pooling
Contra Surplus Energy Cost
Su rp lus Energy Revenue -1,281 -3,121 -1,840 144% 30K TANC & Ca lavera s O&M
Loca l Capacity Sa les -3,339 -3,243 96 -3% Tra nsmis.sion a n.d Ot her Ene rgy
Lo cal Capacity Pure ases 20K
l ocal Capacity Purchases 1,989 750 -1,239 -62% De bt Service
NCPA Services 1,171 1,220 so 4% Surplu s Energy Reve nu e
10K EMA Sales NCPA Pooling 972 1,621 648 67% Local Capacity Sa les
TA NC & Calaveras O&M 2,51.9 2,015 -503 -20% OK Surplus Energy Cost
RECSa les Trans miss ion a nd Othe r Energy 10,292 1.2,034 1,741 17%
Debt Service 3,981 3,981 0 0% -lOK
REC Sa les -1,588 -1,016 572 -36%
I Budge Tot al 39,784 37,147 -2,637 -7% Actual
2021
so
-.E:
I ~
3-0 ..!.! L
a_ .., .Y. 20 11:.
~ 10
Bu get
al (CAISO L -d Agg regatio Point
0
j I Aug Sep Oct ov Dec
Quarterly Update for First & Second Quarters of FY 2021 June 2021
9
ii. Natural Gas Gas Supply
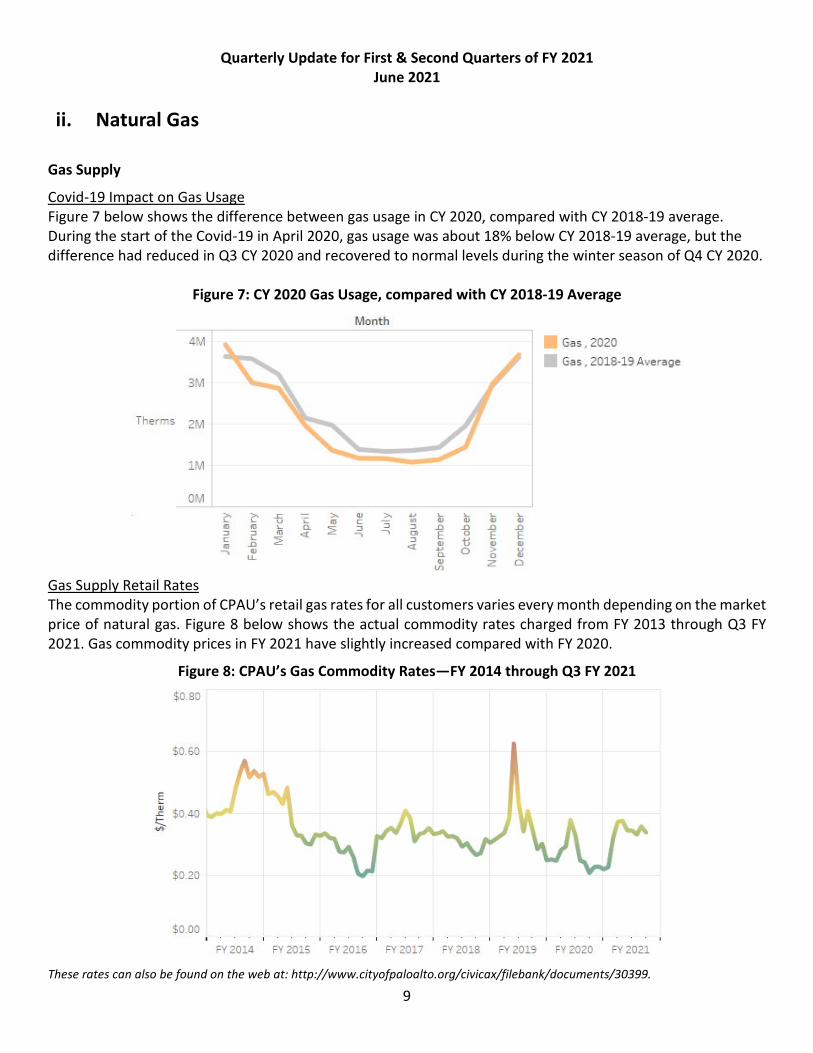
Covid-19 Impact on Gas Usage Figure 7 below shows the difference between gas usage in CY 2020, compared with CY 2018-19 average. During the start of the Covid-19 in April 2020, gas usage was about 18% below CY 2018-19 average, but the difference had reduced in Q3 CY 2020 and recovered to normal levels during the winter season of Q4 CY 2020.
Figure 7: CY 2020 Gas Usage, compared with CY 2018-19 Average
Gas Supply Retail Rates The commodity portion of CPAU’s retail gas rates for all customers varies every month depending on the market price of natural gas. Figure 8 below shows the actual commodity rates charged from FY 2013 through Q3 FY 2021. Gas commodity prices in FY 2021 have slightly increased compared with FY 2020.
Figure 8: CPAU’s Gas Commodity Rates—FY 2014 through Q3 FY 2021
These rates can also be found on the web at: http://www.cityofpaloalto.org/civicax/filebank/documents/30399.
Month
Gas , 2020
Gas , 2018-19' Average
3M
Ther s 2M
M
0~ '.>, '.>, ..c '.>, a, :,., .µ ... ... ... ... ... ... u .:: 113 C u, a, a, a, a, 113 113 ... u. 2c :::J 3 :::J _o _o _o .0 :::J :::J 113 -=.I -. ....... a, E 0 E E C ... 2: :::J ~ 113 .0 •::;[
a, a, a, a, .µ 0 :;. u .....,
C. 0 a, LL a, z 0
Lfl
$0.80
$0.60
§ $0.40 -
$0.20
$0.00
FY 20::..4 FY 20 5 FY 2016 FY 2017 FY 2018 FY 20::..9 FY 2020 FY 202_
Quarterly Update for First & Second Quarters of FY 2021 June 2021
10
Muni Gas Prepay On September 15, 2014, Council adopted Resolution #9451 authorizing the City’s participation in a natural gas purchase from Municipal Gas Acquisition and Supply Corporation (MuniGas) for the City’s entire retail gas load for a period of at least 10 years. The MuniGas transaction includes a mechanism for municipal utilities to utilize their tax-exempt status to achieve a discount on the market price of gas. The program has cumulatively reduced about $354K in commodity costs for customers through Q2 of FY 2021. Value of CPAU’s Share of Redwood Pipeline Capacity The Redwood pipeline allows the City to buy gas at the receipt point of Malin, Oregon and transport the gas to “PG&E Citygate”, which is normally a higher priced receipt point. The City’s share of the Redwood pipeline was a net benefit to the Gas Utility of $276K through Q2 FY 2021. This is the difference between the cumulative value of Redwood capacity of $933K (the difference of the monthly index prices at the ends of the Redwood pipeline in Malin, Oregon and PG&E Citygate) and the cumulative transportation cost of using the Redwood pipeline of $657K. Gas Budget and Portfolio Performance
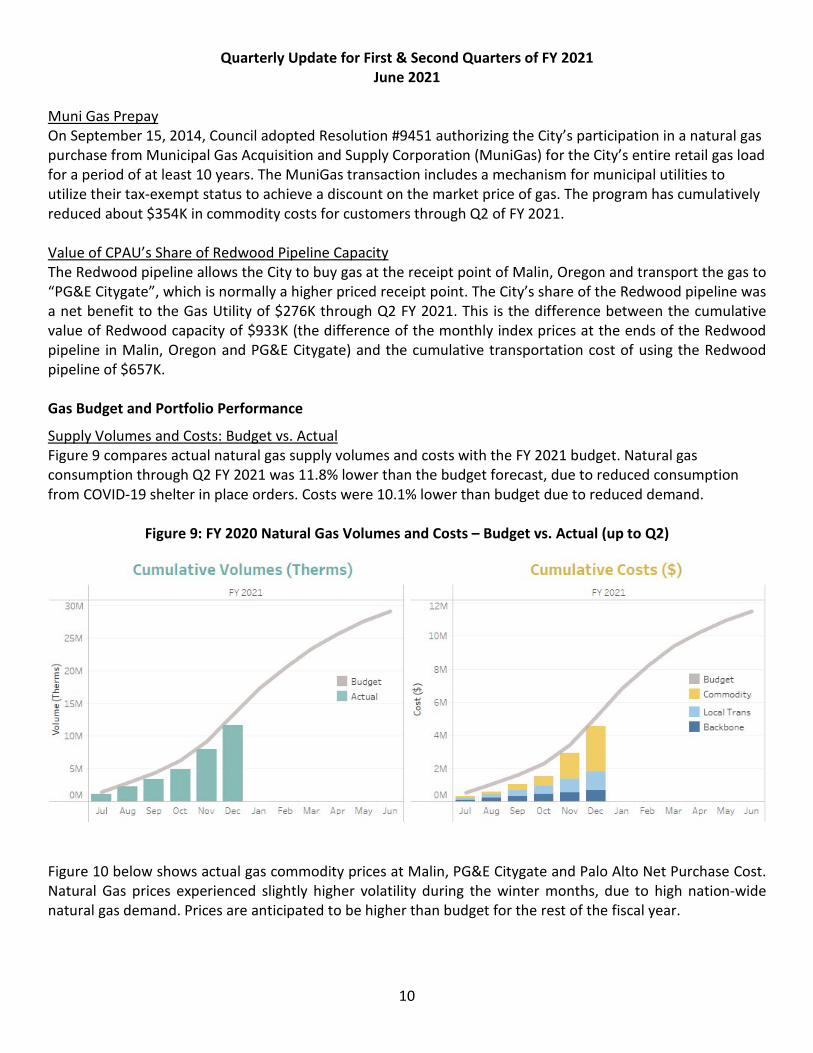
Supply Volumes and Costs: Budget vs. Actual Figure 9 compares actual natural gas supply volumes and costs with the FY 2021 budget. Natural gas consumption through Q2 FY 2021 was 11.8% lower than the budget forecast, due to reduced consumption from COVID-19 shelter in place orders. Costs were 10.1% lower than budget due to reduced demand.
Figure 9: FY 2020 Natural Gas Volumes and Costs – Budget vs. Actual (up to Q2)
Figure 10 below shows actual gas commodity prices at Malin, PG&E Citygate and Palo Alto Net Purchase Cost. Natural Gas prices experienced slightly higher volatility during the winter months, due to high nation-wide natural gas demand. Prices are anticipated to be higher than budget for the rest of the fiscal year.
30M
25M
,;- 20M E "' 1 1sM E :,
0 :, lOM 1
SM
OM
Cumulative Volumes (Therms) =y 2021
Budget
Actual
Jul Aug Sep Oct Nov Dec an Fet. Mar Apr May Jun
12M
10M
SM ,.._ -e t: GM 0 u
4M
2M
OM
Cumulative Costs ($) : y 2021
Budget
Commodity
Local Tra ns
Bae t>one
Quarterly Update for First & Second Quarters of FY 2021 June 2021
11
Figure 10: FY 2020 Natural Gas Prices ($/MMBtu) - Malin, Citygate and Palo Alto Net Purchase Costs (up to Q2)
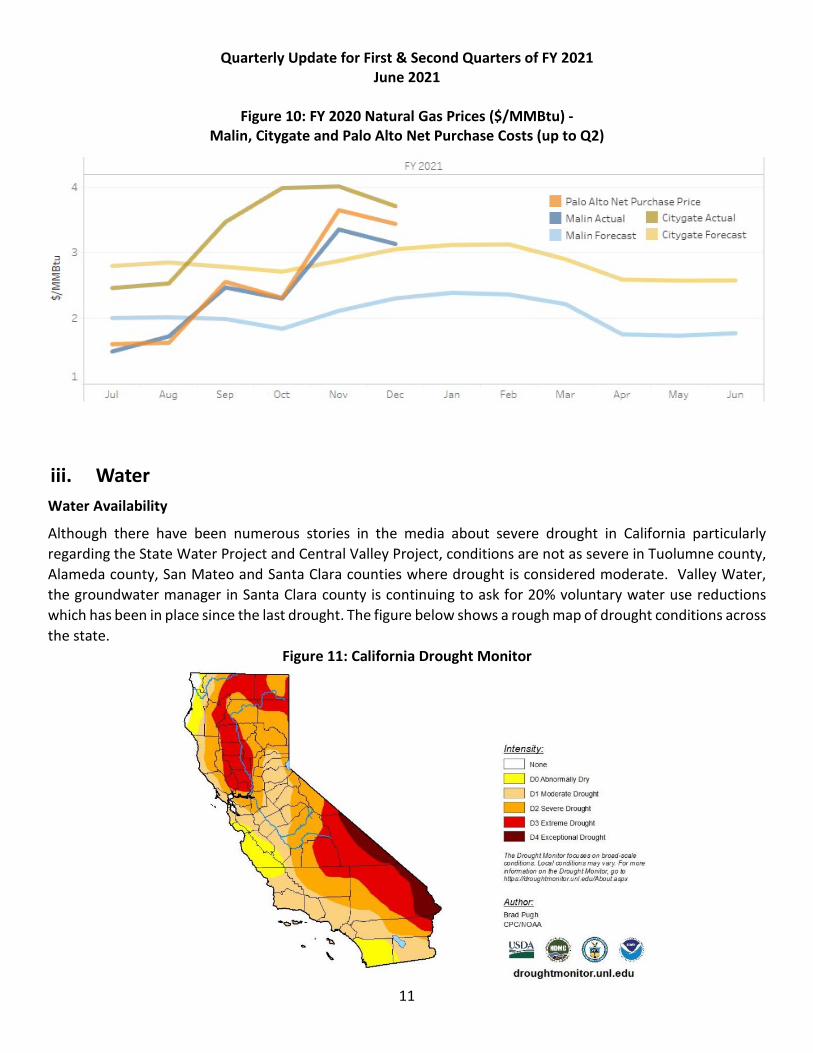
iii. Water Water Availability
Although there have been numerous stories in the media about severe drought in California particularly regarding the State Water Project and Central Valley Project, conditions are not as severe in Tuolumne county, Alameda county, San Mateo and Santa Clara counties where drought is considered moderate. Valley Water, the groundwater manager in Santa Clara county is continuing to ask for 20% voluntary water use reductions which has been in place since the last drought. The figure below shows a rough map of drought conditions across the state.
Figure 11: California Drought Monitor
cy 2021
3
2
Ju l Aug Se p Oa: Nov Dec a
Pa lo Alto Net Pu rchase rice
Mal in Actua l Citygate Actual
Mal in orecast
Mar
Intensity:
D None
D DOAl>normallyDry
D D1 Moderate Drougtt
D2 severe Drought
- D3 Extreme Drought
- D4 Exceptional Drought
Apr
The Drought Monitor fowses on broad-scale cond1hons. Local condltJons may vary For more nformat,on on 6te Drooght Monitor, go lo httpdldroughtmonitor.unl. edu/About.a::px
Author: Brad Pugh CPC/NOAA
USDA -droughtmonitor.unl .edu
Citygate Forecast
May Ju
Quarterly Update for First & Second Quarters of FY 2021 June 2021
12
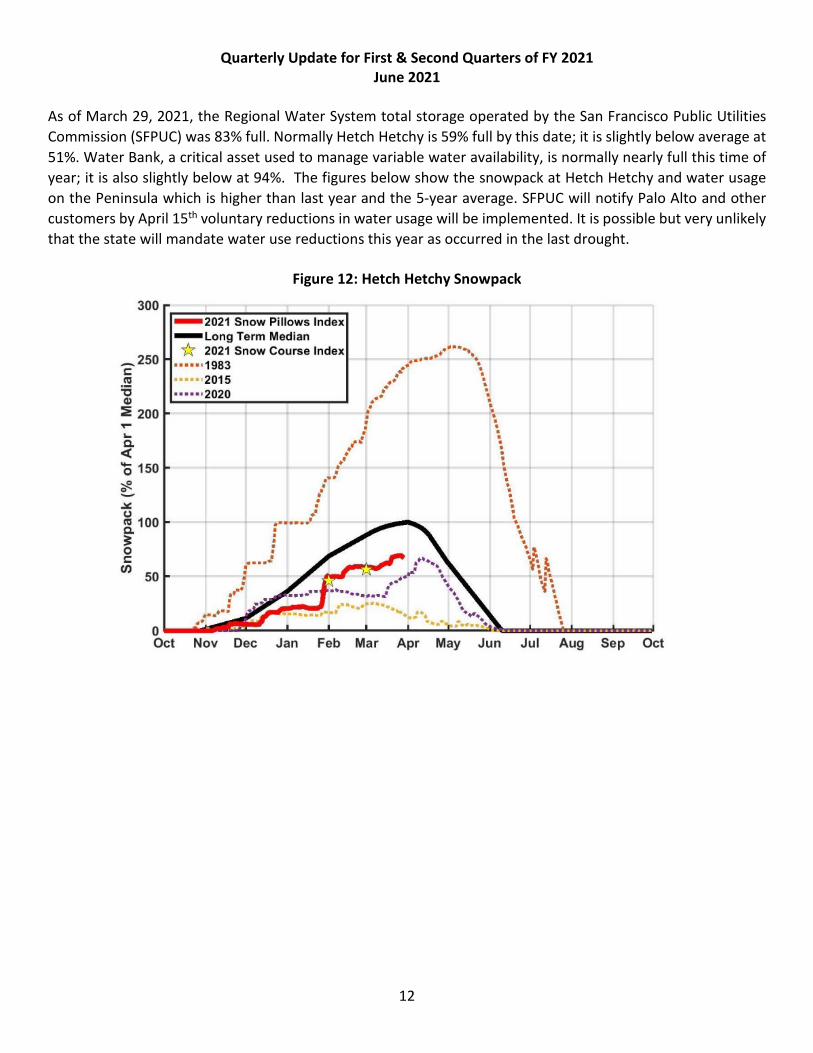
As of March 29, 2021, the Regional Water System total storage operated by the San Francisco Public Utilities Commission (SFPUC) was 83% full. Normally Hetch Hetchy is 59% full by this date; it is slightly below average at 51%. Water Bank, a critical asset used to manage variable water availability, is normally nearly full this time of year; it is also slightly below at 94%. The figures below show the snowpack at Hetch Hetchy and water usage on the Peninsula which is higher than last year and the 5-year average. SFPUC will notify Palo Alto and other customers by April 15th voluntary reductions in water usage will be implemented. It is possible but very unlikely that the state will mandate water use reductions this year as occurred in the last drought.
Figure 12: Hetch Hetchy Snowpack
300
_250 C: ctJ :a Cl)
:!: 200
""" '-c. < 0 150
~ -.:.:: (.)
ct1 100 C. ~ 0 C:
VJ 50
- 2021 Snow Pillows Index -Long Term Median * 2021 Snow Course Index
· ···•• 1983 ••••• 2015 ····• •2020
Nov Dec Jan Feb Mar Apr May Jun Jul Aug Sep Oct
Quarterly Update for First & Second Quarters of FY 2021 June 2021
13
Figure 13: SFPUC Water Deliveries
Water Supply
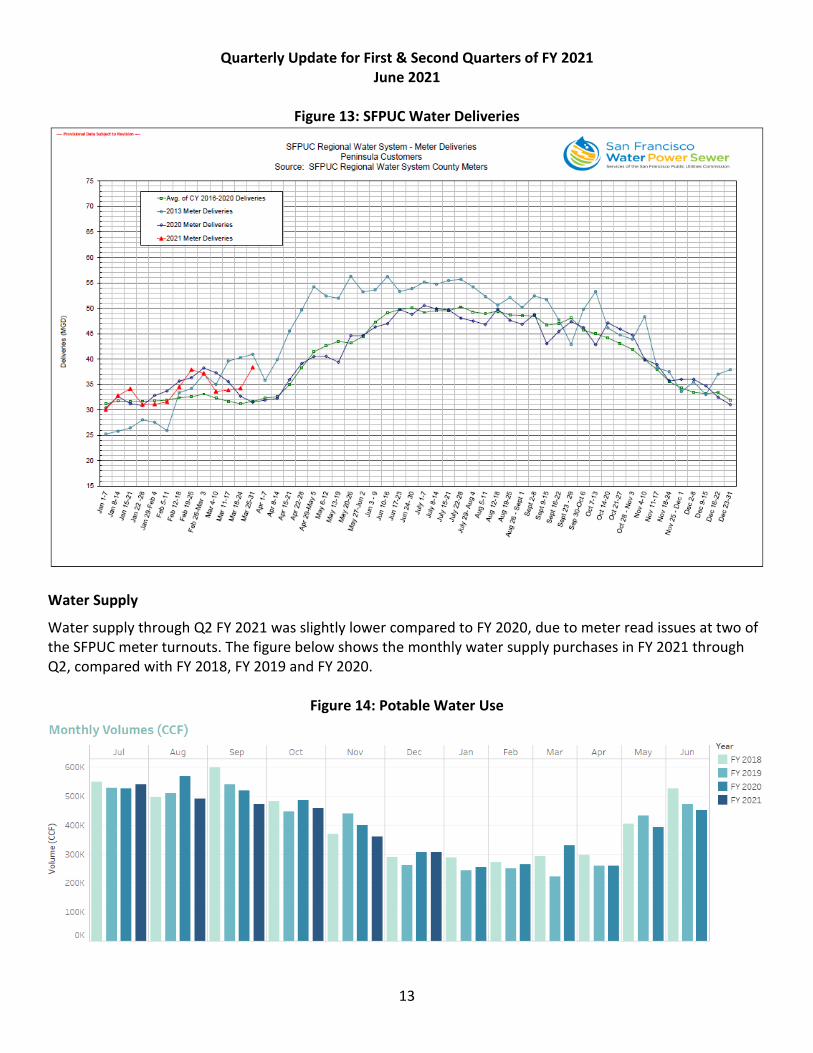
Water supply through Q2 FY 2021 was slightly lower compared to FY 2020, due to meter read issues at two of the SFPUC meter turnouts. The figure below shows the monthly water supply purchases in FY 2021 through Q2, compared with FY 2018, FY 2019 and FY 2020.
Figure 14: Potable Water Use
s ,:, ~ .. I
75
70
65
60
55
50
45
40
35
30
25
20
15
- Awg. of CY 20 16-2020 Oeliveries
-+-2013 M e tH Deliverie-s
~ 2020 M ei:e,r Deli>Jeries
...,_202 1 M ete,r Deliveries
Monthly Volumes (CCF)
Jul Aug Sep
6OOK
SOOK
~ 4OOK u ~ ., E 3OOK Cl
0 ::,
ZOOK
10OK
OK
SFPUC Reg·onal Water System - Meter Deliveries Peninsula Customers
Source: SFPUC Regional Water System County Meters
Oct Nov Dec Jan ... Feb Mar
San Francisco Water Power Sewer
Apr May Jun Yea r
FY 2018
FY 2019
FY 2020
FY 2021
Quarterly Update for First & Second Quarters of FY 2021 June 2021
14
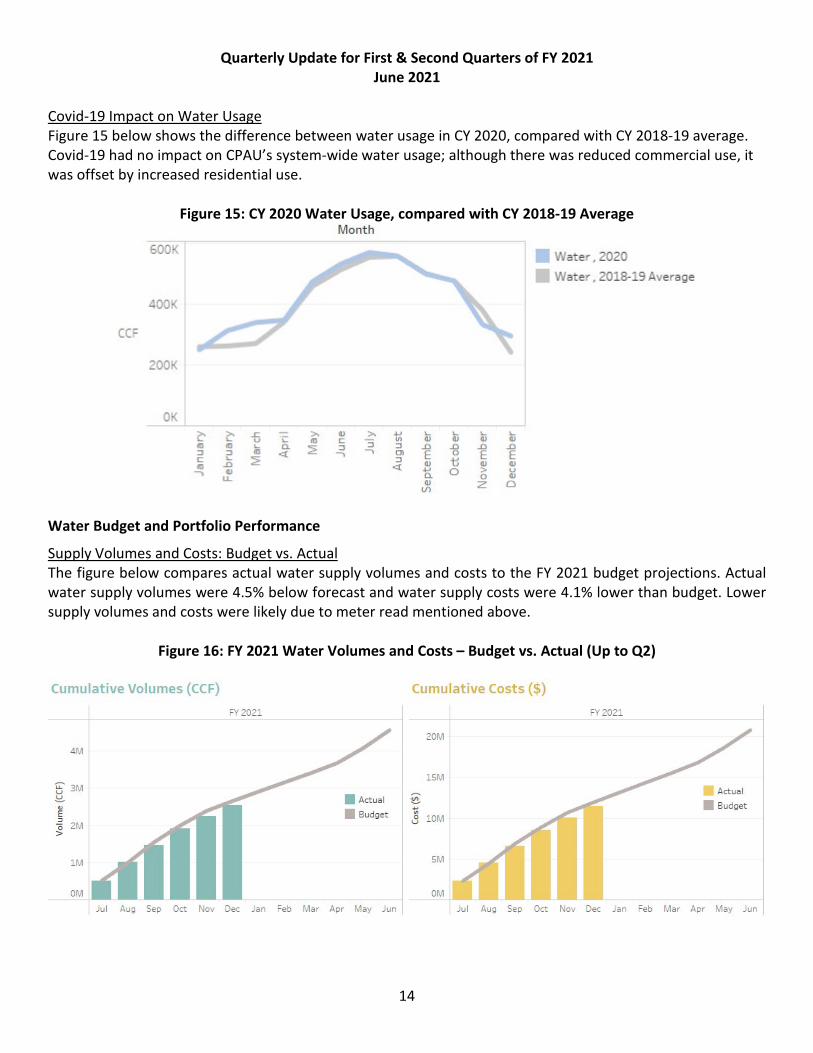
Covid-19 Impact on Water Usage Figure 15 below shows the difference between water usage in CY 2020, compared with CY 2018-19 average. Covid-19 had no impact on CPAU’s system-wide water usage; although there was reduced commercial use, it was offset by increased residential use.
Figure 15: CY 2020 Water Usage, compared with CY 2018-19 Average
Water Budget and Portfolio Performance
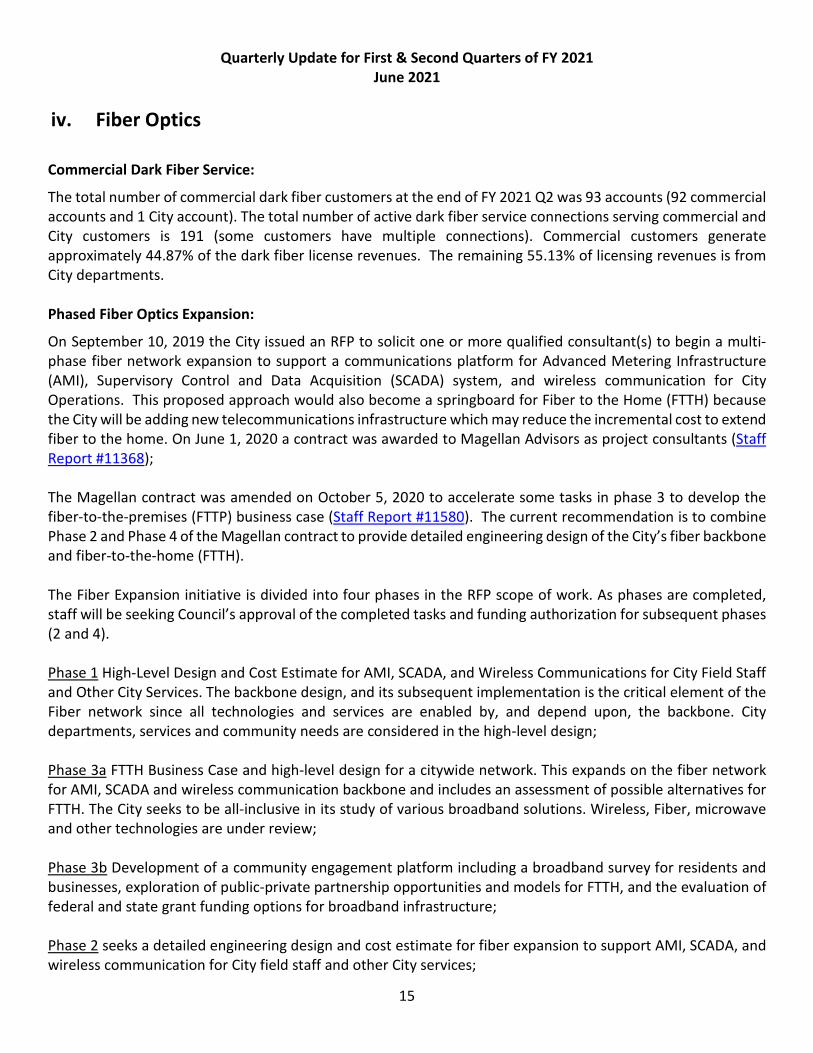
Supply Volumes and Costs: Budget vs. Actual The figure below compares actual water supply volumes and costs to the FY 2021 budget projections. Actual water supply volumes were 4.5% below forecast and water supply costs were 4.1% lower than budget. Lower supply volumes and costs were likely due to meter read mentioned above.
Figure 16: FY 2021 Water Volumes and Costs – Budget vs. Actual (Up to Q2)
Mont h
600K
400K
CCF
ZOOK
OK ;;.. ;;.. .r: >, ill >, .µ ..... ..... u ·;:: Ill C "' Ill Ill ..... CL ~ :::J :::J :::J ::J :::J Ill -:1 2. -, ...... !JI C ..... ~ :::J Ill .n <:l: -, ill
LL
Cumulative Volumes CCF)
FY 202:'..
4M
iL' 3M u ~ Actual
" E ::; Budget 0 2M >
1M
OM
Jul Aug Sep Oct Nov Dec Jan Feb Mar Apr May Jun
..... ..... ill ill
.n .0 E D
-H ill .µ 0 CL ill
LFl
..... ill
.0
E ill ~~
D z
..... ill
.0
E ill u Ill a
W ater, 2020
Water, 2018-_9Aversg e
Cumulative Costs($)
~
e t:
20M
15M
8 lOM
SM
OM
FY 202:'..
Actual
Budget
Jul Aug Sep Oct Nov Dec Jan Feb Mar Apr May Jun
Quarterly Update for First & Second Quarters of FY 2021 June 2021
15
iv. Fiber Optics Commercial Dark Fiber Service:
The total number of commercial dark fiber customers at the end of FY 2021 Q2 was 93 accounts (92 commercial accounts and 1 City account). The total number of active dark fiber service connections serving commercial and City customers is 191 (some customers have multiple connections). Commercial customers generate approximately 44.87% of the dark fiber license revenues. The remaining 55.13% of licensing revenues is from City departments. Phased Fiber Optics Expansion:
On September 10, 2019 the City issued an RFP to solicit one or more qualified consultant(s) to begin a multi-phase fiber network expansion to support a communications platform for Advanced Metering Infrastructure (AMI), Supervisory Control and Data Acquisition (SCADA) system, and wireless communication for City Operations. This proposed approach would also become a springboard for Fiber to the Home (FTTH) because the City will be adding new telecommunications infrastructure which may reduce the incremental cost to extend fiber to the home. On June 1, 2020 a contract was awarded to Magellan Advisors as project consultants (Staff Report #11368); The Magellan contract was amended on October 5, 2020 to accelerate some tasks in phase 3 to develop the fiber-to-the-premises (FTTP) business case (Staff Report #11580). The current recommendation is to combine Phase 2 and Phase 4 of the Magellan contract to provide detailed engineering design of the City’s fiber backbone and fiber-to-the-home (FTTH). The Fiber Expansion initiative is divided into four phases in the RFP scope of work. As phases are completed, staff will be seeking Council’s approval of the completed tasks and funding authorization for subsequent phases (2 and 4). Phase 1 High-Level Design and Cost Estimate for AMI, SCADA, and Wireless Communications for City Field Staff and Other City Services. The backbone design, and its subsequent implementation is the critical element of the Fiber network since all technologies and services are enabled by, and depend upon, the backbone. City departments, services and community needs are considered in the high-level design; Phase 3a FTTH Business Case and high-level design for a citywide network. This expands on the fiber network for AMI, SCADA and wireless communication backbone and includes an assessment of possible alternatives for FTTH. The City seeks to be all-inclusive in its study of various broadband solutions. Wireless, Fiber, microwave and other technologies are under review; Phase 3b Development of a community engagement platform including a broadband survey for residents and businesses, exploration of public-private partnership opportunities and models for FTTH, and the evaluation of federal and state grant funding options for broadband infrastructure; Phase 2 seeks a detailed engineering design and cost estimate for fiber expansion to support AMI, SCADA, and wireless communication for City field staff and other City services;
Quarterly Update for First & Second Quarters of FY 2021 June 2021
16
Phase 4 seeks a detailed engineering design, cost estimate and a phased deployment approach for FTTH. Staff presented the FTTH business case to the UAC on April 21, 2021. Magellan has completed the high-level design of the FTTH network and a broadband market assessment by small neighborhoods. Magellan has also developed cost and revenue models and different deployment scenarios ranging in costs from $22 - $28 million for the fiber backbone expansion and an additional $86 - $98 million for FTTH, depending on whether there is a public-private partnership and on the number of premises passed during the initial deployment.
v. Efficiency Programs Saving Energy and Water While Sheltering in Place – Staff is committed to finding additional ways to innovate and expand energy and water related programs in the shelter in place environment. Recognizing that unprecedented numbers of people are working and studying from home and will likely experience increased costs on their utility bills, the City have been sending e-mails and running a social media campaign to share tips and tricks for saving energy and water and making the home environment more comfortable. View these tips online at https://www.cityofpaloalto.org/Departments/Utilities/Residential/Home-Efficiency-Genie/Efficiency-Tips and follow the City in social media with the hashtags #WePowerOn #PaloAltoProud and #PublicPower. Energy & Water Efficiency Workshops Many public events and workshops were canceled this spring in response to the COVID-19 pandemic. The City’s partners at the Bay Area Water Supply and Conservation Agency (BAWSCA) are offering virtual landscape workshops so residents can learn how to save water and improve the sustainability of your landscape from the comfort of home. Palo Alto residents and businesses can take advantage of landscaping programs through the City’s cost-sharing partnership with Valley Water at https://www.valleywater.org/saving-water/rebates-surveys The Home Efficiency Genie program will be continuing with a webinar series, started in the summer of 2020, with an informative evening on May 4 2021 covering the many aspects of preparing a home for spring and summer conditions by focusing on efficiency, comfort and health. Highlights include maintaining a comfortable and healthy home by improving the building envelope with insulation and air sealing. With impending fire seasons, the webinar will emphasize best practices for air sealing and adequate filtration to reduce the health risks associated with smoky outdoor conditions. With warmer temperatures approaching and more residents interested in adding air conditioning, an emphasis will be on the benefit of converting a gas fueled furnace to an efficient all electric heat pump that will add cooling to their home. With a year of lower annual rainfall, the City will provide guidance on water saving measures, especially with promoting the lawn replacement rebates offered through its partner Valley Water. Modifications to Utilities Programs In accordance with the County order lifting restrictions on construction activities, some energy efficiency projects are resuming. Examples of allowed activities include commercial energy efficiency projects, solar installations, EV charger installations, and other work that does not require staff or consultant visits inside occupied residential dwellings. The County’s construction protocols must be followed.
• Large projects in spaces over 20,000 feet of floor space require one set of protocols be followed: https://www.sccgov.org/sites/covid19/Documents/appendix-b-2-lg-project-04-29-2020.pdf
Quarterly Update for First & Second Quarters of FY 2021 June 2021
17
• Small project in spaces less than 20,000 square feet require a different set of protocols: https://www.sccgov.org/sites/covid19/Documents/appendix-b-1-sm-project-04-29-2020.pdf
Although all visits inside occupied residential dwellings are temporarily on hold, many Utilities programs have been modified to continue to provide value to the community. The Residential Energy Assistance Program (REAP) program has been unable to provide the usual in-home visits to offer direct install efficiency measures to REAP program participants since March of 2020 due to health and safety concerns associated with COVID-19. In order to provide no contact service to REAP customers, the City has arranged with its Home Efficiency Genie program provider CLEAResult to offer free over the phone efficiency advice, free self-install measures and free Genie virtual in-home visits. The Genie virtual assessment offers participants an innovative, smart-phone-based engagement platform with the Genie technician to virtually walk participants through their home offering live, interactive efficiency advice. Following the assessment, they are offered free efficiency measures like LED light bulbs, smart power strips and water saving devices delivered to their home. These virtual Genie services are initially being offered to approximately 100 REAP participants who have been unable to take advantage of the REAP in-home services since March 2020. Events and Workshops
For updates on future events and workshops, please visit cityofpaloalto.org/workshops.
vi. Communications Highlights This section summarizes communications highlights, updates on major campaigns and noteworthy events. Copies of ads and bill inserts are available online at cityofpaloalto.org/UTLbillinsert Current Communication and Outreach Activities Communicating Through Crises During COVID-19, heatwaves and wildfires, CPAU and other publicly owned electric utilities bolstered public outreach to assist customers during difficult times. California Municipal Utilities Association (CMUA) Water & Power Magazine published an article in the Winter 2021 Edition highlighting this enhanced communication effort. In a survey conducted last summer in the midst of multiple once-in-a generation crises, customers of California’s publicly owned electric utilities gave them high marks for the quality and relevance of their communications. Respondents also said those communications conveyed sincere empathy for those struggling because of the pandemic. In many dimensions, communications from California’s publicly owned electric utilities got higher marks from customers than those served by the state’s investor-owned utilities. POUs solidified their position among customers by communicating important material, by serving customers despite many staffing and other challenges, and by showing empathy. This was not an accident. Many publicly owned electric utilities quickly adapted their communications strategies to deal with the confluence of the pandemic, record-setting heat, the looming threat of brownouts and the constant risk of devastating wildfires. Read more here: https://www.cityofpaloalto.org/News-Articles/Utilities/Communicating-Through-Crises
Quarterly Update for First & Second Quarters of FY 2021 June 2021
18
The Switch is On CPAU is a member of the Building Decarbonization Coalition and helping fund a new Bay Area wide campaign about home electrification. The Switch Is On campaign offers information and resources to help residents who want to convert appliances and home energy use from natural gas to electricity. Palo Alto residents can take advantage of rebates from CPAU for upgrading appliances, such as heat pump water heaters. Visit cityofpaloalto.org/electrification for an overview about electrification and switchison.org to check out the resources available to residents in all communities. Water Conservation Showcase CPAU is a proud outreach partner of the 18th annual Water Conservation Showcase—a free virtual conference hosted each Tuesday in April, 2021. The showcase features dozens of sessions and speakers discussing major water issues of the day. Attendees will learn about scalable strategies and solutions to conserve one of Earth's most precious resources.
Drive-Clean-a-Thon Join us for an electric vehicle and electric bike Drive-Clean-a-Thon on Saturday, April 24 from 4-5pm. This event is organized by Drive Clean Bay Area with support from several climate-focused organizations, including CPAU. EV and e-bike experts will share unbiased expertise about how driving and biking electric can help save time, money, and the planet. This webinar is free. Sign up at cityofpaloalto.org/workshops
Valley Water Advanced Purification Treatment Plant Scoping Meeting On March 29, Valley Water hosted a public scoping meeting to discuss potential siting options for a new advanced purified water treatment plant. One location option is the former Los Altos Treatment plant site, located on San Antonio Road in Palo Alto. At this meeting, community members were presented with the opportunity to learn about the project, the planning process, and provide feedback related to environmental impacts that will be analyzed as part of the California Environmental Quality Act (CEQA). We will continue to share information with the UAC about the “Purified Water Project” as plans evolve.
Landscape Design 101 Workshop On March 23, CPAU hosted a free virtual workshop about how to design and create a sustainable, low-water use landscape. This event was coordinated in partnership with the Bay Area Water Supply and Conservation Agency (BAWSCA) and Valley Water. Attendees learned about the variety of free efficiency services and rebates available from CPAU and our partners in water conservation. More than 120 people attended the workshop, which is one of the best turnouts we have seen for an event of this type.
Upcoming events On May 4 and May 6 CPAU offers landscape sustainability and Home Efficiency Genie workshops. Details and registration are available at cityofpaloalto.org/workshops
Quarterly Update for First & Second Quarters of FY 2021 June 2021
19
vii. Innovation and Pilot Programs Program for Emerging Technologies
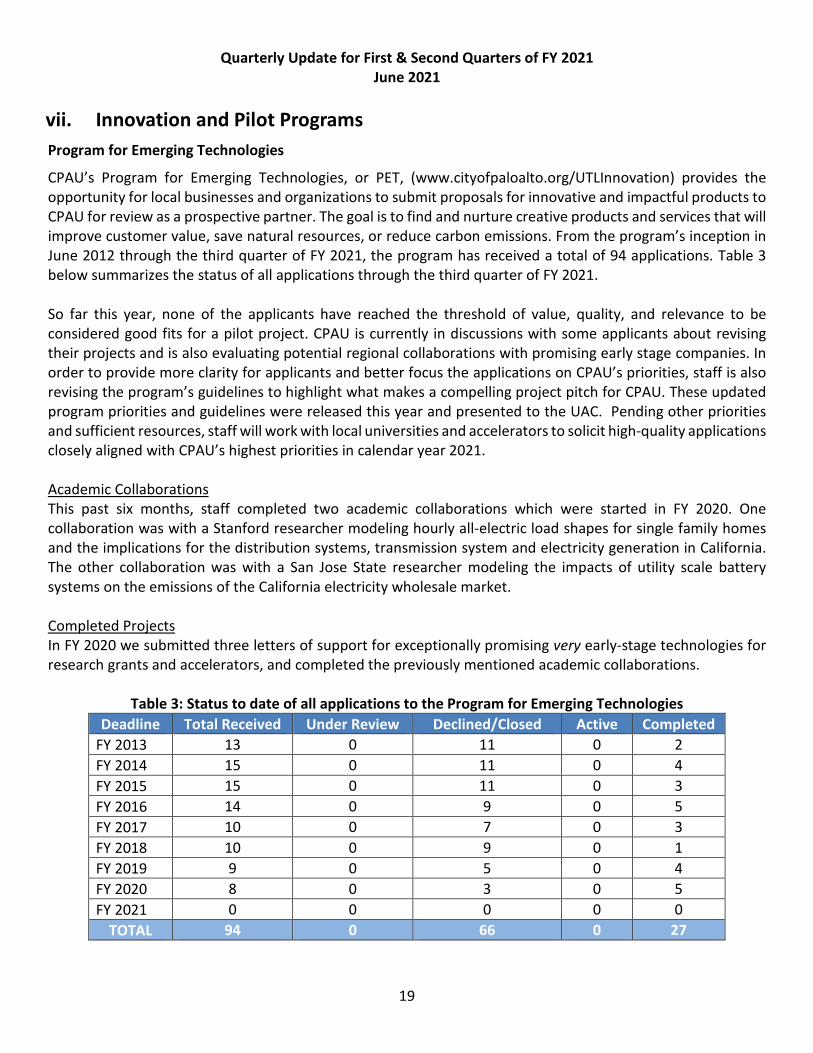
CPAU’s Program for Emerging Technologies, or PET, (www.cityofpaloalto.org/UTLInnovation) provides the opportunity for local businesses and organizations to submit proposals for innovative and impactful products to CPAU for review as a prospective partner. The goal is to find and nurture creative products and services that will improve customer value, save natural resources, or reduce carbon emissions. From the program’s inception in June 2012 through the third quarter of FY 2021, the program has received a total of 94 applications. Table 3 below summarizes the status of all applications through the third quarter of FY 2021. So far this year, none of the applicants have reached the threshold of value, quality, and relevance to be considered good fits for a pilot project. CPAU is currently in discussions with some applicants about revising their projects and is also evaluating potential regional collaborations with promising early stage companies. In order to provide more clarity for applicants and better focus the applications on CPAU’s priorities, staff is also revising the program’s guidelines to highlight what makes a compelling project pitch for CPAU. These updated program priorities and guidelines were released this year and presented to the UAC. Pending other priorities and sufficient resources, staff will work with local universities and accelerators to solicit high-quality applications closely aligned with CPAU’s highest priorities in calendar year 2021. Academic Collaborations This past six months, staff completed two academic collaborations which were started in FY 2020. One collaboration was with a Stanford researcher modeling hourly all-electric load shapes for single family homes and the implications for the distribution systems, transmission system and electricity generation in California. The other collaboration was with a San Jose State researcher modeling the impacts of utility scale battery systems on the emissions of the California electricity wholesale market. Completed Projects In FY 2020 we submitted three letters of support for exceptionally promising very early-stage technologies for research grants and accelerators, and completed the previously mentioned academic collaborations.
Table 3: Status to date of all applications to the Program for Emerging Technologies Deadline Total Received Under Review Declined/Closed Active Completed
FY 2013 13 0 11 0 2 FY 2014 15 0 11 0 4 FY 2015 15 0 11 0 3 FY 2016 14 0 9 0 5 FY 2017 10 0 7 0 3 FY 2018 10 0 9 0 1 FY 2019 9 0 5 0 4 FY 2020 8 0 3 0 5 FY 2021 0 0 0 0 0
TOTAL 94 0 66 0 27
Quarterly Update for First & Second Quarters of FY 2021 June 2021
20
viii. Sustainability Electrification
Heat Pump Water Heater Program The heat pump water heater program (HPWH) has experienced an increase in completed projects in 2020 compared to 2019. There were 7 completed HPWH projects in 2019 and in contrast, there were 24 projects completed in 2020. The increase may be due to several factors, one being that COVID-19 shelter in place orders have kept residents at home more and this may have increased awareness of their home’s water heater condition. There has also been an increased number of utility bill inserts and print advertising promoting the HPWH rebate, highlighting the need to be proactive in replacing a water heater before it fails. The HPWH continues to be promoted in our electrification and Home Efficiency Genie webinars. We expect this upward trend to continue into 2021 with 9 HPWH applicants as of March 31, 2021. Staff expects to explore how to revise this program to accelerate participation as part of the S/CAP update process. Multifamily Gas Furnace to Heat Pump Retrofit Pilot In 2018, CPAU was awarded a $300,000 grant by the Bay Area Air Quality Management District to implement a pilot to help retrofit existing in-unit gas wall furnaces with high efficiency heat pump systems at up to 3 affordable multifamily properties. The goal of the pilot is to identify the retrofit barriers, the energy savings and GHG reductions from such retrofits. As of September 2020, MidPen Housing has committed to retrofitting a minimum of 20 units at Page Mill Court. MidPen has selected a contractor and signed a contract with ASG Builders for the furnace replacement work through a competitive bid process. Due to COVID-19 shelter in place orders, the installation work had been deferred. MidPen has selected a contractor through a competitive solicitation process; construction is tentatively scheduled to begin in May 2021. The Switch is On Campaign CPAU has been collaborating with the Building Decarbonization Coalition and other utilities/CCAs on a consumer outreach campaign to support home electrification. The campaign is aptly named “The Switch is On.” CPAU officially launched a local campaign in mid-November. This will include digital ads on popular online platforms such as Google and Facebook and will leverage the city’s social media channels and e-newsletters. The digital ads will direct traffic to the website “switchison.org,” which provides comprehensive information on how to make the switch from natural gas to electric appliances for water heating, space heating/cooling, cooking, as well as barbeques, fireplaces and pool heating. The campaign will be actively promoted by Community Choice Aggregators (CCAs) in Northern California and will expand to the Southern California in spring 2021. Electrification Education and Outreach In the effort to expand building electrification education, CPAU collaborated with NCPA (Northern California Power Agency) and 15 other member agencies to issue an RFP for electrification education including workshops, online classes, electrification expo’s, virtual electrification audits and youth education. Proposals were submitted on September 10, 2020 and interviews and evaluations were conducted in October. Ten proposals were submitted, and 4 vendors have been selected. Contracting is expected to be completed by the end of CY2020.

Quarterly Update for First & Second Quarters of FY 2021 June 2021
21
Cool Blocks Electrification Initiative CPAU engaged the Empowerment Institute to conduct 3 focus groups comprised of existing Cool Block leaders and members to understand the perceived barriers to electrification and to gauge levels of interest in different program areas for homeowners and renters. The focus groups were conducted in September 2020, Based on the focus group findings, the Empowerment Institute recommended that CPAU align the all-electric home message with the City’s S/CAP goals, focus on the health and safety benefits of an all-electric home, provide tools and resources to residents to begin the home electrification journey, increase communications about the available services, and leverage resident support and expertise. The Empowerment Institute has also updated the Cool Block program curriculum to include home electrification actions. Electric Vehicles
LCFS Low Carbon Fuel Standard Program LCFS base credits are allocated by CARB to CPAU, based on the number EVs registered in Palo Alto, the estimated miles travelled and the difference in carbon intensity of transportation fuels and electricity. Additional credits were also allocated for fork-lifts but have now been discontinued. Credits are also allocated based on CNG dispensed and electricity dispensed at city owned EV chargers. Due to the pandemic, the credits earned declined in CY Q2 2020 and are slowly recovering.
Figure 17: History of LCFS Credits Earned Per Quarter (Up to Q4 CY2020)
LCFS Credits Earned Per Quarter By Sector 3,500
- Credits Based on Estimated EVsRegistered in PabAlto 3,000
- er edits Based on Electricity Dipen9:CI f rom City ow ned EVSEs
2,500 - Credits Based on Electricity Dipen9:CI f rom City Electric For kl" s
- c redits Based on CNG Dispensed at MSC
2,000 - TotalCrecf sGained
1,500
1,000
Quarterly Update for First & Second Quarters of FY 2021 June 2021
22
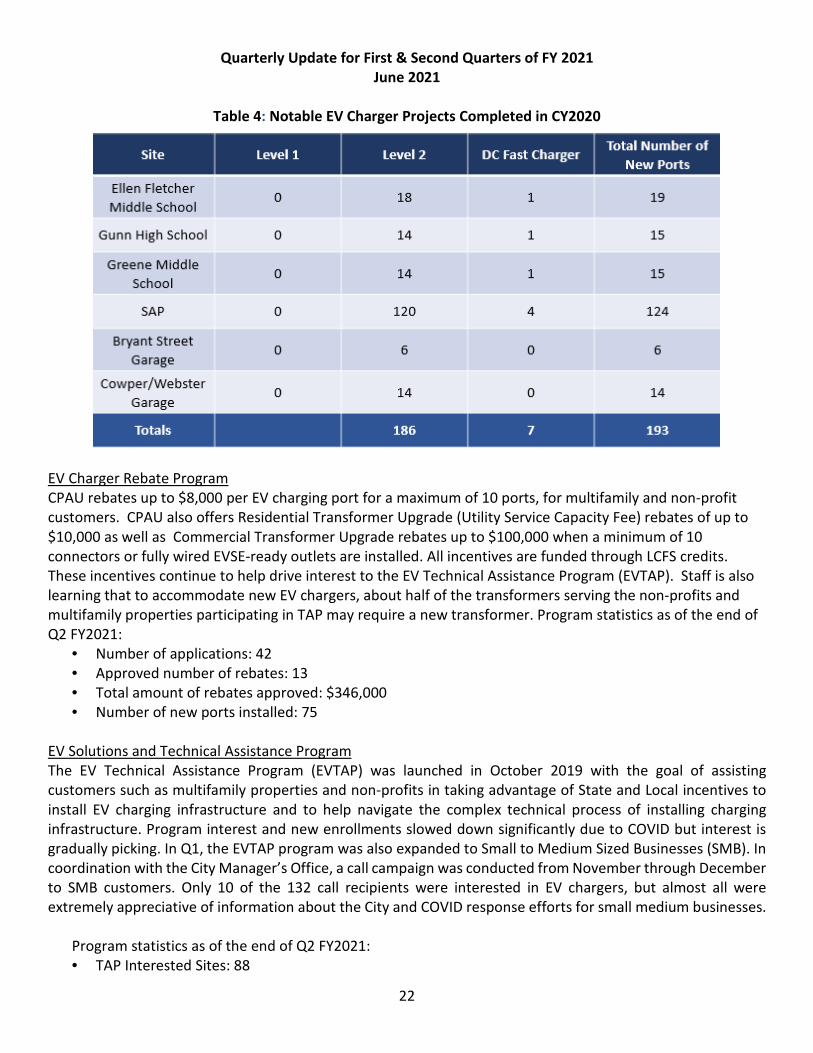
Table 4: Notable EV Charger Projects Completed in CY2020
EV Charger Rebate Program CPAU rebates up to $8,000 per EV charging port for a maximum of 10 ports, for multifamily and non-profit customers. CPAU also offers Residential Transformer Upgrade (Utility Service Capacity Fee) rebates of up to $10,000 as well as Commercial Transformer Upgrade rebates up to $100,000 when a minimum of 10 connectors or fully wired EVSE-ready outlets are installed. All incentives are funded through LCFS credits. These incentives continue to help drive interest to the EV Technical Assistance Program (EVTAP). Staff is also learning that to accommodate new EV chargers, about half of the transformers serving the non-profits and multifamily properties participating in TAP may require a new transformer. Program statistics as of the end of Q2 FY2021:
• Number of applications: 42 • Approved number of rebates: 13 • Total amount of rebates approved: $346,000 • Number of new ports installed: 75
EV Solutions and Technical Assistance Program The EV Technical Assistance Program (EVTAP) was launched in October 2019 with the goal of assisting customers such as multifamily properties and non-profits in taking advantage of State and Local incentives to install EV charging infrastructure and to help navigate the complex technical process of installing charging infrastructure. Program interest and new enrollments slowed down significantly due to COVID but interest is gradually picking. In Q1, the EVTAP program was also expanded to Small to Medium Sized Businesses (SMB). In coordination with the City Manager’s Office, a call campaign was conducted from November through December to SMB customers. Only 10 of the 132 call recipients were interested in EV chargers, but almost all were extremely appreciative of information about the City and COVID response efforts for small medium businesses.
Program statistics as of the end of Q2 FY2021: • TAP Interested Sites: 88
Site I Level 1 level2 t.. I Tota[ Number of DC Fast Cuarger
New Ports
El I en Fletcher 0 18 1 19
Middle School
Gunn High School 0 14- 1 15
Greene M iddle
Schoo l 0 14- 1 15
SAP 0 120 4 1 24
Bryant Street 0 6 0 6
Garage
Cow per /Web st,er 0 14- 0 14
Garage -------
186 , I 193
Quarterly Update for First & Second Quarters of FY 2021 June 2021
23
• Number of Technical Site Visits Complete: 24 • Number of Final Reports Presented: 28 • Proposed total number of new EV Charging Ports: 226 @ 16 Multifamily Properties, 9 Places of
Worship and 1 Non-Profit • Number of Permit Applications Submitted: 2 @ 2 Multifamily sites for 6 new EV Charging Ports • Number of new ports installed: 0
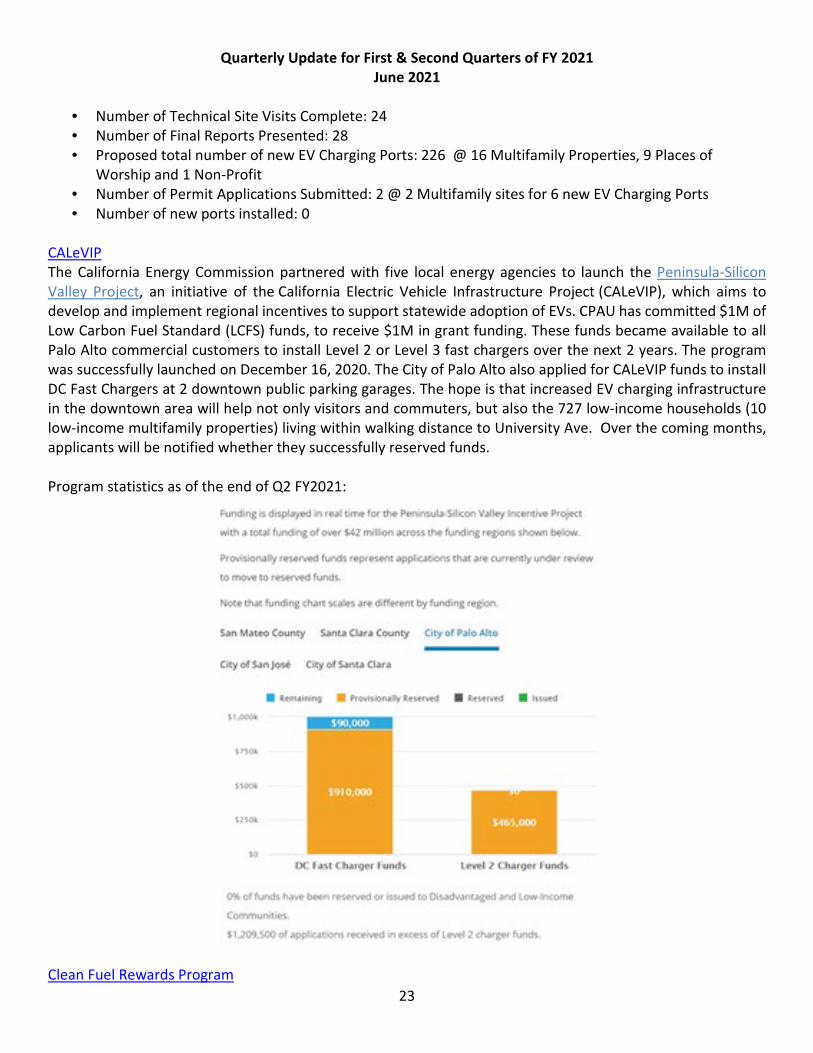
CALeVIP The California Energy Commission partnered with five local energy agencies to launch the Peninsula-Silicon Valley Project, an initiative of the California Electric Vehicle Infrastructure Project (CALeVIP), which aims to develop and implement regional incentives to support statewide adoption of EVs. CPAU has committed $1M of Low Carbon Fuel Standard (LCFS) funds, to receive $1M in grant funding. These funds became available to all Palo Alto commercial customers to install Level 2 or Level 3 fast chargers over the next 2 years. The program was successfully launched on December 16, 2020. The City of Palo Alto also applied for CALeVIP funds to install DC Fast Chargers at 2 downtown public parking garages. The hope is that increased EV charging infrastructure in the downtown area will help not only visitors and commuters, but also the 727 low-income households (10 low-income multifamily properties) living within walking distance to University Ave. Over the coming months, applicants will be notified whether they successfully reserved funds.
Program statistics as of the end of Q2 FY2021:
Clean Fuel Rewards Program
•;ufl(,t,j
__ J ilJ0,000 _
1,.
$1
Quarterly Update for First & Second Quarters of FY 2021 June 2021
24
The Clean Fuel Rewards point-of-sale $1,500 rebate launched on November 17, 2020 at participating dealerships. All Palo Alto residents purchasing electric vehicles are eligible for this discount. The City of Palo Alto Utilities has contributed Low Carbon Fuel Standard (LCFS) funds towards this new statewide initiative, which was approved by City Council in May 2020. CPAU expects to contribute $300-$400K annually for the next 10 years. Curbside Charging Pilot Program The goal of this pilot program is to install publicly available curbside chargers at 10 pilot sites with electricity supplied by resident homes. In Q2 2020, the City Manager approved EV charger rebates to be extended to curbside charger locations. Public Works and Planning are working with residents interested to do such curbside projects in front of their homes by issuing encroachment permits and Utilities’ role is to provide the rebates to cover associated customer costs. The non-profit Adopt-A-Charger is facilitating these projects. Program statistics as of the end of Q2 FY2021:
• One permit application has been submitted for a 2-port curbside charger Electric Vehicle Education and Outreach In Fall 2020, CPAU collaborated with NCPA (Northern California Power Agency) and 15 other member agencies to issue an RFP for EV and Electrification education including workshops, online classes, virtual and in-person ride and drives, expos and youth education. Eight vendors have been selected with five offering EV programs Contracting is expected to be completed by the end of Q3 FY2021. Vendors selected for EV education:
• Charge Across Town • D+R International • Electric Car Insider • Plug-In America • Acterra
ix. Legislative and Regulatory Issues State legislation
CPAU is currently tracking over 45 bills. Some of the bills are tracked because they would add reporting requirements or modify our operations; some because they could change the state’s energy policy or are of interest given the City’s priorities. Key bills to note are: AB 100 (Holden) Drinking water: pipes and fittings: lead content. This bill limits the amount of lead leaching from faucets and fixtures to no more than 1 microgram, which is five times lower than the current industry standard. AB 339 (Lee) Local government: open and public meetings. Requires all “Brown Act” meetings (such as the UAC meeting) to include an opportunity for members of the public to attend via a call-in or video conference. All meetings must also include an in-person comment opportunity, unless the meeting takes place during a declared emergency. Also requires interpretation services as requested, with a system to process requests for
Quarterly Update for First & Second Quarters of FY 2021 June 2021
25
interpretation services and the availability of instructions on joining the meeting to all non-English-speaking persons upon request. Instructions must be published in the 2 most spoken languages, other than English, within the local agency’s jurisdiction. AB 525 (Chiu) Energy: offshore wind generation. Requires the CEC, on or before March 1, 2022, to evaluate and quantify the maximum feasible capacity of offshore wind to achieve reliability, ratepayer, employment, and decarbonization benefits and to establish offshore wind planning goals for 2030 and 2045. AB 641 (Holden) Transportation electrification: local publicly owned electric utilities. Requires electric POUs to develop and adopt a transportation electrification plan, individually or in collaboration with other POUs, with certain elements to support the level of EV adoption required for the state to meet certain goals. AB 970 (McCarty) Planning and zoning: electric vehicle charging stations: permit application: approval. Provides that a residential charging station permit is approved within 15 days of submittal if certain criteria are met, including that the applicant has already obtained all required approvals from a POU. AB 1434 (Friedman) Urban water use objectives: indoor residential water use. Starting in 2023, this bill would incrementally lower the standard for indoor residential water use to 40 gallons per capita daily by January 1, 2030. The current standard has us at 50 gallons by 2030, or whatever number DWR studies recommend. Also mandates conduct necessary studies and investigations and may recommend a standard for indoor residential water use that more appropriately reflects best practices than the standard described in the bill. AB 1500 (Garcia, Eduardo) Safe Drinking Water, Wildfire Prevention, Drought Preparation, Flood Protection, Extreme Heat Mitigation, and Workforce Development Bond Act of 2022. If approved by voters, would provide bond funding to finance projects for safe drinking water, wildfire prevention, drought preparation, flood protection, extreme heat mitigation, and workforce development programs. SB 45 (Portantino) Wildfire Prevention, Safe Drinking Water, Drought Preparation, and Flood Protection Bond Act of 2022. Enacts the Wildfire Prevention, Safe Drinking Water, Drought Preparation, and Flood Protection Bond Act of 2022, which, if approved by the voters, would authorize bonds for $5.6 billion to finance projects for a wildfire prevention, safe drinking water, drought preparation, and flood protection program. SB 223 (Dodd) Discontinuation of residential water service. This bill seeks to expand provisions regarding prohibiting discontinuation of residential water service due to nonpayment. These provisions include expanding the conditions that must be met to discontinue water service (such as expanding the duration of delinquency) and requiring the consideration of arrearage management plans. SB 323 (Caballero) Local government: water or sewer service: legal actions. Creates a 120 day statute of limitations for legal challenges to water and sewer service charges that are adopted after January 1, 2022. SB 351 (Caballero) Water Innovation Act of 2021. Sponsored by CMUA, this bill would create the Office of Water Innovation for the furtherance of new technologies and innovative approaches in the water sector. By December 31, 2023,the Office shall take specified measures to advance innovation in the water sector. The bill would further create the Water Innovation Fund for the furtherance of water innovation.
Quarterly Update for First & Second Quarters of FY 2021 June 2021
26
SB 378 (Gonzalez) Local government: broadband infrastructure development project permit processing: microtrenching permit processing ordinance. Authorizes a fiber provider to determine the method of installing fiber in a city, including microtrenching. SB 427 (Eggman) Water theft: enhanced penalties. Authorizes a local government to make any violation of a local ordinance regarding water theft subject to an administrative fine in excess of current legal limits. SB 617 (Wiener D) Residential solar energy systems: permitting. Requires every city and county to implement an online, automated permitting platform that verifies code compliance and instantaneously issues permits for solar energy systems no larger than 38.4 kW and an energy storage system paired with a solar energy system that is no larger than 38.4 kW. Also requires a city or county to amend a certain ordinance to authorize a residential solar energy system and an energy storage system to use the online, automated permitting platform. CPAU staff continues to work closely with CMUA and NCPA on legislative issues. This work includes participating on legislative committees, standing work groups, and ad hoc work groups. State regulatory proceedings
Below, we note the issues CPAU have tracked or engaged in with various agencies during the last quarter, primarily through our work with CMUA and NCPA. Energy Commission Load management standards and the SB 100 joint agencies report: Achieving 100 Percent Clean Electricity in California: An Initial Assessment Public Utilities Commission Proceedings related to PSPS and physical security Wildfire Safety Advisory Board – currently under the CPUC’s jurisdiction Template for future Wildfire Mitigation Plans and Mitigation plans generally State Water Resources Control Board Indoor and outdoor water use; drought and water shortage; water loss control standards. CPAU also participated in a survey regarding utility debt due to the pandemic.
x. Utility Financial Summary This section describes the unaudited actual financial results for FY 2021 for all Utilities funds. The Council-adopted long-term Financial Plans for the Electric, Gas, and Water Funds was updated for FY 2021 during the budget review process. The Wastewater Collection Fund Financial Forecast was updated for FY 2021 and presented to the Finance Committee.
Quarterly Update for First & Second Quarters of FY 2021 June 2021
27
Electric Utility Overview
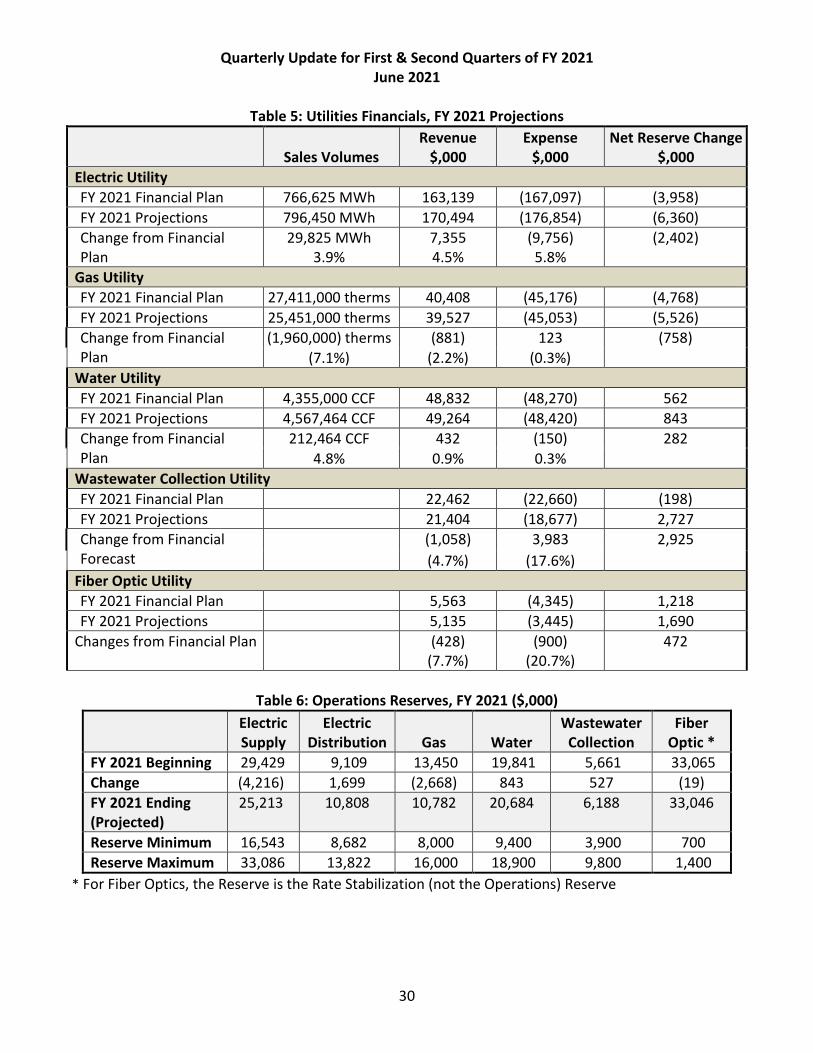
Sales for the Electric Utility in FY 2021 are projected to be 3.9% higher than forecasted in the FY 2021 Financial Plan. Revenues are also projected to increase by $7.4 million or 4.5% higher than forecasted; this is due to higher sales as well as increasing EMA/Market sales (sales of surplus energy) as well as REC sales revenue. Staff projects expenses to be $9.8 million higher than forecasted in the FY 2021 Financial Plan. This is due in part to higher administration cost projections based on higher FY 2020 actuals (about $1 million), and new budget funding for the City’s Low Carbon Fuel Standard (LCFS) budget which did not show in the FY 2021 adopted budget. However, LCFS spending is funded by LCFS revenues rather than ratepayer funding or other funding sources. The impact to reserves in FY 2021 is due to the segregation of these funds into a separate LCFS reserve. In addition, electric supply purchase costs are projected to increase by about $5.4 million, mainly due to poor projected hydro conditions. The Electric Supply and Distribution Reserves were within guideline ranges at the beginning of FY 2021 and are projected to be within guideline ranges at year end FY 2021. In addition, due to surplus energy revenues seen in FY 2019 and FY 2020, staff continued repayment of a short term $10 million loan from the Electric Special Projects (ESP) reserve done in FY 2018, and provided additional funds to the Hydro Stabilization Reserve for future dry-year conditions and the Capital Reserve for future capital improvement needs. The Electric Utility CIP Reappropriation and Commitment Reserves totaled a projected $28.6 million at the end of Q2 FY 2021. Gas Utility Overview
Sales for the Gas Utility in FY 2021 are projected to be 7.1% lower than forecasted in the FY 2021 Financial Plan. However, staff projects a decrease of only 2.2% in revenues, mainly due to increased projected market costs for natural gas itself, but also increased cost projections for transmission and Cap and trade related costs. These charges are pass-through in nature, so variations from budget will not have dramatic reserve effects. On the expense side, while commodity costs are increasing, operational cost estimates have been revised downward from the original FY 2021 forecast, effectively netting out much of the cost increase impact. The Gas Operations Reserve was within the reserve guideline levels at the beginning of FY 2021 and is projected to be within the guideline levels at year end FY 2021. The Gas Utility CIP Re-appropriation and Commitment Reserves totaled $9.4 million at the end of Q2 FY 2021. Water Utility Overview Staff projects sales for the Water Utility in FY 2021 to be 4.8% higher than forecasted in the FY 2021 Financial Plan. Similarly, sales revenue is expected to be 4.2% higher than forecasted in the FY 2021 Financial Plan. This is in part because the sales decreases forecasted in the FY 2021 Financial Plan, which were made in light of the COVID-19 pandemic and related economic impacts have not materialized and additionally because of continued dry weather conditions. Staff projects overall FY 2021 sales revenue to be only 0.9% higher than in the FY 2021 Financial Plan due to other revenue, including interest income, being lower. Expenses were 0.3% lower than anticipated in the Financial Plan; this does not reflect changes in the timing of CIP expenditures. In FY 2020 there was a deferral of water utility capital spending due to pursuing lower pricing for the Corte Madera tank replacement as well as removing a portion of Water Main Replacement 27 from the original scope. Changes in
Quarterly Update for First & Second Quarters of FY 2021 June 2021
28
deferred CIP spending for FY 2021 will be reflected in the CIP Reserve at year end. This is because the Water Utility funds CIP through an annual transfer from the Operations Reserve to the CIP Reserve. The Water Operations Reserve was above the reserve guideline levels at the beginning of FY 2021 and Table 5 below illustrates the reserve remaining above the maximum at year end FY 2021. However, Council approved up to an $8 million transfer from the Operations Reserve to the CIP Reserve FY 2021 to fund ongoing CIP work and staff is requesting authorization for up to an additional $13.24 million in transfers from the Operations Reserve to the CIP Reserve in FY 2022 to fund ongoing main replacements (WMR 28 is planned in FY 2022) as well as one-time seismic reservoir upgrades (one upgrade is ongoing and a second is planned for FY 2023). These transfers together with expected revenues and expenses are projected to bring the Operations Reserve to approximately target levels by the end of FY 2023. The need for the transfers will be re-evaluated at the end of FY 2021 when the reserve balances are known. Approximately $11 million in projects budgeted in FY 2020 or earlier will be re-appropriated to FY 2021. The largest being seismic water system upgrades, estimated at $5 million. The Water Utility CIP Reappropriation and Commitment Reserves are projected to total $10.2 million at the end of Q2 FY 2021. Wastewater Collection Utility Overview
Staff projects Wastewater revenues for FY 2021 to be 4.7% lower than forecasted in the FY 2021 Financial Forecast. This is in part due to expected reductions in non-residential sewer usage due to the impacts of the COVID-19 pandemic and also because of updated reduced projections for other revenue from connection and capacity fees and interest. Staff projects expenses to be 17.6% lower than projected in the FY 2021 Financial Forecast. This is in part due to treatment cost projection reductions of $1.2 million as well as deferrals of CIP spending. However, Sewer System Replacement 30 is planned for FY 2022 with an estimated cost of $4.1 million. Any surplus from FY 2021 and prior years will be used to fund the deficit for sewer replacement in FY 2022. Additionally, as part of the FY 2022 Financial Plan, staff is requesting to implement an annual capital program contribution from the Operations Reserve to the CIP Reserve beginning in FY 2022 as well as a one-time transfer of $2.2 million in FY 2021. Staff expects these changes to minimize Operations Reserve fluctuations due to the timing of Wastewater Collection CIP. The Wastewater Collection Utility CIP Reappropriation and Commitment Reserves totaled $4.8 million at the end of FY 2020. In addition to these previously budgeted funds, the FY 2021 Financial Plan estimated the additional CIP funding needed for FY 2021 to be $4.6 million while the current projection is for only $1.2 million. The Wastewater Collection Operations Reserve was within the guideline range at the beginning of FY 2021 and staff projects it will remain within the guideline range through year end FY 2021. Fiber Optic Utility Overview
Fiber revenue is projected to be 7.7% or $428,000 lower than forecasted in the FY 2021 Financial Plan. Due to impacts of the pandemic, several businesses have either closed or relocated their offices. In addition, one of the City’s few remaining EDF-1 promotional rate customers have converted to the EDF-3 rate which results in a decrease of $280,000 of annual fiber leasing revenue. Fiber expenses are projected to be 20.7% or $900,000 lower than forecast. The Fiber Network Rebuild CIP project is temporarily on hold pending Council’s direction for the City fiber network expansion plan and fiber-to-the-home (FTTH). The new proposed fiber backbone will provide high capacity fiber to City departments (Utilities, Public Works, Office of Emergency Services,
Quarterly Update for First & Second Quarters of FY 2021 June 2021
29
Transportation, Information Technology, and Community Services). The backbone will be routed through neighborhoods and business districts and serve as a springboard to FTTH. The projected ending FY 2021 Fiber Optic Utility Rate Stabilization Reserve is $34.7 million.
Quarterly Update for First & Second Quarters of FY 2021 June 2021
30
Table 5: Utilities Financials, FY 2021 Projections
Sales Volumes Revenue
$,000 Expense
$,000 Net Reserve Change
$,000 Electric Utility FY 2021 Financial Plan 766,625 MWh 163,139 (167,097) (3,958) FY 2021 Projections 796,450 MWh 170,494 (176,854) (6,360) Change from Financial Plan
29,825 MWh 3.9%
7,355 4.5%
(9,756) 5.8%
(2,402)
Gas Utility FY 2021 Financial Plan 27,411,000 therms 40,408 (45,176) (4,768) FY 2021 Projections 25,451,000 therms 39,527 (45,053) (5,526) Change from Financial Plan
(1,960,000) therms (881) 123 (758) (7.1%) (2.2%) (0.3%)
Water Utility FY 2021 Financial Plan 4,355,000 CCF 48,832 (48,270) 562 FY 2021 Projections 4,567,464 CCF 49,264 (48,420) 843 Change from Financial Plan
212,464 CCF 432 (150) 282 4.8% 0.9% 0.3%
Wastewater Collection Utility FY 2021 Financial Plan 22,462 (22,660) (198) FY 2021 Projections 21,404 (18,677) 2,727 Change from Financial Forecast
(1,058) 3,983 2,925 (4.7%) (17.6%)
Fiber Optic Utility FY 2021 Financial Plan 5,563 (4,345) 1,218 FY 2021 Projections 5,135 (3,445) 1,690
Changes from Financial Plan (428) (7.7%)
(900) (20.7%)
472
Table 6: Operations Reserves, FY 2021 ($,000)
Electric Supply
Electric Distribution
Gas Water
Wastewater Collection
Fiber Optic *
FY 2021 Beginning 29,429 9,109 13,450 19,841 5,661 33,065 Change (4,216) 1,699 (2,668) 843 527 (19) FY 2021 Ending (Projected)
25,213 10,808 10,782 20,684 6,188 33,046
Reserve Minimum 16,543 8,682 8,000 9,400 3,900 700 Reserve Maximum 33,086 13,822 16,000 18,900 9,800 1,400
* For Fiber Optics, the Reserve is the Rate Stabilization (not the Operations) Reserve
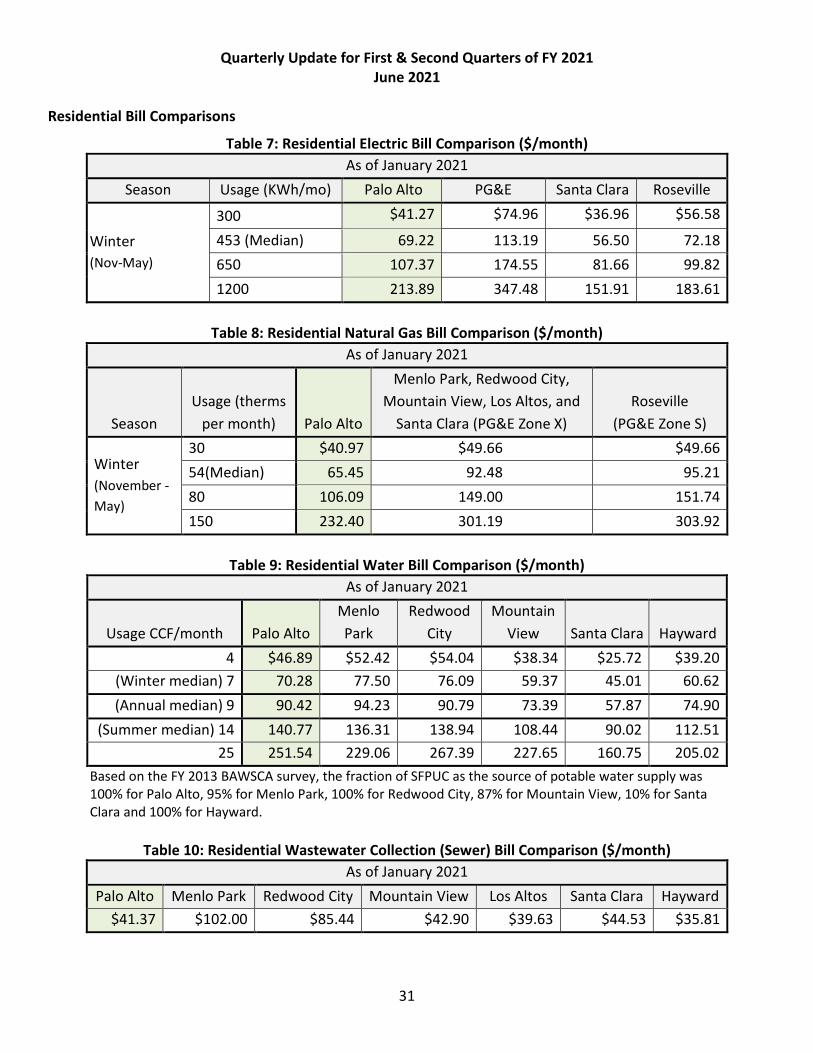
Quarterly Update for First & Second Quarters of FY 2021 June 2021
31
Residential Bill Comparisons
Table 7: Residential Electric Bill Comparison ($/month) As of January 2021
Season Usage (KWh/mo) Palo Alto PG&E Santa Clara Roseville
Winter (Nov-May)
300 $41.27 $74.96 $36.96 $56.58
453 (Median) 69.22 113.19 56.50 72.18 650 107.37 174.55 81.66 99.82 1200 213.89 347.48 151.91 183.61
Table 8: Residential Natural Gas Bill Comparison ($/month)
As of January 2021
Season Usage (therms
per month) Palo Alto
Menlo Park, Redwood City, Mountain View, Los Altos, and
Santa Clara (PG&E Zone X) Roseville
(PG&E Zone S)
Winter (November - May)
30 $40.97 $49.66 $49.66 54(Median) 65.45 92.48 95.21 80 106.09 149.00 151.74 150 232.40 301.19 303.92
Table 9: Residential Water Bill Comparison ($/month)
As of January 2021
Usage CCF/month Palo Alto Menlo Park
Redwood City
Mountain View Santa Clara Hayward
4 $46.89 $52.42 $54.04 $38.34 $25.72 $39.20 (Winter median) 7 70.28 77.50 76.09 59.37 45.01 60.62 (Annual median) 9 90.42 94.23 90.79 73.39 57.87 74.90
(Summer median) 14 140.77 136.31 138.94 108.44 90.02 112.51 25 251.54 229.06 267.39 227.65 160.75 205.02
Based on the FY 2013 BAWSCA survey, the fraction of SFPUC as the source of potable water supply was 100% for Palo Alto, 95% for Menlo Park, 100% for Redwood City, 87% for Mountain View, 10% for Santa Clara and 100% for Hayward.
Table 10: Residential Wastewater Collection (Sewer) Bill Comparison ($/month)
As of January 2021 Palo Alto Menlo Park Redwood City Mountain View Los Altos Santa Clara Hayward
$41.37 $102.00 $85.44 $42.90 $39.63 $44.53 $35.81
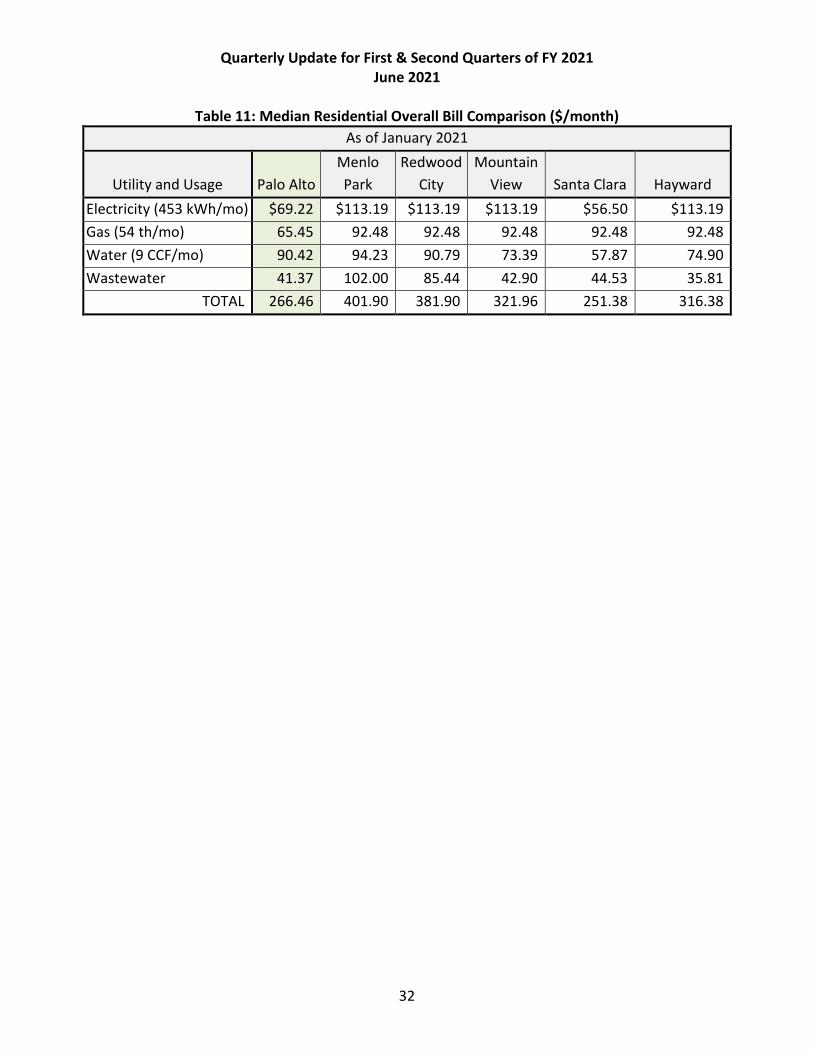
Quarterly Update for First & Second Quarters of FY 2021 June 2021
32
Table 11: Median Residential Overall Bill Comparison ($/month) As of January 2021
Utility and Usage Palo Alto Menlo Park
Redwood City
Mountain View Santa Clara Hayward
Electricity (453 kWh/mo) $69.22 $113.19 $113.19 $113.19 $56.50 $113.19 Gas (54 th/mo) 65.45 92.48 92.48 92.48 92.48 92.48 Water (9 CCF/mo) 90.42 94.23 90.79 73.39 57.87 74.90 Wastewater 41.37 102.00 85.44 42.90 44.53 35.81
TOTAL 266.46 401.90 381.90 321.96 251.38 316.38
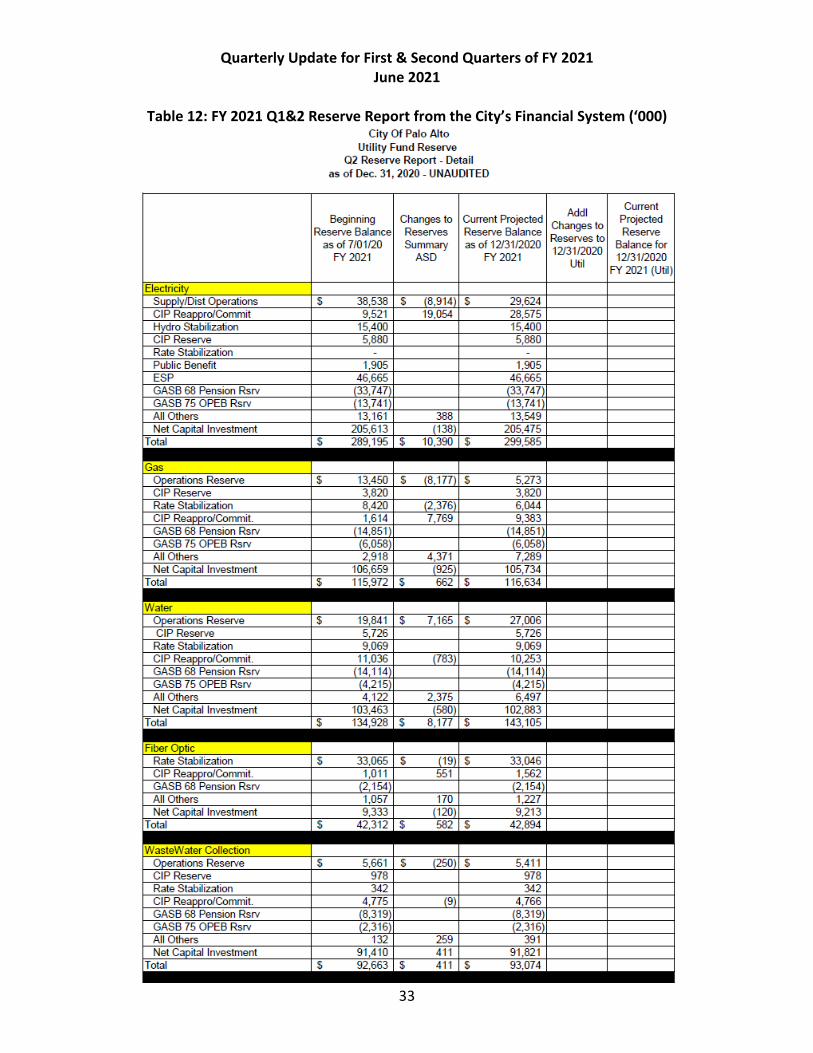
Quarterly Update for First & Second Quarters of FY 2021 June 2021
33
Table 12: FY 2021 Q1&2 Reserve Report from the City’s Financial System (‘000)
Electricity Supply/Dist Operations CIP Reappro/Commit Hydro Stabilization CIP Reserve Rate Stabilization Public Benefit ESP GASS 68 Pensioo Rsrv GASS 75 OPES Rsrv A ll Others Net Capital Investment
Total
Gas Operations Reserve CIP Reserve Rate Stabilization CIP Reappro/Commil. GASS 68 Pensioo Rsrv GASS 75 OPES Rsrv A ll Others Net Capital Investment
Total
Water Operations Reserve CIP Reserve
Rate Stabilization CIP Reappro/Commil. GASS 68 Pensioo Rsrv GASS 75 OPEB Rsrv A ll Others Net Capital Investment
Total
Fiber Optic Rate Stabilization CIP Reappro/Commil. GASS 68 Pensioo Rsrv All Others Net Capital Investment
Total
Wastewater Collection Operations Reserve CIP Reserve Rate Stabilization CIP Reappro/Commil. GASS 68 Pensioo Rsrv GASS 75 OPES Rsrv A ll Others Net Capital Investment
Total
City Of Palo Alto Uti l ity Fund Reserve
02 Reserve Report - Deta il as of Dec. 31 , 2020 - UNAUDITED
Begin11i11g Changes to Current Projected Reserve Balance Reserves Reserve Ba lruice
as of 7/01/20 Summary as of 12/31/2020 FY 2021 ASD FY 2021
$ 38,536 s (8,914) s 29,624 9,521 19,054 28,575
15,400 15,400 5,880 5,880
- -1,905 1,905
46,665 46,665 (33,747) (33,747) (13,741) (13,741) 13,161 388 13,549
205,613 (138) 205,475 $ 289,195 $ 10,390 $ 299,585
$ 13,450 s (8,177) s 5,273 3,820 3,820 8,420 (2,376) 6,044 1,614 7,769 9,383
(14,851) (14,851) (6,058) (6,058) 2,918 4,371 7,289
106,659 (925) 105,734 $ 115,972 $ 662 $ 116,634
$ 19,841 $ 7,165 s 27,006 5,726 5,726 9,069 9,069
11 ,036 (783) 10,253 (14,114) (14,11 4) (4,215) (4,215) 4,122 2,375 6,497
103,463 (580) 102,883 $ 134,928 $ 8,177 $ 143, 105
$ 33,065 $ (19) s 33,046 1,011 551 1,562
(2,154) (2,154) 1,057 170 1,227 9,333 (120) 9,213
$ 42,312 $ 582 s 42,894
$ 5,661 s (250) s 5,411 978 978 342 342
4,775 (9) 4,766 (8,319) (8,319) (2,316) (2,316)
132 259 391 91,410 411 91,821
$ 92,663 $ 411 s 93,074
Add i Current
Chruiges to Projected Reserve
Reserves to Ba lance for
12/31/2020 Util
12/31/2020 FY 2021 (Util)
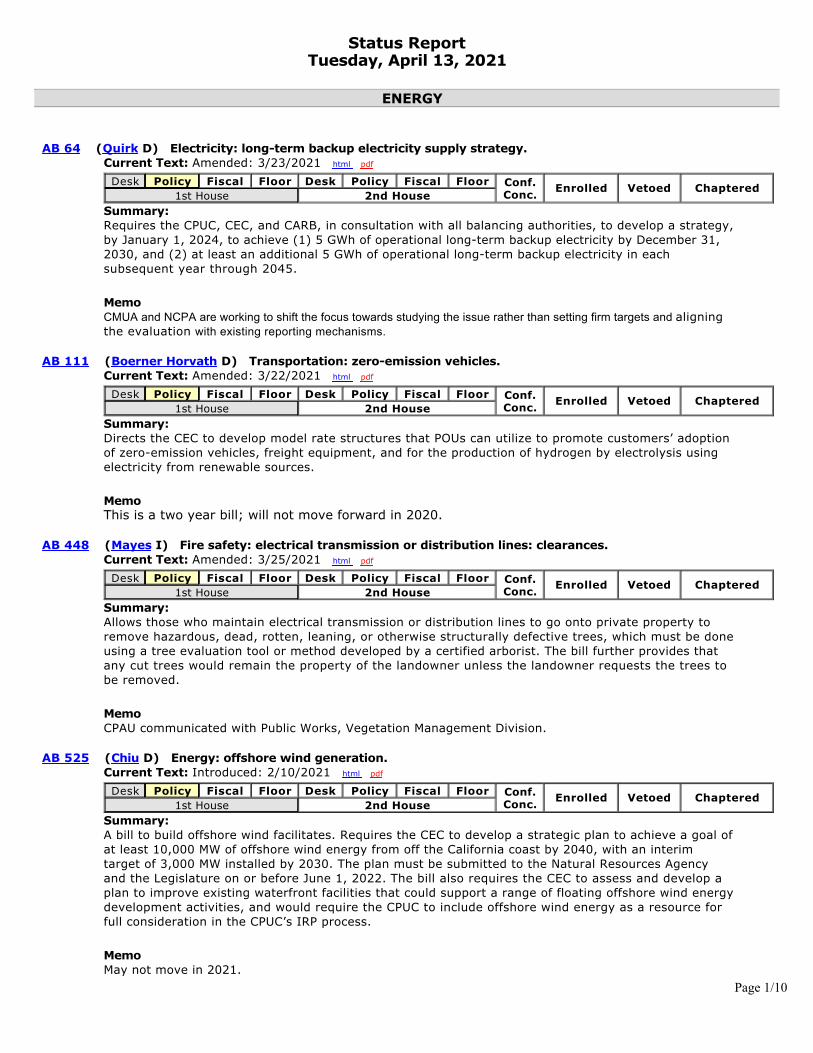
Status ReportTuesday, April 13, 2021
ENERGY
AB 64 (Quirk D) Electricity: long-term backup electricity supply strategy. Current Text: Amended: 3/23/2021 html pdf
Desk Policy Fiscal Floor Desk Policy Fiscal Floor Conf.Conc.
Enrolled Vetoed Chaptered1st House 2nd House
Summary:Requires the CPUC, CEC, and CARB, in consultation with all balancing authorities, to develop a strategy,by January 1, 2024, to achieve (1) 5 GWh of operational long-term backup electricity by December 31,2030, and (2) at least an additional 5 GWh of operational long-term backup electricity in eachsubsequent year through 2045.
MemoCMUA and NCPA are working to shift the focus towards studying the issue rather than setting firm targets and aligningthe evaluation with existing reporting mechanisms.
AB 111 (Boerner Horvath D) Transportation: zero-emission vehicles. Current Text: Amended: 3/22/2021 html pdf
Desk Policy Fiscal Floor Desk Policy Fiscal Floor Conf.Conc.
Enrolled Vetoed Chaptered1st House 2nd House
Summary:Directs the CEC to develop model rate structures that POUs can utilize to promote customers’ adoptionof zero-emission vehicles, freight equipment, and for the production of hydrogen by electrolysis usingelectricity from renewable sources.
MemoThis is a two year bill; will not move forward in 2020.
AB 448 (Mayes I) Fire safety: electrical transmission or distribution lines: clearances. Current Text: Amended: 3/25/2021 html pdf
Desk Policy Fiscal Floor Desk Policy Fiscal Floor Conf.Conc.
Enrolled Vetoed Chaptered1st House 2nd House
Summary:Allows those who maintain electrical transmission or distribution lines to go onto private property toremove hazardous, dead, rotten, leaning, or otherwise structurally defective trees, which must be doneusing a tree evaluation tool or method developed by a certified arborist. The bill further provides thatany cut trees would remain the property of the landowner unless the landowner requests the trees tobe removed.
MemoCPAU communicated with Public Works, Vegetation Management Division.
AB 525 (Chiu D) Energy: offshore wind generation. Current Text: Introduced: 2/10/2021 html pdf
Desk Policy Fiscal Floor Desk Policy Fiscal Floor Conf.Conc.
Enrolled Vetoed Chaptered1st House 2nd House
Summary:A bill to build offshore wind facilitates. Requires the CEC to develop a strategic plan to achieve a goal ofat least 10,000 MW of offshore wind energy from off the California coast by 2040, with an interimtarget of 3,000 MW installed by 2030. The plan must be submitted to the Natural Resources Agencyand the Legislature on or before June 1, 2022. The bill also requires the CEC to assess and develop aplan to improve existing waterfront facilities that could support a range of floating offshore wind energydevelopment activities, and would require the CPUC to include offshore wind energy as a resource forfull consideration in the CPUC’s IRP process.
MemoMay not move in 2021.
Page 1/10
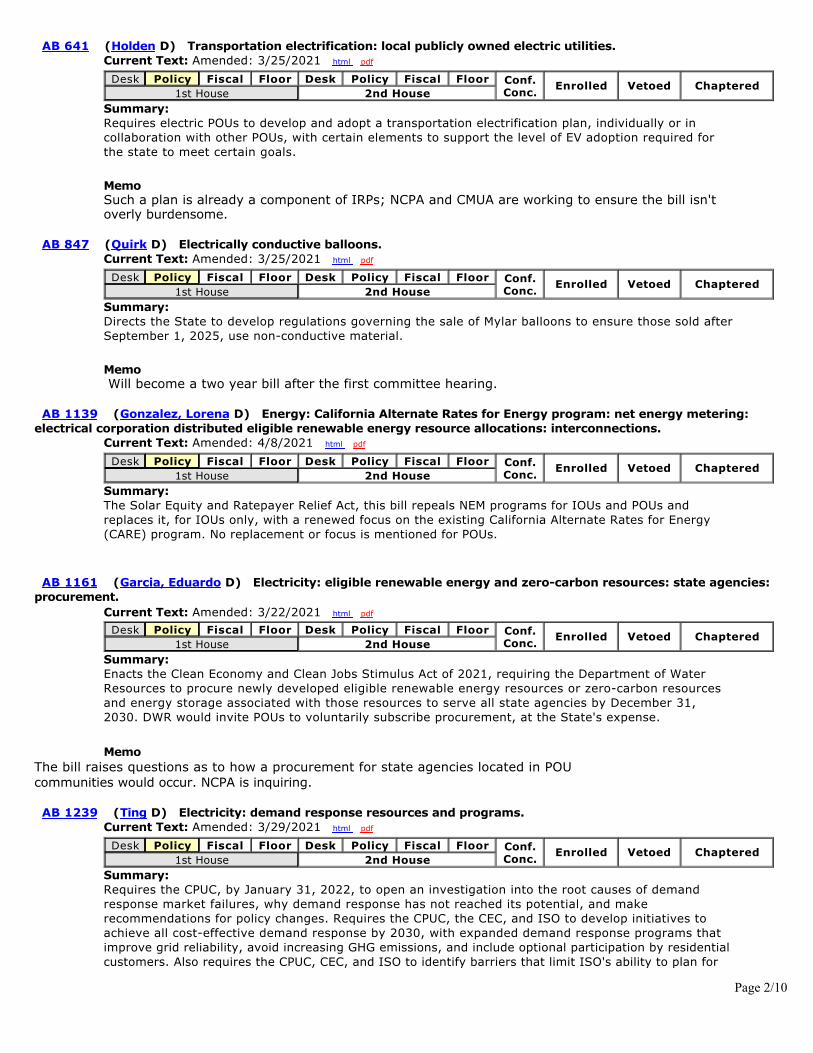
AB 641 (Holden D) Transportation electrification: local publicly owned electric utilities. Current Text: Amended: 3/25/2021 html pdf
Desk Policy Fiscal Floor Desk Policy Fiscal Floor Conf.Conc.
Enrolled Vetoed Chaptered1st House 2nd House
Summary:Requires electric POUs to develop and adopt a transportation electrification plan, individually or incollaboration with other POUs, with certain elements to support the level of EV adoption required forthe state to meet certain goals.
MemoSuch a plan is already a component of IRPs; NCPA and CMUA are working to ensure the bill isn'toverly burdensome.
AB 847 (Quirk D) Electrically conductive balloons. Current Text: Amended: 3/25/2021 html pdf
Desk Policy Fiscal Floor Desk Policy Fiscal Floor Conf.Conc.
Enrolled Vetoed Chaptered1st House 2nd House
Summary:Directs the State to develop regulations governing the sale of Mylar balloons to ensure those sold afterSeptember 1, 2025, use non-conductive material.
Memo Will become a two year bill after the first committee hearing.
AB 1139 (Gonzalez, Lorena D) Energy: California Alternate Rates for Energy program: net energy metering:electrical corporation distributed eligible renewable energy resource allocations: interconnections.
Current Text: Amended: 4/8/2021 html pdf
Desk Policy Fiscal Floor Desk Policy Fiscal Floor Conf.Conc.
Enrolled Vetoed Chaptered1st House 2nd House
Summary:The Solar Equity and Ratepayer Relief Act, this bill repeals NEM programs for IOUs and POUs andreplaces it, for IOUs only, with a renewed focus on the existing California Alternate Rates for Energy(CARE) program. No replacement or focus is mentioned for POUs.
AB 1161 (Garcia, Eduardo D) Electricity: eligible renewable energy and zero-carbon resources: state agencies:procurement.
Current Text: Amended: 3/22/2021 html pdfDesk Policy Fiscal Floor Desk Policy Fiscal Floor Conf.
Conc.Enrolled Vetoed Chaptered
1st House 2nd HouseSummary:Enacts the Clean Economy and Clean Jobs Stimulus Act of 2021, requiring the Department of WaterResources to procure newly developed eligible renewable energy resources or zero-carbon resourcesand energy storage associated with those resources to serve all state agencies by December 31,2030. DWR would invite POUs to voluntarily subscribe procurement, at the State's expense.
MemoThe bill raises questions as to how a procurement for state agencies located in POUcommunities would occur. NCPA is inquiring.
AB 1239 (Ting D) Electricity: demand response resources and programs. Current Text: Amended: 3/29/2021 html pdf
Desk Policy Fiscal Floor Desk Policy Fiscal Floor Conf.Conc.
Enrolled Vetoed Chaptered1st House 2nd House
Summary:Requires the CPUC, by January 31, 2022, to open an investigation into the root causes of demandresponse market failures, why demand response has not reached its potential, and makerecommendations for policy changes. Requires the CPUC, the CEC, and ISO to develop initiatives toachieve all cost-effective demand response by 2030, with expanded demand response programs thatimprove grid reliability, avoid increasing GHG emissions, and include optional participation by residentialcustomers. Also requires the CPUC, CEC, and ISO to identify barriers that limit ISO's ability to plan for
Page 2/10
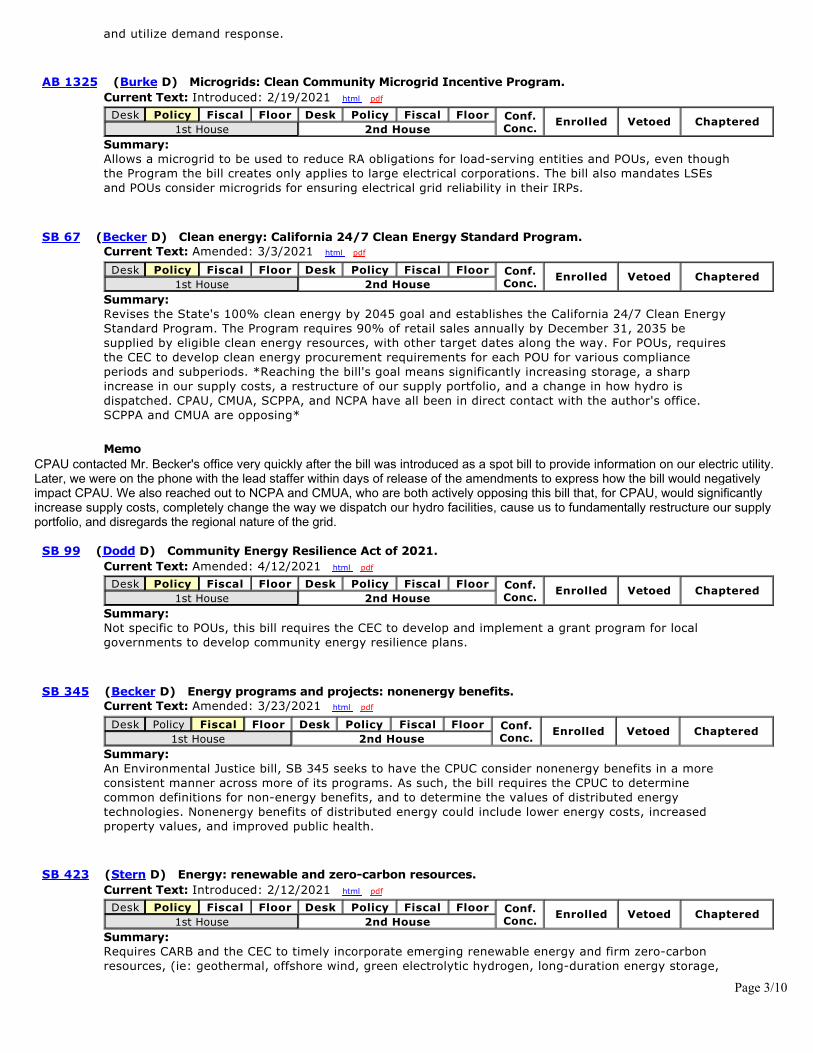
and utilize demand response.
AB 1325 (Burke D) Microgrids: Clean Community Microgrid Incentive Program. Current Text: Introduced: 2/19/2021 html pdfDesk Policy Fiscal Floor Desk Policy Fiscal Floor Conf.
Conc.Enrolled Vetoed Chaptered
1st House 2nd HouseSummary:Allows a microgrid to be used to reduce RA obligations for load-serving entities and POUs, even thoughthe Program the bill creates only applies to large electrical corporations. The bill also mandates LSEsand POUs consider microgrids for ensuring electrical grid reliability in their IRPs.
SB 67 (Becker D) Clean energy: California 24/7 Clean Energy Standard Program. Current Text: Amended: 3/3/2021 html pdf
Desk Policy Fiscal Floor Desk Policy Fiscal Floor Conf.Conc.
Enrolled Vetoed Chaptered1st House 2nd House
Summary:Revises the State's 100% clean energy by 2045 goal and establishes the California 24/7 Clean EnergyStandard Program. The Program requires 90% of retail sales annually by December 31, 2035 besupplied by eligible clean energy resources, with other target dates along the way. For POUs, requiresthe CEC to develop clean energy procurement requirements for each POU for various complianceperiods and subperiods. *Reaching the bill's goal means significantly increasing storage, a sharpincrease in our supply costs, a restructure of our supply portfolio, and a change in how hydro isdispatched. CPAU, CMUA, SCPPA, and NCPA have all been in direct contact with the author's office.SCPPA and CMUA are opposing*
MemoCPAU contacted Mr. Becker's office very quickly after the bill was introduced as a spot bill to provide information on our electric utility.Later, we were on the phone with the lead staffer within days of release of the amendments to express how the bill would negativelyimpact CPAU. We also reached out to NCPA and CMUA, who are both actively opposing this bill that, for CPAU, would significantlyincrease supply costs, completely change the way we dispatch our hydro facilities, cause us to fundamentally restructure our supplyportfolio, and disregards the regional nature of the grid.
SB 99 (Dodd D) Community Energy Resilience Act of 2021. Current Text: Amended: 4/12/2021 html pdfDesk Policy Fiscal Floor Desk Policy Fiscal Floor Conf.
Conc.Enrolled Vetoed Chaptered
1st House 2nd HouseSummary:Not specific to POUs, this bill requires the CEC to develop and implement a grant program for localgovernments to develop community energy resilience plans.
SB 345 (Becker D) Energy programs and projects: nonenergy benefits. Current Text: Amended: 3/23/2021 html pdf
Desk Policy Fiscal Floor Desk Policy Fiscal Floor Conf.Conc.
Enrolled Vetoed Chaptered1st House 2nd House
Summary:An Environmental Justice bill, SB 345 seeks to have the CPUC consider nonenergy benefits in a moreconsistent manner across more of its programs. As such, the bill requires the CPUC to determinecommon definitions for non-energy benefits, and to determine the values of distributed energytechnologies. Nonenergy benefits of distributed energy could include lower energy costs, increasedproperty values, and improved public health.
SB 423 (Stern D) Energy: renewable and zero-carbon resources. Current Text: Introduced: 2/12/2021 html pdfDesk Policy Fiscal Floor Desk Policy Fiscal Floor Conf.
Conc.Enrolled Vetoed Chaptered
1st House 2nd HouseSummary:Requires CARB and the CEC to timely incorporate emerging renewable energy and firm zero-carbonresources, (ie: geothermal, offshore wind, green electrolytic hydrogen, long-duration energy storage,
Page 3/10
and multi-day energy storage) into its energy and resource planning processes. By December 31, 2022,the CPUC and CEC must to each adopt measures to bolster the near-, mid-, and long-term reliabilityand resiliency of the rid consistent with State goals to reduce localized air pollutants and GHGemissions.
Memo
SB 437 (Wieckowski D) Local publicly owned electric utilities: integrated resource planning: transportationelectrification.
Current Text: Amended: 4/8/2021 html pdf
Desk Policy Fiscal Floor Desk Policy Fiscal Floor Conf.Conc.
Enrolled Vetoed Chaptered1st House 2nd House
Summary:Requires POU IRPs to include details of rate designs that support transportation electrification acrossall sectors and to provide customers with a cost calculator to accurately predict the cost of payingelectricity of vehicle engines.
Memosssss
SB 533 (Stern D) Electrical corporations: wildfire mitigation plans: deenergization events: microgrids. Current Text: Amended: 3/5/2021 html pdf
Desk Policy Fiscal Floor Desk Policy Fiscal Floor Conf.Conc.
Enrolled Vetoed Chaptered1st House 2nd House
Summary:For POUs, allows us to use capacity from a microgrid for RA requirements and directs the CPUC and ISOto develop a methodology to account for the RA value of distributed storage.
Memosssss
SB 617 (Wiener D) Residential solar energy systems: permitting. Current Text: Amended: 4/12/2021 html pdf
Desk Policy Fiscal Floor Desk Policy Fiscal Floor Conf.Conc.
Enrolled Vetoed Chaptered1st House 2nd House
Summary:Requires every city and county to implement an online, automated permitting platform that verifiescode compliance and instantaneously issues permits for residential PV systems and energy storagesystem paired with a residential PV, as long as they are each no larger than 38.4 kWh. Prescribes acompliance schedule for satisfying these requirements; for a city the size of Palo Alto, compliance is dueby September 30, 2022. Does not affect a POUs' interconnection requirements or approval process.
Memosssss
ENERGY - WILDFIRE-RELATED
AB 280 (Rivas, Robert D) Electrical corporations: wildfire mitigation plans. Current Text: Introduced: 1/21/2021 html pdf
Desk Policy Fiscal Floor Desk Policy Fiscal Floor Conf.Conc.
Enrolled Vetoed Chaptered1st House 2nd House
Summary:Requires electric IOUs to submit their wildfire mitigation plans to the Legislature. (Already submitted tothe Wildfire Safety Advisory Board). Tracking in case the bill is amended to include POUs.
AB 529 (Bauer-Kahan D) Electrical utilities: fire safety, prevention, or mitigation services: notice. Current Text: Introduced: 2/10/2021 html pdf
Page 4/10
Desk Policy Fiscal Floor Desk Policy Fiscal Floor Conf.Conc.
Enrolled Vetoed Chaptered1st House 2nd House
Summary:Requires IOUs and POUs engaging in fire safety, prevention, or mitigation services in a high fire-threatdistrict or very high fire hazard severity zone to notify the fire protection district responsible for thatarea at least 48 hours before work is commenced, except in an emergency. The bill also requireselectric utilities to provide the fire protection district with a copy of any form used to document any dailysafety briefing at those worksites no later than 72 hours after the completion of that workday.
Memo
The foothills area is considered a "high fire-risk area" under the definitions in this bill; PAFD is our "fire protection district."We hear the bill will be amended to limit the scope to prescribed burn activity and not broader utility mitigation work.
SB 312 (Nielsen R) California Renewables Portfolio Standard Program. Current Text: Amended: 3/9/2021 html pdf
Desk Policy Fiscal Floor Desk Policy Fiscal Floor Conf.Conc.
Enrolled Vetoed Chaptered1st House 2nd House
Summary:Spot bill promoting biomass facilities and biomass funding.
OTHER
AB 59 (Gabriel D) Mitigation Fee Act: fees: notice and timelines. Current Text: Introduced: 12/7/2020 html pdfDesk Policy Fiscal Floor Desk Policy Fiscal Floor Conf.
Conc.Enrolled Vetoed Chaptered
1st House 2nd HouseSummary:Repeals the code section pertaining to the 120 day statute of limitations for challenging newconnection fees and impact fees and allows those fees to be paid under protest if a developer believesthe fees to be unreasonably high.
MemoMay impact CPAU's ability to charge cost-based connection fees. The bill hasn't been acted upon sinceJanuary and may not move forward.
AB 332 (Committee on Environmental Safety and Toxic Materials) Hazardous waste: treated wood waste:management standards.
Current Text: Amended: 3/26/2021 html pdfDesk Policy Fiscal Floor Desk Policy Fiscal Floor Conf.
Conc.Enrolled Vetoed Chaptered
1st House 2nd HouseSummary:Reinstates the ability to dispose of treated wood waste (such as utility poles) at a landfill.
AB 339 (Lee D) State and local government: open meetings. Current Text: Introduced: 1/28/2021 html pdf
Desk Policy Fiscal Floor Desk Policy Fiscal Floor Conf.Conc.
Enrolled Vetoed Chaptered1st House 2nd House
Summary:Would require all public meetings to include an opportunity for all persons to attend via a call-in optionor an internet-based option that provides closed captioning services. Further requires: (1) that anyteleconferenced meeting, even those held during a public health emergency, include an in-person publiccomment opportunity, where the public can report to a designated site to give public comment inperson, and (2) agendas and instructions for accessing a meeting, whether teleconferenced or inperson, shall be translated into all languages for which 5 percent of the population is a speaker, and(3) translators at public meetings.
MemoCould mean significant costs to CPAU and the City for UAC and Council/other city meetings. CPAU
Page 5/10
communicated our concerns to CMUA, who worked with the author's office. This bill hasn't moved sinceJanuary and may not move forward.
AB 602 (Grayson D) Development fees: impact fee nexus study. Current Text: Amended: 4/6/2021 html pdf
Desk Policy Fiscal Floor Desk Policy Fiscal Floor Conf.Conc.
Enrolled Vetoed Chaptered1st House 2nd House
Summary:Among other things, would require utility fees to be calculated on a development-by-development basisand would subject them to a square footage requirement.
MemoShould be amended soon to exempt connection fees.
AB 703 (Rubio, Blanca D) Open meetings: local agencies: teleconferences. Current Text: Introduced: 2/16/2021 html pdf
Desk Policy Fiscal Floor Desk Policy Fiscal Floor Conf.Conc.
Enrolled Vetoed Chaptered1st House 2nd House
Summary:Allows for additional flexibility for local city councils, boards, commissions, and other public agencies tohold public meetings remotely via video and teleconference.
AB 758 (Nazarian D) Marks-Roos Local Bond Pooling Act of 1985: electric utilities: rate reduction bonds. Current Text: Amended: 3/11/2021 html pdfDesk Policy Fiscal Floor Desk Policy Fiscal Floor Conf.
Conc.Enrolled Vetoed Chaptered
1st House 2nd HouseSummary:A CMUA-sponsored bill that authorizes POUs to issue rate reduction bonds for utility projects.
MemoCPAU submitted a letter of support.
AB 853 (Stone D) Mountainous, forest-, brush-, and grass-covered lands: timber operations: clearings: notice:enforcement: limitations periods.
Current Text: Amended: 3/25/2021 html pdfDesk Policy Fiscal Floor Desk Policy Fiscal Floor Conf.
Conc.Enrolled Vetoed Chaptered
1st House 2nd HouseSummary:Requires "utility companies" (undefined) to provide 21 days notice to landowners before conductingvegetation management activities. The bill would provide a window for landowners to object to a"utility company" performing the work.
MemoAs currently written, it's not clear if the bill applies to POUs. We expect the bill to be narrowedsignificantly soon to focus on timber harvesting, probably for IOUs only.
AB 1557 (Santiago D) Communications: utility pole attachments. Current Text: Amended: 3/18/2021 html pdfDesk Policy Fiscal Floor Desk Policy Fiscal Floor Conf.
Conc.Enrolled Vetoed Chaptered
1st House 2nd HouseSummary:Directs "public utilities" to respond to a pole attachment request from a cable TV provider within 10days if more information is needed and to let the provider know within 45 days if the request isaccepted or denied. "Public Utilities" is undefined, probably refers to IOUs.
SB 297 (Durazo D) Subsurface installations: penalties. Current Text: Amended: 3/25/2021 html pdf
Desk Policy Fiscal Floor Desk Policy Fiscal Floor Conf.Conc.
Enrolled Vetoed Chaptered1st House 2nd House
Summary:Page 6/10
Imposes a new $100,000 civil penalty on an operator or excavator who knowingly and willfully violatesthe Call Before You Dig Law and damages a gas or hazardous gas pipeline.
SB 378 (Gonzalez D) Local government: broadband infrastructure development project permit processing:microtrenching permit processing ordinance.
Current Text: Amended: 4/12/2021 html pdfDesk Policy Fiscal Floor Desk Policy Fiscal Floor Conf.
Conc.Enrolled Vetoed Chaptered
1st House 2nd HouseSummary:Authorizes a fiber provider to determine the method of installing fiber in a city, including microtrenching.
MemoNCPA, CMUA, and SCPPA have raised concerns with the author about potential impacts on safety andreliability of utility infrastructure if cities are not allowed to reasonably limit installation methods. CPAUhas communicated to NCPA and CMUA our concerns about allowing microtrenching, a key aspect of thebill.
SB 556 (Dodd D) Street light poles, traffic signal poles: small wireless facilities attachments. Current Text: Amended: 4/12/2021 html pdfDesk Policy Fiscal Floor Desk Policy Fiscal Floor Conf.
Conc.Enrolled Vetoed Chaptered
1st House 2nd HouseSummary:Requires cities and electric POUs to make space and capacity on utility poles, street light poles, trafficsignal poles, and supporting structures for telecom providers. Also adds language that attachment feesand cost estimates must be “nondiscriminatory” and “reasonable.”
MemoAmendments coming later in April will remove all references to utility poles.
SUSTAINABILITY
AB 33 (Ting D) Energy Conservation Assistance Act of 1979: energy storage systems and transportationelectrification infrastructure.
Current Text: Amended: 3/16/2021 html pdfDesk Policy Fiscal Floor Desk Policy Fiscal Floor Conf.
Conc.Enrolled Vetoed Chaptered
1st House 2nd HouseSummary:Through an existing account, this bill requires the CEC to provide grants and loans to localgovernments and public institutions to maximize energy use savings, expand installation of energystorage systems, and expand the availability of transportation electrification infrastructure.
AB 970 (McCarty D) Planning and zoning: electric vehicle charging stations: permit application: approval. Current Text: Introduced: 2/18/2021 html pdf
Desk Policy Fiscal Floor Desk Policy Fiscal Floor Conf.Conc.
Enrolled Vetoed Chaptered1st House 2nd House
Summary:Provides that a residential charging station permit is approved within 15 days of submittal if certaincriteria are met, including that the applicant has already obtained all required approvals from a POU.
AB 1395 (Muratsuchi D) Greenhouse gases: carbon neutrality. Current Text: Introduced: 2/19/2021 html pdfDesk Policy Fiscal Floor Desk Policy Fiscal Floor Conf.
Conc.Enrolled Vetoed Chaptered
1st House 2nd HouseSummary:Would declare the policy of the state to achieve carbon neutrality as soon as possible, but no laterthan 2045, and to achieve and maintain net negative greenhouse gas emissions thereafter.
Page 7/10
Memosssss
AB 1500 (Garcia, Eduardo D) Safe Drinking Water, Wildfire Prevention, Drought Preparation, Flood Protection,Extreme Heat Mitigation, and Workforce Development Bond Act of 2022.
Current Text: Introduced: 2/19/2021 html pdfDesk Policy Fiscal Floor Desk Policy Fiscal Floor Conf.
Conc.Enrolled Vetoed Chaptered
1st House 2nd HouseSummary:If approved by voters, would provide bond funding to finance projects for safe drinking water, wildfireprevention, drought preparation, flood protection, extreme heat mitigation, and workforce developmentprograms.
SB 31 (Cortese D) Building decarbonization. Current Text: Amended: 3/5/2021 html pdf
Desk Policy Fiscal Floor Desk Policy Fiscal Floor Conf.Conc.
Enrolled Vetoed Chaptered1st House 2nd House
Summary:Requires the CEC to identify and implement programs to promote existing and new buildingdecarbonization. For POUS, the bill allows us to use funds set aside for low-income/demand-sidemanagement programs on building decarb IF the entity implementing the decarbonization project(whether CPAU or a contractor) and its subcontractors at every tier pay prevailing wages.
SB 45 (Portantino D) Wildfire Prevention, Safe Drinking Water, Drought Preparation, and Flood Protection BondAct of 2022.
Current Text: Amended: 4/8/2021 html pdfDesk Policy Fiscal Floor Desk Policy Fiscal Floor Conf.
Conc.Enrolled Vetoed Chaptered
1st House 2nd HouseSummary:Enacts the Wildfire Prevention, Safe Drinking Water, Drought Preparation, and Flood Protection BondAct of 2022, which, if approved by the voters, would authorize bonds for $5.6 billion to finance projectsfor a wildfire prevention, safe drinking water, drought preparation, and flood protection program.
SB 68 (Becker D) Building decarbonization. Current Text: Amended: 4/8/2021 html pdf
Desk Policy Fiscal Floor Desk Policy Fiscal Floor Conf.Conc.
Enrolled Vetoed Chaptered1st House 2nd House
Summary:Requires the CEC to gather or develop, and publish on its website, guidance and best practices to helpbuilding owners, the construction industry, and local governments overcome barriers to electrification ofbuildings and installation of EV charging equipment.
WATER
AB 100 (Holden D) Drinking water: pipes and fittings: lead content. Current Text: Amended: 4/5/2021 html pdfDesk Policy Fiscal Floor Desk Policy Fiscal Floor Conf.
Conc.Enrolled Vetoed Chaptered
1st House 2nd HouseSummary:This bill limits the amount of lead leaching from faucets and fixtures to no more than 1 microgram, whichis five times lower than the current industry standard.
AB 460 (Mayes I) Fire protection: residential fire sprinklers: fees. Current Text: Amended: 3/25/2021 html pdf
Page 8/10
Desk Policy Fiscal Floor Desk Policy Fiscal Floor Conf.Conc.
Enrolled Vetoed Chaptered1st House 2nd House
Summary:This bill would, among other things, prohibit water-related fees imposed on the owner of residentialproperty from being affected by the installation of a residential fire sprinkler system including thoseresidential fire sprinkler systems mandated by a local jurisdiction or a fire protection district.
MemoTwo year bill.
AB 588 (Garcia, Eduardo D) California Safe Drinking Water Act: compliance. Current Text: Amended: 3/30/2021 html pdf
Desk Policy Fiscal Floor Desk Policy Fiscal Floor Conf.Conc.
Enrolled Vetoed Chaptered1st House 2nd House
Summary:Consistent with federal law, requires the Water Board to establish a compliance period between 30days and three years for meeting specified drinking water regulations.
AB 1434 (Friedman D) Urban water use objectives: indoor residential water use. Current Text: Introduced: 2/19/2021 html pdfDesk Policy Fiscal Floor Desk Policy Fiscal Floor Conf.
Conc.Enrolled Vetoed Chaptered
1st House 2nd HouseSummary:Starting in 2023, this bill would incrementally lower the standard for indoor residential water use untilwe reach 40 gallons per capita daily by January 1, 2030. The current standard has us at 50 gallons by2030, or whatever number DWR studies recommend. This bill also eliminates the need for DWR toconduct any studies.
MemoCMUA opposes. 2018's urban water use objectives haven’t gone into effect yet, so these proposedchanges are troublesome and inappropriate.
SB 222 (Dodd D) Water Rate Assistance Program. Current Text: Amended: 4/5/2021 html pdfDesk Policy Fiscal Floor Desk Policy Fiscal Floor Conf.
Conc.Enrolled Vetoed Chaptered
1st House 2nd HouseSummary:Establishes the Water Rate Assistance Fund to help provide water affordability assistance, for bothdrinking water and wastewater services, to low-income ratepayers and ratepayers experiencingeconomic hardship. Long term funding mechanism is unclear.
SB 223 (Dodd D) Discontinuation of residential water service. Current Text: Amended: 4/5/2021 html pdf
Desk Policy Fiscal Floor Desk Policy Fiscal Floor Conf.Conc.
Enrolled Vetoed Chaptered1st House 2nd House
Summary:Would prohibit water systems from discontinuing residential service for nonpayment during a state orlocal emergency. The bill would prohibit these systems from discontinuing residential water service fornonpayment until a payment by a customer has been delinquent for at least 120, rather than 60, daysand the total amount of the delinquency, exclusive of late charges and interest, is at least $400. Thebill would also prohibit these systems from discontinuing residential water service for nonpayment to amaster-metered multifamily residence with at least 4 units or to a master-metered mobilehome park.The bill also requires water systems to waive fees for disconnection and reconnection of service tohouseholds with income below 200% of the federal poverty line.
SB 323 (Caballero D) Local government: water or sewer service: legal actions. Current Text: Amended: 3/17/2021 html pdfDesk Policy Fiscal Floor Desk Policy Fiscal Floor Conf.
Conc.Enrolled Vetoed Chaptered
1st House 2nd House
Page 9/10
Summary:This bill creates a statute of limitations for legal challenges to water and sewer service charges thatare adopted after January 1, 2022.
SB 351 (Caballero D) Water Innovation Act of 2021. Current Text: Introduced: 2/9/2021 html pdf
Desk Policy Fiscal Floor Desk Policy Fiscal Floor Conf.Conc.
Enrolled Vetoed Chaptered1st House 2nd House
Summary:Sponsored by CMUA, this bill would create the Office of Water Innovation for the furtherance of newtechnologies and other innovative approaches in the water sector. By December 31, 2023,the Officeshall take specified measures to advance innovation in the water sector. The bill would further createthe Water Innovation Fund for the furtherance of water innovation.
SB 427 (Eggman D) Water theft: enhanced penalties. Current Text: Amended: 4/12/2021 html pdfDesk Policy Fiscal Floor Desk Policy Fiscal Floor Conf.
Conc.Enrolled Vetoed Chaptered
1st House 2nd HouseSummary:Authorizes a local government to make any violation of a local ordinance regarding water theft subjectto an administrative fine in excess of current legal limits.
SB 526 (Min D) Community water systems: lead user service lines. Current Text: Introduced: 2/17/2021 html pdf
Desk Policy Fiscal Floor Desk Policy Fiscal Floor Conf.Conc.
Enrolled Vetoed Chaptered1st House 2nd House
Summary:This bill would, until January 1, 2025, require a community water system to remove or replace the fulllead user service line, if the water system disturbs, removes, or replaces a portion of the line. There isno definition of “full lead service line” in the bill but that typically includes the lateral from the meter tothe home.
MemoBill should be amended later in April to include a definition, which may focus on goosenecks and similarparts rather than lines.
Total Measures: 48Total Tracking Forms: 48
Page 10/10