Embed Size (px)
Citation preview

City of Sunnyvale | Flood/Retaining Wall and Flood Gate Project Proposed Basis of Design Technical Memo
2365 Iron Point Rd. Suite 300 Folsom, CA 95630
T 916.817.4700 hdrinc.com
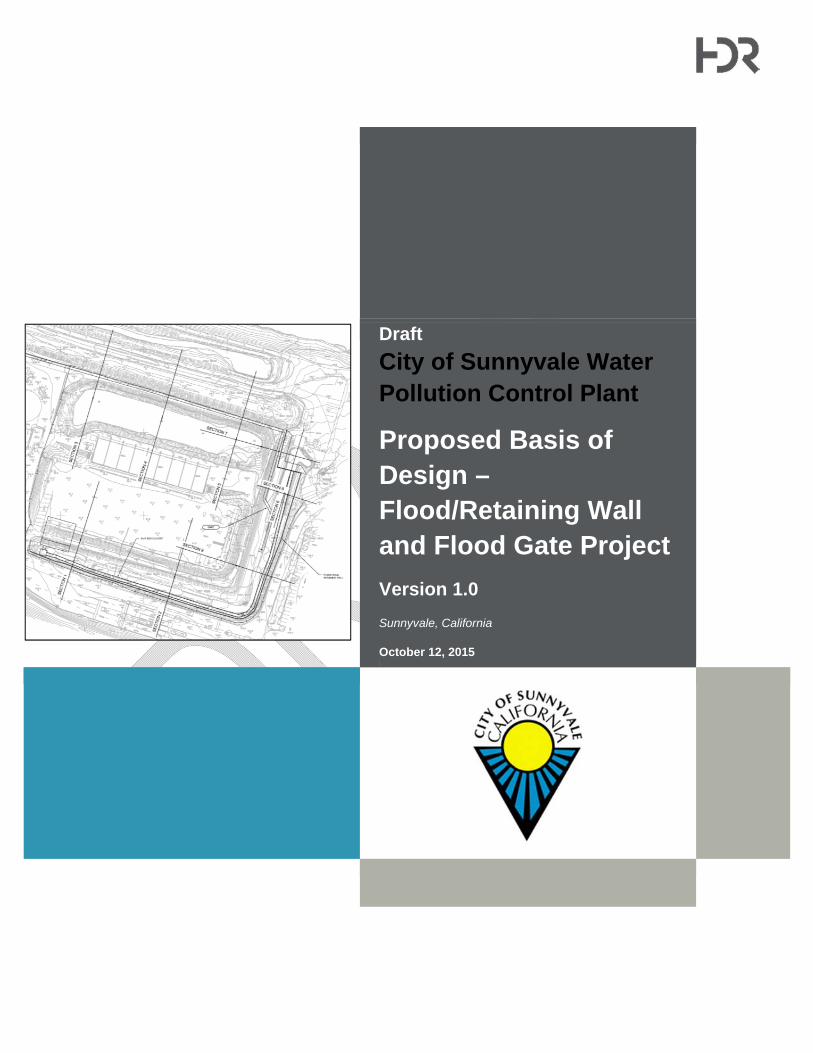
CITY OF SUNNYVALE
POLLUTION CONTROL PLANT
PROPOSED BASIS OF DESIGN TECHNICAL MEMO - FLOOD/RETAINING WALL AND FLOOD GATE SLAB
Draft November 2015
Prepared By: ______________________
Wesley Jacobs, P.E.* (LA, MS, TX, GA, VA, NY)
Reviewed By: ______________________
Rob Natoli, P.E. Ronald Brown, P.E.* (WA, OR, AK, HI, OK)
Reviewed By: ______________________
Jamel Demir, P.E.
Reviewed By:______________________
James Wickstrom, P.E.

This page left blank intentionally

2365 Iron Point Rd. Suite 300 Folsom, CA 95630
T 916.817.4700 hdrinc.com
Contents 1.0 Introduction ................................................................................................................................... 4
1.1 Purpose and Scope ................................................................................................................... 4
1.2 Project Background and Description ......................................................................................... 4
2.0 Design 100-year Water Surface Elevation and Freeboard ............................................................ 4
3.0 Floodwall Design ........................................................................................................................... 5
3.1 Criteria ....................................................................................................................................... 5
3.1.1 Cantilever Type Flood Wall (T-Walls) ............................................................................ 5
3.1.2 T-wall with Pile Foundation ............................................................................................ 6
3.1.3 Cantilever Sheet Pile Flood Wall (I-wall) ........................................................................ 6
3.1.4 Flood Gate Base Slab .................................................................................................... 6
Appendices
Appendix A – Basis of Design Report
Appendix B – Draft Similitude Analysis Report

2365 Iron Point Rd. Suite 300 Folsom, CA 95630
T 916.817.4700 hdrinc.com
1.0 Introduction 1.1 Purpose and Scope The purpose of this Technical Memorandum summary and Basis of Design Report (BOD) is to describe the flood control features proposed as part of the renovation of the existing City of Sunnyvale Water Pollution Control Plant (WPCP) so that the facility can continue to properly treat and dispose of municipal sewage for the next 75 years. To continually provide service for the next 75 years, the WPCP must secure a minimum level of flood protection against the 1-percent annual chance flood. A flood wall was designed (Task 1.1 of the scope of work) using both T-Wall and I-Wall sections design for soil retaining loads and flood loads per requirements of the Federal Emergency Management Agency (FEMA) and the United States Army Corps of Engineers (USACE) guidelines. Included in this design is the foundation for the floodgate that is to be designed in Sunnyvale WPCP Package 2. This BOD is a detailed look at the design criteria and parameters (attached as Appendix A) and will serve as the foundation for the work to be completed.
The scope of work includes these task items:
Hydraulic and Wave Analysis for Floodwall Design Loading
T-Wall Design of the Southern and Eastern Regions of the WPCP.
I-Wall Design of the Northern Region of the WPCP.
Floodgate Foundation Design at the south western terminus of the T-Wall.
1.2 Project Background and Description For the WPCP to provide uninterrupted services for the next 75 year, the WPCP must obtain a minimum 100-year level of flood protection to reduce some of the risk of flooding of their facilities. The WPCP is surrounded by both tidal flooding on the northern side and riverine flooding on the east and west sides. Currently, Santa Clara Valley Water District (SCVWD) is developing a design to improve capacity of the Sunnyvale East and West Channels that will contain the 100-year Still Water Elevation (SWE) event as well as consider sea level rise over the next 50 years.
2.0 Design 100-year Water Surface Elevation and Freeboard
Hydraulic and wave analysis is a key element to designing flood walls per USACE guidance; these are feature load cases that many times govern the design of the flood wall. Hydrostatic load on a portion of the wall is not sufficient to satisfy the criteria. The hydraulic and wave loading analysis summarized in this section were performed for the purpose of:
Computing wave forces using USACE’s Coastal Engineering Manual (EM) 1110-2-1100 guidance.
Providing a recommendation for the 100-year design water surface elevation (SWE) and required freeboard considering wave run-up and satisfying FEMA’s 44 CFR 65.10 regulations.
The 2014 BakerAECOM study titled, “A South San Francisco Bay Coastal Flood Hazard Study” indicated that the “South Bay study did not model swell waves because swell from the Pacific Ocean do not penetrate into the south San Francisco Bay” (BakerAECOM, March 28, 2014). The study did consider wind induced waves but found that for Transect 11 these were negligible, with wave heights less than one

2365 Iron Point Rd. Suite 300 Folsom, CA 95630
T 916.817.4700 hdrinc.com
(1) ft. Nevertheless, for the purpose of evaluating potential wave loads on the proposed flood wall the values generated in the 2014 study were implemented using USACE guidance.
The 2014 study only considered wave runup for transects with wave heights greater than one foot. With a review of the terrain characteristics in the vicinity of the proposed flood wall, coupled with a design wave height of 0.6 feet, it was estimated that wave runup would be less than one foot. As a result, two feet of freeboard was applied to the SWE, per 44 CFR 65.10, to set the minimum top of flood wall elevation. Therefore, a SWE of 12 ft plus an additional 2.0 ft of freeboard sets the proposed top of floodwall at 14.0 feet.
3.0 Floodwall Design 3.1 Criteria Criteria used for the WPCP floodwalls is based on published federal technical guidance documents, including USACE Engineering Manuals, (EMs), Engineering Regulations, (ERs), and Engineering Technical Letters, (ETLs). Design criteria in the most recent publications supersede previous publications. This includes design criteria for flood wall stability and strength.
Based on recommendations and discussions with the City of Sunnyvale, two floodwall designs are proposed.
1. Cantilever T-Type (T-walls) 2. Cantilever Sheet Pile (I-walls)
Design criteria established for the proposed floodwall types will utilize the following USACE criteria:
Cantilever Type Flood Walls (T-walls)
EM 1110-2-2502 Retaining and Flood Walls EM 1110-2-2100 Stability Analysis of Concrete Structures EM 1110-2-2104 Strength Design of Reinforced-Concrete Hydraulic Structures EM 1110-2-2906 Pile Design
Cantilever Sheet Pile Flood Walls (I-walls)
EM 1110-2-2504 Design of Sheet Pile Walls EC 1110-2-6066 Design of I-walls
3.1.1 Cantilever Type Flood Wall (T-Walls)
The T-walls were designed as retaining walls as well as flood walls as the eastern portion of the site is being raised as part of the plant process renovation. A majority of the flood wall designed will retain 8 ft. to 12 ft. of soil. There is a 40 foot section on the eastern alignment of flood wall that will require a pile foundation as a result of the loading conditions and estimated settlement (See Section 3.1.2). Since this perimeter risk reduction system is classified as a coastal flood wall system, seven load cases were examined for design per USACE guidance that included the 100 year SWE, wave loads, water to top of wall, earthquake, surcharge and construction loads. The walls were sized for stability, strength and serviceability to counteract these loading conditions. A sheet pile cut off wall is embedded into the base

2365 Iron Point Rd. Suite 300 Folsom, CA 95630
T 916.817.4700 hdrinc.com
slab and is driven down into the subgrade to prevent seepage under the wall during a flood condition. This is continuous through all of the T-wall monoliths on the south and eastern alignments.
3.1.2 T-wall with Pile Foundation
The Sunnyvale WPCP floodwall alignment traverses an existing ditch between stations 9+00 and 10+00. The approximate height of soil retained by this 40 foot monolith is 20 feet. Due to this height of soil and the anticipated settlement of approximately 6 inches; a shallow founded T-Wall section will not be adequate per the USACE required criteria. Consequently deep foundations were required to mitigate this issue. Prestressed, precast concrete piles were selected as the foundation elements that are sloped or battered with a 1:3 ratio. Similar load cases were considered for this section as noted for the shallow founded flood wall sections.
3.1.3 Cantilever Sheet Pile Flood Wall (I-wall)
On the northern alignment, I-wall sections have been considered for design as the overall wall height or “stick up” is less than six feet (limited by new USACE guidance EC 1110-2-6066). This portion of the alignment would be subject to similar hydraulic loading conditions as noted above for T-walls. The sheet pile wall sections will be sized for length and strength in flexure based on the geotechnical stability analysis provided by the Fugro. The proposed I-wall section is a steel sheet pile section topped off with a reinforced concrete cap that is embedded approximately 1 – 2 ft below grade. Its appearance above grade will match the T-wall sections. During previous iterations, vinyl sheet pile was considered due to the potentially corrosive soils on site; however, per USACE guidance, vinyl is not allowed for mainline I-walls. Concrete sheet pile was also considered as an alternative for this reason but was dismissed due to potential difficulties in driving the sheets and the higher cost.
Based on the Floodwall Sheet Pile Similitude Corrosion Rate Analysis Technical Memorandum dated February 27, 2015 conducted for the site (See Appendix B), the use of steel sheet piles will require mitigation for corrosion protection. The recommendations in the tech memo were taken into consideration as well as the guidance provided in the USACE EM’s coupled with previous experience. Coating the steel sheet piles with a coal tar epoxy or bituminous coating system is an acceptable mitigation strategy for long term protection against corrosion. In addition to this, as a redundancy, a thicker steel sheet pile will be selected than what is required by design to counteract any additional potential corrosion that may be realized should the coating wear out or fail. This selection has been commonly used in USACE flood risk reduction projects all over the country with similar corrosive environments. The city of Sunnyvale, the program manager, and the designer discussed and concluded that a cantilever sheet pile I-wall would be the used for a portion of the floodwall.
3.1.4 Flood Gate Base Slab
At the entrance of the plant a passive bottom hinged floating flood gate system (by FloodBreak Inc.) is proposed. The base slab is being designed to withstand the axial, overturning and sliding forces that will be transferred from the flood gate superstructure. The geotechnical information used for the gate foundation design is taken from the Fugro Geotechnical Report, October, 2015. The foundation is designed for following load cases:
1: Flood gate open (down position) with HS-20 wheel loading 2: Flood gate closed (up position) with water to the top of the gate
The base slab was checked for overturning failure due to lateral hydrostatic load, bearing failure due to dead load of the slab and vertical hydrostatic load, and also for sliding due to lateral hydrostatic load. Due to the location on the southern portion of the alignment, hydrodynamic wave loadings are not applicable
2365 Iron Point Rd. Suite 300 Folsom, CA 95630
T 916.817.4700 hdrinc.com
for the gate foundation. The design resulted in a rectangular reinforced concrete slab that was 20 feet x 16 feet x 4 feet thick. The American Association of State Highway and Transportation Officials - AASHTO LRFD Bridge Design Specifications, Customary U.S. Units, 7th Edition, with 2015 Interim Revisions was used in conjunction to the applicable USACE criteria.
2365 Iron Point Rd. Suite 300 Folsom, CA 95630
T 916.817.4700 hdrinc.com
Appendix A –Basis of Design Report
Draft
City of Sunnyvale Water Pollution Control Plant
Proposed Basis of Design – Flood/Retaining Wall and Flood Gate Project
Version 1.0
Sunnyvale, California
October 12, 2015
City of Sunnyvale | Flood/Retaining Wall and Flood Gate Project Proposed Basis of Design
2365 Iron Point Rd. Suite 300 Folsom, CA 95630
T 916.817.4700 hdrinc.com
This page left blank intentionally

City of Sunnyvale | Flood/Retaining Wall and Flood Gate Project
Proposed Basis of Design
2365 Iron Point Rd. Suite 300 Folsom, CA 95630
T 916.817.4700 hdrinc.com
i
Contents 1.0 Introduction ................................................................................................................................... 3
1.1 Purpose and Scope ................................................................................................................... 3
1.2 Project Objectives ...................................................................................................................... 3
1.3 Project Background and Description ......................................................................................... 3
1.4 Proposed Alignment .................................................................................................................. 4
2.0 Existing Site Conditions ................................................................................................................. 5
2.1 WPCP ........................................................................................................................................ 5
3.0 Hydraulic and Wave Loading Analyses ......................................................................................... 5
3.1 Introduction ................................................................................................................................ 5
3.2 Data Collection and Previous Studies ....................................................................................... 6
3.3 Hydrodynamic Wave Forces Analysis ....................................................................................... 6
3.4 Design 100-year Water Surface Elevation and Freeboard ...................................................... 11
4.0 Floodwall Design ......................................................................................................................... 11
4.1 Criteria ..................................................................................................................................... 11
4.2 Top of Wall Elevation ............................................................................................................... 11
4.3 Geotechnical Criteria ............................................................................................................... 12
4.4 Structural Criteria ..................................................................................................................... 12
4.4.1 Cantilever T-Type Flood Wall ....................................................................................... 12
4.4.2 Cantilever Floodwall with Pile Foundation .................................................................... 15
4.4.3 Cantilever Sheet Pile Flood Wall .................................................................................. 15
5.0 Flood Gate Base Slab ................................................................................................................. 16

City of Sunnyvale | Flood/Retaining Wall and Flood Gate Project
Proposed Basis of Design
2365 Iron Point Rd. Suite 300 Folsom, CA 95630
T 916.817.4700 hdrinc.com
ii
Tables Table 1 – Summary of hydrodynamic wave forces calculations .......................................................... 9 Table 2. Load Case Categories (Adopted from USACE EM 1110-2-2100) ....................................... 13 Table 3. Summary of Adopted Criteria .............................................................................................. 14
City of Sunnyvale | Flood/Retaining Wall and Flood Gate Project
Proposed Basis of Design
2365 Iron Point Rd. Suite 300 Folsom, CA 95630
T 916.817.4700 hdrinc.com
3
1.0 Introduction 1.1 Purpose and Scope The purpose of this Proposed Basis of Design (BOD) is to renovate the existing City of Sunnyvale Water Pollution Control Plant (WPCP) so that the facility can continue to properly treat and dispose of municipal sewage for the next 75 years. To continually provide service for the next 75 years, the WPCP must secure a minimum level of flood protection against the 1-percent annual chance flood. A floodwall will be designed (Task 1.1 of the scope of work) using both T-Wall and I-Wall sections design for soil retaining loads and flood loads per requirements of the Federal Emergency Management Agency (FEMA) and the United States Army Corp of Engineers (USACE) guidelines. Included in this design is the foundation for the floodgate that is to be designed in Sunnyvale WPCP Package 2. This BOD is a detailed look at the design criteria and parameters(attached as Appendix A) and will serve as the foundation for the work to be completed.
The Scope of work includes these task items:
1. Hydraulic and Wave Analysis for Floodwall Design loading.
2. T-Wall Design of the Southern and Eastern Regions of the WPCP.
3. I-Wall Design of the Northern Region of the WPCP.
4. Floodgate Foundation Design at the South Western Edge of the T-Wall.
1.2 Project Objectives The objectives of the floodwall and floodgates include the following:
1. Design a flood protection system that minimizes long-term maintenance needs and associated costs.
2. Design a flood protection system based upon USACE EM’s Coastal (1110-2-1100), Stability of Concrete Structures (1110-2-2100), Concrete Design (1110-2-2104), Design of Sheet Pile Walls (1110-2-2504), and Retaining and Flood Walls (1110-2-2502).
3. Construct a flood protection system that protects against latest tidal and riverine study results (FEMA Preliminary FIRM and FIS reports, dated July 8, 2015).
1.3 Project Background and Description For the WPCP to provide uninterrupted services for the next 75 year, the WPCP must obtain a minimum 100-year level of flood protection to reduce some of the risk of flooding of their facilities. The WPCP is surrounded by both tidal flooding on the northern side and riverine flooding on the east and west sides. Currently, Santa Clara Valley Water District (SCVWD) is developing a design to improve capacity of the Sunnyvale East and West Channels that will contain the 100-year SWE event as well as consider sea level rise over the next 50 years. It is important to note, however, that bridge crossings over the Channels are not being upgraded as part of this project to contain sea level rise. Without these bridge improvements, flood waters will still be able to enter the WPCP
City of Sunnyvale | Flood/Retaining Wall and Flood Gate Project
Proposed Basis of Design
2365 Iron Point Rd. Suite 300 Folsom, CA 95630
T 916.817.4700 hdrinc.com
4
from the south under existing conditions. It is anticipated that these bridges will be retrofitted to protect against sea level rise in the future as it becomes a problem and more funding becomes available. It is also anticipated that, dependent upon funding, the USACE will proceed forward with the design and construction of tidal levee/floodwall protection along the southern portion of Pond A4. Currently, the levees surrounding the WPCP are not certified and do not meet Code of Federal Regulations (44 CFR 65.10) and USACE standards. The City of Sunnyvale has selected to incorporate flood protection against the 100-year flood elevation into its planned retaining wall so that flood protection can be secured at the WPCP as soon as possible.
On July 8, 2015, FEMA released updated Preliminary Flood Insurance Rate Map (FIRM) and Flood Insurance Study (FIS) Report documenting updated Still Water Elevations (SWE) at and surrounding the WPCP. The proposed alignment of the floodwall crossed over a breakline between two SWE of 11 and 12 feet (NAVD 88). The higher of the two SWEs, 12 feet (NAVD88), was selected for the SWE.
This floodwall will be designed to secure additional fill material for future plant expansions, act as a security/privacy wall from the public, and provide flood protection against the 100-year SWE event. At the entrance to the WPCP, a floodgate foundation will be designed for incorporation of a floodgate in a future project phase.
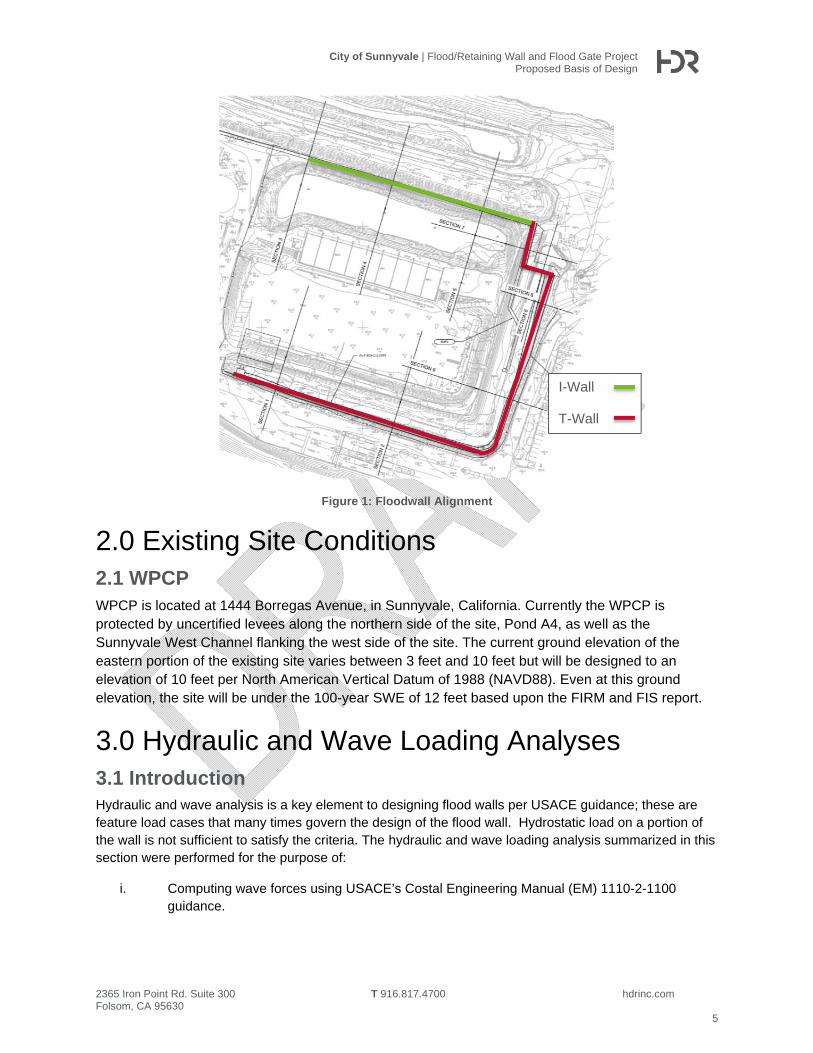
1.4 Proposed Alignment HDR Inc. has identified the alignment for the new flood protection system that will be evaluated in Task 1.1 (Figure 1). The following considerations were taken to develop this alignment:
Existing facilities and topography
New site plan including grade elevation raise and new structures
Site constraints such as required wall foot prints and maximization of useable area
Adjacent construction improvements such as the Sunnyvale West Channel
City of Sunnyvale | Flood/Retaining Wall and Flood Gate Project
Proposed Basis of Design
2365 Iron Point Rd. Suite 300 Folsom, CA 95630
T 916.817.4700 hdrinc.com
5
Figure 1: Floodwall Alignment
2.0 Existing Site Conditions 2.1 WPCP WPCP is located at 1444 Borregas Avenue, in Sunnyvale, California. Currently the WPCP is protected by uncertified levees along the northern side of the site, Pond A4, as well as the Sunnyvale West Channel flanking the west side of the site. The current ground elevation of the eastern portion of the existing site varies between 3 feet and 10 feet but will be designed to an elevation of 10 feet per North American Vertical Datum of 1988 (NAVD88). Even at this ground elevation, the site will be under the 100-year SWE of 12 feet based upon the FIRM and FIS report.
3.0 Hydraulic and Wave Loading Analyses 3.1 Introduction Hydraulic and wave analysis is a key element to designing flood walls per USACE guidance; these are feature load cases that many times govern the design of the flood wall. Hydrostatic load on a portion of the wall is not sufficient to satisfy the criteria. The hydraulic and wave loading analysis summarized in this section were performed for the purpose of:
i. Computing wave forces using USACE’s Costal Engineering Manual (EM) 1110-2-1100 guidance.
I-Wall
T-Wall
City of Sunnyvale | Flood/Retaining Wall and Flood Gate Project
Proposed Basis of Design
2365 Iron Point Rd. Suite 300 Folsom, CA 95630
T 916.817.4700 hdrinc.com
6
ii. Providing a recommendation for the 100-year design water surface elevation (still water elevation) and required freeboard considering wave run-up and satisfying FEMA’s 44 CFR 65.10 regulations.
3.2 Data Collection and Previous Studies BakerAECOM performed a study of coastal flood hazards in the vicinity of the project site. The analysis and results from this study were summarized in 2014 stufy titled “A South San Francisco Bay Coastal Flood Hazard Study” (BakerAECOM, March 28, 2014). FEMA released Santa Clara County’s Preliminary Flood Insurance Study results in June 2015. The results of this study were used to compute wave forces on the proposed floodwall as well as setting the ultimate top of floodwall elevation for design. HDR did not perform any additional hydraulic modeling, but used the parameters and findings provided by FEMA and their mapping partners.
3.3 Hydrodynamic Wave Forces Analysis HDR reviewed the Preliminary Santa Clara County FIRM map (No. 06085C0042K) dated July 8, 2015 and determined that coastal Transect 11, located approximately 500 ft. east of the floodwall alignment, was representative of the project site conditions. The topography of the project site is complex due to man made berms that extend across the shoreline and around old salt ponds. These berms are not designed for flood control or accredited by FEMA; therefore, partial failure of these embankments was considered as part of the 2014 study titled, “A South San Francisco Bay Coastal Flood Hazard Study” (BakerAECOM, March 28, 2014)”. This is consistent with the conditions that the project floodwall is likely to encounter if engaged with coastal flooding.
The BakerAECOM 2014 study indicated that the “South Bay study did not model swell waves because swell from the Pacific Ocean do not penetrate into the south San Francisco Bay” (BakerAECOM, March 28, 2014). The study did consider wind waves but found that for Transect 11 these were negligible, with wave heights less than one (1) ft. Nevertheless, for the purpose of evaluating potential wave loads on the proposed floodwall the values generated in the 2014 were implemented using USACE guidance.
The USACE’s EM-1110-2-1100 was referenced for developing wave loads. As per the wave conditions described in the 2014 study only non-breaking waves were considered. Given the terrain in the vicinity of the floodwall alignment the following configuration was considered (Figure 2); a rubble (rock slope protection) layer was not included in the preliminary floodwall design but should be considered.

City of Sunnyvale | Flood/Retaining Wall and Flood Gate Project
Proposed Basis of Design
2365 Iron Point Rd. Suite 300 Folsom, CA 95630
T 916.817.4700 hdrinc.com
7
Figure 2: Floodwall configuration evaluated including wave load parameters (USACE, 2011).
The USACE’s EM-1110-2-1100 describes the following relationships (Goda, 1974) for Figure 1 parameters (Figure 3).

City of Sunnyvale | Flood/Retaining Wall and Flood Gate Project
Proposed Basis of Design
2365 Iron Point Rd. Suite 300 Folsom, CA 95630
T 916.817.4700 hdrinc.com
8
Figure 3: Goda Formula for Irregular Waves (Goda 1974; Tanimoto et al. 1976 - USACE, 2011)
A Wave Height Analysis for Flood Insurance Study (WHAFIS) was performed as part of the 2014 study. The results of the WHAFIS in the vicinity of the recommended floodwall are illustrated in Figure 4.

City of Sunnyvale | Flood/Retaining Wall and Flood Gate Project
Proposed Basis of Design
2365 Iron Point Rd. Suite 300 Folsom, CA 95630
T 916.817.4700 hdrinc.com
9
Figure 4: Wave Crest and 1-percent Stillwater Elevation at Project Site (BakerAECOM, March 28, 2014)
Given the relationships in Figures 2 & 3 and parameters derived from Figure 4 and the 2014 study; HDR found the following:
Table 1 – Summary of hydrodynamic wave forces calculations
Variable Description Value Units
h*
0.9 ft
p1
22.2 lbf/ft
2
p2
0.0 lbf/ft
2
p3
12.8 lbf/ft
2
pu 12.7
b Angle of incidence of Wave (angle between wave crest and structure)
0.0 degrees
Hdesign Design wave height defined as the highest wave in the design sea state at a location just in front of the breakwater.
0.6 ft.
City of Sunnyvale | Flood/Retaining Wall and Flood Gate Project
Proposed Basis of Design
2365 Iron Point Rd. Suite 300 Folsom, CA 95630
T 916.817.4700 hdrinc.com
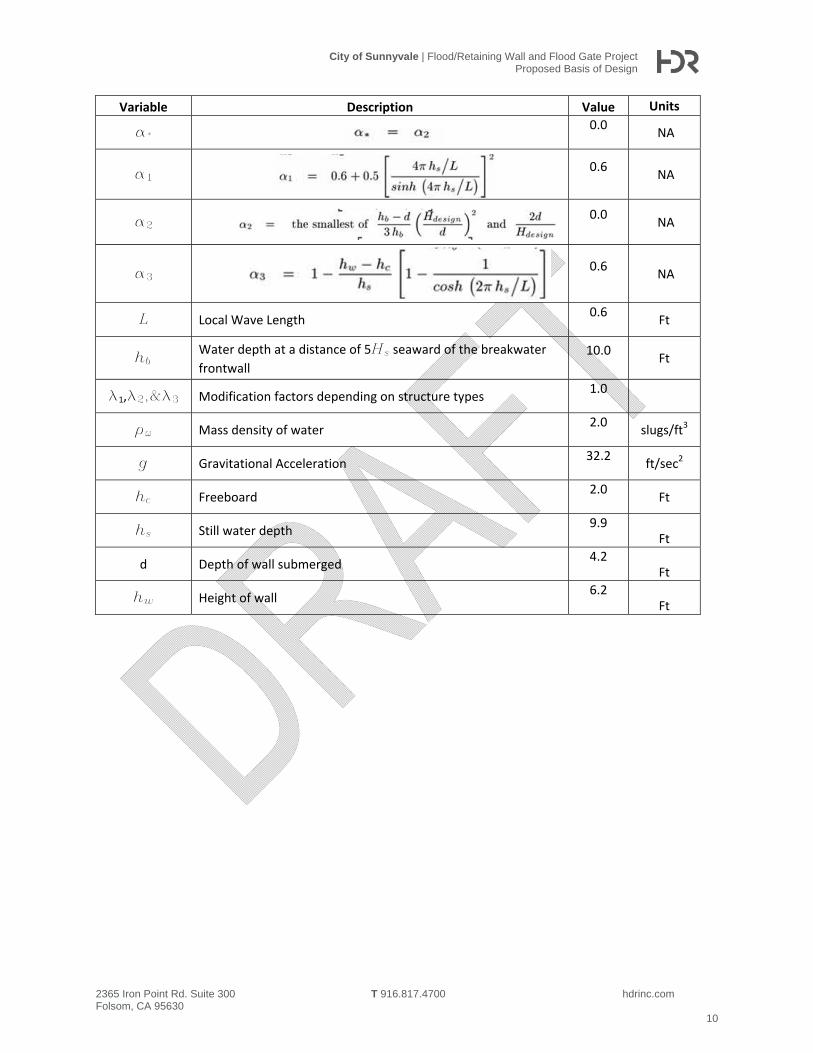
10
Variable Description Value Units
a*
0.0 NA
a1
0.6 NA
a2
0.0 NA
a3
0.6 NA
L Local Wave Length 0.6
Ft
hb Water depth at a distance of 5Hs seaward of the breakwater
frontwall
10.0 Ft
l1,l2,&l3 Modification factors depending on structure types 1.0
rw Mass density of water 2.0
slugs/ft3
g Gravitational Acceleration 32.2
ft/sec2
hc Freeboard 2.0
Ft
hs Still water depth 9.9
Ft
d Depth of wall submerged 4.2
Ft
hw Height of wall 6.2
Ft

500 108th Ave., NE, Suite 1200 Bellevue, WA 98004-5549
T 425.450.6200 hdrinc.com
3.4 Design 100-year Water Surface Elevation and Freeboard FEMA’s 44 CFR 65.10 state that “for coastal levees, the freeboard must be established at one foot above the height of the one percent wave or the maximum wave runup (whichever is greater) associated with the 100-year Stillwater surge elevation at the site.” Additionally, 44 CFR 65.10 states, “under no circumstances, however, will a freeboard of less than two feet above the 100-year stillwater surge elevation be accepted.” The design of the floodwall shall comply with this regulation.
The 2014 study only considered wave runup for transects with wave heights greater than one foot. With a review of the terrain characteristics in the vicinity of the proposed floodwall, coupled with a design wave height of 0.6 feet, it was estimated that wave runup would be less than one foot. Since the wave runup was estimated as less than one foot, two feet of freeboard was applied to the SWE, per 44 CFR 65.10, to set the minimum top of floodwall elevation. Therefore, a SWE of 12 ft plus an additional 2.0 ft of freeboard sets the proposed top of floodwall at 14.0 feet.
4.0 Floodwall Design 4.1 Criteria Criteria used for the WPCP project are based on published federal technical guidance documents, including U.S. Army Corps of Engineer’s Engineering Manuals, (EMs), Engineering Regulations, (ERs), and Engineering Technical Letters, (ETLs). Design criteria in the most recent publications supersede previous publications. This includes design criteria for flood wall stability and strength.
Design criteria established for the following flood wall types will follow USACE criteria:
Cantilever T-Type Wall
EM 1110-2-2502 Retaining and Flood Walls
EM 1110-2-2100 Stability Analysis of Concrete Structures
EM 1110-2-2104 Strength Design of Reinforced-Concrete Hydraulic Structures
Sheet Pile Wall
EM 1110-2-2502 Retaining and Flood Walls
EM 1110-2-2504 Design of Sheet Pile Walls
EC 1110-2-6066 Design of I-walls
4.2 Top of Wall Elevation The top of wall elevation for the floodwall must be based on USACE, FEMA, and newly publish FIS report and FIRM. Key considerations should include the following:
Regulatory Requirements on freeboard and recurrence intervals to be used in design
Results of wind and wave evaluation

500 108th Ave., NE, Suite 1200 Bellevue, WA 98004-5549
T 425.450.6200 hdrinc.com
Freeboard
Settlement
For this project, the top of wall design elevation is 14 feet.
4.3 Geotechnical Criteria The geotechnical investigation identified the type and distribution of foundation materials to determine material parameters for use in flood wall design (See Fugro Geotechnical Report, October, 2015). The geotechnical information will be used to select the foundation type and depth, design the flood wall / retaining wall system, estimate earth pressures, locate the ground-water level, estimate settlements, and identify potential construction problems.
For both the Cantilever T-Type and the Cantilever Sheet Pile Flood Wall, the results of the Geotechnical Investigation will be used to determine the relevant design parameters for each soil type encountered.
4.4 Structural Criteria 4.4.1 Cantilever T-Type Flood Wall
Floodwalls will be designed per EM 1110-2-2100 and EM 1110-2-2502. These floodwalls will be designed as retaining walls because a substantial part of the eastern portion of the WPCP site ground elevation is being raise to 10 ft. as part of the site renovation. A majority of the floodwall designed will retain 8 ft. to 12 ft. of soil. There is a 40 foot section of retaining wall that will have a deep foundation support of piles due to a need for approximately 20 foot of soil retained.
Four load cases will be examined for design of the flood wall. Cases C1 through C2c as specified in EM 1110-2-2502, Section 4-5, for coastal flood walls. These include; Case CI1 – Surge Still Water Elevation (~100 YR SWE), Case C2A – Nonbreaking Wave Load, Case C2b – Breaking Wave Load, Case C2c – Broken Wave Load, and note that coastal load cases C3 through C5 are checked within the retaining wall design. An additional case to be considered is when the wall has a WSE to the top of the wall.
Three load cases will be examined for design of the retaining wall. Cases R1 through R3 as specified in EM 1110-2-2502, Section 4-3, for retaining walls. These include; Case R1 – Usual Loading, Case R2 – Unusual Loading (Surcharge Load), Case R3 – Earthquake Loading.
These load cases will be assigned categories per EM 1110-2-2100 based on the expected return period, including; usual, unusual, and extreme. Table 1 was adopted from EM 1110-2-2100 and summarizes the load case categories. The EM provides guidance for increasing the allowable bearing capacity and decreasing the sliding factor of safety criteria, depending on the return period. These changes are also summarized in Table 2. An additional factor of safety of 2 for usual, and 1.5 for unusual load cases for soil bearing capacity was used due to the uncertainty of soil variation and floodwall placement conditions. For the design of the Floodwall, a hydraulic factor of 1.69 was used per ACI 318 and EM 1110-2-2104.

500 108th Ave., NE, Suite 1200 Bellevue, WA 98004-5549
T 425.450.6200 hdrinc.com
Table 2. Load Case Categories (Adopted from USACE EM 1110-2-2100)
Load Case Category Return Period Notes Usual Less than or equal to 10 years No changes to criteria Unusual Greater than 10 years but less
than 300 years Increase qall by 15% Decrease Sliding FS to 1.3
Extreme Greater than 300 years Increase qall by 50% Decrease Sliding FS to 1.1
Case C1 – 100-Year SWE
This load case is classified as an unusual load case because it has a return period greater than 10 years. This results in a 15% increase to the qult and a decreased sliding factor of safety of 1.3 per EM 1110-2-2100. The SWE examined reached a height of 12 ft.
Case C2a – Unbroken Wave Load
This load case is classified as an unusual load case because the return period is approximately 100 years. As such, qult was increased by 15% and the minimum factor of safety for sliding was decreased to 1.3. The maximum unbroken wave force was approximately 11 lbs/ft^2.
Case C2b – Breaking Wave Load
This load case is classified as an unusual load case because the return period is approximately 100 years. As such, qult was increased by 15% and the minimum factor of safety for sliding was decreased to 1.3. This load case was not examined because for the 100-Year SWE, the breaking wave force was negligible.
Case C2c –Broken Wave Load
This load case is classified as an unusual load case because the return period is approximately 100 years. As such, qult was increased by 15% and the minimum factor of safety for sliding was decreased to 1.3. This load case was not examined because for the 100-year SWE, the broken wave force was negligible.
Case R1 – Normal Operations
This load case is classified as a usual load case because it has a return period less than 10 years. The sliding factor of safety for this case is 1.5. When subjected to overturning loads, the entire width of the wall base must remain in compression. The factor of safety for bearing capacity is 3.0 per EM 1110-2-2502.
Case R2 – Construction
This load case simulates loading on the wall during construction and is classified as an unusual load case resulting in a 15% increase to the qult and a decreased sliding factor of safety of 1.3. For this design, a surcharge of 300 lbs/ft^2 was used and applied based upon the Fugro Geotechnical Report. (See Fugro Geotechnical Report, Sept. 2015)

500 108th Ave., NE, Suite 1200 Bellevue, WA 98004-5549
T 425.450.6200 hdrinc.com
CaseR3 – Earthquake
This load case is classified as an unusual load case because the return period is approximately 100 years. As such, qult would be increased by 15% and the minimum factor of safety for sliding was decreased to 1.3. The earthquake loading for the floodwall has a return period of approximately 480 years per Fugro Geotechnical Report. (See Fugro Geotechnical Report, October, 2015) This return period makes the earthquake load condition fall under the extreme load case.
Table 3. Summary of Adopted Criteria
Load Case Sliding FS Overturning RR Location Bearing FS
Case R1 1.50 0.333 < RR < 0.50 3.00 Case I1 1.30 0.333 < RR < 0.50 3.00 Case I2 1.10 0.25 < RR < 0.333 2.00 Case I3 1.30 RR within Bwall >1.00 Case I4 1.30 0.25 < RR < 0.333 2.00
Table 2 summarizes the criteria applied to the Cantilever T-Type flood wall. The values will be selected in accordance with EM 1110-2-2502 and EM 1110-2-2100. These values reflect the different factors of safety that are defined for the load case return periods.
The geometry of Cantilever T-Type Flood Walls will be determined by performing a stability analysis in accordance with EM 1110-2-2502 Retaining and Flood Walls, and EM 1110-2-2100 Stability Analysis of Concrete Structures, as applicable. The governing modes of failure are determined.
The modes of failure to be examined are as follows:
Sliding:
Sliding failure occurs when the calculated driving loads on the floodwall are greater than the available resistance of the floodwall/soil interface and the passive soil resistance. The sliding analysis is conducted along a shear plane along the foundation bottom, referred to as a “wedge.”
Overturning:
Overturning analysis calculates moments about the landside toe of the floodwall to ensure that the net loads on the wall will not cause it to overturn. EM 1110-2-2502 requires that the calculated resulting moment about the landside toe be located within a range of values along the base of the floodwall, which is dependent on the load case. This requirement is expressed as a ratio of the resultant location, XR, over the base width. This ratio is denoted as the resultant ratio, RR.
Bearing:
The bearing capacity of the soil is determined to ensure that the foundation soil possesses adequate strength when loading from the floodwall is applied. This analysis is

500 108th Ave., NE, Suite 1200 Bellevue, WA 98004-5549
T 425.450.6200 hdrinc.com
completed along the wedge analysis failure plane. The total normal loads are compared against the ultimate bearing capacity of the soil, resulting in an FOS that is compared to the criteria.
4.4.2 Cantilever Floodwall with Pile Foundation
The Sunnyvale WPCP floodwall design includes a portion of terrain that is much deeper than the rest due to a pre-existing ditch between stations 9+00 and 10+00. The total amount of soil retained by this portion of wall is 20 feet for an approximate length of 40 feet. Due to this height of soil and the anticipated settlement of approximately 6 inches; a traditional Cantilever T-Wall section will not pass the USACE required factor of safety. The solution concluded from the given constraints is to design this portion of floodwall with a battered pile foundation. See the Cantilever T-Type Floodwall section for load cases and factors of safety per usual, unusual, and extreme loading. The design criteria used for the pile foundation is EM 1110-2-2906.
4.4.3 Cantilever Sheet Pile Flood Wall
Evaluations were performed for seepage, slope stability, and settlement for the two idealized sections. Full narratives of the geotechnical analysis are found in the Fugro Geotechnical Report, October, 2015. A summary of the analysis is presented below.
Originally, a vinyl I-wall was considered due to the potentially corrosive soils on site; however, per USACE (2010) EM 1110-2-6066, vinyl is not allowed for mainline I-walls. Concrete sheet pile was considered, but based on the stiff soil conditions and the potential for difficult drivability, it was concluded that a concrete sheet pile section will not be feasible.
Based on the Floodwall Sheet Pile Similitude Corrosion Rate Analysis Technical Memorandum dated February 27, 2015 conducted for the site, the use of steel sheet piles will require mitigation for corrosion protection. The recommendations in the tech memo were taken into consideration as well as the guidance provided in the USACE EM’s coupled with previous experience. Coating the steel sheet piles with a coal tar epoxy or bituminous coating system is an acceptable mitigation strategy for long term protection against corrosion. In addition to this, as a redundancy, a thicker steel sheet pile will be selected than what is required by design to counteract any additional potential corrosion that may be realized should the coating wear out or fail. This selection has been commonly used in USACE flood risk reduction projects all over the country with similar corrosive environments. The city of Sunnyvale, the program manager, and the designer discussed and concluded that a cantilever sheet pile I-wall would be the used for a portion of the floodwall.
Geotechnical - Design criteria and methodology was developed primarily from EM 1110-2-6066 provides interim guidance for I-wall design as indicated in ECB 2014-18. ETL 1110-2-575 is for evaluation of existing I-walls; however, aspects of that document were also used. Evaluations were performed using CWALSHT and GEO-SLOPE International (2013a, b, c), GeoStudio software Version 8.14.1.10087, SEEP/W, SLOPE/W, and SIGMA/W. Steady seepage evaluations were performed for the top of wall conditions. Design tip elevations, bending moments, shear forces were computed using CWALSHT for several design scenarios for top of wall water level and strength conditions, as summarized herein. The sheet pile section was sized to accommodate the bending moments presented in the geotechnical analysis. Rapid drawdown analyses were not performed as
500 108th Ave., NE, Suite 1200 Bellevue, WA 98004-5549
T 425.450.6200 hdrinc.com
flood levels are attributed to diurnal tidal fluxes, which will not last long enough to result in sustained, long-term water level on the protected side of the floodwall.
5.0 Flood Gate Base Slab At the entrance of the plant a passive bottom hinged floating flood gate system (by FloodBreak Inc.) will be constructed. The foundation slab is being designed to withstand the axial, overturning and sliding forces that will be transferred from the flood gate superstructure. The geotechnical information used for the gate foundation design is taken from the Fugro Geotechnical Report, October, 2015. The foundation is designed for following load cases:
1: Flood gate open (down position) with HS-20 wheel loading
2: Flood gate closed (up positon) with water to the top of the gate
The flood elevation was provided by hydraulic analysis. The base slab was checked for overturning failure due to lateral hydrostatic load, bearing failure due to dead load of the slab and vertical hydrostatic load, and also for sliding due to lateral hydrostatic load. Due to the location on the southern portion of the alignment, hydrodynamic wave loadings are not applicable for the gate foundation.
The length of the slab will be determined by the gate opening. The width and depth of the slab will be determined by load cases and factor of safety consideration. The safety factor of overturning, sliding and bearing failure are based on EM 1110-2-2502: Retaining and Floodwall design. The live load criteria are based on AASHTO recommendations. A sheet pile cutoff wall will be designed at the bottom of the base slab to prevent seepage during flood events. The tip elevation of cutoff wall will be based on the geotechnical seepage analysis done for the adjacent T-wall sections.
Design criteria established for the following flood wall types will be using the following USACE criteria:
USACE, Strength Design for Reinforced-Concrete Hydraulic Structures, EM 1110-2-2104, June 30, 1992
American Association of State Highway and Transportation Officials - AASHTO LRFD Bridge Design Specifications, Customary U.S. Units, 7th Edition, with 2015 Interim Revisions

2365 Iron Point Rd. Suite 300 Folsom, CA 95630
T 916.817.4700 hdrinc.com
Appendix B –Draft Similitude Analysis Report

HDR# 213932 Department 028
hdrinc.com
431 W. Baseline Road, Claremont, CA 91711-1608 Page 1 of 14 City of Sunnyvale - Corrosion Rate Analysis
Date: Friday, February 27, 2015
Project: City of Sunnyvale Master Plan and Primary Treatment Design
Prepared For: Rob Natoli, PE, CDT HDR-Folsom
Prepared By: Mersedeh Akhoondan, PhD, and Brien Clark, PE, NACE CP4 HDR- Condition Assessment and Rehabilitation Group 431 W. Baseline Road, Claremont, CA 91711
Subject: Technical Memorandum: Flood Wall Sheet Pile Similitude Corrosion Rate Analysis
Introduction The City of Sunnyvale Master Plan and Primary Treatment Design project includes the installation
of a driven sheet pile flood wall. HDR Engineering, Inc. (HDR) was asked to provide a corrosion
rate analysis on the proposed sheet piles.
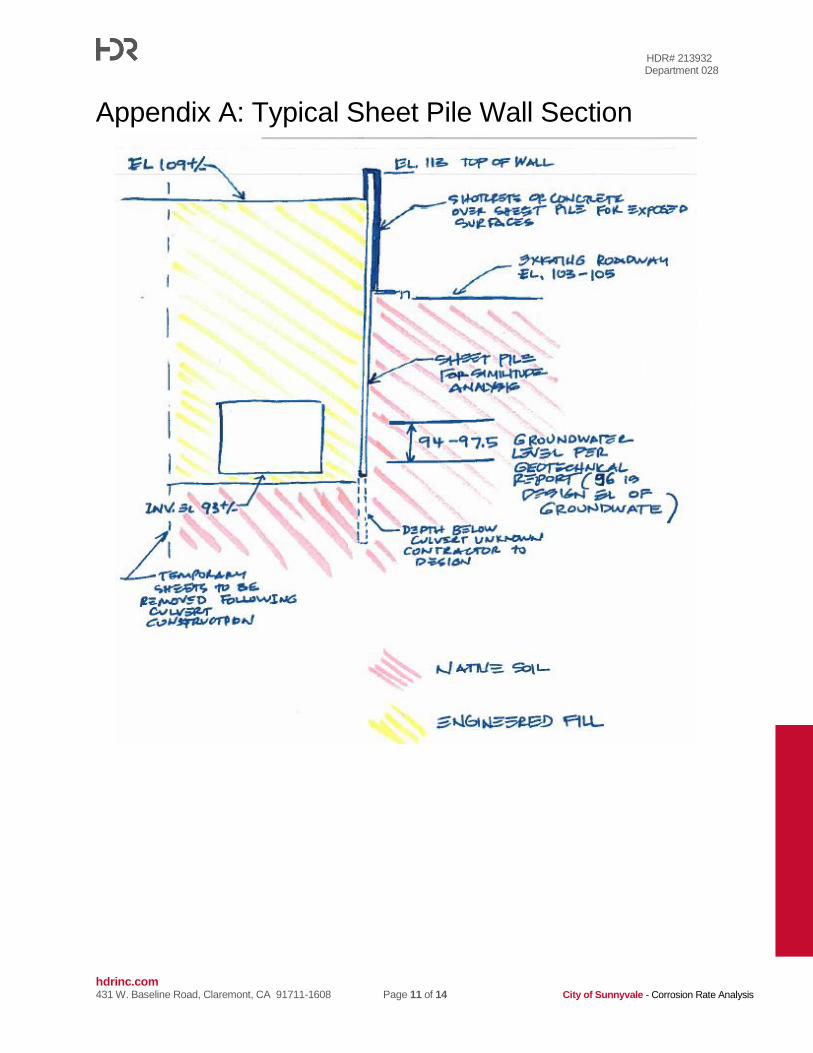
The sheet piles will be steel per ASTM A328. They will extend approximately 8 to 10 feet vertically
above an existing roadway on one side and approximately 4 feet above the backfill materials on
the other side. The native soil beneath the roadway is exposed to fluctuating groundwater
approximately 5 to 10 feet deep. A culvert pipe will be installed in the backfill side with an invert
approximately 16 feet below grade. The sheet pile will extend several feet below the elevation of
the culvert, with the final depth to be determined by the contractor. The sheet pile system is to be
constructed by continuous interlocking unless splices are allowed by the Design Engineer. Per
current design plans, the exposed surfaces of sheet piles are to be covered with concrete or
shotcrete. A typical section detail is provided in Appendix A.
Laboratory soil corrosivity tests were completed on three samples by Cerco Analytical in
November 12, 2013, under Cerco project No. 1310250. The test results can be found in
Appendix B. Laboratory soil corrosivity tests were also completed on six samples by HDR on soil
samples selected from the boring logs provided. The purpose of HDR’s testing was to substantiate
Cerco Analytical’s test results and to determine if the soils might have deleterious effects on
underground materials, including the sheet pile wall. HDR assumes that the samples tested are
representative of the most corrosive soils at the site.
The scope of this study is to conduct a similitude analysis based on the available soil corrosivity
data, drawings, and specifications in order to forecast the corrosion rate of embedded surfaces of
the sheet piles and to provide recommendations on corrosion mitigation techniques for extending
the service life of the structure.

HDR# 213932 Department 028
hdrinc.com
431 W. Baseline Road, Claremont, CA 91711-1608 Page 2 of 14 City of Sunnyvale - Corrosion Rate Analysis
Test Procedures The electrical resistivity of each soil sample tested by HDR was measured in a soil box per
ASTM G187 in its as-received condition and again after saturation with distilled water. Resistivities
are at about their lowest value when the soil is saturated. The pH of the saturated samples was
measured per CTM 643. A 5:1 water:soil extract from each sample was chemically analyzed for
the major soluble salts commonly found in soil per ASTM D4327, ASTM D6919, and Standard
Method 2320-B1. Sulfide and oxidation-reduction (redox) potential were determined per
ASTM G200 and AWWA C105 Appendix A. Laboratory analysis was performed under HDR
laboratory number 14-0592LAB and 14-0707LAB and the test results are shown in Appendix C.
Technical Background
CORROSION & CORROSION ALLOWANCE Corrosion is the primary durability limitation factor for attaining the designed service life of
major infrastructures such steel structures. Corrosion is an electrochemical reaction between a
material, usually a metal, and its environment that results in deterioration of the material and its
properties.
Sacrificial metal thickness or corrosion allowance refers to the thickness of metal, exceeding what
is structurally required, needed to compensate for the loss of metal that will occur as the structural
member corrodes. Service life of metallic structures is typically referred to the period from first
exposure to first perforation in case of pipelines or to the time that structural integrity is
compromised.
SOIL CORROSIVITY Soils contain chemical constituents that may react with buried construction materials, such as
concrete and ferrous metals. The chemical reaction taking place between soil and buried structures
may damage the structure and reduce its service life. The degree of aggressivity of soil toward
buried structures is referred to as corrosivity of soil. Soil corrosivity is typically a function of:
Porosity (aeration)
Electrical conductivity or resistivity
Dissolved salts
Moisture and site drainage
pH
To estimate the corrosion rates of buried structures a laboratory analysis of soil corrosivity is vital.
In such analysis, the major factor in determining soil corrosivity is electrical resistivity. The electrical
resistivity of a soil is a measure of its resistance to the flow of electrical current. Corrosion of buried
metal is an electrochemical process in which the amount of metal loss due to corrosion is directly
1 American Public Health Association (APHA). 2012. Standard Methods of Water and Wastewater. 22nd ed.
American Public Health Association, American Water Works Association, Water Environment Federation publication. APHA, Washington D.C.

HDR# 213932 Department 028
hdrinc.com
431 W. Baseline Road, Claremont, CA 91711-1608 Page 3 of 14 City of Sunnyvale - Corrosion Rate Analysis
proportional to the flow of electrical current (DC) from the metal into the soil. Corrosion currents,
following Ohm's Law, are inversely proportional to soil resistivity. Lower electrical resistivity values
result from higher moisture and soluble salt contents and indicate corrosive soil.
Soil Resistivity
in ohm-centimeters Corrosivity Category
Greater than 10,000 Mildly Corrosive
2,001 to 10,000 Moderately Corrosive
1,001 to 2,000 Corrosive
0 to 1,000 Severely Corrosive
Other factors listed above also contribute to the aggressivity of soils.
Per Caltrans2 specifications, soil with chloride concentration of 500 ppm or greater and sulfate concentration of 2,000 ppm or greater is considered corrosive to buried structures. Florida Department of Transportation (FDOT) also specifies chloride concentrations of greater than 2,000 ppm and sulfate concentrations of greater than 5,000 ppm as highly corrosive3.
SIMILITUDE ANALYSIS FOR BURIED PORTIONS Data for corrosion of ferrous metals in a variety of soils was compiled by Melvin Romanoff of the
National Bureau of Standards in a Circular 579 entitled Underground Corrosion4. This database
along with the laboratory data was used to conduct a similitude analysis to assess the efficacy of
installing the proposed steel sheet piles exposed to site soil conditions and to calculate a corrosion
allowance for the piles. The basic methodology was to identify the representative soil
characteristics most likely to be encountered at the site and then use the data presented in Circular
579 to calculate the corrosion rates based upon the similitude between the soils documented and
the soils anticipated at the site. This analysis assumes that steel sheet piles are bare and will be
driven or vibrated into undisturbed soil. The results of this analysis will be discussed later in this
technical memorandum.
CORROSION CELL CONCERNS Microcell corrosion is the term given to the situation where active corrosion and the corresponding
cathodic half-cell reaction take place at adjacent parts of the same metal. In simple terms, when a
metal is exposed to two dissimilar environments such as soil and concrete (or soil with varying
properties), an accelerated corrosion (due to metal potential difference in two boundaries) may
take place. In case of sheet piles, the corrosion cell would exist between the steel embedded in
concrete/shotcrete on top and the steel portion embedded in the soil. The steel adjacent to the
boundary line between soil and concrete may suffer from accelerated corrosion. This issue can be
minimized by coating the part of the steel piles that will be embedded in concrete to prevent steel
from direct contact to concrete.
2 Corrosion Guidelines , November 2012, Version 2, http://www.dot.ca.gov/hq/esc/ttsb/corrosion/
3 State of Florida Department of Transportation, Drainage Handbook, Optional Pipe Material, 2012
4 Romanoff, Melvin. Underground Corrosion, NBS Circular 579. Reprinted by NACE. Houston, TX, 1989, p. 8.

HDR# 213932 Department 028
hdrinc.com
431 W. Baseline Road, Claremont, CA 91711-1608 Page 4 of 14 City of Sunnyvale - Corrosion Rate Analysis
CORROSION MITIGATION ALTERNATIVES Four corrosion control alternatives may be considered for the sheet piles.
The first alternative considered was leaving the piles bare. Steel naturally corrodes when buried in
soil. The rate at which the steel deteriorates can be determined and the volume of steel removed
can be calculated for the life of the sheet pile. Sheet piles with a thicker cross section—a corrosion
allowance—can be installed to compensate for this loss.
The second alternative considered was altering the material selection. For example, weathering
steels exhibit enhanced corrosion protection in some environments.
The third alternative considered was applying a coating system to the sheet pile surface. The
intended goal of the coating is to prevent contact with soil. The coating will reduce exposure of
steel to aggressive soil constituents and thereby reduce corrosion rates to acceptable levels.
Issued in 1977, the U.S. Department of Commerce National Bureau of Standards presented NBS
Monograph 158, Corrosion and Protection of Steel Piles in a Natural Seawater Environment.
Although this applies to piles in a salt water environment, it does, however, present the importance
of coatings and provides a good relative comparison of pile coatings available at the time. Based
upon the Monograph, a suitable dielectric coating will reduce corrosion by a factor of up to 200 as
compared to bare steel, which would significantly reduce the worst-case scenario corrosion
allowance. Consequently, a suitable dielectric coating will likely be effective in limiting corrosion.
The fourth alternative considered was applying cathodic protection (CP). Cathodic protection is a
technique to reduce the corrosion of a metal surface by making that surface the cathode (non-
corroding part of the system). In a cathodic protection system, current is supplied by the
consumption of an anode. Current flow results due to the relative position of the anode and
cathode in the galvanic series or is artificially applied using an impressed current system. The
degree of polarization of the cathode results in a reduction or elimination of corrosion on the
structure. A cathodic protection system can protect a buried or submerged structure indefinitely
provided the cathodic protection system is properly designed, operated, and maintained, including
the replacement of the anodes as depletion occurs. Cathodic protection requires electrical
continuity of the structure to be protected. Therefore, bonding of each sheet pile is required for this
alternative. Also, air cannot conduct electrical currents. Thus, structures cannot be protected above
ground using cathodic protection. Additional corrosion control measures would be required for
protecting the sheet pile above ground.
Discussion SOIL CORROSIVITY RESULTS
Electrical resistivities were in the mildly to severely corrosive categories with as-received moisture.
When saturated, the resistivities were in the severely corrosive category. The majority of the as-
received resistivities were near their saturated values. One resistivity dropped considerably with
added moisture because the sample was dry as-received.

HDR# 213932 Department 028
hdrinc.com
431 W. Baseline Road, Claremont, CA 91711-1608 Page 5 of 14 City of Sunnyvale - Corrosion Rate Analysis
Soil pH values varied from 6.7 to 8.5. This range is neutral to strongly alkaline.5 These values do
not particularly increase soil corrosivity.
The soluble salt content of the samples ranged from high to very high.
Chloride salts were the predominant constituents. Chloride is particularly corrosive to ferrous
metals, and in the higher concentrations measured in the soil samples, chloride can overcome the
corrosion inhibiting effect of concrete on reinforcing steel.
Ammonium was detected in a low concentration. The nitrate concentration was high enough to be
aggressive to copper.
Sulfide, which is aggressive to copper and ferrous metals, showed no reaction in a qualitative test.
The positive redox potential measured on the samples indicates oxidizing conditions in which
anaerobic, sulfide-producing bacteria are inactive.
This soil is classified as severely corrosive to ferrous metals, aggressive to copper, and aggressive
with respect to exposure of reinforcing steel to the migration of chloride.
SIMILITUDE ANALYSIS RESULTS Based on the soil corrosion laboratory test results, Soil 112 listed in Table 14 of Romanoff’s
Circular 579 was selected as the soil of similar composition to the construction site. Based on the
properties of Soil 112 and a safety factor of 2, the uniform corrosion rate was estimated to be
approximately 10 mils per year (mpy) per side for bare steel exposed to site soils. With the bare
steel piles exposed to soil on both sides, the effective corrosion rate became 20 mpy as shown in
the table below.
Soil Number 112
Design Life (years) 75
Uniform Corrosion Rates (mpy) Pitting Corrosion Rates (mpy)
Single Side 5.0
Single Side 39 Single Side with S.F. 10
Single Side with S.F. 79
Two Sides 10
Two Sides 79 Two Sides with S.F. 20
Two Sides with S.F. 158
Some literatures indicate that when a pile is isolated from subsurface structures, corrosion rates
are low and less dependent upon the nature of the soil because of the lack of availability of
oxygen6,7 and may be retarded as much as an order of magnitude. While this applies to piles driven
into undistributed soil, it would not apply to the pile near the surface where oxygen is plentiful.
Additionally, in such studies the effect microbiological induced corrosion (MIC) is neglected.
Microbiologically influenced corrosion (MIC) refers to indirect and direct effects that a biological
agent has on the corrosion of metal and metal alloys. In this case, biological organisms can alter
5 Romanoff, Melvin. Underground Corrosion, NBS Circular 579. Reprinted by NACE. Houston, TX, 1989,
p. 8. 6 Romanoff, Melvin. Corrosion of Steel Pilings in Soils, NBS Circular 58, 1962
7 Revie, R. Winston, Uhlig’s Corrosion Handbook (2
nd Edition), John Wiley & Sons, 2000

HDR# 213932 Department 028
hdrinc.com
431 W. Baseline Road, Claremont, CA 91711-1608 Page 6 of 14 City of Sunnyvale - Corrosion Rate Analysis
the corrosion reaction kinetics at the metal surface to either enhance or inhibit corrosion. These
organisms may adhere to the metal surface creating a biofilm layer that can significantly change
the characteristic of the metal/solution interface and the corrosion performance of the metal alloy.
While many biological organisms rely on oxygen and organic carbon availability for cellular growth,
others prefer an anaerobic condition for growth. The pH condition and availability of nutrients are
also important for growth of living organisms. Microorganisms may preferentially colonize on a
metal’s surface when the surface has been sensitized by heat treatment e.g., from welds, at grain
boundaries, and at cracks or crevices8. Therefore, low oxygen levels at deeper soil levels, may not
reduce the corrosion rates of sheet piles significantly. However, the redox potentials measured by
Cerco Analytical and HDR were above 100 mV. Typically redox potential values above 100 mV are
indicative of oxidizing conditions and will not likely manifist bacterial activity.
Uniform corrosion is not the only type of corrosion that can occur on buried metals. Localized
corrosion in the form of pitting can also occur specially in presence of chloride ions. The pitting
corrosion rate for this soil type is estimated to be 158 mpy. This may be considered a pronounced
pitting rate that would lead to premature through-wall pitting of the steel sheet pile. However, pitting
and/or perforation of the sheet pile is not catastrophic since pitting is a highly localized
phenomenon which would not significantly reduce the mass, weight, or structural integrity of the
sheet pile.
Given a service life of 75 years typical for sheet pile structure, a minimum corrosion allowance of
approximately 1.5 inches would need to be considered for bare steel sheet piles with no corrosion
protection. This value is far too high to be reasonably considered as a viable alternative.
As of any other engineering design analysis, a safety factor was considered here in order to
account for thefollowing shortages in the analysis and data:
The number of samples provided for corrosivity testing was limited and discrete. Therefore,
the samples may not represent the worst case scenarios that may be encountered during
the construction.
Although widely accepted in the industry, the Romanoff analysis is also based on limited
number of specimens buried in shallow soils at various locations around the nation. This
analysis may not count for all type of soils and scenarios.
Microbiologically influenced corrosion is a complex phenomenon that is hard to predict and
estimate. It is costly to test and determine the bacteria count and their effect at each
specific site. MIC can facilitate both uniform and pitting corrosion of exposed metal
structures. The safety factor account for such foreseen issues as well.
8 George, R. P., Muraleedharan, P., Sreekumari, K. R., Khatak, H. S. (2003), Influence of surface
characteristics and microstructure on adhesion of bacterial cells onto a type 304 stainless steel, Biofouling 19, pp. 1-8.

HDR# 213932 Department 028
hdrinc.com
431 W. Baseline Road, Claremont, CA 91711-1608 Page 7 of 14 City of Sunnyvale - Corrosion Rate Analysis
Based on above analysis and the corrosion allowance requirement, using corrosion protection
systems seem to be an economical way of reducing the cost of material and reaching the desired
service life. Possible corrosion protection systems are addressed next.
PROPOSED CORROSION MITIGATION TECHNIQUES Various alternatives considered for corrosion mitigation of Sunnyvale sheet piles are addressed
next. Please refer to the Recommendation section for the most beneficial and preferred
techniques.
Alternative Material Selection:
Weathering steels, such as ASTM A690 have an increased resistance to atmospheric corrosion.
Additional corrosion resistance is provided via the addition of small amounts of copper,
phosphorous, and silicon, which, when exposed to atmospheric conditions, cause the corrosion
product to be a thin, tightly adhering oxide that helps to protect the underlying steel from further
corrosion. However, the protective oxide does not form in buried and submerged applications and
the corrosion rate of weathering steels is comparable to that of carbon steel.9
The portions of the pile that are buried or submerged with access to oxygen will be subjected to the
same corrosion rate as determined in the corrosion allowance section above. Therefore,
weathering steel alone is not anticipated to enhance service life.
Protective Coating:
Based upon the Monograph, a suitable dielectric coating will reduce corrosion by a factor of up to
200 as compared to bare steel, which would significantly reduce the worst-case scenario corrosion
allowance. Consequently, a suitable dielectric coating will likely be effective in limiting corrosion.
Coating systems are commonly used as protective measures for sheet piles. For example, Florida
Department of Transportation has specified the use of a three-coat shop applied system comprised
of an inorganic zinc primer and two coats of coal tar-epoxy (in accordance with FDOT Specification
Section 560-14) for protection of permanent steel sheet piles. FDOT requires that the exposed side
of sheet piles be coated from the top of the sheet piles to a depth of five feet below the lower of the
design ground surface or the design scour depth10.
The typical service life protective coating systems is between 15 to 20 years; In case of using
abrasive resistance (high build epoxy) coatings, the coating damage during the driving process will
be insignificant. Depending on the proper surface preparation and application, the coatings can
add another 15 to 20 years to the service life of buried sheet piles.
Furthermore, coating the part of the steel piles that will be embedded in concrete will minimize the
macro-cell corrosion issues that were discussed in the Technical Background section.
9 ASM INTERNATIONAL Handbook Committee. ASM Handbook, Vol. 1 Properties and Selection: Irons,
Steels, and High-Performance Alloys, ASM International, Materials Park, OH, 2007, p. 400. 10
Florida Department of Transportation, Structures Design Guidelines, SDG 3.5 Driven Piles, 2009
HDR# 213932 Department 028
hdrinc.com
431 W. Baseline Road, Claremont, CA 91711-1608 Page 8 of 14 City of Sunnyvale - Corrosion Rate Analysis
Cathodic Protection:
The application of cathodic protection for bare steel structures requires a large amount of protective
current typically requiring the use of impressed current systems, deep anode wells, and rectifiers. A
more ideal solution is the application of cathodic protection on coated surfaces: this requires less
protective current and can potentially use a sacrificial CP system instead of an impressed current
system. Both systems require electrical continuity. Operational maintenance is required by the
impressed current CP system and to a lesser extent, coating maintenance.
Impressed current cathodic protection (ICCP) is considered a viable alternative for protection of the
below ground portions of the sheet piles. However, galvanic anode cathodic protection (GACP) is
considered impractical because it would require the sheet piles to be coated. A proper coating
system would provide adequate corrosion mitigation unaided, rendering the installation of a GACP
unnecessary in this design scenario.
Conclusions The risk of macro-cell corrosion would exist between any steel embedded in
concrete/shotcrete (on top) and the steel embedded in the soil; in this case, the steel in soil
and particularly at the interface between the two environments is prone to accelerated
corrosion. This corrosion issue can be minimized by coating the part of the steel piles that
will be embedded in concrete.
Given the estimated corrosion rate of 10 mpy per sheet pile side and the typical structural
thickness sheet piles, the structural integrity would be compromised significantly before a
75-year design life. Therefore, a corrosion allowance alone for bare steel is not anticipated
to achieve the desired design life.
The use of weathering steel will have no corrosion reducing benefits for buried sheet pile
sections. The weathering steel is expected to have the same corrosion rates as carbon
steel when embedded in soil. Weathering steel alone is not anticipated to achieve the
desired design life.
A system of dielectric coatings is recommended as the best corrosion control alternative for
the subject sheet piles. Properly applied coatings should reduce metal loss to acceptable
levels and will require little to no maintenance.
While impressed current cathodic protection (ICCP) is considered a viable option, the
Galvanic cathodic protection (GACP) is considered impractical because it would require the
sheet piles to be coated. A proper coating will defeat the purpose of CP installation. A
power source to energize the ICCP is required.

HDR# 213932 Department 028
hdrinc.com
431 W. Baseline Road, Claremont, CA 91711-1608 Page 9 of 14 City of Sunnyvale - Corrosion Rate Analysis
Recommendations The life of buried materials depends on thickness, strength, loads, construction details, soil
moisture, etc., in addition to soil corrosivity, and is, therefore, difficult to predict. Of more practical
value are corrosion control methods that will increase the life of materials that would be subject to
significant corrosion. Unless otherwise indicated, these recommendations apply to the entire sheet
pile alignment.
OPTION 1 – COATING SYSTEM
If it is determined that the sheet piles are to be coated, the following are recommended.
1. Abrasive blast the sheet piles.
2. Shop-apply a dielectric coating, on both sides of the sheet piles from the top to 10 feet
below the water table. A suitable coating would be a phenalkamine epoxy such as
Carboline’s Carboguard 691 or Polibrid 705.
3. The remainder of the sheet pile surfaces should be installed bare. The lower depths will
result in the soils being oxygen deficient and the resultant corrosion on the piles will be
mitigated due to the anoxic conditions. Based on the corrosivity analysis of soil samples
tested, the redox potentials were above 100 mV, and therefore the risk of MIC in anaerobic
condition is minimal.
4. Do not partially encase bare steel sheet piles in concrete/shotcrete without applying a non-
conductive barrier such as the coating system specified above, coal-tar epoxy, wax-tape,
cold applied plastic tape, polyethylene sheet, etc. If such a barrier is not provided,
unfavorable corrosion may develop.
5. If a weathering steel is the selected material, the exposed sections of the pile does not
have to be covered with concrete/shotcrete. However, buried portions of the pile are still
recommended to be coated from the ground surface to 10 feet below the water table. If the
exposed portion will be covered with concrete/shotcrete, the above grade portion should be
coated similarly to non-weathered sheet piles.
6. Do not electrically short the steel sheet pile to any other metallic structures.
7. Ensure a third party coating inspector is utilized to monitor the surface preparation and
coating process in the shop and in the field during installation. If the surface is properly
prepared and the coating is applied correctly, the coating system should reach the coating
design life as specified by the coating manufacturer.
8. Cathodic protection may need to be employed when the coating system eventually
degrades to the point that protection is no longer afforded. Specialized testing can be
performed to determine the extent of coating degradation.

HDR# 213932 Department 028
hdrinc.com
431 W. Baseline Road, Claremont, CA 91711-1608 Page 10 of 14 City of Sunnyvale - Corrosion Rate Analysis
OPTION 2 – CATHODIC PROTECTION
If an ICCP system is to be installed, the recommendations below should be followed:
1. Electrically bond all sheet piles to ensure structure continuity.
2. Do not electrically short the steel sheet pile to any other metallic structures.
3. Additional protection of the above ground portions may be necessary. If a weathering steel
is the selected material, a dielectric coating is not recommended for the above ground
portion if not encased in concrete/shotcrete.
4. Do not partially encase bare steel sheet piles in concrete/shotcrete without applying a non-
conductive barrier such as a phenalkamine epoxy, coal-tar epoxy, wax-tape, or cold applied
plastic tape. If such a barrier is not provided, unfavorable corrosion may develop.
5. Apply ICCP per NACE SP0169. The amount of cathodic protection current needed should
be based on the area of the sheet piles at which the bare steel is exposed to soils.
6. The ICCP system will require monthly monitoring of the rectifier and annual monitoring of all
test stations.
7. Cathodic protection systems have a finite life. In order to meet the desired sheet pile design
life, a replacement of the ICCP system should be anticipated every 20–25 years.
Closure Our services have been performed with the usual thoroughness and competence of the
engineering profession. No other warranty or representation, either expressed or implied, is
included or intended.
Please call if you have any questions.
Respectfully Submitted,
HDR Engineering, Inc.
DRAFT DRAFT
Mersedeh Akhoondan, PhD Brien L. Clark, PE, NACE CP4
Corrosion EIT Senior Corrosion Engineer
Enc: Appendix A: Typical Sheet Pile Section
Appendix B: Cerco Analytical - Laboratory Test Results Appendix C: Laboratory Tests on Soil Samples
213932_Sunnyvale- Similtude Analysis_Sheetpile-MA-RevA-MA-BC.docx
HDR# 213932 Department 028
hdrinc.com
431 W. Baseline Road, Claremont, CA 91711-1608 Page 11 of 14 City of Sunnyvale - Corrosion Rate Analysis
Appendix A: Typical Sheet Pile Wall Section

HDR# 213932 Department 028
hdrinc.com
431 W. Baseline Road, Claremont, CA 91711-1608 Page 12 of 14 City of Sunnyvale - Corrosion Rate Analysis
Appendix B: Cerco Analytical - Laboratory Test
Results

HDR# 213932 Department 028
hdrinc.com
431 W. Baseline Road, Claremont, CA 91711-1608 Page 13 of 14 City of Sunnyvale - Corrosion Rate Analysis
Appendix C: Laboratory Tests on Soil Samples HDR Walnut Creek
Master Plan and Facilities Upgrade - Water Pollution Control Plant
HDR #00028/213932/020, HDR Lab #14-0592LAB
8-Aug-14
Sample ID B-04
@ 10.5-11'
B-05
@ 15.5-16'
Resistivity
Units
as-received
ohm-cm 200 440
saturated
ohm-cm 144 120
pH
7.4 7.3
Electrical
Conductivity
mS/cm 2.61 3.70
Chemical Analyses
Cations
calcium Ca2+
mg/kg 215 124
magnesium Mg2+
mg/kg 83 67
sodium Na1+
mg/kg 2,760 4,375
potassium K1+
mg/kg 44 32
Anions
carbonate CO32-
mg/kg 12 36
bicarbonate HCO31-
mg/kg 220 352
fluoride F1-
mg/kg 10 6.6
chloride Cl1-
mg/kg 3,985 5,693
sulfate SO42-
mg/kg 494 850
phosphate PO43-
mg/kg ND ND
Other Tests
ammonium NH41+
mg/kg ND ND
nitrate NO31-
mg/kg 11 ND
sulfide S2-
qual neg neg
Redox
mV 157 192
Electrical conductivity in millisiemens/cm and chemical analysis were made on a 1:5 soil-to-water extract.
mg/kg = milligrams per kilogram (parts per million) of dry soil.
Redox = oxidation-reduction potential in millivolts
ND = not detected
na = not analyzed

HDR# 213932 Department 028
hdrinc.com
431 W. Baseline Road, Claremont, CA 91711-1608 Page 14 of 14 City of Sunnyvale - Corrosion Rate Analysis
HDR Walnut Creek
Master Plan and Facilities Upgrade - Water Pollution Control Plant
Your #00028/213932/020, HDR Lab #14-0707LAB
19-Sep-14
Sample ID
B-3
@ 10-11.5'
&
16-16.5'
B-6
@ 5-6.5'
B-10
@ 10-11.5'
&
15.5-16'
B-11
@ 6-6.5' &
5-6'
Resistivity
Units
as-received
ohm-cm 32,800 284 640 1,600
saturated
ohm-cm 288 112 260 480
pH
7.9 7.8 7.9 7.6
Electrical
Conductivity
mS/cm 1.08 2.84 1.14 0.80
Chemical Analyses
Cations
calcium Ca2+
mg/kg 65 116 59 126
magnesium Mg2+
mg/kg 47 78 45 96
sodium Na1+
mg/kg 1,012 3,143 1,169 530
potassium K1+
mg/kg 15 53 25 45
Anions
carbonate CO32-
mg/kg 24 45 54 ND
bicarbonate HCO31-
mg/kg 238 217 451 354
fluoride F1-
mg/kg 5.0 7.1 11 10
chloride Cl1-
mg/kg 1,073 4,194 805 127
sulfate SO42-
mg/kg 275 631 618 640
phosphate PO43-
mg/kg 0.5 ND 6.7 17
Other Tests
ammonium NH41+
mg/kg ND ND ND 3.7
nitrate NO31-
mg/kg 186 7.2 151 518
sulfide S2-
qual na na na na
Redox
mV na na na na
Electrical conductivity in millisiemens/cm and chemical analysis were made on a 1:5 soil-to-water
extract.
mg/kg = milligrams per kilogram (parts per million) of dry soil.
Redox = oxidation-reduction potential in millivolts
ND = not detected
na = not analyzed