Embed Size (px)
Citation preview

City of RiversideBicycle Master Plan Update:Addendum
March, 2012
PREPARED BY:Alta Planning + DesignPREPARED FOR:City of Riverside


The following addendum to the City of Riverside 2007 Bicycle Master Plan provides an updated
inventory of all bicycle infrastructure and non-infrastructure improvements implemented over the past
five years within the City of Riverside. It also presents current and future bicycle and walking impact
analysis, which includes estimated bicycle and walking trips, reduced vehicle miles traveled, and
emission reductions for current and future conditions. The addendum also provides an updated list of
recommended bicycle improvements, including a new network of proposed bicycle facilities and
programs that will help the City of Riverside upgrade their current designation as a bronze level bicycle
friendly community.
The addendum is organized as follows:
Chapter 3: Existing Conditions
Chapter 5: Needs Analysis
Chapter 6: Recommended Improvements
This chapter provides an update of the following key elements of the City of Riverside 2007 Bicycle
Master Plan:
Planning and policy context to ensure that the Bicycle Master Plan is consistent with other local
and regional plans.
City of Riverside current and potential annexation proposals, presented in Figure 3-2.
Inventory of all elementary, middle, and high schools in Riverside, presented in Table 3-2.
Inventory of parks with restroom facilities, presented in Table 3-3.
City of Riverside existing bicycle infrastructure map, presented in Figure 3-3.
List of existing Class I and Class II bicycle facilities, presented in Tables 3-4 and 3-5.
An overview of existing bicycle related programs offered by the City of Riverside.
As per the Bicycle Transportation Account (BTA) requirements, the 2007 City of Riverside Bicycle
Master Plan is consistent with relevant local, state and federal plans. Chapter 4 provides an overview of
relevant plans and policies to the Bicycle Master Plan (please refer to pages 4-1 to 4-11). Relevant plans
and polices implemented after the adoption of the 2007 Bicycle Master Plan include the Riverside
County General Plan Addendum, the Western Riverside Council of Governments (WRCOG) Non-
Motorized Transportation Plan (NMTP), the Green Riverside Action Plan, and the UC Riverside
Campus Aggregate Master Planning Study. The Bicycle Master Plan is consistent with these plans,
which are summarized below.
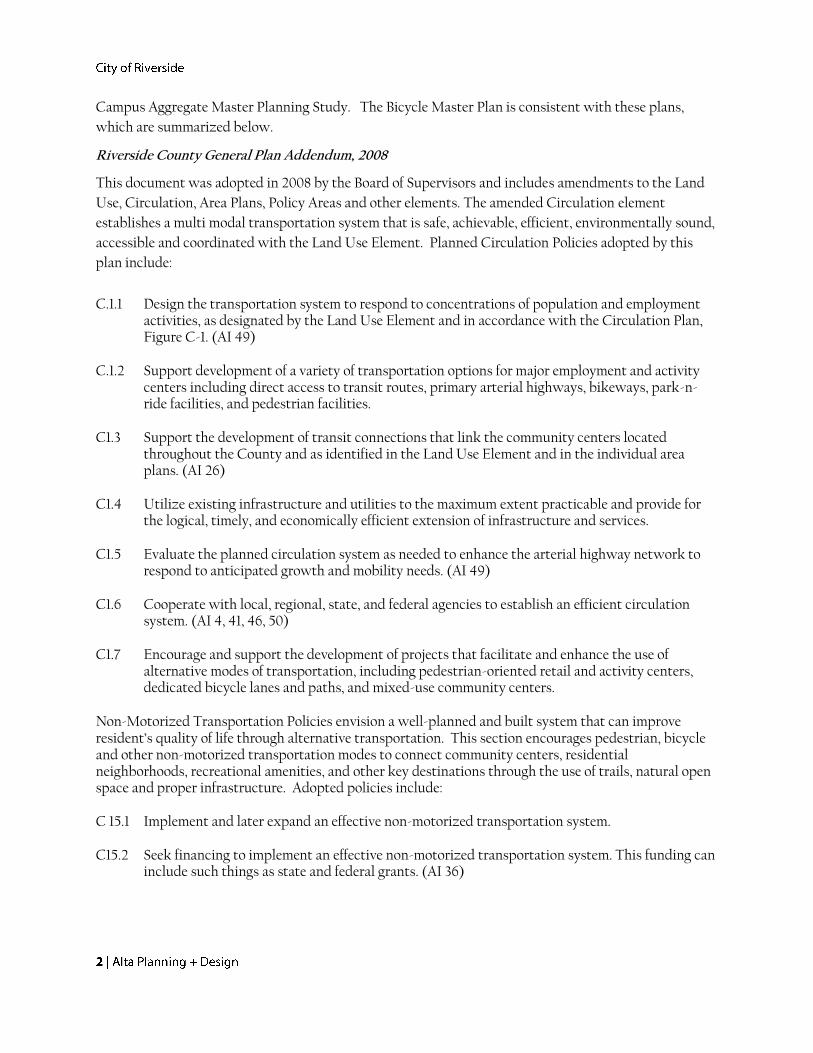
Riverside County General Plan Addendum, 2008
This document was adopted in 2008 by the Board of Supervisors and includes amendments to the Land
Use, Circulation, Area Plans, Policy Areas and other elements. The amended Circulation element
establishes a multi modal transportation system that is safe, achievable, efficient, environmentally sound,
accessible and coordinated with the Land Use Element. Planned Circulation Policies adopted by this
plan include:
C.1.1 Design the transportation system to respond to concentrations of population and employment
activities, as designated by the Land Use Element and in accordance with the Circulation Plan, Figure C-1. (AI 49)
C.1.2 Support development of a variety of transportation options for major employment and activity
centers including direct access to transit routes, primary arterial highways, bikeways, park-n-ride facilities, and pedestrian facilities.
C1.3 Support the development of transit connections that link the community centers located
throughout the County and as identified in the Land Use Element and in the individual area plans. (AI 26)
C1.4 Utilize existing infrastructure and utilities to the maximum extent practicable and provide for
the logical, timely, and economically efficient extension of infrastructure and services. C1.5 Evaluate the planned circulation system as needed to enhance the arterial highway network to
respond to anticipated growth and mobility needs. (AI 49) C1.6 Cooperate with local, regional, state, and federal agencies to establish an efficient circulation
system. (AI 4, 41, 46, 50) C1.7 Encourage and support the development of projects that facilitate and enhance the use of
alternative modes of transportation, including pedestrian-oriented retail and activity centers, dedicated bicycle lanes and paths, and mixed-use community centers.
Non-Motorized Transportation Policies envision a well-planned and built system that can improve resident’s quality of life through alternative transportation. This section encourages pedestrian, bicycle and other non-motorized transportation modes to connect community centers, residential neighborhoods, recreational amenities, and other key destinations through the use of trails, natural open space and proper infrastructure. Adopted policies include: C 15.1 Implement and later expand an effective non-motorized transportation system. C15.2 Seek financing to implement an effective non-motorized transportation system. This funding can
include such things as state and federal grants. (AI 36)
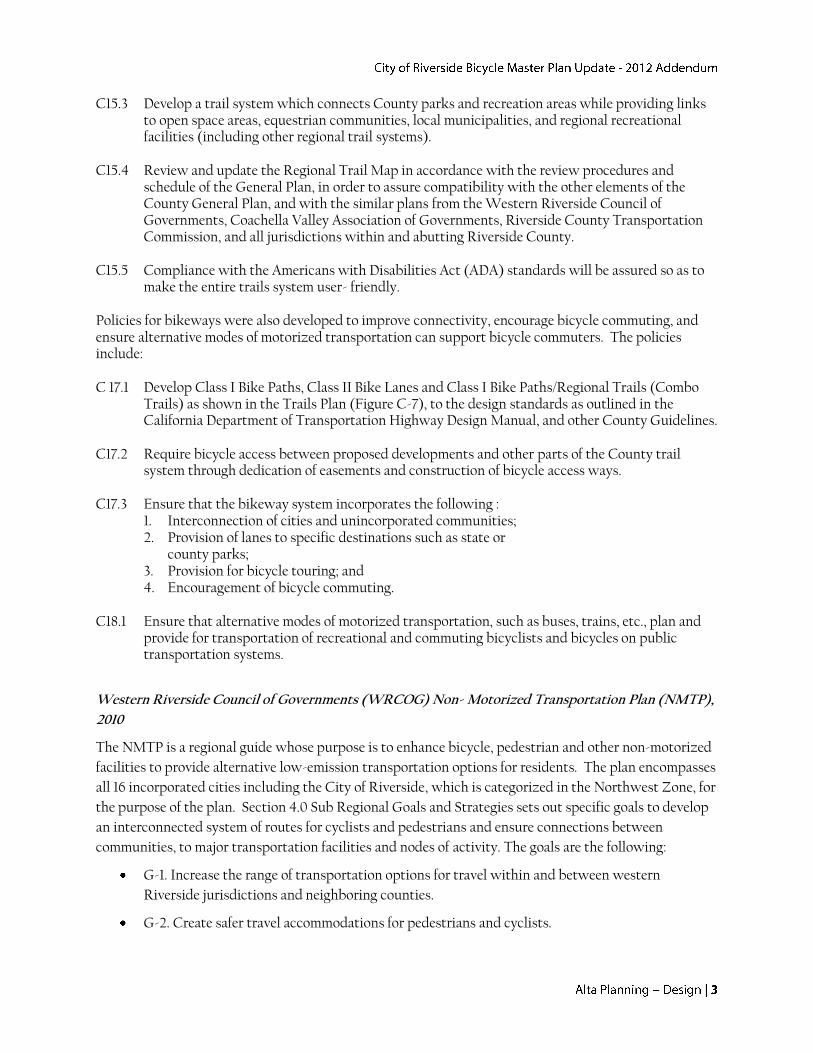
C15.3 Develop a trail system which connects County parks and recreation areas while providing links to open space areas, equestrian communities, local municipalities, and regional recreational facilities (including other regional trail systems).
C15.4 Review and update the Regional Trail Map in accordance with the review procedures and
schedule of the General Plan, in order to assure compatibility with the other elements of the County General Plan, and with the similar plans from the Western Riverside Council of Governments, Coachella Valley Association of Governments, Riverside County Transportation Commission, and all jurisdictions within and abutting Riverside County.
C15.5 Compliance with the Americans with Disabilities Act (ADA) standards will be assured so as to
make the entire trails system user- friendly. Policies for bikeways were also developed to improve connectivity, encourage bicycle commuting, and ensure alternative modes of motorized transportation can support bicycle commuters. The policies include: C 17.1 Develop Class I Bike Paths, Class II Bike Lanes and Class I Bike Paths/Regional Trails (Combo
Trails) as shown in the Trails Plan (Figure C-7), to the design standards as outlined in the California Department of Transportation Highway Design Manual, and other County Guidelines.
C17.2 Require bicycle access between proposed developments and other parts of the County trail
system through dedication of easements and construction of bicycle access ways. C17.3 Ensure that the bikeway system incorporates the following :
1. Interconnection of cities and unincorporated communities; 2. Provision of lanes to specific destinations such as state or
county parks; 3. Provision for bicycle touring; and 4. Encouragement of bicycle commuting.
C18.1 Ensure that alternative modes of motorized transportation, such as buses, trains, etc., plan and
provide for transportation of recreational and commuting bicyclists and bicycles on public transportation systems.
Western Riverside Council of Governments (WRCOG) Non- Motorized Transportation Plan (NMTP),
2010
The NMTP is a regional guide whose purpose is to enhance bicycle, pedestrian and other non-motorized
facilities to provide alternative low-emission transportation options for residents. The plan encompasses
all 16 incorporated cities including the City of Riverside, which is categorized in the Northwest Zone, for
the purpose of the plan. Section 4.0 Sub Regional Goals and Strategies sets out specific goals to develop
an interconnected system of routes for cyclists and pedestrians and ensure connections between
communities, to major transportation facilities and nodes of activity. The goals are the following:
G‐1. Increase the range of transportation options for travel within and between western
Riverside jurisdictions and neighboring counties.
G‐2. Create safer travel accommodations for pedestrians and cyclists.

G‐3. Establish a sub regional backbone network of routes that enhances access to and from
public transportation services and major attractions. The resulting network should complement
rather than conflict with local plans. Ideally, regional components will be integrated into local
plans as updates occur.
G‐4. Establish design classifications and typical design standards for the various corridor types
that are adopted by individual WRCOG jurisdictions.
G‐5. Reduce auto generated emissions while encouraging healthier lifestyles and more
sustainable development patterns.
G‐6. Maximize opportunities to fund bicycle and pedestrian improvements, as well as operations
and maintenance costs associated with the sub regional backbone network, in cooperation with
local jurisdictions.
G‐7. Achieve implementation of the sub regional backbone network by 2035.
G‐8. Determine an annual funding goal for Regional Backbone Network projects every year in
western Riverside County, through both local and sub regional efforts.
G‐9. Create a branding program for the sub regional system that distinguishes it from
local‐serving routes and includes special signage and general promotion.
Additionally, Section 6.0: Design Guidelines discusses the desired implementation strategies and best
practices to encourage the built environment to facilitate safe pedestrian and bicycle use. This section is
consistent with the adopted 2007 Riverside Bicycle Master Plan in its definitions of Class I, II, and III
bicycle lanes and supports the recommendations in this addendum for improved signage, bicycle
boulevards, sharrow lanes, and bicycle parking corrals.
Green Riverside Action Plan, 2007
This plan serves as a step-by-step manual to assist the City in its commitment to a clean and sustainable
future for the City of Riverside. The Action Plan addresses seven areas in which the City can promote
awareness for cleaner and more environmentally friendly solutions. The Transportation section of this
plan notes the significant environmental impacts that motorized vehicles have on the environment.
Strategies recommended to decrease harmful emissions include:
Item 26: Synchronize traffic signals along primary City arterials by the end of 2008.
Item 27: Implement a program to design, construct or close at least one of the 26 railroad grade
separations each year.
Item 28: Reconstruct at least two freeway/street interchanges by 2012.
Item 29: Increase the number of clean vehicles in the non-emergency City fleet to at least 60% by
2010.
Item 30: Encourage the use of bicycles as an alternative form of transportation, not just
recreation, by increasing the number of bike trails by 15 miles and bike lanes by 111
miles throughout the City before 2025.

Item 31: Develop programs to reduce mobile sources of pollution, such as encouraging the
purchase of alternative fuel vehicles or lower emission hybrids and plug-ins for the
residential and business community before 2009.
Item 32: Promote and encourage the use of alternative methods of transportation throughout the
community by providing programs to City employees that can be duplicated by local
businesses.
Item 33: Implement a regional transit program between educational facilities by 2010.
Item 34: Coordinate a plan with local agencies to expand affordable convenient public transit
that will assist in reducing the per capita vehicle trips within the City limits by 2009.
UC Riverside Campus Aggregate Master Planning Study (CAMPS), 2008
This plan was developed to address the rapid growth of the student population and their needs for
accommodation within the context of the 2005 Long Range Development Plan (LRDP). This study
examines existing campus plans and tries to reconcile discrepancies between them to further the
implementation of the LRDP. CAMPS primarily focuses on circulation reconciliation, campus greenways,
open space, west campus capacity, the phasing plan, the school of medicine, and campus design
guidelines. The plan addresses bicycle circulation for both east and west campus, both of which refer to
the implementation of City bicycle lanes.
The East Campus Bicycle Circulation and Parking section describes the increased popularity of bicycling
on campus and the existing on- street bike lanes on the Campus Loop Drive, Linden Drive, Aberdeen
Drive and Big Springs Road. It states that there are currently no dedicated bike trails near campus but
the City of Riverside has a long term vision of building a regional trail along the Gage Canal right-of –
way, and another along the railroad corridor north and east of Watkins Drive. The West Campus Bicycle
Circulation Section describes UC Riverside’s plans to provide marked bicycle lanes or traffic calming
infrastructure so that cyclists, pedestrians and vehicular traffic can all move about safely. This section
also describes the City of Riverside’s regional trail along the Gage Canal that will run through the
academic core of West Campus and connect with future trail extensions to the north and south as well
as bike lanes on the streets.
This plan also refers to the Campus Design Guidelines which provides information on bicycle parking,
racks, corrals, storage and other amenities.
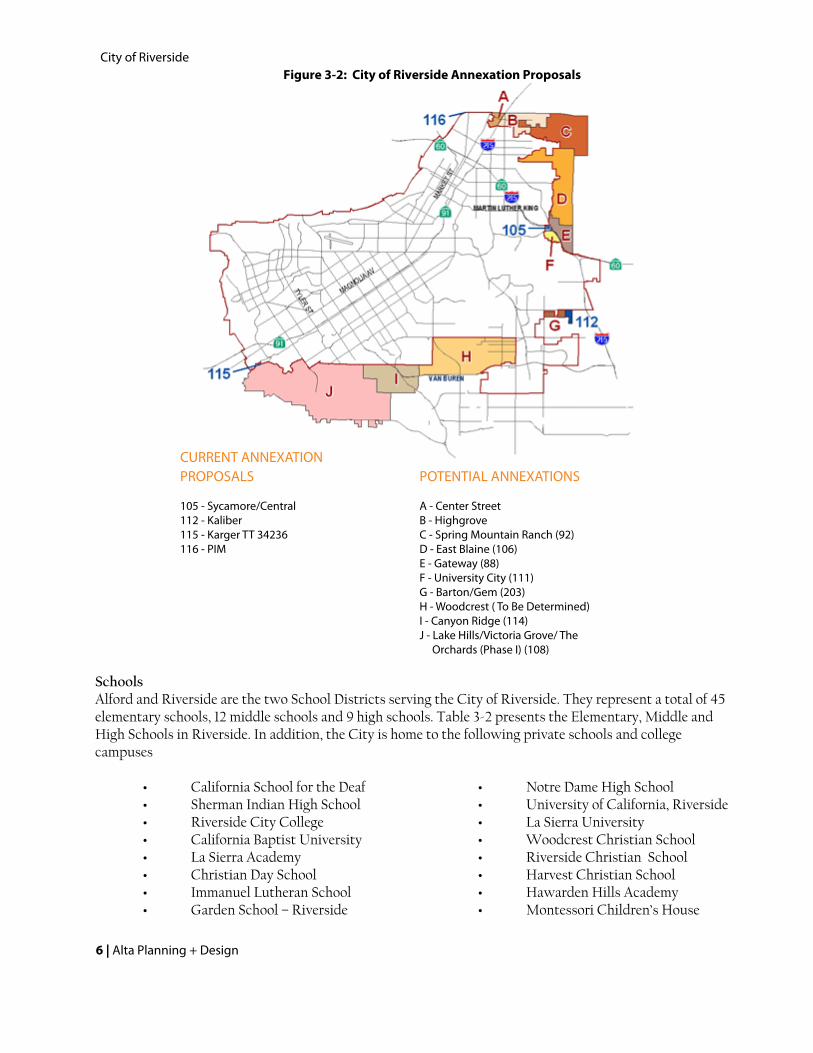
Figure 3-2 shows the City of Riverside’s current and potential annexations as reflected by the Riverside
Local Agency Formation Commission (LAFCO) in May of 2010.
SchoolsAlford and Riverside are the two School Districts serving the City of Riverside. They represent a total of 45 elementary schools, 12 middle schools and 9 high schools. Table 3-2 presents the Elementary, Middle and High Schools in Riverside. In addition, the City is home to the following private schools and college campuses • California School for the Deaf • Notre Dame High School • Sherman Indian High School • University of California, Riverside • Riverside City College • La Sierra University • California Baptist University • Woodcrest Christian School • La Sierra Academy • Riverside Christian School • Christian Day School • Harvest Christian School • Immanuel Lutheran School • Hawarden Hills Academy • Garden School – Riverside • Montessori Children’s House
City of RiversideFigure 3-2: City of Riverside Annexation Proposals
6 | Alta Planning + Design
CURRENT ANNEXATION PROPOSALS POTENTIAL ANNEXATIONS
105 - Sycamore/Central A - Center Street112 - Kaliber B - Highgrove115 - Karger TT 34236 C - Spring Mountain Ranch (92)116 - PIM D - East Blaine (106) E - Gateway (88) F - University City (111) G - Barton/Gem (203) H - Woodcrest ( To Be Determined) I - Canyon Ridge (114) J - Lake Hills/Victoria Grove/ The Orchards (Phase I) (108)

Alvord High School Alvord 3606 Pierce Street
Arizona Middle School Alvord 11045 Arizona Avenue
Arlanza Elementary School Alvord 5891 Rutland Street
Collett Elementary School Alvord 10850 Collett Avenue
Foothill Elementary School Alvord 8230 Wells Avenue
La Granada Elementary School Alvord 10346 Keller Avenue
La Sierra High School Alvord 4145 La Sierra Avenue
Lake Hills Elementary School Alvord 16346 Village Meadow Drive
Loma Vista Middle School Alvord 11050 Arlington Avenue
McAuliffe Elementary School Alvord 4100 Golden Avenue
Myra Linn Elementary School Alvord 10435 Branigan Way
Notre Vista High School Alvord 6585 Crest Avenue
Orrenmaa Elementary School Alvord 3350 Fillmore Street
Philip Stokoe Elementary School Alvord 4501 Ambs Drive
Rosemary Kennedy Elementary School Alvord 6411 Mitchell Avenue
Terrace Elementary School Alvord 6601 Rutland Avenue
Twinhill Elementary School Alvord 11000 Campbell Avenue
Valley View Elementary School Alvord 11750 Gramercy Place
Villegas Middle School Alvord 3754 Harvill Lane
Wells Middle School Alvord 10000 Wells Avenue
Abraham Lincoln High School Riverside 4341 Victoria Avenue
Adams Elementary School Riverside 8362 Colorado Avenue
Alcott Elementary School Riverside 2433 Central Avenue
Amelia Earhart Middle School Riverside 20202 Aptos Street
Arlington High School Riverside 2951 Jackson Street
Beatty Elementary School Riverside 4261 Latham Street
Bryant Elementary School Riverside 4324 3rd Street
Castle View Elementary School Riverside 6201 Shaker Drive
Central Middle School Riverside 4795 Magnolia Avenue
Chemawa Middle School Riverside 8830 Magnolia Avenue
Earhart Middle School Riverside 20202 Aptos Street
Emerson Elementary School Riverside 4660 Ottawa Avenue
Franklin Elementary School Riverside 19661 Orange Terrace Pkwy
Fremont Elementary School Riverside 1925 N. Orange Street
Gage Middle School Riverside 6400 Lincoln Avenue
Garden School Riverside 1085 W. Linden Street

Grant Elementary School Riverside 4011 14th Street
Harrison Elementary School Riverside 2901 Harrison Street
Hawthorne Elementary School Riverside 9174 Indiana Avenue
Highgrove Elementary School Riverside 690 Center St, Riverside
Highland Elementary School Riverside 700 Highlander Drive
Hyatt Elementary School Riverside 4466 Mt Vernon Avenue
Jackson Elementary School Riverside 4585 Jackson Street
Jefferson Elementary School Riverside 4285 Jefferson Street
John W. North High School Riverside 1550 3rd Street
Kennedy Elementary School Riverside 19125 Schoolhouse Lane
Lake Matthews Elementary School Riverside 12252 Black Burn Road
Liberty Elementary School Riverside 9631 Hayes Street
Longfellow Elementary School Riverside 3610 Eucalyptus Avenue
Madison Elementary School Riverside 3635 Madison Street
Magnolia Elementary School Riverside 3975 Maplewood Place
Mark Twain Elementary School Riverside 19411 Krameria Avenue
Martin Luther King High School Riverside 9301 Wood Road
Miller Middle School Riverside 17925 Krameria Avenue
Monroe Elementary School Riverside 8535 Garfield Street
Mountain View Elementary School Riverside 6180 Streeter Avenue
Pachappa Elementary School Riverside 6200 Riverside Avenue
Poly High School Riverside 5450 Victoria Avenue
Ramona High School Riverside 7675 Magnolia Avenue
Sierra Middle School Riverside 4950 Central Avenue
Sunshine Elementary School Riverside 9390 California Avenue
Taft Elementary School Riverside 959 Mission Grove Pkwy
Tomas Rivera Elementary School Riverside 20440 Red Poppy Lane
University Heights Middle School Riverside 1155 Massachusetts Avenue
Victoria Elementary School Riverside 2910 Arlington Avenue
Washington Elementary School Riverside 2760 Jane Street
Woodcrest Elementary School Riverside 16940 Krameria Avenue
Source: City of Riverside data, February 2012.

The City of Riverside has a total of 52 city parks. These parks, in combination with additional open
space, total more than 23,000 acres. Approximately 85% of these areas are open to cyclists. These parks
and recreation facilities are an important source of bicycle support facilities for Riverside cyclists,
especially those that provide additional features such as picnic tables, restrooms or community centers.
Table 3-3 lists Riverside parks that contain restroom facilities and additional amenities.
Andulka Park 5201 Chicago Avenue
Arlington Park 3860 Van Buren Boulevard
Arlington Heights Sports Park 9401 Cleveland Avenue
Bobby Bonds Park 2060 University Avenue Cesar Chavez Community Center
Bordwell Park 208 Martin Luther King Boulevard
Stratton Community Center
Bryant Park 7950 Philbin Street Arlanza Community Center
Don Derr Park 3003 Monroe Street
Don Jones Park 3995 Jefferson Street
Don Lorenzi Park 4230 Jackson Street
Evans Sports Complex 4557 Magnolia Avenue
Fairmount Park 2601 Fairmount Boulevard
Hunt Park 4015 Jackson Street Renck Community Center
Hunter Park 1400 Iowa Avenue
La Sierra Park 5215 La Sierra Avenue La Sierra Community Center
Martha McLean/ Anza Narrows Park 5759 Jurupa Avenue
Myra Linn Park 4540 Meredith Street
Nichols Park 5505 Dewey Avenue Joyce Jackson Community Center
Orange Terrace Community Park 20010 Orange Terrace Pkwy Orange Terrace Community Center
Patterson Park 1841 Linden Street.
Reid Park 801 N. Orange Street Ruth Lewis Community Center
Shamel Park 3650 Arlington Avenue
Source: City of Riverside data, February 2012.
Since the adoption of the Bicycle Master Plan in 2007, the City of Riverside has added 0.5 miles of Class I
bike paths to the Santa Ana River Trail and 50 miles of Class II bike lanes to its on-street bikeway
network, for a total of 123.4 miles of existing bikeways as seen in Tables 3-4a and 3-5. The city also has a
network of 26.4 miles of unpaved trails, which are non-standard trails that are frequently used by
bicyclists and pedestrians in the city. Table 3-4b lists the existing non-standard trails in the City of
Riverside.

Riverside’s existing network of designated bikeways and end-of-trip facilities is shown in Figure 3-3.
Gage Canal Trail 1.9
Santa Ana River Trail 7.5
Victoria Avenue 7.6
Total 17
Source: Riverside GIS data, February 2012.
Alessandro Arroyo Trail 3.6
Benedict Wash Trail 3.0
BNSF Trail 2.2
Gage Canal Trail 8.0
Mockingbird Canyon Trail 1.2
Prenda Arroyo Trail 0.5
Springbrook Wash Arroyo Trail 4.2
Sycamore Canyon Trail 3.7
Total 26.4
Source: Riverside GIS data, February 2012.

Class I Bike Path
Existing
Bicycle Facilities Land Uses Bicycle Support Facilities
Class II Bike Lanes
Bike Path and Bike Lane
Trail
High Schools andUniversities
Elementary andMiddle Schools
Parks N
!
k
Existing Bike Racks
Existing Bike Lockersand/or Shower Facilities
0 21 Miles
Source: City of Riverside GIS Data February 2012 Alta Planning + Design | 11
Figure 3-3: City of Riverside Existing Bikeways
Van Buren Blvd
Lincoln Av
Iow
a Av
Gage Canal Trail
Victoria Av
Indiana Av
Monroe St
Jackson St
Arlington Av
Watkins Dr
La Sierra Av
Main
St
Magn
olia
Av
Cany
on C
rest
Dr
California Av
Palm
Av
University Av
Alessandro Blvd
Jefferson St
Trautwein Rd
Pierce St
Adams St
BNSF
Tra
il
Overlook Pkwy
Grand Av
Sycamore Canyon Trail
Sycamore Canyon
Palmyrita Av
Alessandro Arroyo Trail
Santa Ana River Trail
Benedict Wash Trail
Lochmoor Dr
Linden St
3rd St Blaine St
Golden Ave
Collette Ave
n/a
Springbrook Wash Arroyo Trail
Campus Dr
Dauc
hy A
ve
Pine
Stre
et
Jurupa Ave
Marlborough Ave
Big Springs Rd
Central Av
Alessandro Blvd
Mark
et S
t
La Sierra Av
Adams St
Arlington Av
Sant
a Ana
Rive
r Tra
il
Linden St
Arlington Av
Wells Av
Blaine St
Magnolia Av
Chic
ago
Av
Victoria Av
!
!!!
!!
k
k
kk
k

14th Street Brockton Avenue to Redwood Drive 0.3
3rd Street Market Street to Iowa 2.0
Aberdeen Drive West Linden Street to North Campus Drive 0.2
Adams Street Arlington Avenue to California Avenue 0.5
Alessandro Boulevard Victoria Avenue to Sycamore Canyon Boulevard 5.3
Arlington Avenue Crest View Drive to Alessandro Boulevard (with gaps between Adams Street and Streeter Avenue, and Magnolia Avenue and Indiana Avenue) 8.1
Big Springs Road Campus Drive to Mount Vernon 0.6
Blaine Street Iowa Street to Mount Vernon 1.5
Brockton Avenue Nixon Drive to Indiana Avenue 0.9
California Avenue Hole Avenue to Arlington Avenue 4.1
Campus Drive University Avenue to North Campus Drive 1.4
Canyon Crest Drive Watkins Drive to Alessandro Boulevard 4.3
Central Avenue Victoria Avenue to Fairview Avenue and Chicago Avenue to Watkins Drive 3.0
Chicago Avenue Alessandro Boulevard to Le Conte Drive 1.4
Collette Avenue Pierce Street to Hole Avenue 1.6
Colorado Avenue Arlington Avenue to Van Buren Boulevard 1.4
Columbia Avenue La Cadena Drive to Michigan Avenue 1.6
Dauchy Avenue Cactus Avenue to JFK Drive 0.5
Golden Avenue Collett Avenue to Magnolia Avenue 0.7
Indiana Avenue Vallejo Street to Tyler Street 0.7
Iowa Avenue La Cadena Drive to Martin Luther King Boulevard 3.5
Jefferson Street Arlington Avenue to Victoria Avenue 2.0
John F Kennedy Dauchy Avenue to Branding Iron Ln 0.7
Jurupa Avenue Van Buren Boulevard to Rutland Street 0.4
La Sierra Avenue Arlington Avenue to Cleveland Avenue (gaps between Gramercy Pl and Hole Avenue, between Magnolia Avenue and Montlake Drive) 4.1
Lincoln Avenue Van Buren Boulevard to Jefferson Street 2.1
Linden Street Chicago Avenue to Aberdeen Drive 1.2
Lochmoor Drive Central Avenue to Sycamore Canyon Boulevard 1.5
Magnolia Avenue Buchanan Street to 14th Street 9.2
Market Street 14th Street to Hwy 60 1.9
Marlborough Iowa Avenue to 600 Ft east of Northgate Street 0.6
Martin Luther King Chicago Avenue To Canyon Crest Drive 1.0

N. Main Street Columbia Avenue to Placentia Ln 0.9
Orange Terrace Pkwy Trautwein Road to Van Buren Boulevard 2.0
Overlook Pkwy Washington Street to Crystal View Terrace 2.0
Palm Avenue Bandini Avenue to Tequesquite Avenue 0.6
Palmyrita Avenue Iowa Avenue to California Avenue 0.6
Pierce Street La Sierra Avenue to Magnolia Avenue (with gap between Collett Avenue and Hwy 91 1.7
Pine Street 14th Street to University Avenue 0.5
Redwood Drive 14th Street to University Avenue 0.5
Riverwalk Pkwy Pierce Street to Pierce Street 1.3
Sycamore Canyon Boulevard Lochmoor Drive to Alessandro Boulevard 2.1
Trautwein Road Alessandro Boulevard to Van Buren Boulevard 2.2
University Avenue Park Avenue to Canyon Crest Drive 2.0
Van Buren Boulevard North City Limits to Gage Canal Trail (With gaps between California Avenue and Magnolia Avenue, Indiana Avenue and Victoria Avenue, Cleveland and Wood Avenue. 5.36
Victoria Avenue La Sierra Avenue to Arroyo Drive 7.8
Washington Street John F Kennedy to Van Buren Boulevard 1.8
Watkins Drive Spruce Street to Central Avenue 2.6
Wells Avenue Crest Avenue to Van Buren Boulevard 1.0
Total 101.5
Source: Alta Planning + Design field inventory, Riverside GIS data, February 2012.
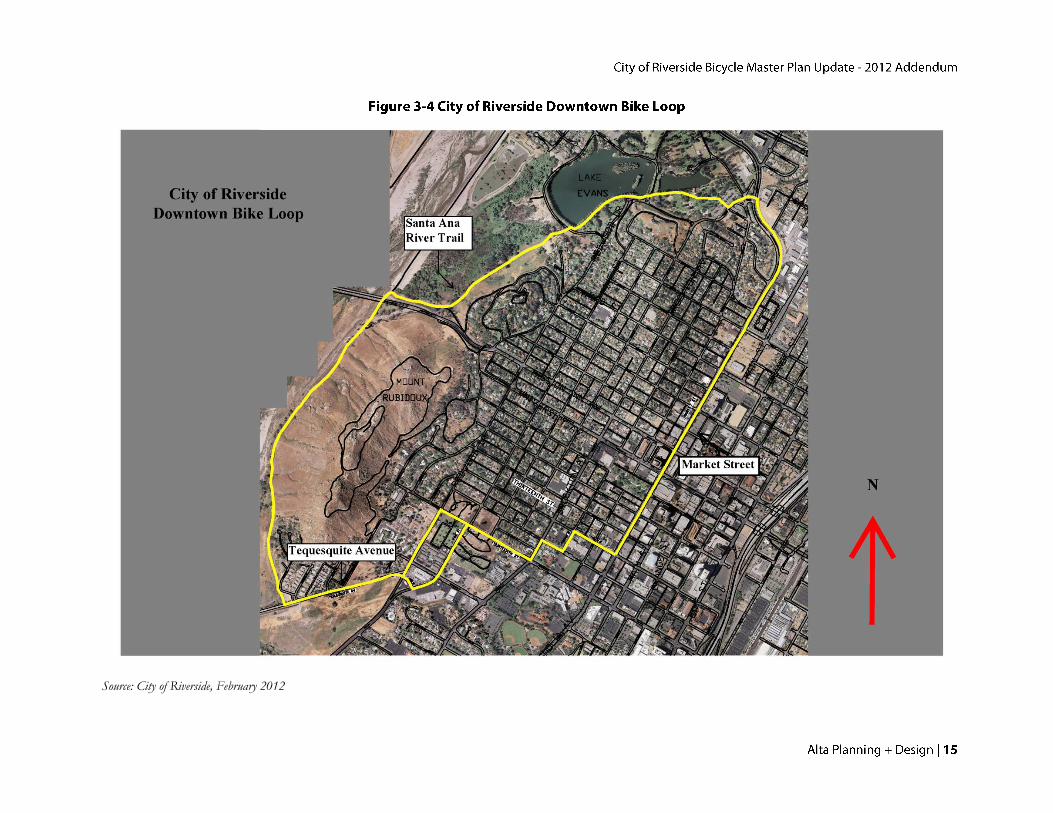
The City has identified and signed a 6 mile Downtown Bike Loop, shown in Figure 3-4. The Loop is complimented
with traffic signals that detect bicyclists and with customized wayfinding signage
(see signage at right).
The City of Riverside developed the following bike parking ordinances, which have
been included in the Riverside Municipal Code:
- Section 10.64.300 Parking.
No person shall park a bicycle upon a street other than upon the roadway against the curb or
upon the sidewalk in a rack to support the bicycle or against a building or at the curb, in such a
manner as to afford the least obstruction to pedestrian traffic.
- Section 10.64.170 Parking in rack required on business district sidewalks

It is unlawful for any person to leave a bicycle upon any improved sidewalk within the business district of the City unless such
bicycle is standing in a rack or receptacle for the parking of bicycles as provided in this chapter, if such rack or receptacle is available
within a distance of one hundred fifty feet.
Bicycle parking is available at all public elementary and middle schools listed in Table 3.2 of this
addendum. The Riverside County Transportation Commission maintains bicycle parking facilities at the
two Riverside Metrolink stations. The Downtown Riverside station has six bike shells and four bike
racks and the La Sierra station has six bike lockers and four bike racks. Table 3-6 lists Riverside’s largest
employers and the bicycle support facilities offered by each. Figure 3-2 shows the location of existing
end-of-trip facilities in the City.
Bicycle shops provide assistance for both commuter and recreational cyclists with bicycle parts, repairs,
service or information about bicycling in the city. Riverside has 9 bicycle shops, listed in Table 3-6.
Don’s Bicycle Store 384 S. Riverside Avenue http://donsbikeshop.com
Starklite Cycle 6260 River Crest Dr #F N/A
Woodcrest Bicycle Center 16960 Van Buren Blvd Ste A N/A
Riverside Cyclery USA 10000 Magnolia Avenue http://cycleryusa.com
California Cyclery & Supply 3747 Central Avenue http://www.calcyclery.com
Pedals Bicycle Shop 3765 Jurupa Avenue Ste. L http://www.pedalsbikeshop.com
Jenson USA Bicycles 1615 Eastridge Avenue http://www.jensonusa.com
Southridge Cycling 9199 Jurupa Road http://southridgeusa.com
Sport Authority 3380 Tyler Street http://www.sportsauthority.com
Sport Chalet 3700 Tyler Street http://www.sportchalet.com
Source: City of Riverside, February 2012
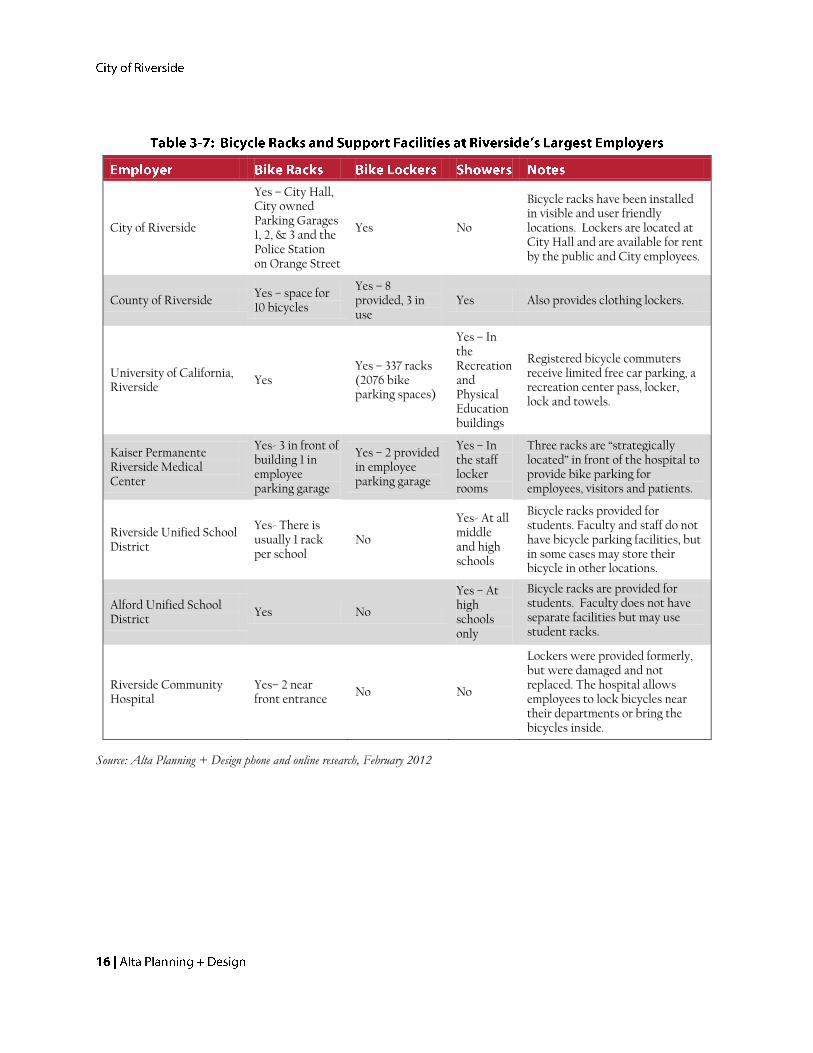
City of Riverside
Yes – City Hall, City owned Parking Garages 1, 2, & 3 and the Police Station on Orange Street
Yes No
Bicycle racks have been installed in visible and user friendly locations. Lockers are located at City Hall and are available for rent by the public and City employees.
County of Riverside Yes – space for 10 bicycles
Yes – 8 provided, 3 in use
Yes Also provides clothing lockers.
University of California, Riverside
Yes Yes – 337 racks (2076 bike parking spaces)
Yes – In the Recreation and Physical Education buildings
Registered bicycle commuters receive limited free car parking, a recreation center pass, locker, lock and towels.
Kaiser Permanente Riverside Medical Center
Yes- 3 in front of building 1 in employee parking garage
Yes – 2 provided in employee parking garage
Yes – In the staff locker rooms
Three racks are “strategically located” in front of the hospital to provide bike parking for employees, visitors and patients.
Riverside Unified School District
Yes- There is usually 1 rack per school
No
Yes- At all middle and high schools
Bicycle racks provided for students. Faculty and staff do not have bicycle parking facilities, but in some cases may store their bicycle in other locations.
Alford Unified School District
Yes No
Yes – At high schools only
Bicycle racks are provided for students. Faculty does not have separate facilities but may use student racks.
Riverside Community Hospital
Yes– 2 near front entrance
No No
Lockers were provided formerly, but were damaged and not replaced. The hospital allows employees to lock bicycles near their departments or bring the bicycles inside.
Source: Alta Planning + Design phone and online research, February 2012

Bike lanes are swept twice a month except for the Victoria Avenue trail which is swept every Friday due
to the high volume of weekend riders. All other maintenance is completed by the Public Works
Department on an as needed basis.
Bicycle lanes are added to all capital improvement projects where applicable. Work zone
accommodation plans are included in all projects that will affect the regular use of any bicycle lanes or
trails.
In 2008, the City of Riverside applied for Bicycle Transportation Account (BTA) funding from the
California Department of Transportation (Caltrans) and was awarded $104,000, with $120,000 of City
funds, to design and construct 4 miles of Class II bicycle lanes along Jefferson Avenue between Arlington
Avenue and Victoria Avenue.
The City has also been awarded grant funding to revamp the bike lanes on Third Street from Mulberry
Street to Watkins.
The Riverside Police Department has a full time Traffic Education Coordinator who oversees all traffic
education programming, which covers all aspects of traffic safety.
Traffic Safety classes are geared towards children ages 6 to 18 and are offered in February, March, August
and November. Classes run for up to 2 hours, and require that the parents accompany their children.
Bicycle safety classes can be scheduled for a neighborhood, community group, or club. These classes are
customized to meet the needs of the group.
The County and the City of Riverside have received Safe Routes to School funding for education and
encouragement programs at the elementary school level. The County and City have worked together to
conduct walk and bicycle audits at select elementary schools. The City also installed pedestrian count
heads at all signalized intersections throughout the city with Safe Route to School and City funding.
The City of Riverside, through its Department of Public Works, established a “Share the Road”
educational campaign to educate both cyclists and motorists about their legal rights and responsibilities
of the road, and general rules on how to share the road safely with each other.

The Riverside Bicycle Club provides community members with resources to learn about local
opportunities for bicycling via their public website (www.riversidebicycleclub.com). The Riverside Bicycle
Club (RBC) organizes weekly rides for different levels and abilities around the city. The club also has a
mountain bike division called Team Dirty Work which has its own website and caters to all levels of
mountain bike riding.
There are three major bike rides that are promoted and conducted for the general public in the City of
Riverside including:
- The Tour de Riverside 30 mile and 15 mile rides through scenic downtown
Riverside and Victoria Avenue.
- Riverside Citrus Classic Bike Ride Offers 100 mile, 50 mile, 28 mile, and 7 mile to promote
cycling for all ages through Redlands, Moreno Valley and
Riverside.
Riverside’s bicycle clubs and rotary clubs promote these rides by posting information on their websites
and distributing flyers to the public.
The Riverside Police Department provides educational materials providing safety information to the
public. These are available at any of the City of Riverside Police Stations. The Riverside Police
Department also has a Safety Cite Program. Safety Cite is a positive reinforcement plan to promote the
use of traffic safety equipment and safety rules. Juveniles that are properly wearing their helmets,
obeying the law, and/or practicing proper safety skills will be “cited” by police department employees, by
sending letters to their parents and rewarding “cited” children with a prize. Each child cited will be
entered into a drawing for a new bike.
National Bike Month, Bicycle Safety Month/Day, and Bicycle Awareness Week are also promoted by the
Riverside Police Department and other partners.
To encourage and educate the community about bicycling opportunities in Riverside, the City has added
a bicycle page to the Public Works Department Website (http://www.riversideca.gov/traffic/bike.asp).
The webpage contains an interactive bicycle map
(http://maps.riversideca.gov/BikewaysFxApp/index.html), link to the Bicycle Master Plan, bicycle safety
tips, and links to different bicycle websites.
In September of 2009, the City of Riverside established a Bicycle Advisory Committee (BAC) whose role
is to assist in the implementation of the Bicycle Master Plan by prioritizing its projects. The BAC is
made up of resident cyclists, City employees, representatives from bicycle clubs, local colleges, and
nonprofit organizations, and other key representatives from the community. It serves as an opportunity
for dialogue linking these various groups with a common interest in the City’s bicycle community and
infrastructure. The BAC has established short term goals to increase public awareness about bicycling,
maintain the City’s existing bicycle infrastructure, and increase secure bicycle parking.
On October 20, 2009 the City of Riverside was recognized by the League of American Bicyclists as a
Bronze Level Bicycle Friendly Community. The award recognizes Riverside’s commitment to
maintaining and connecting the City’s existing bicycle infrastructure.
The Bicycle Friendly Community designation is a four year designation and will be up for renewal in
October, 2013. The renewal process and four levels of the award – platinum, gold, silver, and bronze –
provide a clear incentive for communities to continuously improve. This recognition will enhance the
City’s image as a destination for bicyclists, inspire the community to continue to improve conditions for
bicycling, and improve the City’s ability to attract grant funds.
Since the adoption of the Plan on May 22, 2007, the City of Riverside appointed a city employee as the
part- time Bicycle Coordinator located in the Public Works Department to handle day-to-day concerns
of Riverside’s cyclists.
In the fall of 2011, the City hired a Bicycle Coordinator consultant who will work with City Staff, the
BAC and the bicycling community of Riverside to expand and enhance the existing bikeway network,
advance the City’s standing as a Bicycle Friendly Community, train City staff, evaluate existing facilities,
provide recommendations and identify funding opportunities for bicycle projects.
The Governor of the State of California has signed into law AB 1358, The Complete Streets Act. In
summary, the Complete Streets Act will ensure that the transportation plans of California communities
meet the needs of all users of the roadway including pedestrians, bicyclists, users of public transit,
motorists, children, the elderly, and the disabled.
Also signed into law by the Governor of the State of California is SB 375, Regional planning for
greenhouse gas reduction, travel demand models, which “seeks to reduce vehicle miles traveled through
land use and planning incentives.” These laws are critically important to achieving improved
accommodation of cyclists in all new road construction, reconstruction, and resurfacing projects in the
City of Riverside.

This chapter provides an update of the needs analysis from the adopted 2007 Riverside Bicycle Master
Plan.
Journey-to-work information collected by the US Census Bureau’s American Communities Survey (ACS) is
the foundation of this analysis. The ACS “Commuting to Work” data provide an indication of current
bicycle system usage. A major objective of any bicycle facility enhancement or encouragement program is
to increase the “bicycle mode split” or percentage of people who choose to bike rather than drive alone.
The most recent ACS data available for the City of Riverside is the 2008-2010 three-year estimates.
Model variables from the ACS for the City of Riverside include: total population (302,333 people),
employed population (125,143 people), school enrollment (56,619 students grade K-12; 31,188 college
students), and travel-to-work mode split shown in Table 5-1.
Employed 0.9% 3.10% ACS, 2008-2010
K-12 0.67% 10.57% NHTS 2009
College 0.9% 3.10% ACS, 2008-2010
The 2009 NHTS provides a substantial national dataset of travel characteristics, particularly for trip
characteristics of bicycling and walking trips. Data used from this survey include:
Student mode split, grades K-12
Trip distance by mode by trip purpose
Ratio of walking/bicycling work trips to utilitarian trips
Ratio of work trips to social/recreational trips
Average trip length by trip purpose and mode
Several of these variables are trip type multipliers that provide an indirect method of estimating the
number of walking and bicycling trips made for other reasons, such as shopping and running errands.
NHTS 2009 data indicates that for every bicycle work trip, there are slightly more than two utilitarian
bicycle trips made. Although these trips cannot be directly attached to a certain group of people (not all
of the utilitarian bicycling trips are made by people who bicycle to work) these multipliers allow a high
percentage of the community’s walking and bicycling activity to be captured in an annual estimate.
The Safe Routes to School Baseline Data Report (2010) was used to determine the percent of students who
walk or bicycle by the parents’ estimate of distance as well as the frequency of carpooling for trip
replacement. As with any modeling projection, the accuracy of the result is dependent on the accuracy of

the input data and other assumptions. Effort was made to collect the best data possible for input to the
model, but in many cases national data was used where local data points were unavailable. Examples of
information that could improve the accuracy of this exercise include the detailed results of local Safe
Routes to Schools parent and student surveys, a regional household travel survey, and a student travel
survey of college students.
Table 5-2 shows the results of the model, which estimates that almost 8,000 bicycle trips and almost
56,000 walking trips occur in Riverside each day. Based on the model assumptions, the majority of trips
are non-work utilitarian trips, which include medical/dental services, shopping/errands, family personal
business, obligations, transporting someone, meals, and other trips.
Commute Trips
Bicycle/ walking commuters 1,126 3,879 Employed population multiplied by mode split
Weekday bicycle/ walking trips 2,253 7,758 Number of commuters multiplied by two for return trips
School Trips
K-12 bicycle/ walking commuters 381 5,986 School children population multiplied by mode split Weekday K-12 bicycle/ walking trips 761 11,972
Number of student bicyclists multiplied by two for return trips
College Trips College bicycle/ walking commuters 281 967 Employed population multiplied by mode split Weekday bicycle/ walking college trips 561 1,933
Number of college student bicyclists multiplied by two for return trips
Utilitarian Trips Daily adult bicycle/walking commute trips 2,814 9,691
Number of bicycle/walking trips plus number of bicycle/walking college trips
Daily bicycle/walking utilitarian trips 4,407 34,068
Utilitarian bicycle/walking trips multiplied by ratio of utilitarian to work trips (NHTS). Distributes weekly trips over entire week (vs. commute trips over 5 days)
Total Current Daily Trips 7,983 55,732
To estimate the total distance Riverside residents travel to work or school by walking and bicycling, the
model isolates different walking and bicycling user groups and applies trip distance information for
walking or bicycling trips by mode based on the NHTS 2009 national dataset of travel characteristics.
As shown in Table 5-3, this analysis estimates that there are currently 17 million bicycling and walking
trip each year, which reduces 6 million annual vehicle trips and reduces nearly 7 million vehicle miles
traveled as a result of bicycling and walking in the City of Riverside.

Commute Trips
Weekday vehicle trips replaced
Trips multiplied by drive alone trips to determine automobile trips replaced by bicycle trips
Weekday miles bicycled/walked
Number of vehicle trips reduced multiplied by average bicycle/walking work trip length (NHTS 2009)
School Trips
Weekday vehicle trips reduced
Trips multiplied by drive alone trips to determine automobile trips replaced by bicycle/walking trips
Weekday miles bicycled/walked
Number of vehicle trips reduced multiplied by average trip length to/from school (SRTS 2010)
College Trips
Weekday vehicle trips reduced
Trips multiplied by drive alone trips to determine automobile trips replaced by bicycle/walking trips
Weekday miles bicycled/walked
Number of vehicle trips reduced multiplied by average bicycle school/daycare/religious trip length (NHTS 2009)
Utilitarian Trips
Daily vehicle trips reduced Number of daily utilitarian trips multiplied by drive alone trips
Daily miles bicycled/walked
Number of vehicle trips reduced multiplied by average utilitarian trip length (NHTS 2009; does not include work or home trips)
Yearly bicycle/walking trips 1,868,635 15,164,277 17,032,912
Yearly vehicle trips reduced from bicycling/walking trips 921,400 5,265,515 6,186,914
Yearly vehicle miles reduced from bicycling/walking trips 3,266,999 3,553,106 6,820,105
To the extent that bicycling and walking trips replace single-occupancy vehicle trips, they reduce emissions and have tangible economic impacts by reducing traffic congestion, crashes, and maintenance costs. In addition, the reduced need to own and operate a vehicle saves families money. These benefits are shown in Table 5-4.
Yearly vehicle miles reduced 3,266,999 3,553,106 6,820,105
Air Quality Benefits Reduced Hydrocarbons (pounds/year) 9,795 10,653 20,449 EPA, 2005 Reduced Particulate Matter (pounds/year) 73 79 152 EPA, 2005
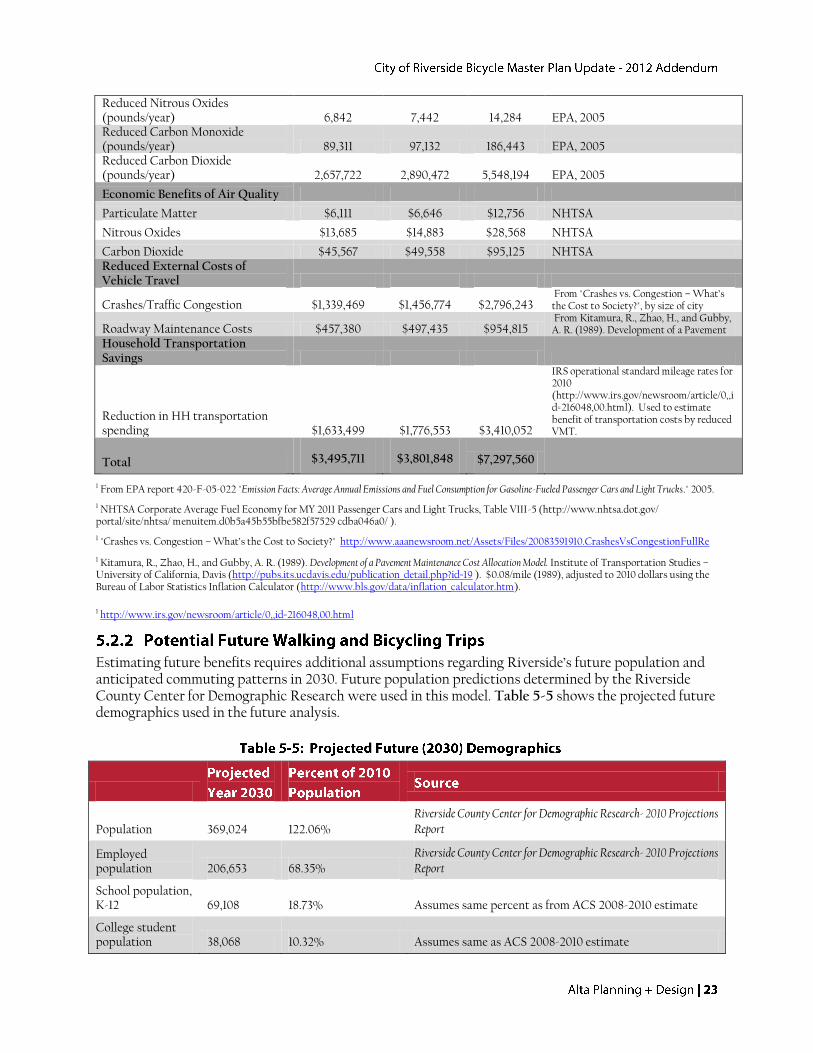
Reduced Nitrous Oxides (pounds/year) 6,842 7,442 14,284 EPA, 2005 Reduced Carbon Monoxide (pounds/year) 89,311 97,132 186,443 EPA, 2005 Reduced Carbon Dioxide (pounds/year) 2,657,722 2,890,472 5,548,194 EPA, 2005
Economic Benefits of Air Quality
Particulate Matter $6,111 $6,646 $12,756 NHTSA
Nitrous Oxides $13,685 $14,883 $28,568 NHTSA
Carbon Dioxide $45,567 $49,558 $95,125 NHTSA Reduced External Costs of Vehicle Travel
Crashes/Traffic Congestion $1,339,469 $1,456,774 $2,796,243 From "Crashes vs. Congestion – What’s the Cost to Society?", by size of city
Roadway Maintenance Costs $457,380 $497,435 $954,815 From Kitamura, R., Zhao, H., and Gubby, A. R. (1989). Development of a Pavement
Household Transportation Savings
Reduction in HH transportation spending $1,633,499 $1,776,553 $3,410,052
IRS operational standard mileage rates for 2010 (http://www.irs.gov/newsroom/article/0,,id=216048,00.html). Used to estimate benefit of transportation costs by reduced VMT.
Total $3,495,711 $3,801,848 $7,297,560
1 From EPA report 420-F-05-022 "Emission Facts: Average Annual Emissions and Fuel Consumption for Gasoline-Fueled Passenger Cars and Light Trucks." 2005.
1 NHTSA Corporate Average Fuel Economy for MY 2011 Passenger Cars and Light Trucks, Table VIII-5 (http://www.nhtsa.dot.gov/ portal/site/nhtsa/ menuitem.d0b5a45b55bfbe582f57529 cdba046a0/ ).
1 "Crashes vs. Congestion – What’s the Cost to Society?" http://www.aaanewsroom.net/Assets/Files/20083591910.CrashesVsCongestionFullRe
1 Kitamura, R., Zhao, H., and Gubby, A. R. (1989). Development of a Pavement Maintenance Cost Allocation Model. Institute of Transportation Studies – University of California, Davis (http://pubs.its.ucdavis.edu/publication_detail.php?id=19 ). $0.08/mile (1989), adjusted to 2010 dollars using the Bureau of Labor Statistics Inflation Calculator (http://www.bls.gov/data/inflation_calculator.htm).
1 http://www.irs.gov/newsroom/article/0,,id=216048,00.html
Estimating future benefits requires additional assumptions regarding Riverside’s future population and anticipated commuting patterns in 2030. Future population predictions determined by the Riverside County Center for Demographic Research were used in this model. Table 5-5 shows the projected future demographics used in the future analysis.
Population 369,024 122.06%
Riverside County Center for Demographic Research- 2010 Projections Report
Employed population 206,653 68.35%
Riverside County Center for Demographic Research- 2010 Projections Report
School population, K-12 69,108 18.73% Assumes same percent as from ACS 2008-2010 estimate
College student population 38,068 10.32% Assumes same as ACS 2008-2010 estimate

Bicycling mode share was increased to address the higher use potentially generated by the addition of
new facilities and enhancements to the existing system. The analysis predicts the bicycle mode split
increase caused by development of the proposed bicycle network and education/encouragement
programs. The “network completion factor” used in this analysis is the ratio of roadways with bikeway
facilities. While many factors affect people’s choice to bicycle in a community, development of a network
of bicycle lanes and other facilities is a key component of encouraging bicycling. The predicted bicycle
mode split is 3.6% in 2030. The results of the model are shown in Table 5-6.
Commute Trips
Bicycle/walking commuters 7,488 7,593 Employed population multiplied by mode split
Weekday bicycle/ walking trips 14,975 15,185
Number of bicycle/walking commuters multiplied by two for return trips
School Trips
K-12 bicycle/ walking commuters 2,504 12,942 School children population multiplied by mode split
Weekday K-12 bicycle/ walking trips 5,008 25,884
Number of student bicyclists multiplied by two for return trips
College Trips
College bicycle/ walking commuters 1,130 1,146 Employed population multiplied by mode split
Weekday bicycle/ walking college trips 2,260 2,292
Number of college student bicyclists multiplied by two for return trips
Utilitarian Trips
Daily adult bicycle/ walking commute trips 17,235 17,477
Number of bicycle/walking trips plus number of bicycle/walking college trips
Daily bicycle/walking utilitarian trips 26,994 61,437
Number of utilitarian bicycle/walking trips multiplied by bicycle/walking utilitarian trip multiplier, spread over entire week (vs. commute trips over 5 days)
Total Future Daily Trips
Yearly bicycle/walking trips 15,188,755 31,914,822 47,103,577
Yearly vehicle trips reduced from bicycling/walking trips 11,252,884 22,194,460 33,447,343
Yearly vehicle miles reduced from bicycling/walking trips 25,811,621 14,918,122 40,729,743

The trip replacement factors remain the same as in the model of current trips. This analysis projects that
the number of annual walking and bicycling trips in 2030 will be approximately 47 million, which will
reduce 33 million annual vehicle trips and reduce nearly 41 million vehicle miles traveled as a result of
bicycling and walking in the City of Riverside.
Table 8 shows the air quality benefits of the future projected walking and bicycling trips in Riverside.
Yearly vehicle miles reduced 25,811,621 14,918,122 40,729,743
Air Quality Benefits Reduced Hydrocarbons (pounds/year) 77,391 44,729 122,119 EPA, 2005 Reduced Particulate Matter (pounds/year) 575 332 907 EPA, 2005 Reduced Nitrous Oxides (pounds/year) 54,060 31,244 85,304 EPA, 2005 Reduced Carbon Monoxide (pounds/year) 705,621 407,821 1,113,442 EPA, 2005 Reduced Carbon Dioxide (pounds/year) 20,997,902 12,135,978 33,133,880 EPA, 2005 Economic Benefits of Air Quality
Particulate Matter $6,111 $27,903 $34,013 NHTSA
Nitrous Oxides $108,119 $62,489 $170,608 NHTSA
Carbon Dioxide $360,015 $208,075 $568,089 NHTSA Reduced External Costs of Vehicle Travel
Crashes/Traffic Congestion $10,582,765 $6,116,430 $16,699,195 From "Crashes vs. Congestion – What’s the Cost to Society?", by size of city
Roadway Maintenance Costs $3,613,627 $497,435 $4,111,062 From Kitamura, R., Zhao, H., and Gubby, A. R. (1989). Development of a Pavement
Household Transportation Savings
Reduction in HH transportation spending $12,905,810 $7,459,061 $20,364,872
IRS operational standard mileage rates for 2010 (http://www.irs.gov/newsroom/article/0,,id=216048,00.html). Used to estimate benefit of transportation costs by reduced VMT.
Total $27,576,447 $14,371,392 $41,947,839
1 From EPA report 420-F-05-022 "Emission Facts: Average Annual Emissions and Fuel Consumption for Gasoline-Fueled Passenger Cars and
Light Trucks." 2005.
This chapter provides an update of the recommended infrastructure and non-infrastructure projects from
the adopted 2007 Riverside Bicycle Master Plan.
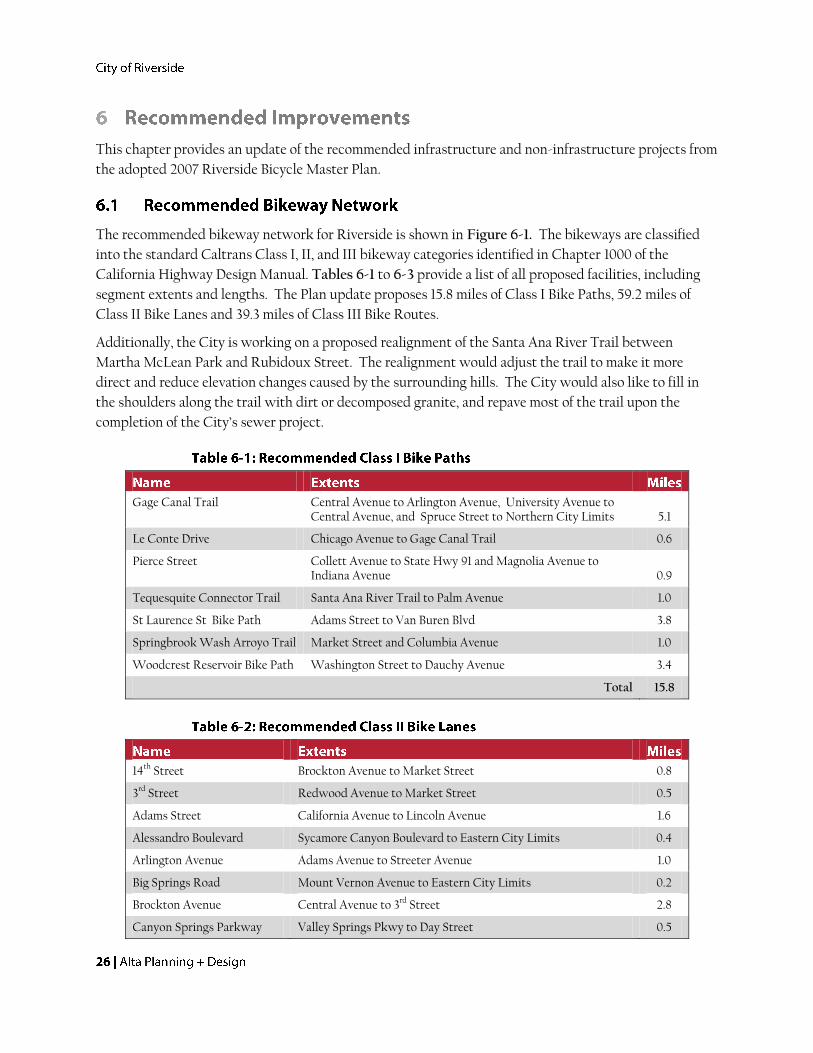
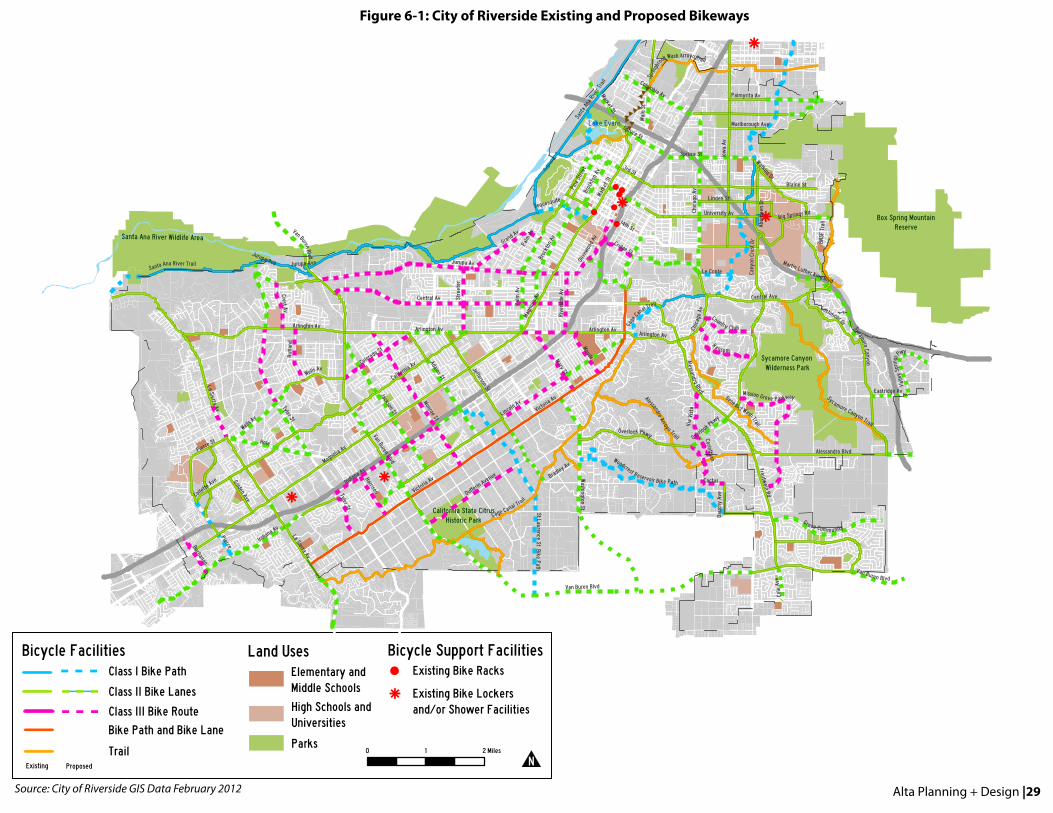
The recommended bikeway network for Riverside is shown in Figure 6-1. The bikeways are classified
into the standard Caltrans Class I, II, and III bikeway categories identified in Chapter 1000 of the
California Highway Design Manual. Tables 6-1 to 6-3 provide a list of all proposed facilities, including
segment extents and lengths. The Plan update proposes 15.8 miles of Class I Bike Paths, 59.2 miles of
Class II Bike Lanes and 39.3 miles of Class III Bike Routes.
Additionally, the City is working on a proposed realignment of the Santa Ana River Trail between
Martha McLean Park and Rubidoux Street. The realignment would adjust the trail to make it more
direct and reduce elevation changes caused by the surrounding hills. The City would also like to fill in
the shoulders along the trail with dirt or decomposed granite, and repave most of the trail upon the
completion of the City’s sewer project.
Gage Canal Trail Central Avenue to Arlington Avenue, University Avenue to Central Avenue, and Spruce Street to Northern City Limits 5.1
Le Conte Drive Chicago Avenue to Gage Canal Trail 0.6
Pierce Street Collett Avenue to State Hwy 91 and Magnolia Avenue to Indiana Avenue 0.9
Tequesquite Connector Trail Santa Ana River Trail to Palm Avenue 1.0
St Laurence St Bike Path Adams Street to Van Buren Blvd 3.8
Springbrook Wash Arroyo Trail Market Street and Columbia Avenue 1.0
Woodcrest Reservoir Bike Path Washington Street to Dauchy Avenue 3.4
Total 15.8
14th Street Brockton Avenue to Market Street 0.8
3rd Street Redwood Avenue to Market Street 0.5
Adams Street California Avenue to Lincoln Avenue 1.6
Alessandro Boulevard Sycamore Canyon Boulevard to Eastern City Limits 0.4
Arlington Avenue Adams Avenue to Streeter Avenue 1.0
Big Springs Road Mount Vernon Avenue to Eastern City Limits 0.2
Brockton Avenue Central Avenue to 3rd Street 2.8
Canyon Springs Parkway Valley Springs Pkwy to Day Street 0.5

Chicago Avenue Le Conte Drive to Columbia Avenue 2.8
Cole Avenue Van Buren Avenue to Krameria Avenue 0.6
Columbia Avenue Santa Ana River Trail to I- 215 1.4
Cridge Street Victoria Avenue to Chicago Avenue 1.3
Eastridge Avenue Sycamore Canyon to Valley Springs Pkwy 0.6
Grove Community Trautwein Road to Eastern City Limits 2.0
Hole Avenue Wells Avenue to Tyler Street 1.3
Indiana Avenue McKinley Street to Valle Road and Monroe Street to Adams Street
3.6
Jackson Street Van Buren Boulevard to Victoria Avenue 2.6
Jefferson Street Victoria Avenue to Bradley Street 1.1
John F Kennedy Drive Branding Iron Road to Trautwein Road 0.1
Jurupa Avenue Santa Ana River Trail to Crest Avenue 0.4
La Sierra Avenue Magnolia Avenue to Montlake Drive and Cleveland Avenue to Lake Knoll Parkway
1.1
Lincoln Avenue Harrison Street to Van Buren Boulevard and Mary Street to Victoria Avenue
1.7
Main Street State Hwy 60 Ramps to Columbia Avenue 0.7
Market Street State Hwy 60 to Northern City Limits 0.8
Overlook Parkway Crystal Avenue to Trautwein Road 0.8
Palm Avenue Arlington Avenue to Bandini Avenue 2.0
Palmyrita Avenue Northgate Street to Mount Vernon Avenue 1.0
Panorama/Ivy/Myrtle Olivewood Avenue to Victoria Avenue 1.0
Pine Street Tequesquite Avenue to 14th Street and University Avenue to 3rd Street
0.6
Redwood Drive University Avenue to 3rd Street 0.4
Serpentine Drive Michigan Avenue to Northern City Limits 0.8
Spruce Street Market Street to Watkins Drive 2.3
Sycamore Canyon Boulevard Lochmoor Drive to El Cerrito Drive 1.1
Tyler Street Jurupa Avenue to Arlington Avenue and Wells Avenue to Hole Avenue
2.2
University Avenue Market Street to Park Avenue 0.7
Van Buren Boulevard California Avenueto Magnolia Avenue, Indiana Avenue to Victoria Avenue, Cleveland to Wood Avenue, and Orange Terrace Parkway to Clark Street
9.6
Valley Springs Parkway Eastridge Avenue to Canyon Springs Pkwy 0.7
Victoria Avenue Arroyo Drive to 14th Street 0.8
Washington Street Victoria Avenue to Van Buren Boulevard 3.9
Wells Avenue La Sierra Avenue to Crest Avenue 1.4
Total 59.2

Arlington Avenue Magnolia Avenue to Indiana Avenue 1.1
Berry Road Crystal View Terrace to Corinthian Way 0.1
Buchanan Street Corona Fwy to Indiana Avenue 0.7
Cactus Avenue Crystal View Terrace to Dauchy Avenue 0.4
Central Avenue Van Buren Boulevard to Riverside Avenue 4.0
Colorado Street Van Buren Boulevard to Arlington Avenue 1.4
Corinthian Way Overlook Parkway to Berry Road 0.2
Country Club Drive Chicago Avenue To Canyon Crest Drive 0.9
Crest Avenue Jurupa Avenue to Arlington Avenue 0.8
Cridge Street Olivewood Avenue to Victoria Avenue 0.5
Crystal View Terrace Overlook Parkway to Cactus Avenue 0.8
Dufferin Avenue Van Buren Blvd to St. Lawrence 1.9
Grand Avenue Jurupa Avenue to Bandini Avenue 1.4
Harrison Street Indiana Avenue to Victoria Avenue 0.8
Indiana Avenue Tyler Street to Monroe Street 2.1
Jurupa Avenue Van Buren Boulevard to Olivewood Avenue 4.5
La Sierra Avenue Gramercy Street to Hole Avenue 0.6
Lincoln Avenue Jefferson Street to Mary Street 1.3
Mary Street Arlington Avenue to Victoria Avenue 1.2
Maude Street Arlington Avenue to Victoria Avenue 0.8
Mission Grove Parkway Canyon Crest Drive to Trautwein Road 2.6
Monroe Street Arlington Avenue to Victoria Avenue 2.7
Olivewood Avenue Jurupa Avenue to 14th Street 1.1
Ransom Road Chicago Avenue to Canyon Crest Drive 1.2
Riverside Avenue Jurupa Avenue to Arlington Avenue 1.0
Rutland Avenue Arlington Avenue to Wells Avenue 0.9
Streeter Avenue Jurupa Avenue to Arlington Avenue 1.1
Tyler Street Arlington Avenue to Wells Avenue 2.2
Via Vista Drive Corinthian Way to Alessandro Boulevard 1.0
Total 39.3
0 21 Miles
Class I Bike Path
Existing
Bicycle Facilities Land Uses Bicycle Support Facilities
Class II Bike Lanes
Class III Bike Route
Trail
High Schools andUniversities
Elementary andMiddle Schools
ParksN
!
k
Existing Bike Racks
Existing Bike Lockersand/or Shower Facilities
Bike Path and Bike Lane
Proposed
##
##
###
####
Source: City of Riverside GIS Data February 2012 Alta Planning + Design |29
Figure 6-1: City of Riverside Existing and Proposed Bikeways
!
!!!
!!
k
k
kk
k
Santa Ana River Wildlife Area
California State CitrusHistoric Park
Sycamore Canyon Wilderness Park
Box Spring MountainReserve
Lake Evans
Van Buren Blvd
Lincoln AvTyler St
Iow
a Av
Victoria Av
Gage Canal Trail
3rd St
Indiana Av
Jurupa Av
Central Av
Hole
Chic
ago
Av
Monroe St
Washington St
Watkins Dr
Jackson St
Columbia Av
Main
St
La Sierra Av
Magn
olia
Av
Cany
on C
rest
Dr
Spruce St
Palm
Av
California Av
Cridge St
University Av
Central Ave
Alessandro Blvd
Adams St
Jefferson St
Trautwein Rd
BNSF
Tra
il
Pierce St
Arlington Av
Grand Av
Broc
kton
Av
Overlook Pkwy
Sycamore Canyon
Sycamore Canyon Trail
Stre
eter
R ansom
Wells A
v
Palmyrita Av
Alessandro Arroyo Trail
Maude
Santa Ana River Trail
Benedict Wash Trail
Colorado St
Rutla
nd
Via
Vist
a
Mary St
Grove Community
Crest Av Lochmoor Dr
Harrison
Woodcrest Reservoir Bike Path
Linden St
Rive
rsid
e Av
Market St
Olive
wood
Av
Blaine StPine
Stre
et
Buchanan
St Laurence St Bike Path
Pierce
Country Club
Golden Ave
Le Conte
Collette Ave Cactus
Mission Grove Parkway
Sprin
gbroo
k Wash Arroyo Trail
Dauc
hy A
ve
Marlborough Ave
Jurupa Ave
Tequesquite
14th St
Big Springs Rd
Martin Luther King Blvd
Aber
deen
Dr
Corinthian
Gage
Canal Trail
Van Buren Blvd
Van Buren Blvd
Magnolia Av
Alessandro Blvd
La Sierra Av
Arlington Av
Mark
et S
t
Victoria Av
Broc
kton
Av
Arlington Av
Wells Av
Chic
ago
Av
Jurupa Ave
Indiana Av
Spruce St
Arlington Av
Overlook Pkwy
Tyler St
Sant
a Ana
Rive
r Tra
il
Palm
Av
Dufferin Avenue
Eastridge Av
Valle
y Sp
rings
Pwy
Cole
Ave
Bradley Av
Van Buren Blvd

On bike route segments where on-street parking is present and the speed limits are appropriate, this plan
recommends using “Shared Lane Marking” stencils (commonly referred to as “sharrows”). Sharrows have
been introduced for use in California as an additional treatment for Class III facilities. Section 9C-07 of
the California MUTCD states that the shared roadway bicycle marking is intended to:
Reduce the chance of collisions between open doors of parked vehicles and bicyclists on a roadway
with on-street parallel parking.
Alert road users within a narrow traveled way of the lateral location where bicyclists ride.
Encourage safe passing of bicyclists by motorists, and reduce the incidence of wrong way bicycling.
Design considerations for shared lane markings include:
Use “ Bike Route” sign (D11-1) as specified for shared roadways in the California-MUTCD.
Share lane markings should not be placed on roadways with speed limit at or above 35MPH
(California MUTCD).
Marking should be placed immediately after an intersection and spaced at intervals no greater than
250 feet hereafter.
Use only on a roadway Class III Bikeway (bike route) or shared roadway (no bikeway designation)
which has on-street parallel parking. If used on a street without on-street parking that has an outside
travel lane that is less than 14 feet wide, the centers of the Shared Lane Markings should be at least 4
feet from the face of the curb, or from the edge
of the pavement where there is no curb.
Figure 6-2 shows the shared lane marking placement guidance for streets with on-street parking.
The City is considering implementing bicycle boulevards to connect to popular destinations in the City,
such as the University of California, Riverside campus. Bicycle Boulevards are local roads or residential
streets that are enhanced with traffic calming and other treatments to facilitate safe and convenient
bicycle travel. Bicycle boulevards accommodate bicyclists and motorists in the same travel lanes,
without specific vehicle or bicycle lane delineation. These roadway designations prioritize bicycle travel
above vehicular travel. The treatments which create a Bicycle Boulevard heighten motorists’ awareness
of bicyclists and slow vehicle traffic, making the boulevard more conducive to safe bicycle and pedestrian
activity.
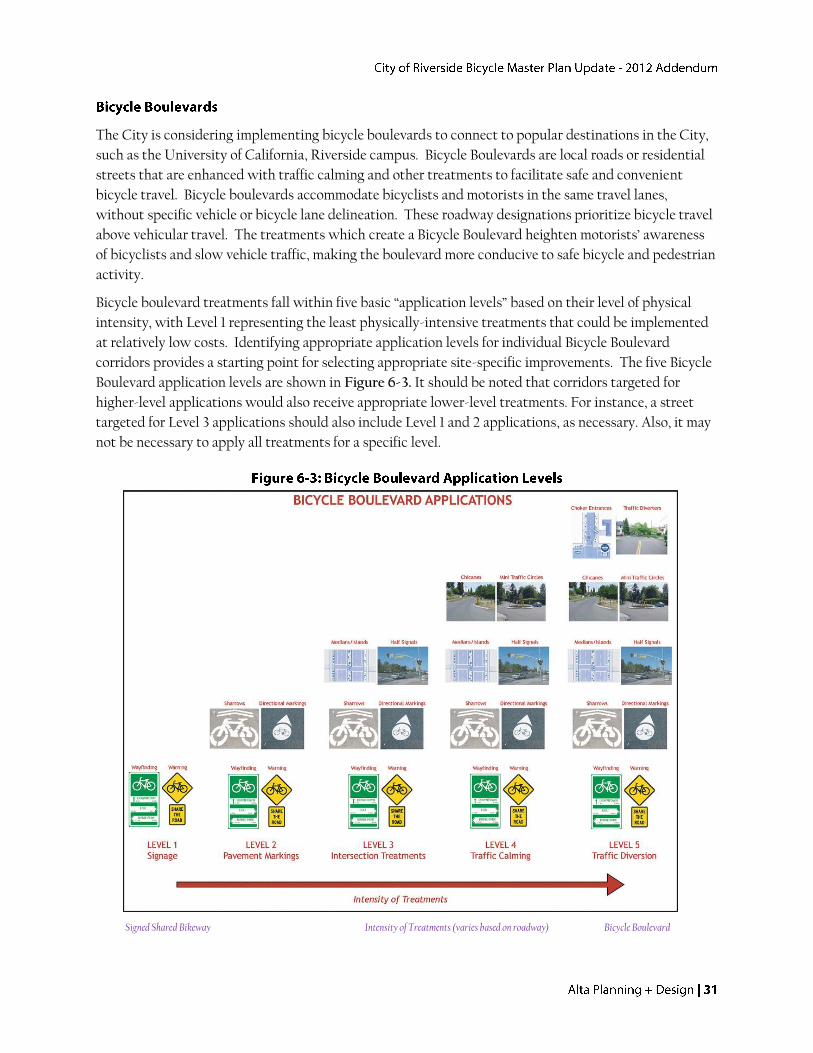
Bicycle boulevard treatments fall within five basic “application levels” based on their level of physical
intensity, with Level 1 representing the least physically-intensive treatments that could be implemented
at relatively low costs. Identifying appropriate application levels for individual Bicycle Boulevard
corridors provides a starting point for selecting appropriate site-specific improvements. The five Bicycle
Boulevard application levels are shown in Figure 6-3. It should be noted that corridors targeted for
higher-level applications would also receive appropriate lower-level treatments. For instance, a street
targeted for Level 3 applications should also include Level 1 and 2 applications, as necessary. Also, it may
not be necessary to apply all treatments for a specific level.
Signed Shared Bikeway Intensity of Treatments (varies based on roadway) Bicycle Boulevard
conditions and area characteristics)

Bike Parking Corrals provide high-volume on-street
bicycle parking and is a relatively inexpensive solution.
Bike racks are installed in the street and are protected
from motor vehicles with removable curbs and bollards.
These facilities move bicycles off the sidewalks leaving
space for pedestrians, local business, or residents to use.
Bike Corrals can be accommodated by converting vehicle
parking spaces or placing them in no-parking zones.
Bicycle parking does not block sightlines like motor
vehicles do so it may be beneficial to place them on streets
where visibility of oncoming vehicle traffic is a concern.
Bike Corrals are recommended at Riverside Plaza,
Brockton Arcade, and Downtown
Bike Share programs can provide safe and convenient
access to bicycles for short trips, such as running errands
during lunch, and transit-work trips. The international
community has experimented with Bike Share programs
for nearly 40 years. Bike Share programs, such as systems
in Washington, DC and Boston, Massachusetts, help
increase cycling mode share, serve as an extension to the
public transit system, reduce a city’s travel-related carbon
footprint and provide additional ‘green’ jobs related to
system management and maintenance. The City of
Riverside should consider implementing a Bike Share
Program in the downtown core or near bus stops and
Metrolink Stations
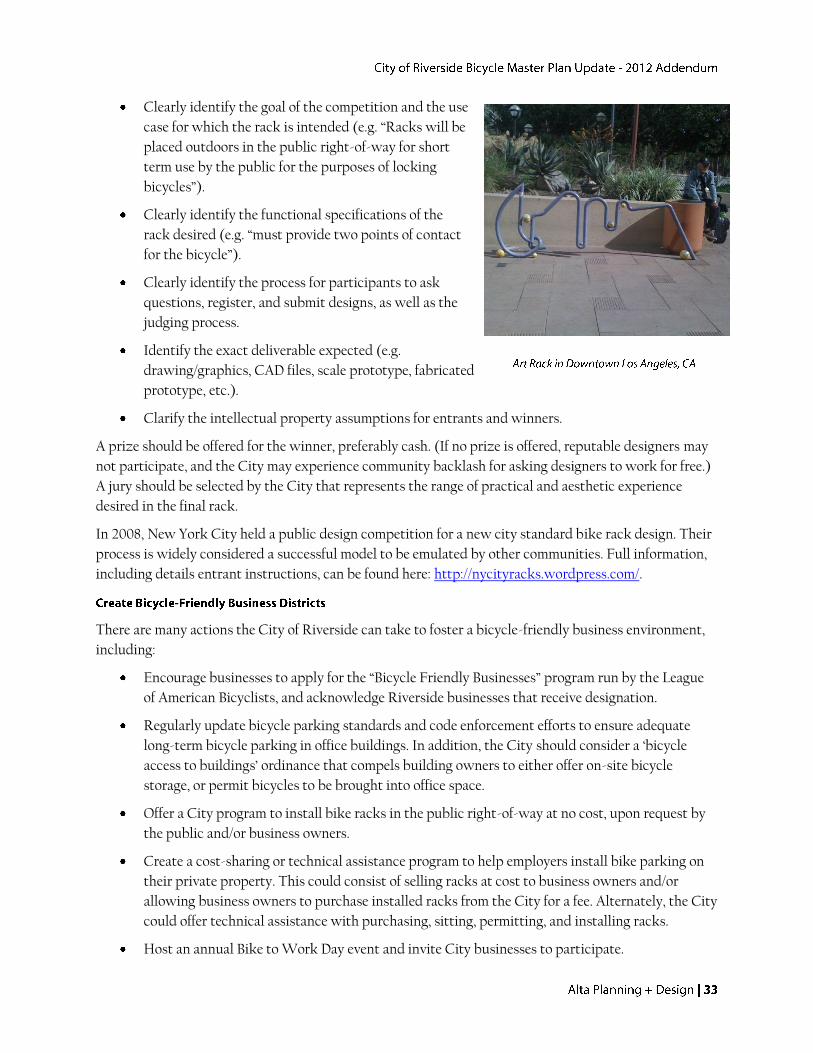
Artistic bicycle racks create a signature public art presence that also fulfills a necessary urban function of
providing bicycle parking spaces. A design competition is one way to stimulate creativity and create a
unique design that enhances Riverside’s reputation as an outstanding bicycle-friendly community.
The City should manage a design competition to identify a new City art rack that will be installed
throughout the city. The competition should:
Clearly identify the goal of the competition and the use
case for which the rack is intended (e.g. “Racks will be
placed outdoors in the public right-of-way for short
term use by the public for the purposes of locking
bicycles”).
Clearly identify the functional specifications of the
rack desired (e.g. “must provide two points of contact
for the bicycle”).
Clearly identify the process for participants to ask
questions, register, and submit designs, as well as the
judging process.
Identify the exact deliverable expected (e.g.
drawing/graphics, CAD files, scale prototype, fabricated
prototype, etc.).
Clarify the intellectual property assumptions for entrants and winners.
A prize should be offered for the winner, preferably cash. (If no prize is offered, reputable designers may
not participate, and the City may experience community backlash for asking designers to work for free.)
A jury should be selected by the City that represents the range of practical and aesthetic experience
desired in the final rack.
In 2008, New York City held a public design competition for a new city standard bike rack design. Their
process is widely considered a successful model to be emulated by other communities. Full information,
including details entrant instructions, can be found here: http://nycityracks.wordpress.com/.
There are many actions the City of Riverside can take to foster a bicycle-friendly business environment,
including:
Encourage businesses to apply for the “Bicycle Friendly Businesses” program run by the League
of American Bicyclists, and acknowledge Riverside businesses that receive designation.
Regularly update bicycle parking standards and code enforcement efforts to ensure adequate
long-term bicycle parking in office buildings. In addition, the City should consider a ‘bicycle
access to buildings’ ordinance that compels building owners to either offer on-site bicycle
storage, or permit bicycles to be brought into office space.
Offer a City program to install bike racks in the public right-of-way at no cost, upon request by
the public and/or business owners.
Create a cost-sharing or technical assistance program to help employers install bike parking on
their private property. This could consist of selling racks at cost to business owners and/or
allowing business owners to purchase installed racks from the City for a fee. Alternately, the City
could offer technical assistance with purchasing, sitting, permitting, and installing racks.
Host an annual Bike to Work Day event and invite City businesses to participate.
Create a municipal bike sharing program, and invite other employers the opportunity to pay to
participate in the same system on their worksite.
Offer Bike Commute 101 clinics regularly. Ideally, these would be offered at workplaces to
employees, and would offer advice about commuting, distribute maps and other information, and
answer questions.
In 2010, the City of Long Beach created the nation’s first Bike-Friendly Business District (BFBD)
program, which has enhanced the popularity of Long Beach’s bicycle friendly community. This program
encourages residents and tourists to dine and shop locally. More information about this program can be
found here: http://www.bikelongbeach.org/Planning/Read.aspx?ArticleId=20
The challenges of maintenance and operations of current and future trails can be easily met through an
Adopt-a-Trail Program. This program helps coordinate volunteers and events to assist jurisdictions in
monitoring trail use and conditions. Volunteers can be trained to report back to cities on maintenance,
needs, improvements, environmental issues and other concerns as well as provide details on trail
conditions after each walk, provide trail information to other users, help prioritize maintenance needs
requiring immediate versus long-term attention, and organize periodic maintenance days to improve the
trail environment. Adopt-a-Trail is a cost efficient solution to keeping existing trails clean, accessible,
and safe and may serve as an effective tool for enabling the development of new trails.
Keep Riverside Clean and Beautiful (KRCB) is a nonprofit community program sponsored by the City of
Riverside’s Public Works Department and the Greater Riverside Chamber of Commerce that runs an
existing Adopt-a- Street Program. The City is working with KRCB to implement a similar program for
its trails.