Embed Size (px)
Citation preview

City of Philadelphia
Child Death Review Report 2006-2008
A report that describes and discusses child deaths, 2006-2008, that were reviewed by the Philadelphia Child Death Review Teams October 2010
53

Dedication and Acknowledgments This report is but a small representation of the hard work of numerous individuals across the Philadelphia region – both the former and the current members of the Philadelphia Child Death Review teams, the Fatality Review Program staff members, as well as the countless others who play a role in the life and/or death of the children of Philadelphia. It is through quality data gathering and analysis that we can hope to frame the public health problem at hand. And is only from there that we can make informed recommendations for public health interventions: actions that can ultimately prevent future child deaths. The Philadelphia Child Death Review team members, despite dealing with copious amounts of data at their meetings, always keep in mind that every child’s death is not just a number – but an extremely tragic loss for the family and the greater community. We dedicate this report to the memory of the many infants, children and youth we have reviewed.
Prepared by
Roy Hoffman, MD, MPH – Medical Director, Fatality Review Program, Medical Examiner’s Office Rebecca Drake, MPH – Epidemiologist/Data Manager, Medical Examiner’s Office
Philadelphia Department of Public Health
54

Table of Contents
Executive Summary . . . . . . . . . . . . . . . . . . . . . . . . . . . . . . . . . . . . . . . . . . . . . . . . . . . . . . . . . . . . . 1
Section I: Background . . . . . . . . . . . . . . . . . . . . . . . . . . . . . . . . . . . . . . . . . . . . . . . . . . . . . . . . . . . .3 History of Child Death Review in Philadelphia Purpose of Child Death Review The Philadelphia Child Death Review Process
Section II: Overview of Child Deaths Reviewed, 2006‐2008 . . . . . . . . . . . . . . . . . . . . . . . . . . . . . . . . . . . . . .9 Basic Demographics Map of All Child Deaths Reviewed
Section III: Focus on Infant Deaths . . . . . . . . . . . . . . . . . . . . . . . . . . . . . . . . . . . . . . . . . . . . . . . . . . . .14 Infant Death Demographics Sleep‐Related Infant Deaths Prematurity‐Related Infant Deaths
Section IV: Natural Deaths . . . . . . . . . . . . . . . . . . . . . . . . . . . . . . . . . . . . . . . . . . . . . . . . . . . . . . . . 25 Natural Death Demographics Infectious Disease Deaths Asthma Deaths Cancer Deaths
Section V: Unintentional Injury Deaths . . . . . . . . . . . . . . . . . . . . . . . . . . . . . . . . . . . . . . . . . . . . . . . . .30 Unintentional Injury Death Demographics Transportation‐Related Deaths Non‐Transportation‐Related Deaths
o Drowning Deaths o Fire Deaths o Poisoning Deaths o Other Deaths
Section VI: Intentional Injury Deaths . . . . . . . . . . . . . . . . . . . . . . . . . . . . . . . . . . . . . . . . . . . . . . . . . . 43 Child Abuse & Neglect Deaths Homicides (other than Child Abuse & Neglect)
o Map of Youth Homicides Reviewed Suicides
Appendix . . . . . . . . . . . . . . . . . . . . . . . . . . . . . . . . . . . . . . . . . . . . . . . . . . . . . . . . . . . . . . . . . . . 53 Child Death Review Team Rosters (2006‐2010) Fatality Review Program Staff Resources and Links
55

Executive Summary The death of a child, particularly an infant, is a sentinel event and an indicator of the health of a community as a whole. While most child deaths are unexpected, every child death is a tragic event that leaves a large wake of pain and suffering for the many people who had been involved in that child’s life – whether a parent, a friend, a classmate, a younger sibling, a babysitter, a neighbor, or a teacher. Whenever a child dies, the first question typically asked is how might the death have been prevented. As compared to national and state rates, Philadelphia suffers from very high rates of infant mortality as well as violent deaths amongst our youth; yet many of these deaths could have been prevented. Part of the purpose of child death review teams is to help decrease the number of preventable child deaths for the future. The Philadelphia Department of Public Health has been the local organizer of this process for nearly the past two decades. The numbers may seem depressing, and the job may seem insurmountable at times, but this is a task that requires large, constant efforts. The benefits of this process, however, are clear and compelling. Daunting Numbers The Philadelphia Child Death Review (PCDR) teams have been reviewing child deaths uninterrupted since 1993.
With a population of approximately 1.5 million persons, Philadelphia experienced an annual average of over 475 child deaths (ages 21 years and under) for the years 2006 through 2008.
Nearly one‐quarter of all child deaths in the entire state of Pennsylvania occur to Philadelphia residents In 2009, the PCDR teams alone conducted approximately 40% of all the child deaths reviewed in Pennsylvania
Improved Processes Since 2008
For child deaths in the years 2006 through 2008, the percentage of eligible cases that were ultimately reviewed by the PCDR teams improved from 68% to 90%
o It is anticipated that the PCDR teams will review 98% or more of eligible cases moving forward Over the last three years of review (2008‐2010), the total number of cases reviewed has increased from 283
cases in 2008, to an estimated 574 cases in 2010. Over the last three years of review (2008‐2010), the average lag time between the date of a child’s death to date
of child death review has decreased from over 15 months to just over 6 months. Some key finding about different categories of death are summarized below: Infant Deaths High rates of infant mortality continue to be a vexing problem in Philadelphia.
For Philadelphia deaths age 21 years and under, nearly half of all child deaths occurs in infants, and nearly half of those infant deaths are due to prematurity.
From 2006 through 2008, an average of approximately 50 infants per year (or one infant every week) died suddenly and unexpectedly in Philadelphia.
Of the infant deaths in 2006‐2008 that were reviewed, 14 infants died of unintentional suffocation. Every single one of those 14 unintentional suffocation deaths could have been prevented had the infant been placed in a safe sleep environment.
Unintentional Injury Deaths
For child deaths in 2006‐2008 that were reviewed, 46 children died from transportation‐related injuries o Alcohol or drug use was a contributing factor to 17% of these deaths o Speeding was a contributing factor to 43% of these deaths o A large majority of the non‐pedestrian fatalities (89%) were not using proper safety features at the
time of injury (helmets with motorcycles, ATV or bicycles; seatbelts with other motorized vehicles) For child deaths in 2006‐2008 that were reviewed, 29 children died in 15 fire events (along with 14 adults)
o Of the 11 fire events where data was available, 91% of the homes did not have a working fire alarm
1

Intentional Injury Deaths For 2006‐2008 deaths that were reviewed, fourteen children were killed as a result of child abuse or neglect When averaged out over the last seven years, Philadelphia has experienced approximately one youth homicide
(aged 21 years and under) every four days. That is almost eight youth homicides per month, every month, for the past several years.
In Philadelphia, the typical youth homicide victim is male, Black, and aged 17 years or older. In Philadelphia, the typical youth homicide defendant is male and aged 15‐24 years For 2007‐2008 deaths that were reviewed, 73% of child suicides were carried out by hanging
Next Steps for 2011 The Fatality Review Program will continue to refine and improve the process of child death review in Philadelphia over the coming year and expand its outreach by:
Further improving data quality (data collection, data coding, data entering, data storing, data tracking) o Only through high‐quality data gathering can quality data analysis be performed, which can then help
guide informed prevention recommendations and initiatives Maintaining quantity and efficiency of reviews (review at least 98% of eligible cases moving forward; further
reduce average lag time from date of death to date of review to the final goal of 4‐5 months) Further improving review team meeting structure (more streamlined, more issue‐driven, more interactive) Seeking out increased collaborations with academic partners for potential research projects (academic research
partners who would not just be users of the data, but also resource donors as well as contributors to the upkeep of the data systems)
Seeking out increased outreach opportunities in the community (e.g. lectures for medical and public health students, presentations to community‐based organizations, co‐sponsoring of prevention initiatives, increased bereavement support for grieving family members)
Increasing the frequency of reporting (the next child death review report will be a combination two‐year report, but annual reports will follow thereafter)
2

Section I: Background History of Child Death Review in Philadelphia The concept of conducting reviews of individual deaths dates back over 75 years, when the Medical Society of New Jersey initiated a maternal mortality review in 1931. However, it wasn’t until 1978 that the first child death review process was started in Los Angeles – where a local team convened in order to better identify deaths due to child abuse and neglect. Over the ensuing 30+ years, child death review teams have been established over most of the country, at both the local and state levels. Pennsylvania, like several other states over the past decade, passed its own legislation on child death reviews in October 2008. Pennsylvania’s Public Health Child Death Review Act (Act 87) mandates that every county in the Commonwealth must convene a local team to review the deaths of all children aged 21 years and under. The Philadelphia Department of Public Health (PDPH) started the first child death review in the City of Philadelphia in June 1993. While the name and the management of Philadelphia Child Death Review has changed several times since its inception, the process, itself, has continued uninterrupted until the present day:
June 1993 through September 2005: Philadelphia Interdisciplinary Youth Fatality Review Team o Managed by the Philadelphia Health Management Corporation
October 2005 through December 2008: Philadelphia Interdisciplinary Mortality Review o Managed by Maternal, Child and Family Health, a division of the PDPH
January 2009 to the present: Fatality Review Program o Managed by the Medical Examiner’s Office, a division of the PDPH
The Purpose of Child Death Review According to the National Center for Child Death Review Policy and Practice, the purpose of the child death review process is to: “…conduct a comprehensive, multidisciplinary review of child deaths, to better understand how and why children die, and use the findings to take action that can prevent other deaths and improve the health and safety of children.” In Philadelphia, the purpose of our child death review process is no different. We want to look carefully at the circumstances surrounding each child’s death, with an eye for any shortfalls in systems or services, and with a focus on risk factors (and protective factors) that should ultimately lead to preventability of future child deaths. The Philadelphia Child Death Review (PCDR) process is a data‐driven process. We gather data for the hundreds of cases we review annually, enter the partially de‐identified information into a national database, and analyze the local data to help us guide our recommendations.
The important first steps of any public health problem‐solving technique is to first define the specific problem one wishes to address and then to measure the magnitude of that problem. How can child death review teams give effective recommendations on the prevention of child deaths if they don’t know what’s causing a substantial number of deaths in their community? How can child death review teams provide thoughtful recommendations on the utilization of limited public health and financial resources if they don’t know where exactly to direct such efforts? One might believe, through anecdote or from national trends, that a specific cause of death is a serious problem in Philadelphia. But unless it is measured, one can’t know for certain. That is why child death reviews are most effective if they follow a data‐driven process.
In addition to the end‐goal of preventing future child deaths, the child death review process is able to accomplish many short‐term or immediate goals, such as: improved collaboration across city and non‐city agencies, improved coordination of public health and law enforcement efforts, improved vital statistics accuracy, improved surveillance of child death data, and decreased misclassification of deaths.
3

The Philadelphia Child Death Review Process The Philadelphia Child Death Review (PCDR) is broken down into two separate teams: a Non‐Homicide team and a Homicide team. Each team has approximately 20‐25 members from various city and non‐city agencies, and both teams meet once per month to discuss the deaths of all children, ages birth through 21 years, who were residents of Philadelphia at the time of death. For a listing of current and past PCDR team members, please refer to the appendix. The Philadelphia Non‐Homicide and Homicide Child Death Review teams are not the only venue where a child’s death might be reviewed. The Medical Examiner’s Office Fatality Review Program also conducts the following review processes:
Homeless Death Review: eligible cases are Philadelphia residents who were homeless at the time of their death, regardless of age
Maternal Mortality Review: eligible cases are Philadelphia residents who died from pregnancy‐related or associated causes, regardless of age
Fetal & Infant Mortality Review: eligible cases are late‐term fetuses (20 weeks gestation and greater) or infants who die, regardless of cause of death [restricted to Philadelphia residents – whether the infant itself, or the mother in the case of a fetal death]; this manner of review is a different form of child death review, and it will be discussed in more detail later in this report
Coordination and Immediate Review Team (CIRT): eligible cases for this conference call are sudden, unexpected infant deaths, or the death of any child where the Department of Human Services (DHS) was notified; this process will also be explained in more detail later in this report
Team Meeting Process The mechanics of the team meeting process is similar for both the Non‐Homicide and Homicide Child Death Review teams: Approximately 20‐25 persons from various city and non‐city agencies, from multiple disciplines, comprise the membership of each team. Each two‐hour meeting is held at the Medical Examiner’s Office, once a month, for 11 months of the year. Members receive a list of all decedents (typically about 40 for the Non‐Homicide team, and about 10‐12 decedents and about 5‐8 defendants for the Homicide team), including names, dates of birth, dates of death, cause of death, and caregiver information. Team members look up the decedents (and their caregivers) in their organization’s database system and paper files. Members answer as many questions as they can about the decedent – as outlined by the National Center for Child Death Review’s Case Reporting System. Figure 1.1a Cases Reviewed by PCDR Teams, by Year of Review 2007‐2010 (n=1661)
Number of Cases Reviewed by Philadelphia Child Death Review Teams, by the Year of Review [2007 through 2010] (n=1661)
316283
488
574
0
100
200
300
400
500
600
2007 2008 2009 2010*
Year of Review
*2010 includes cases that are scheduled to be reviewed at the December 2010 meetings
4

As each decedent is discussed by the group, team members usually share what is known from their system. Members have the opportunity to ask questions for further clarification, point out problematic issues with the case, and offer recommendations for areas of preventability. At the end of each meeting, all team members hand in their data. All the data then gets coded into the Case Reporting System data collection sheets, and that information gets entered (partially de‐identified) into a national database.
For a listing of the data questions gathered, please refer to the National Center for Child Death Review’s Case Reporting System weblink in the resources section in the appendix.
All team members and guest members must sign a confidentiality statement once a year. All team members are reminded that all conversations at the meeting are said in confidence – and cannot be discussed outside the meeting. No follow‐back is allowed from these meetings. Eligible Cases for Review by the Philadelphia Child Death Review Teams Figure 1.1b Percentage of Eligible Cases Reviewed by PCDR Teams for Years of Death 2005‐2010
Percentage of Eligible Cases Reviewed, for Years of Death 2005-2010
6668
89 90
9598
50
75
100
2005 2006 2007 2008 2009 2010*
*Year of death 2010 percentage is an estimate
The two sole criteria for review by the PCDR teams are Philadelphia residency at the time of death and age of death 21 years and younger.
For years of death up until 2007, the PCDR teams used an age eligibility criteria of 19 years and younger. However, after Act 87 was passed, all Pennsylvania counties were mandated to review child deaths through age 21 years. As a result, for children who died in the year 2008 and onwards, the PCDR teams expanded their age eligibility criteria to age 21 years and younger.
5

Currently, the Fatality Review Program (FRP) staff learn about eligible cases for child death review in two different manners: through hard copies and electronic files of death certificates from the Pennsylvania Department of Health, and through the Medical Examiner’s Office (MEO) database. When the FRP was based in the Division of Maternal, Child and Family Health from 2005 through 2008, the only method they had for consistently identifying cases was through death certificates only.
Death certificates are initially filled out by the physician who certifies the cause of death – whether it is an MEO pathologist, a private‐practice physician, or a hospital‐based physician. The death certificate is completed by the funeral home, and it is then mailed to the Division of Vital Records in Harrisburg. In Harrisburg, the death certificates are sorted and ultimately entered into an electronic database. Death certificates of Philadelphia residents are then mailed to the Philadelphia Department of Public Health – where they are made available to the FRP staff.
Almost half of all child deaths (ages 21 years and younger) are reported to the MEO each year. Roughly 40‐45% of child deaths are considered ‘jurisdictional’ cases by the MEO and must be reported. [Jurisdictional cases include all homicides, all suicides, all accidental deaths, all undetermined deaths, and a handful of natural deaths.] An additional 10‐15% of (non‐jurisdictional) child deaths are called in to the MEO each year by local hospitals – whether as a courtesy, or to verify if a case is considered jurisdictional or not.
According to Philadelphia Vital Statistics, a person is considered a Philadelphia resident if they contain a valid Philadelphia address on the residency section of the death certificate. It is through this residency criteria that Philadelphia Vital Statistics analyzes the data that they use to write up their annual reports. The residency criteria for PCDR is not quite as strict as that employed by Philadelphia Vital Statistics. The PCDR teams will review cases where the county of residence is entered as Philadelphia on a death certificate, even if it does not contain a valid street address. Such is the situation – mostly with infants who died in the first hours of life – in about 10‐15 cases per year. In addition, the FRP teams are able to identify from the MEO database a handful of Philadelphia deaths each year that are never made known to Philadelphia Vital Statistics. The residency section of a death certificate can easily be incorrectly filled out, and if Philadelphia is not listed as the residence city, it is not counted by Philadelphia Vital Statistics.
In Pennsylvania, residency on the death certificate is not necessarily the same as mailing address, legal residency, or voting address. For example, if a student who was originally from outside the city, died while attending college and living in Philadelphia (e.g. in a dorm or an apartment), they should be considered a Philadelphia resident for death certificate and death review purposes.
In summary, numbers reported by the PCDR teams will vary from vital statistics based on two primary reasons: (1) slightly differing residency selection criteria and verification procedures used by PCDR teams and vital statistics; and (2) an inability of the PCDR staff to track down and review 100% of all eligible cases.
Those desiring to see an official listing and description of all deaths that occurred in Philadelphia should refer to the Philadelphia Vital Statistics reports, whose website is listed in the resources section of the appendix.
6

Lag Time from Date of Death to Date of Review Ever since the Fatality Review Program (FRP) was moved under the auspices of the Medical Examiner’s Office in January 2009, there has been a concerted effort not only to increase the percentage of eligible cases reviewed, but to also reduce the lag time from date of child death to date of review. In January 2009, cases were being reviewed an average of 15‐16 months after the child had died. By January 2010, the average lag time had been reduced to approximately 10‐11 months. As of November 2010, the lag time from date of death to date of review has been reduced to an average of 6‐7 months. Figure 1.1c Lag Time (in Months) of Cases Reviewed by PCDR Teams, From Date of Death to Date of Review
Lag Time (in Months) from Date of Child Death to Date of Review
16.5
10.5
6.5
4.5 4.5
0
5
10
15
20
Jan-0
9
Mar-09
May-09
Jul-0
9
Sep-09
Nov-09
Jan-1
0
Mar-10
May-10
Jul-1
0
Sep-10
Nov-10
Jan-1
1
Mar-11
May-11
Jul-1
1
Sep-11
Nov-11
Jan-1
2
FRP’s eventual goal is to further reduce the average lag time to approximately 4‐5 months – which we expect to achieve by mid to late 2011. There is an inherent need to have some lag time, as certain cases will need several weeks to months to have final cause of death certified. In addition, we must wait upon the death certificates of non‐jurisdictional (non‐Philadelphia Medical Examiner) cases to make their way from the hospital, to Harrisburg, and then back to the Medical Examiner’s Office in Philadelphia. With a decreased lag time of date of death to date of review, this will allow a more real‐time review of cases – and this will also give the PCDR teams the flexibility to insert and review some cases just weeks after the death occurred.
This is in addition to the CIRT conference call, which is conducted within 3 working days of death for all jurisdictional infant deaths and for any child death where DHS was notified.
7

Recommendations for Further Improvement of the Philadelphia Child Death Review Process Improving the team membership breadth and the reliability of team member participation Create more user‐friendly data collection sheets for team members Devise better strategies for tracking down all eligible cases for review
o Special efforts need to be developed and refined in order to track down Philadelphia residents who die out of state.
o For Philadelphia residents who die out of county, one possible strategy is to educate other county death review teams on the proper definition of death certificate residency (particularly when it comes to college student deaths)
o For Philadelphia residents who die within Philadelphia, one possible strategy to further improve tracking and thus increase the percentage of eligible cases reviewed might be to require the reporting to the MEO of all child fatalities (ages 0‐21yrs), regardless of manner or cause of death
Identify and collect additional data elements to improve the understanding of circumstances surrounding a child’s death – which will help improve/create policy recommendations for the future
Improve collaboration with other county child death review teams in Pennsylvania to better coordinate sharing of information between county borders, to learn from each other how to overcome common obstacles in the child death review process, etc.
Provide feedback and work more closely with the National Center for Child Death Review to improve the national data collection tool
o making it more relevant to big cities (e.g. ability to enter data on multiple perpetrators for homicide victims)
o making it more user‐friendly (for child death review teams with insufficient staff as well as for child death review team members who collect data for their county teams)
8

Section II: Overview of Child Deaths Reviewed (2006‐2008) Please note: except where noted, this report only describes those child deaths that occurred from 2006 through 2008 and were reviewed by the Philadelphia Child Death Review Teams (between the years of 2006 through 2009).
For information specific to Philadelphia vital statistics, please refer to the Philadelphia Department of Public Health’s website (listed in the appendix). Philadelphia Vital Statistics reports are available online for years 2003 through 2007, with the 2007 report having just been published in October 2010.
The City of Philadelphia is a large, heterogeneous, multi‐racial city of approximately 1.5 million persons in the northeastern United States. The city lies within one single, fully urbanized county, which is also called Philadelphia. According to the 2007 Philadelphia Vital Statistics Report, the racial breakdown of the overall population is approximately 43% Black, Non‐Hispanic, 40% White, Non‐Hispanic, 6% Asian, Non‐Hispanic, and 11% Hispanic (of any race). Figure 2.1: Philadelphia Population Estimates by Age, Race/Ethnicity and Gender, 2007 Age Group White, Non‐Hispanic Black, Non‐Hispanic Asian, Non‐Hispanic Hispanic (any race) Total Population
Total Male Female Total Male Female Total Male Female Total Male Female Total Male Female
0‐4 years 29,194 14,965 14,229 51,350 26,000 25,350 6,109 3,088 3,021 18,439 9,396 9,043 105,092 53,449 51,643
5‐9 years 26,252 13,394 12,858 45,663 23,200 22,463 4,870 2,489 2,381 14,060 7,105 6,955 90,845 46,188 44,657
10‐14 years 26,727 13,663 13,064 50,110 25,449 24,661 4,726 2,375 2,351 14,865 7,550 7,315 96,428 49,037 47,391
15‐19 years 38,699 19,569 19,130 55,943 27,669 28,274 6,550 3,276 3,274 14,500 7,254 7,246 115,692 57,768 57,924
Data Source: Pennsylvania State Data Center There were 1136 children who died during the years 2006 through 2008 who were ultimately reviewed by the Philadelphia Child Death Review (PCDR) teams. For children who died in 2006 and 2007, the PCDR teams reviewed cases up through age 19 years. For children who died in 2008, the PCDR teams reviewed cases up through age 21 years. Based on Philadelphia vital statistics data, it is estimated that the PCDR teams reviewed approximately 86% of the cases eligible for review (from a range of 68% in 2006 deaths to 90% in 2008 deaths). The gender of the majority of child deaths reviewed is consistently male – about two‐thirds of the overall cases reviewed. This disproportionate number of males can be partially – but not fully – explained by the typical profile of a youth homicide victim in Philadelphia, who is almost always male. However, even when excluding youth homicide deaths, the disproportion of male deaths – including the gender breakdown of infant death – is typical across the nation.
9

Figure 2.1a Gender of Deaths Reviewed for Years of Death 2006‐2008 (n=1136)
Gender of Deaths Reviewed, 2006-2008 (n=1136)
0 6 2
280 285
208
127 133
95
0
50
100
150
200
250
300
2006 2007 2008
Male
Female
Unknow n orIndeterminate
In some cases of infants born extremely premature, the gender is not easily determined – and in
such cases, the section for gender on the death certificate is often left blank. Therefore, despite
careful recording of data, there will always be a few cases with unknown or indeterminate gender.
The age groups of the child deaths reviewed shows a bimodal distribution: a very large number of infant deaths (defined throughout this report as less than one year of age), and a smaller hump in the 15‐19 year olds and 20‐21 year olds. In fact, infant deaths typically make up approximately 50% of the deaths of children ages 21 years and under in Philadelphia. Figure 2.1b Age Groups of Deaths Reviewed for Years of Death 2006‐2008 (n=1136)
Age Groups of Deaths Reviewed, 2006-2008 (n=1136)
166
17 12 12
96
0
2814 18
115
0
208
2515 19
96
57
238
0255075
100125150175200225250
<1 Year 1-4 Years 5-9 Years 10-14 Years 15-19 Years 20-21 Years*
2006
2007
2008
*Starting with deaths in year 2008, the upper age limit for eligibility of review expanded from 19 years to 21 years
10
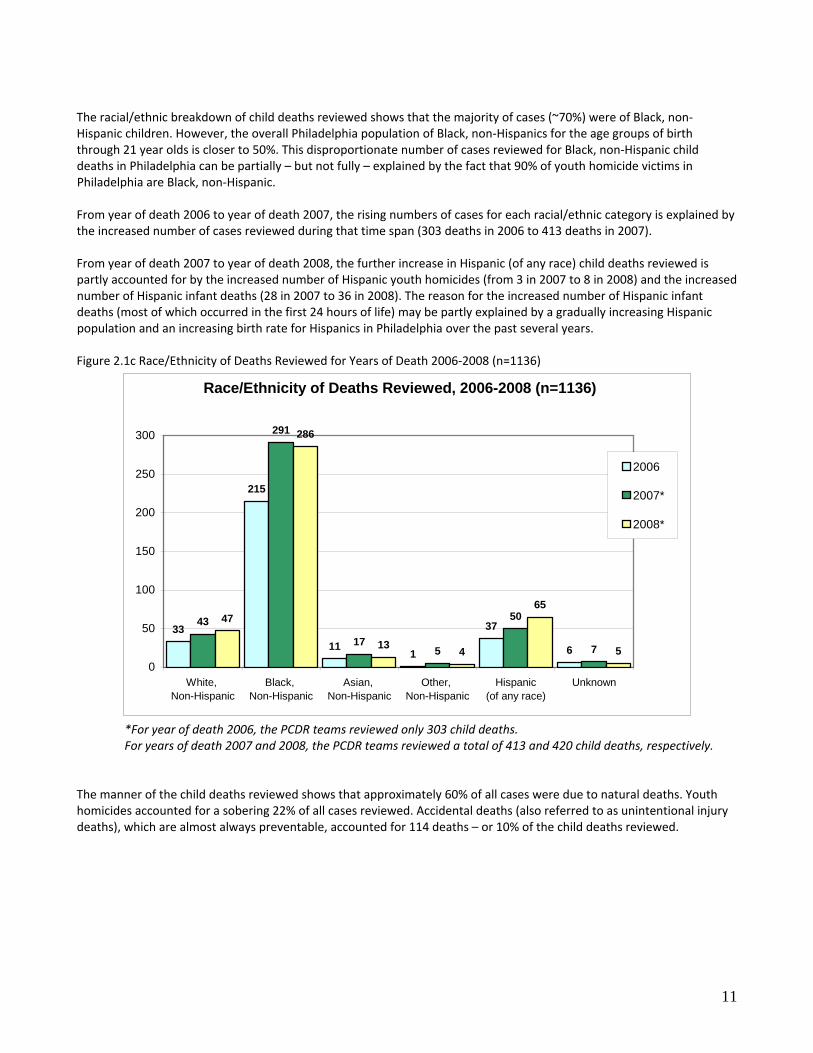
The racial/ethnic breakdown of child deaths reviewed shows that the majority of cases (~70%) were of Black, non‐Hispanic children. However, the overall Philadelphia population of Black, non‐Hispanics for the age groups of birth through 21 year olds is closer to 50%. This disproportionate number of cases reviewed for Black, non‐Hispanic child deaths in Philadelphia can be partially – but not fully – explained by the fact that 90% of youth homicide victims in Philadelphia are Black, non‐Hispanic. From year of death 2006 to year of death 2007, the rising numbers of cases for each racial/ethnic category is explained by the increased number of cases reviewed during that time span (303 deaths in 2006 to 413 deaths in 2007). From year of death 2007 to year of death 2008, the further increase in Hispanic (of any race) child deaths reviewed is partly accounted for by the increased number of Hispanic youth homicides (from 3 in 2007 to 8 in 2008) and the increased number of Hispanic infant deaths (28 in 2007 to 36 in 2008). The reason for the increased number of Hispanic infant deaths (most of which occurred in the first 24 hours of life) may be partly explained by a gradually increasing Hispanic population and an increasing birth rate for Hispanics in Philadelphia over the past several years. Figure 2.1c Race/Ethnicity of Deaths Reviewed for Years of Death 2006‐2008 (n=1136)
Race/Ethnicity of Deaths Reviewed, 2006-2008 (n=1136)
33
215
111
37
6
43
291
175
50
7
47
286
13 4
65
50
50
100
150
200
250
300
White, Non-Hispanic
Black, Non-Hispanic
Asian, Non-Hispanic
Other, Non-Hispanic
Hispanic(of any race)
Unknown
2006
2007*
2008*
*For year of death 2006, the PCDR teams reviewed only 303 child deaths. For years of death 2007 and 2008, the PCDR teams reviewed a total of 413 and 420 child deaths, respectively.
The manner of the child deaths reviewed shows that approximately 60% of all cases were due to natural deaths. Youth homicides accounted for a sobering 22% of all cases reviewed. Accidental deaths (also referred to as unintentional injury deaths), which are almost always preventable, accounted for 114 deaths – or 10% of the child deaths reviewed.
11

Figure 2.1d Manner of Deaths Reviewed for Year of Death 2006‐2008 (n=1136)
Manner of Deaths Reviewed, 2006-2008 (n=1136)
187
250
83
8
243
48
3
75
44
252
41
12
91
24
0
50
100
150
200
250
300
Natural Accident Suicide Homicide Undetermined
200620072008
Please note: in 2006, there were indeed several cases of youth suicide in Philadelphia. Unfortunately, for reasons unexplained, all five eligible suicide cases (ages 19 and under) were never reviewed by the PCDR teams.
The top five causes of death for the 524 non‐infant child deaths reviewed are listed below. Weapons (predominantly firearms) accounted for 46% of the non‐infant deaths, and along with motor vehicles (‘car accidents’) and fire, accounted for a combined 61% of non‐infant deaths – all of which are child deaths that could have been avoided. Figure 2.1e Top Five Causes of Non‐Infant Deaths Reviewed for Years of Death 2006‐2008 (n=524)
Ranking Leading Causes of Non‐Infant Deaths Reviewed, 2006‐2008 Percent of Non‐Infant Deaths Reviewed
1 Weapon, including body part 46%
2 Motor vehicle and other transport 10%
3 Cancer 8%
4 Fire 5%
5 Cardiovascular 3% The 1136 child deaths reviewed from the years 2006‐2008 were not evenly distributed across neighborhoods or zip codes throughout Philadelphia. There are concentrations of child deaths in specific parts of the city, often in areas of low socioeconomic status.
Please note: the map on the following page represents all child deaths reviewed (years of death 2006‐2008) by the PCDR teams. It does not represent all child deaths of Philadelphia residents that occurred in Philadelphia during this time frame.
12

13

Section III: Focus on Infant Deaths Please note: this report only describes those child deaths that occurred from 2006 through 2008 and were reviewed by the Philadelphia Child Death Review (PCDR) Teams. Overall Infant Deaths (n=612) Figure 3.1a Total Number of Infant Deaths Reviewed for Years of Death 2006‐2008 (n=612)
Year of Death Number 2006 166 2007 238 2008 208
As mentioned previously, infant deaths account for roughly one half of all the deaths reviewed by the PCDR teams. A large proportion (69%) of the infant deaths occurred in the first four weeks after birth, with approximately 40% of all infant deaths reviewed occurring within the first 24 hours after birth. Infant deaths can be broken down further into different subcategories. This report will focus on two subcategories that have an element of preventability to them: sleep‐related infant deaths and prematurity‐related infant deaths Figure 3.1b Gender and Age Groups of Infant Deaths Reviewed for Years of Death 2006‐2008 (n=612)
Gender of Infant Deaths Reviewed, 2006-2008 (n=612)
Male61%
Female38%
Unknown/Indeterminate
1%
Age Group of Infant Deaths Reviewed, 2006-2008 (n=612)
Post-neonatal (28-365 Days)31%
Neonatal (0-27 Days)
69%
.
14

Figure 3.1c Race/Ethnicity of Infant Deaths Reviewed for Years of Death 2006‐2008 (n=612)
Race/Ethnicity of Infant Deaths Reviewed, 2006-2008(n=612)
Black, Non-Hispanic
66%
Unknow n3%
Asian, Non-Hispanic
4%
White, Non-Hispanic
11%
Other, Non-Hispanic
1%
Hispanic15%
Figure 3.1d Percentage of Infant Deaths Reviewed with an Open CPS Case, for Year of Death 2008 (n=208)
Percentage of Infant Deaths Reviewed with Open CPS Case, 2008 (n=208)
Yes4%
No92%
Missing/Unknown
4%
Figure 3.1e Category of Infant Deaths Reviewed for Years of Death 2006‐2008 (n=612)
Category of Infant Deaths Reviewed, 2006-2008 (n=612)
Prematurity45%
Other41%
Sleep-Related
14%
15

Sleep‐Related Infant Deaths (n=83) Sleep‐related infant deaths accounted for 83 infant deaths, or ~14% of all infant deaths reviewed. There is no official definition of a sleep‐related infant death, but in this report it shall refer to a commonly used definition by many public health professionals, which is the death of infants where the manner/cause of death was certified as either accidental suffocation, SIDS, or undetermined.
According to the Centers for Disease Control and Prevention (CDC), Sudden Unexpected Infant Deaths (SUIDs) are defined as “infant deaths that occur suddenly and unexpectedly, and whose manner and cause of death are not immediately obvious prior to investigation.”
After a thorough investigation and autopsy is conducted, a pathologist or coroner might eventually determine the cause of death to be due to an unintentional injury (e.g. accidental suffocation on a pillow), due to a natural event (e.g. pneumonia or congenital heart defect), due to child abuse or neglect (e.g. from Shaken Baby Syndrome), or perhaps it may be ruled undetermined. A SUID case might also be determined to be due to SIDS (Sudden Infant Death Syndrome), which is defined by the CDC as “the sudden death of an infant less than one year of age that cannot be explained after a thorough investigation is conducted, including a complete autopsy, examination of the death scene, and review of the clinical history.”
Philadelphia experienced an annual average of almost 40 sleep‐related infant deaths for the years 2006 through 2008, although the PCDR teams were only able to review 83 of the 115 total cases. There is a preventability aspect to some of these deaths when it comes to the sleep environment – particularly with the accidental suffocation deaths. Figure 3.2: Number of Sleep‐Related Infant Deaths Reviewed by Year
Year Number of Sleep‐Related Infant Deaths Reported to Medical Examiner's Office
Number of Cases Reviewed by Teams Percent of Eligible Cases Reviewed
2006 35 4 11%
2007 44 43 98%
2008 36 36 100%
Total 115 83 72% Figure 3.2a Gender and Age Groups of Sleep‐Related Infant Deaths Reviewed for Years of Death 2006‐2008 (n=83)
Gender of Sleep-Related Infant Deaths Reviewed, 2006-2008 (n=83)
Male63%
Female37%
Age Group of Sleep-Related Infant Deaths Reviewed, 2006-2008 (n=83)
Post-neonatal (28-365 Days)
90%
Neonatal (0-27 Days)
10%
16
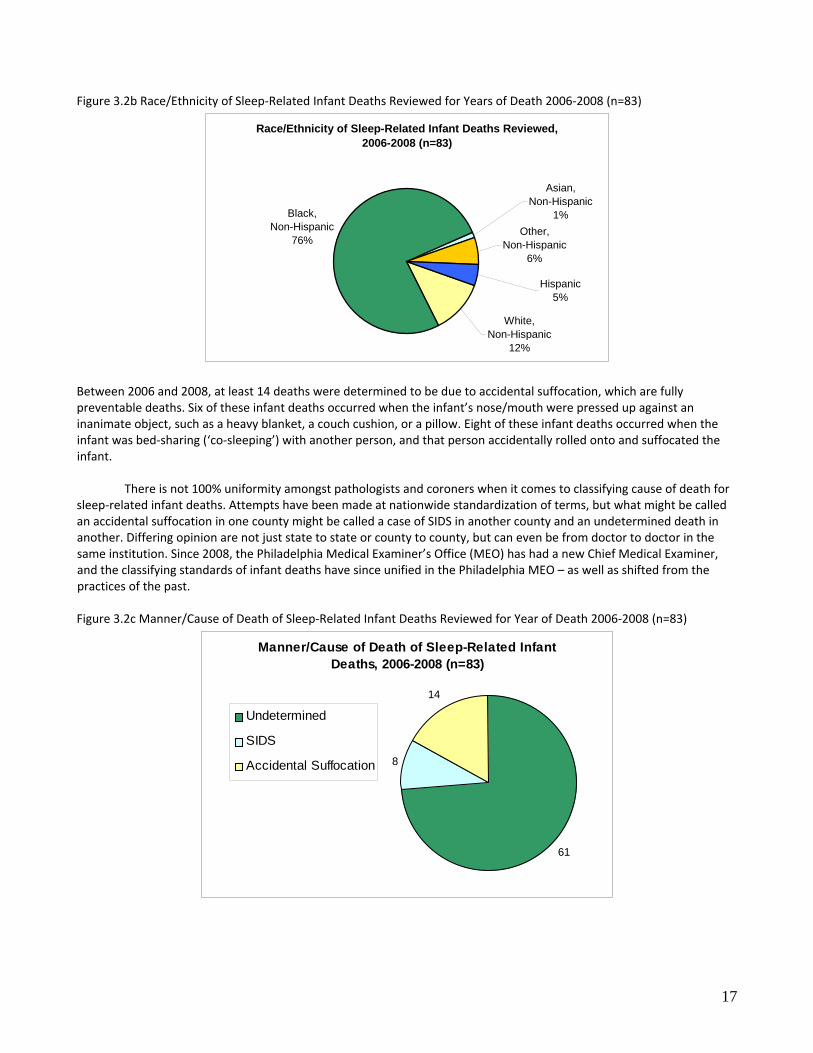
Figure 3.2b Race/Ethnicity of Sleep‐Related Infant Deaths Reviewed for Years of Death 2006‐2008 (n=83)
Race/Ethnicity of Sleep-Related Infant Deaths Reviewed, 2006-2008 (n=83)
Asian, Non-Hispanic
1%
Hispanic5%
Other, Non-Hispanic
6%
White, Non-Hispanic
12%
Black, Non-Hispanic
76%
Between 2006 and 2008, at least 14 deaths were determined to be due to accidental suffocation, which are fully preventable deaths. Six of these infant deaths occurred when the infant’s nose/mouth were pressed up against an inanimate object, such as a heavy blanket, a couch cushion, or a pillow. Eight of these infant deaths occurred when the infant was bed‐sharing (‘co‐sleeping’) with another person, and that person accidentally rolled onto and suffocated the infant.
There is not 100% uniformity amongst pathologists and coroners when it comes to classifying cause of death for sleep‐related infant deaths. Attempts have been made at nationwide standardization of terms, but what might be called an accidental suffocation in one county might be called a case of SIDS in another county and an undetermined death in another. Differing opinion are not just state to state or county to county, but can even be from doctor to doctor in the same institution. Since 2008, the Philadelphia Medical Examiner’s Office (MEO) has had a new Chief Medical Examiner, and the classifying standards of infant deaths have since unified in the Philadelphia MEO – as well as shifted from the practices of the past. Figure 3.2c Manner/Cause of Death of Sleep‐Related Infant Deaths Reviewed for Year of Death 2006‐2008 (n=83)
Manner/Cause of Death of Sleep-Related Infant Deaths, 2006-2008 (n=83)
61
8
14
Undetermined
SIDS
Accidental Suffocation
17

For this report, we would have liked to report on the percentage of sleep‐related infant deaths where the mother and/or infant tested positive for a urine drug screen at the infant’s birth. Unfortunately, we did not have consistent data for this query and were thus unable to present it. However, it was learned that 25% of the primary caregivers of the sleep‐related infant deaths reviewed were known to have a Department of Human Services (DHS) history as a perpetrator. Figure 3.2d Percentage of Sleep‐Related Infant Deaths Reviewed where Primary Caregiver had DHS History as Perpetrator for Years of Death 2006‐2008 (n=83)
Percentage of Sleep-Related Infant Deaths Reviewed (2006-2008) Where Primary Caregiver had had a DHS History as a Perpetrator (n=83)
Yes25%
No59%
Unknown16%
Most of the sleep‐related infant deaths that were reviewed were not placed to sleep in an appropriate sleep location. In fact, only 29% of these deaths had a history of being last placed to sleep in a crib, bassinet, or a pack‐n‐play. The majority of the others were last placed to sleep on an adult bed or on a couch. There was even one case reviewed where the infant was placed to sleep on a waterbed. Figure 3.2e Last Place of Sleep for Sleep‐Related Infant Deaths Reviewed for Years of Death 2006‐2008 (n=83)
Last Place of Sleep for Sleep-Related Infant Deaths Reviewed, 2006-2008 (n=83)
Adult Bed57%
Waterbed1%
Couch10%
Car Seat2%
Unknown1%Crib/Bassinet/
Pack-n-Play29%
Public health professionals talk about a safe sleep environment for infants: an environment that is composed of a proper sleep location (e.g. a crib), a proper sleep surface (e.g. a firm infant mattress), no bed sharing, no other objects in the sleep area that could obstruct the nose or mouth (e.g. pillows, stuffed animals, comforters), and proper sleep position (placed to sleep on the back).
18

When looking more closely at the sleep‐related infant deaths that were reviewed, only 7% qualified as having a fully safe sleep environment. The most common reason for having an unsafe sleep environment was sharing the bed with another person (70% of the sleep‐related deaths). Figure 3.2f Percentage of Sleep‐Related Infant Deaths Reviewed with Unsafe Sleep Environment for Years of Death 2006‐2008 (n=83)
Description of Sleep Environment of Sleep-Related Infant Deaths Reviewed, 2006-2008 (n=83)
Fully Safe7%
Unknow n2%
Not Fully Safe91%
Figure 3.2g Percentage of Sleep‐Related Infant Deaths Reviewed with Bed Sharing for Years of Death 2006‐2008 (n=83)
Percentage of Sleep-Related Infant Deaths Reviewed who Shared Bed, 2006-2008 (n=83)
Bed Sharing70%
Not Bed Sharing
29%
Unknow n1%
The reasons why caregivers bed‐share with their infants are many and varied. According to the cases reviewed by the PCDR teams, the vast majority of all sleep‐related infant death households (86%) had an appropriate sleep surface available in the household the day the infant died: whether it was a crib, a bassinet, or a pack‐n‐play.
19

Figure 3.2h Percentage of Sleep‐Related Infant Deaths Reviewed with Appropriate Sleep Location Available (n=83)
Percentage of Sleep-Related Infant Deaths Reviewed with Crib/Bassinet/Pack-n-Play Available
in Household, 2006-2008 (n=83)
Available86%
Unknown12%
Not Available2%
When looking more closely at only those 58 sleep‐related infant deaths where the infant died while bed‐sharing, there still was a significant majority (81%) who had a proper sleep location available the day the infant died. Figure 3.2h1 Percentage of Bed‐Sharing Infant Deaths Reviewed who had Appropriate Sleep Location Available (n=58)
Percentage of Bed-Sharing Infant Deaths Reviewed with Crib/Bassinet/Pack-n-Play Available in Household, 2006-2008 (n=58)
Available81%
Unknow n3%
Not Available16%
Figure 3.2i Sleep Position Placement of Sleep‐Related Infant Deaths Reviewed for Years of Death 2006‐2008 (n=83)
Last Sleep P o sit io n P lacement o f Sleep-R elated Infant D eaths R eviewed, 2006-2008 (n=83)
On Stomach28%
Propped Seated1%
On Side11%
On Back54%
Unknown6%
20

Part of the infant death investigation includes looking at potential consumer product safety issues, including reporting to the Consumer Product Safety Commission when applicable. For sleep‐related infant deaths in 2006‐2008, there were no consumer products associated with the infant’s death. We would have liked to present the most common zip codes where sleep‐related infant deaths occurred. However, because Philadelphia has almost 50 different zip codes, and because there were a total of 83 such events reviewed, we were unable to present such a map in this report. Recommendations: Promote Safe Sleeping Environments One potential effort to reduce the number of sleep‐related deaths is to educate caregivers (parents as well as grandparents, older siblings and anyone else who puts a baby to sleep) about a safe sleep environment, and encourage them to make the sleep environment as safe as possible. It is indeed certain that for at least eight of the sleep‐related infant fatalities, death was directly caused from bed‐sharing. However, it may not be the most effective educational method to label a mother or father as a ‘bad parent’ for continuing a practice that many in the community believe to be a good, loving parenting technique. Public health and health care professionals want to engage the parents, not alienate them. So instead of describing the sleep environment as good vs. bad or right vs. wrong, perhaps the message might be better worded as ‘safest’ vs. ‘not as safe/possibly dangerous.’ For example, a basic handout for parents (and other caregivers) could read as such:
Safest Practices for Infant Sleeping: 7 Simple Tips to Lower a Baby’s Risk of Dying in its Sleep
Safest Not as Safe / Possibly Dangerous 1 Sleep Partners Infant sleeps alone
(no ‘co‐sleeping’) Sleeping with adults ‐ especially if the adult is overtired or
under the influence of alcohol or drugs Sleeping with children or pets
2 Infant Position Placed on back (but give ‘tummy time’ when awake)
Placed to sleep on stomach Placed to sleep on side
3 Sleep Location In a crib, bassinet, or pack‐n‐play (in the same room as the caregivers, if possible)
Placed to sleep on a couch, reclining chair, adult bed, etc. Placed to sleep on top of another person – such as on another
person’s chest 4 Sleep Surface On a firm mattress Placed to sleep on a soft surface – such as a folded‐up
blanket, pillow, sheepskin, water bed mattress, etc. 5 Bedding With a single, tight‐fitted
sheet/cover Placed to sleep with heavy blankets, comforters, quilts,
pillows, etc 6 Infant Clothing In a one‐piece sleeper Over‐dressing or over‐bundling 7 Crib Environment Without any objects in
the crib Leaving objects in crib when placing infant to sleep – such as
pillows, stuffed animals, bumper pads, loose bedding, etc. Efforts to provide an appropriate sleep location for impoverished families, such as Cribs for Kids, should surely continue. There were several instances of infants who died while bed‐sharing where there was no crib available in the household, and where the caregiver would have preferred to use one. However, in addition to providing a free pack‐n‐play, efforts should be strengthened at educating the parents of the importance of the use of the crib as a constant sleep surface for the infant – and not, as is so often discovered during the course of the infant death investigation, as a place for the storage of baby clothes and other baby accessories.
21

Improving the Data‐Gathering Process on Sleep‐Related Infant Deaths This task can be accomplished in many ways, including:
Promote the standardization of terms o It would be helpful if national organizations, such as the American Academy of Pediatrics or National
Association of Medical Examiners would develop an official definition of sleep‐related infant deaths Promote the standardization for categorizing of cause of deaths
o This has been accomplished in Philadelphia through leadership at the Medical Examiner’s Office Promote improved documentation of death scene investigation
o All medical examiner investigators should be trained on how to carry out a Sudden Unexpected Infant Death scene investigation, as organized by the Centers for Disease Control and Prevention
Conduct real‐time reviews of Sudden Unexpected Infant Deaths o Philadelphia has implemented the CIRT Conference Calls in order to address this particular subject.
While it can be labor‐intensive up‐front, it saves time and efforts for when the infant deaths get reviewed by the full child death review team
The CIRT (Coordination and Immediate Review Team) conference calls are convened within three business days of a sudden, unexpected infant death. Members of the team include the Chief Medical Examiner, the Fatality Review Program’s Medical Director and Bereavement Care Coordinator, the Child Fatality Program Administrator of the Department of Human Services, and senior members of the Child Welfare Unit of the City’s Law Department. The purpose of this team is to coordinate communication between city agencies and to take a closer, more careful look at sudden, unexpected infant deaths. The team does a real‐time first review of cases, which includes attempting to ensure the safety and well‐being of any surviving child relatives of the deceased infant – especially during the immediate aftermath of the infant death, when manner and cause of death are still not known.
22

Prematurity‐Related Infant Deaths (n=280) Prematurity was the cause of 280 infant deaths, or roughly 45% of all infant deaths reviewed. In fact, prematurity, by itself, accounted for close to 25% of all 2006‐2008 child deaths reviewed. Many causes of prematurity are considered preventable, but just how to prevent prematurity is still not fully understood. Many interventions have been designed and studied in order to reduce the rate of premature births, but none have been particularly successful. It is postulated that early and regular prenatal care should reduce preterm birth rates and improve birth outcomes, and public health professionals still stress the importance of prenatal care. However, interventions to provide prenatal care have not been proven as a successful method to reduce preterm births. Despite the lack of a clear understanding between prenatal care and prematurity, it would have been preferable to discuss the percentage of prematurity‐related infant deaths where the mother had late or no prenatal care. Unfortunately, there was too much missing/unreliable data for the 2006‐2008 cases, so it could not be included in this report. Figure 3.3a Gender of Prematurity Deaths Reviewed for Years of Death 2006‐2008 (n=280)
Gender of Prematurity-Related Infant Deaths Reviewed, 2006-2008 (n=280)
Male61%
Female38%
Unknown/Indeterminate
1%
Figure 3.3b Age Groups of Prematurity Deaths Reviewed for Year of Death 2006‐2008 (n=280)
Age Group of Prematurity-Related Infant Deaths Reviewed, 2006-2008 (n=280)
Post-neonatal (28-365 Days)
9%
Neonatal (0-27 Days)
91%
23

Figure 3.3c Race/Ethnicity of Prematurity Deaths Reviewed for Year of Death 2006‐2008 (n=280)
Race/Ethnicity of Prematurity-Related Infant Deaths Reviewed, 2006-2008 (n=280)
Black, Non-Hispanic69%
Asian, Non-Hispanic5%
Hispanic16%
Unknown4%
White, Non-Hispanic
6%
One of the goals to improve the PCDR process for future years is to better track prenatal care of infants who died. This can be more effectively achieved through the acquisition of birth certificate data – which is now a regular process of the PCDR teams for children who died in 2009 and beyond. In addition, the Fetal & Infant Mortality Review (FIMR) Case Review Team has made prematurity deaths a focus of its reviews for a 12‐month period starting in June 2010. It is Philadelphia FIMR’s hope that by focusing the FIMR Case Review Team on prematurity‐related deaths, a better understanding of prematurity in Philadelphia might be gained.
FIMR conducts a different form of child death review than the standard child death review carried out by the PCDR teams. The FIMR methodology was created by the American College of Obstetrics and Gynecology in 1988 and has been adopted by many communities across the nation ever since. In FIMR, all cases are de‐identified (no names, dates of birth, hospital names, etc), every case has a medical chart abstraction, and many of the cases include a maternal interview. The FIMR Case Review Team works to identify shortfalls or gaps to the public health systems and community resources as exemplified by the cases that are reviewed. A second FIMR team, called the Community Action Team, then takes the recommendations from the Case Review Team and attempts to translate those recommendations into an action plan. The Philadelphia Fatality Review Program has been conducting a FIMR group since 2003 – and is currently the only county in Pennsylvania to be doing so.
24

Section IV: Natural Deaths Please note: this report only describes those child deaths that occurred from 2006 through 2008 and were reviewed by the Philadelphia Child Death Review (PCDR) Teams.
Natural Deaths (n=682)
Natural deaths accounted for nearly 60% of all child deaths reviewed by the PCDR teams. Infant deaths (such as those due to prematurity or congenital conditions) make up a very large proportion of the total.
Please note: For children who died in 2006‐2007, the PCDR teams only reviewed those aged 19 years and under. In addition, due to multiple factors, the teams were unable to review a large proportion of natural deaths in 2006
For natural deaths, this report will focus a bit more on three causes of death that are either more common or that are potentially preventable: infectious disease deaths, asthma deaths and cancer deaths.
Figure 4.1a Categories of Natural Deaths Reviewed for Years of Death 2006‐2008 (n=682) Infectious Disease Asthma Cancer All Other Natural
2006 9 3 6 169 2007 9 3 14 217 2008* 11 6 21 214 Total 29 12 41 600
*Starting with deaths in year 2008, the upper age limit for eligibility of review was expanded from 19 to 21 years
Figure 4.1b Gender and Race/Ethnicity of All Natural Deaths Reviewed for Years of Death 2006‐2008 (n=682)
Gender of Natural Deaths Reviewed, 2006-2008 (n=682)
Male59% Female
40%
Unknown/Indeterminate
1%
Race/Ethnicity of Natural Deaths Reviewed, 2006-2008 (n=682)
Unknown4%
Hispanic17%
White, Non-Hispanic
11%
Asian, Non-Hispanic
4%
Black, Non-Hispanic
64%
25

Figure 4.1c Age Groups of All Natural Deaths Reviewed for Years of Death 2006‐2008 (n=682)
Age Groups of Natural Deaths Reviewed, 2006-2008 (n=682)
154
6 6 714
0
190
12 10 1219
0
178
15 10 1425
10
0
20
40
60
80
100
120
140
160
180
200
<1 Year 1-4 Years 5-9 Years 10-14 Years 15-19 Years 20-21 Years
2006 2007 2008
*Starting with deaths in year 2008, the upper age limit for eligibility of review was expanded from 19 to 21 years
Infectious Disease Deaths (n=29) Infectious disease deaths accounted for at least 29 of the 682 natural deaths reviewed. Some infectious diseases are preventable through our behaviors. For sexually transmitted disease (such as syphilis, chlamydia and HIV), employing safe sex techniques can help protect a sexually active person from getting infected. Most infectious diseases are not necessarily preventable, but their incidence can be reduced through education. For example, the spread of upper respiratory viruses (the common cold) can be greatly reduced through good hand sanitation techniques and covering one’s nose and mouth when sneezing. For a select handful of some other infectious diseases, many of which can be potentially deadly (such as influenza, measles, pneumococcal disease, and pertussis), there are immunizations. Most deaths due to vaccine‐preventable illnesses that occur in Philadelphia residents are eventually determined to be preventable.
There was one case included in this report where an infant died of pertussis. The infant acquired it from her mother, who passed the bacterial infection onto the infant before she was old enough to receive her first pertussis vaccine. Through the review of this case, efforts materialized that led to a push for the Philadelphia birthing hospitals to create protocols on the administration of a post‐partum adult pertussis vaccination.
As for HIV‐related deaths, there were two known Philadelphia youths to have died between 2006‐2008. The PCDR teams continue to work with partners from AACO (AIDS Activities Coordinating Office) when it comes to deaths from HIV/AIDS. Important strategies for the reduction of HIV mortality includes safe sex education for teenagers, universal HIV screening of teenagers ages 13 and older, and access to treatment for those already infected with HIV.
26

Figure 4.2a Gender of Infectious Disease Deaths Reviewed for Years of Death 2006‐2008 (n=29) Gender Number Percent (%) Male 13 45
Female 16 55 Figure 4.2b Age Groups and Race/Ethnicity of Infectious Disease Deaths Reviewed for Years of Death 2006‐2008 (n=29)
Age Groups of Infectious Disease Deaths Reviewed, 2006-2008 (n=29)
<1 Year62%
1-4 Years14%
10-14 Years3%
15-19 Years14%
20-21 years*7%
Race/Ethnicity of Infectious Disease Deaths Reviewed, 2006-2008 (n=29)
Hispanic14%
White, Non-Hispanic
10%
Asian, Non-Hispanic
7%
Black, Non-Hispanic
69%
*Starting with deaths in year 2008, the upper age limit for eligibility of review was expanded from 19 years to 21 years There were no 5‐9 year old infectious disease deaths reviewed. Recommendations: Continued surveillance, particularly of vaccine‐preventable deaths, is an important aspect of child death reviews. This includes tracking down laboratory results (such as cerebrospinal fluid and blood cultures). Maintenance of Philadelphia’s city‐wide vaccine registry is another important method at helping children remain up‐to‐date on their immunizations, which leads to decreased vaccine‐preventable illnesses and deaths. One challenge that remains with vaccine‐preventable deaths is how to handle the cases of families who don’t immunize their children based on religious grounds. Due to the relatively high number of religious groups in Philadelphia who are against all forms of medical interventions, and with a recent history that demonstrates this is not an all‐too‐rare event, the case could be made to push forward to create a legal protocol for when future child illnesses or deaths arise from medically‐treatable or vaccine‐preventable diseases.
27

Asthma Deaths (n=12) Asthma accounted for 12 child deaths reviewed, as discussed in this report. Asthma is a medically‐treatable condition that has variable levels of severity in the people it affects. Except for the worst sufferers, proper adherence to a properly‐prescribed asthma medication regimen can help prevent most asthmatics from dying – and even prevent most hospital admissions. Unfortunately, the PCDR teams were unable to uncover the full story surrounding the circumstances of the asthma deaths reviewed. What was learned is that slightly more than half of the deaths were of males, most were in their late teen years, and all of them were from racial or ethnic minority groups (11 of the 12 deaths were African‐American children, 1 was a Hispanic child). Figure 4.3a Gender of Asthma Deaths Reviewed for Years of Death 2006‐2008 (n=12)
Gender of Asthma Deaths Reviewed, 2006-2008 (n=12)
Male58%
Female42%
Figure 4.3b Age Groups and Race/Ethnicity of Asthma Deaths Reviewed for Years of Death 2006‐2008 (n=12)
Age Groups of Asthma Deaths Reviewed, 2006-2008 (n=12)
5-9 Years17%
10-14 Years58%
15-19 Years17%
20-21 years*8%
Race/Ethnicity of Asthma Deaths Reviewed, 2006-2008 (n=12)
Black, Non-Hispanic
92% Hispanic8%
*Starting with deaths in year 2008, the upper age limit for eligibility of review was expanded from 19 to 21 years
Recommendations: The PCDR teams would like to be able to go further in‐depth about asthma death preventability issues in the future. Perhaps one way to achieve this would be to conduct a special 5‐year review of asthma deaths, or to attempt to collect better information moving forward (e.g. perform medical case abstraction of hospital and outpatient records).
28

Cancer Deaths (n=41) Included in this report is a section on cancer deaths, even though they are generally not considered a preventable childhood condition (as opposed to certain forms of adult cancers, such as lung cancer). Cancer deaths accounted for 41 deaths reviewed in this report. Males accounted for 63% of the cases reviewed, and just under half of all cases occurred in the 15‐19 year old age group. It is not clear why children of Hispanic ethnicity accounted for 17% of the cancer deaths reviewed, a disproportionately high percentage compared to their population in the Philadelphia area. However, cancer deaths are a somewhat rare event, so it is difficult to draw any conclusions based on the small sample size. We know from vital statistics reports that the 41 cases of child cancer deaths reviewed by the PCDR teams over a three year period signifies that some pediatric cancer deaths were not discussed by the teams, and some cases were likely misclassified in the database (e.g. classified as ‘other medical condition’). While cancer accounted for less than 8% of all non‐infant deaths, it still remains a top‐10 cause of death for all age groups between 1 and 21 years of age. Figure 4.4a Gender of Cancer Deaths Reviewed for Years of Death 2006‐2008 (n=41)
Gender of Cancer Deaths Reviewed, 2006-2008 (n=41)
Male63%
Female37%
Figure 4.4b Race/Ethnicity and Age Groups of Cancer Deaths Reviewed for Years of Death 2006‐2008 (n=41)
Race/Ethnicity of Cancer Deaths Reviewed, 2006-2008 (n=41)
Hispanic17%
Unknown2%
White, Non-Hispanic
22%
Black, Non-Hispanic
54%
Asian, Non-Hispanic
5%
Age Groups of Cancer Deaths Reviewed, 2006-2008 (n=41)
5-9 Years15%
15-19 Years39%
<1 Year3%
1-4 Years15%
10-14 Years22%
20-21 years*7%
*Starting with deaths in year 2008, the upper age limit for eligibility of review was expanded from 19 to 21 years
29

Section V: Deaths due to Unintentional Injuries Unintentional Injury Deaths (n=114) Deaths due to unintentional injuries, as a whole, accounted for 10% of all 2006‐2008 deaths reviewed by the PCDR teams. Unintentional injury death is a particular focus for child death review teams, as this category of death typically has an element of preventability to it. The public is familiar with the terms ‘accident,’ ‘motor vehicle accident’ and ‘accidental death.’ Many in the public health community, however, have stopped using the word ‘accident’ because the term denotes that an event simply ‘happened’ and could not have been avoided. Instead, many public health professionals prefer to classify injuries by intent: intentional injury deaths, such as homicides and suicides, or unintentional injury deaths, such as most motor vehicle crashes, drownings, and fire deaths.
Figure 5.1a Category of Unintentional Injury Deaths Reviewed for Years of Death 2006‐2008 (n=114)
Category Number Percent (%)
Motor vehicle and other transport 46 40 Fire, burn or electrocution 29 25
Drowning 8 7 Asphyxia 14 12 Weapon 2 2 Poisoning 12 11 Other 3 3 Total 114 100
Figure 5.1b Gender and Race/Ethnicity of All Unintentional Injury Deaths Reviewed for Years of Death 2006‐2008 (n=114)
Gender of All Unintentional Injury Deaths Reviewed, 2006-2008 (n=114)
Male66%
Female34%
Race/Ethnicity of Accidental Deaths Reviewed, 2006-2008 (n=114)
White, Non-Hispanic
22%
Black, Non-Hispanic
55%
Asian, Non-Hispanic
6%
Hispanic(of any race)
17%
30

Figure 5.1c Age Groups of All Unintentional Injury Deaths Reviewed for Years of Death 2006‐2008 (n=114)
Age Groups of Accidental Deaths Reviewed, 2006-2008 (n=114)
2
75
4
7
0
8
12
3 3
22
0
9
64
2
12
8
0
5
10
15
20
25
<1 Year 1-4 Years 5-9 Years 10-14 Years 15-19 Years 20-21 Years
200620072008
*Starting with deaths in year 2008, the upper age limit for eligibility of review was expanded from 19 years to 21 years Transportation‐Related Deaths (n=46) The largest group of deaths amongst the unintentional injury deaths reviewed were the transportation‐related deaths, which included deaths of pedestrians, bicyclists, vehicle passengers and/or vehicle drivers. Forty‐six children and youth died in Philadelphia in 2006‐2008 from transportation‐related injuries. The victims were mostly late teenagers, but it included several children as young as 2 years old. After re‐reviewing the cases, it is still unclear why there was a sudden increase in such deaths for 15‐19 year olds in 2007 – which then reverted to previous numbers in 2008 (and has continued since). Figure 5.2a Gender of Transportation‐Related Deaths Reviewed for Years of Death 2006‐2008 (n=46)
Gender of Transportation Deaths Reviewed, 2006-2008 (n=46)
Male78%
Female22%
31

Figure 5.2b Age Groups of Transportation‐Related Deaths Reviewed for Years of Death 2006‐2008 (n=46)
Age Groups of Tranportation Deaths Reviewed, 2006-2008 (n=46)
0
3 32
7
00
4
01
15
001 1 1
5
3
0
2
4
6
8
10
12
14
16
<1 Year 1-4 Years 5-9 Years 10-14 Years 15-19 Years 20-21 Years
200620072008
*Starting with deaths in year 2008, the upper age limit for eligibility of review was expanded from 19 to 21 years
Figure 5.2c Race/Ethnicity of Transportation‐Related Deaths Reviewed for Years of Death 2006‐2008 (n=46)
Race/Ethnicity of Transportation Deaths Reviewed, 2006-2008 (n=46)
White, Non-Hispanic
22%
Asian, Non-Hispanic
9%
Black, Non-Hispanic
47%
Hispanic(of any race)
22%
32

The largest category of deaths amongst the transportation‐related deaths was that of pedestrians, which included 19 fatalities. There were seven pedestrian deaths of children less than 5 years of age, and six out of those seven were killed because they darted onto a street and got struck by a vehicle.
Nine deaths reviewed involved motorcycles or ATVs; in eight of those deaths (89%), the child was the driver of
the motorcycle or ATV. In only one of those nine deaths (11%) was the child wearing a helmet. [There was one case of a bicycle death reviewed, and that child was not wearing a helmet at the time of injury.] Figure 5.2d Decedent’s Role in Transportation‐Related Deaths Reviewed for Year of Death 2006‐2008 (n=46)
Decedent's Role in Transportation-Related Deaths Reviewed, 2006-2008 (n=46)
Driver of car13%
Bicycle2%
Pedestrian42%
Driver of motorcycle/ATV
17%
Passenger26%
* All passengers were in a 4‐wheel vehicle except for one who was a passenger on a motorcycle
Figure 5.2d1 Vehicle Type Involved in Non‐Pedestrian Deaths Reviewed for Years of Death 2006‐2008 (n=27)
Vehicle Type Involved in Non-Pedestrian Deaths Reviewed, 2006-2008 (n=27)
Car/SUV/Truck63%
Motorcycle22%
ATV11%
Bicycle4%
33

Children as passengers or drivers of automobiles accounted for an additional ten and seven deaths reviewed, respectively. As with the case of the motorcycle and ATV riders, lack of usage of safety features was highly prevalent amongst the fatal crashes. Only two of the 17 children (12%) were known to be (properly) using a safety belt at the time of their death.
Figure 5.2e Driving Conditions in Transportation‐Related Deaths Reviewed for Year of Death 2006‐2008 (combined)
Driving Conditions Number Percent (%) Normal 42 92 Wet 2 4
Unknown 2 4
Figure 5.2f Helmet Usage in Motorcycle and ATV Deaths Reviewed for Years of Death 2006‐2008 (n=9)
Helmet Usage in Motorcycle and ATV Deaths Reviewed, 2006-2008 (n=9)
No78%
Yes11%
Unknown11%
Figure 5.2g Seatbelt/Carseat Usage in Transportation‐Related Deaths Reviewed for Years of Death 2006‐2008 (n=17)*
Seatbelt Usage in Transportation-Related Deaths Reviewed, 2006-2008 (n=17)
Unknown12%
Present, not used
76%
Present, used correctly
12%
*This only includes children who were in or on a car/SUV. It does not include pedestrians, bicyclists, or ATV/motorcycle riders.
34

When looking at other measured factors that might have caused or contributed to the transportation‐related
death, we found some worrying numbers: drug or alcohol use was known to be involved in 17% of these child deaths (the drug or alcohol use could have
been used by any driver responsible for the event – whether the child or another person) speeding was involved in 43% of these child deaths
Figure 5.2h Causes of/Contributors to Crash in Transportation‐Related Deaths Reviewed, 2006‐2008 (n=46)
Contribution of Drug or Alcohol Use to Crash, 2006-2008 (n=46)
Yes17%
No83%
Contribution of Distracted Driving to Crash, 2006-2008 (n=46)
Yes2%
No98%
Contribution of Recklessness to Crash,2006-2008 (n=46)
Yes35%
No65%
Contribution of Speeding to Crash, 2006-2008 (n=46)
Yes43%
No57%
Any of these factors can involve the decedent, the driver of the decedent’s vehicle, or the driver of a second vehicle (if there was one involved).
We also attempted to measure whether or not driver distraction could have caused or contributed to a fatal
crash. In only one of the 46 deaths was this a known factor. However, the deaths reviewed in this report occurred in 2006 through 2008 – so we expect the numbers to increase with text messaging and smart phones being much more common. In addition, we expect police detectives to be more wary of distracted driving as a potential cause of crashes – so they might do a more thorough job asking about it and investigating it for their reports.
Recommendations:
Enforce primary seatbelt laws Educate about helmet use for bicyclists as well as motorcycle and ATV riders Consider supporting legislation about mandatory helmet use for youth (aged 21 years and under) when riding
motorcycles or ATVs Enforce DUI penalties Enforce and educate about Pennsylvania’s graduated drivers licensing program Educate about distracted driving, and enforce any related enacted laws
35

Non‐Transportation‐Related Deaths (n=68) Amongst unintentional injury deaths, non‐transportation‐related deaths actually made up a larger percentage of the fatalities (60%) than did the transportation‐related ones. This category is broad, and it includes deaths due to drowning, fire, electrocution, burns, poisonings, falls, unintentional shootings, medical misadventures, and exposures (hypo‐ and hyperthermia). There were eight drowning deaths reviewed for the years 2006‐2008. The deaths were mostly males (75%), and it was distributed widely amongst the different age groups. Five of these deaths (63%) occurred in open waters – in rivers or creeks. One occurred in a bathtub (an unsupervised 9 month old), and two occurred in pools (a 15 month old in the family’s above ground pool, and an 11 year old in a community swimming pool). Half of the cases involved children who were improperly supervised. One of the cases involved an older youth who had been drinking alcohol prior to going for a night swim. Drownings (n=8) Figure 5.3a Gender of Drowning Deaths Reviewed for Years of Death 2006‐2008 (n=8)
Gender Number Percent (%) Male 6 75 Female 2 25
Figure 5.3b Age Groups of Drowning Deaths Reviewed for Years of Death 2006‐2008 (n=8) Age Group Number Percent (%) <1 Year 1 12.5 1‐4 Years 2 25
10‐14 Years 1 12.5 15‐19 Years 3 37.5 20‐21 Years* 1 12.5
*Starting with deaths in year 2008, the upper age limit for eligibility of review was expanded from 19 years to 21 years
Figure 5.3c Race/Ethnicity of Drowning Deaths Reviewed for Years of Death 2006‐2008 (n=8) Race/Ethnicity Number Percent (%)
White/Non‐Hispanic 1 12.5 Black/Non‐Hispanic 4 50 Hispanic (of any race) 3 37.5
Figure 5.3d Location of Drowning Deaths Reviewed for Years of Death 2006‐2008 (n=8) Location Number Percent (%)
River or Creek 5 62.5 Pool 2 25
Bathtub 1 12.5
Figure 5.3e Circumstances of Drowning Deaths Reviewed for Years of Death 2006‐2008 (n=8) Circumstance Number Percent (%)
Left unsupervised 4 50 Consequence of motor vehicle crash 2 25
Unable to swim 1 12.5 Alcohol involvement 1 12.5
Recommendations: Educate parents about the importance of constant supervision of young children (as well as older children who are not experienced swimmers) near pools or open bodies of water.
36

Fire Deaths (n=29) Fire caused the death of 29 children we reviewed from 2006 through 2008. Children less than 5 years of age accounted for a disproportionate 52% of the deaths. Figure 5.4a Gender of Fire Deaths Reviewed for Years of Death 2006‐2008 (n=29 deaths)
Gender Number Percent (%) Male 14 48 Female 15 52
Figure 5.4b Age Groups of Fire Deaths Reviewed for Years of Death 2006‐2008 (n=29 deaths)
Age Groups of Fire Deaths Reviewed, 2006-2008 (n=29)
2
13
8
32
1
0
2
4
6
8
10
12
14
<1 Year 1-4 Years 5-9 Years 10-14 Years 15-19 Years 20-21 Years
*Starting with deaths in year 2008, the upper age limit for eligibility of review was expanded from 19 to 21 years
Figure 5.4c Race/Ethnicity of Fire Deaths Reviewed for Years of Death 2006‐2008 (n=29 deaths)
Race/Ethnicity of Fire Deaths Reviewed, 2006-2008 (n=29)
Hispanic(of any race)
7%
White,Non-Hispanic
10%
Asian,Non-Hispanic
10%Black,
Non-Hispanic73%
37

As might be surmised, a majority of the fires (87%) occurred in the colder months, when people are more likely to use fire, fuel and electrical means for heating the home. Space heaters were tracked to be source of the fire in 27% of the fires, but lighters or matches were the source of nearly 40%. Figure 5.4d Month of Year of Fire Death Events Reviewed for Years of Death 2006‐2008 (n=15 fire events)
Months of Year of Fire Death Events Reviewed, 2006-2008 (n=15 events)
13
2
0
2
4
6
8
10
12
14
November through April May through October
Please note: there were 15 individual fire events that accounted for the 29 child deaths reviewed in 2006‐2008.
Twenty‐five of the 29 children (86%) died in multi‐fatality fires. In fact, these same 25 children died in only 11 separate fire events (and an additional 14 adults died in these blazes as well – although they were not reviewed by the PCDR teams). Figure 5.4e Single vs. Multi‐Fatality Episodes of Fire Deaths Reviewed for Years of Death 2006‐2008 (n=29 deaths)
Percentage of Fire Deaths Reviewed that Occurred as Single or Multi Fatality Event, 2006-2008 (n=29)
Single fatality14%
Multi fatality86%
Single fatality: 4 deaths reviewed (in 4 separate fire events) Multi fatalities: 25 deaths reviewed (in 11 separate fire events)
38

The question that child death review teams are constantly asking is whether or not a death was preventable. The prevention feature with fire deaths, oftentimes, is a working/functional fire alarm. Of the 15 fatal fire events that accounted for the 29 child deaths, we were only able to answer this question in 11 of those events. But of those 11 fatal fire events, only one household (9%) had a working fire alarm. Figure 5.4f Percentage of Fire Death Events Reviewed with Functional Fire Alarm Present for Year of Death 2006‐2008 (n=11 fire events that had reportable data)
Percentage of Fire Death Events Reviewed with Presence of Functional Fire Alarm, 2006-2008 (n=11 events*)
Yes9%
No91%
*For four fire events, the child death review teams did not know about the presence of a functional fire alarm
Figure 5.4g Source of Fire of Fire Death Events Reviewed for Years of Death 2006‐2008 (n=15 fire events)
Source of Fire for Fire Death Events Reviewed, 2006-2008 (n=15 events)
Cooking/heating stove20%
Lighter/matches39%
Candles7%
Space heater27%
Electrical w iring7%
Cooking/heating stove 3 fire events (3 child deaths/2 adult deaths)
Cigarette lighter/matches 6 fire events (11 child deaths/3 adult deaths) Candles 1 fire event (2 child deaths/0 adult deaths) Space heater 4 fire events (10 child deaths/6 adult deaths) Electrical wiring 1 fire event (3 child deaths/2 adult deaths)
39

For this report, we had hoped to analyze other factors involved in fire deaths, such as blocked means of escape, etc. Unfortunately, there was not enough known/reliable data to report on this topic. Recommendations: The key word in fire safety and prevention is functional fire alarms. If there’s a fire alarm in the household but the battery for it is in the TV remote control, then that’s as good as no fire alarm. There is probably no coincidence that only one fatal fire event had a functional fire alarm: the presence of a working alarm saves lives.
The Philadelphia Fire Department has a program to install free alarms with 10‐year lithium batteries. Similar programs across other communities could help prevent future fire deaths.
Communities should enact and enforce smoke detector laws for rental units – and they might want to consider it
for owned units as well.
In addition, communities need to invest in their local Juvenile Fire Setter or Fire Stopper programs. Children are a major source of the start of fires – whether from unintentional mishaps with candles, from playing with matches or lighters, or from deliberate acts of arson.
40

Poisoning Deaths (n=12) Poisoning deaths accounted for a total of 12 child deaths reviewed. The poisoning deaths discussed in this section only include unintentional poisoning deaths. If a child or youth were to have intentionally ingested a toxic substance (suicide) or if the child’s intent was unclear (an undetermined death), it would not be included in this section.
For child deaths reviewed from 2006 to 2008, there were no cases of suicide by poisoning, and there were four cases of poisoning of an undetermined manner (two in 2007 and two in 2008).
There were two poisoning deaths that involved infants. One was a child whose cause of death was attributed to the mother’s illicit drug use during her pregnancy; the other death was caused by toxic levels of methadone acquired through breastfeeding. The ten remaining cases of the unintentional poisoning deaths were drug‐related (which in lay term language would be called ‘accidental overdose’). The vast majority of these deaths occurred in White non‐Hispanics (80%) and in males (80%). One of the ten deaths occurred in a 14 year old, and the age of the remaining deaths was 17 years or older. The most common drugs found in these youth deaths are further described in Figure 5.5b on the following page.
Please note: there were at least three eligible cases of poisoning deaths in 2006 and one eligible case in 2007 that were not reviewed by the PCDR teams.
Figure 5.5a Gender and Race/Ethnicity of Drug‐Related Deaths Reviewed for Year of Death 2006‐2008 (n=10)
Gender of Drug-Related Deaths Reviewed, 2006-2008 (n=10)
Male80%
Female20%
Race/Ethnicity of Drug-Related Deaths Reviewed, 2006-2008 (n=10)
Black, non-Hispanic
10%
Hispanic (of any race)
10%
White, non-Hispanic
80%
41

Figure 5.5b Major Drugs Present in Toxicology Report in Drug‐Related Deaths Reviewed, 2006‐2008 (n=10)
Major Drugs Present in Toxicology Report of Drug-Related Deaths Reviewed, 2006-2008 (n=10)
6
4
5
1
0
1
2
3
4
5
6
7
Opiates/methadone Cocaine Benzodiazepines Barbiturates
Some decedents had more than one drug listed as cause of death (does not add up to 10)
For this report, we wanted to look at the number of drug‐related deaths where the child had already sought treatment for drug and alcohol abuse. Unfortunately, we were unable to analyze this based on the limitations of the current data collection tool that is being used. We would like to revise the question in the data collection tool to make future such analyses possible. Recommendations:
Community actions to maintain adequate drug and alcohol treatment facilities, and to ensure that wait time for entry is not unduly long
Community action to ensure adequate access to mental health professionals for all children, regardless of public or private insurance status.
Other Non‐Transportation Deaths There were no electrocution or burn deaths reviewed for years of death 2006 through 2008. There were three children unintentionally killed by firearms in 2006 to 2008. Two were reviewed by the PCDR team, one was not reviewed. All three involved children (ages 3‐18 years) who were playing with a weapon. Of note, there were no exposure deaths reviewed for years of death 2006 through 2008 (i.e. there were no heat‐related deaths of children in those years or cold‐exposure related deaths). In addition, there were no medical misadventure deaths reviewed, nor were there any fall or crush deaths reviewed. Recommendations:
Education about safe gun storage and safety devices Enforcement of local laws that restrict gun access
42

Section VI: Deaths due to Intentional Injuries Deaths due to intentional injuries – including child abuse and neglect deaths, other homicides, and suicides – accounted for almost a quarter of all child deaths reviewed for years of death 2006‐2008. Child Abuse & Neglect Deaths (n=14) Child abuse and neglect is defined by the Federal Child Abuse Prevention and Treatment Act (CAPTA) as “Any recent act or failure to act on the part of a parent or caretaker which results in death…” For deaths in 2006‐2008, there were 14 cases reviewed that were determined to be due to child abuse and neglect. The victims were mostly very young children (71% were under the age of two years), and predominantly male (86%). Figure 6.1a Age Groups of Child Abuse & Neglect Deaths Reviewed for Years of Death 2006‐2008 (n=14)
Age at Death 2006 2007 2008 Total <1 Year 4 1 0 5 1‐4 Years 3 3 2 8 5‐14 Years 0 0 0 0 15‐19 Years 1 0 0 1
Total 8 4 2 14 Figure 6.1b Gender and Race/Ethnicity of Child Abuse & Neglect Deaths Reviewed for Years of Death 2006‐2008 (n=14)
Gender of Child Abuse and Neglect Victims Reviewed, 2006-2008 (n=14)
Male86%
Female14%
Race/Ethnicity of Child Abuse and Neglect Victims Reviewed, 2006-2008 (n=14)
Hispanic7%
Black, Non-Hispanic
79%
Other, Non-Hispanic
7%
White, Non-Hispanic
7%
Almost three‐quarters of the victims (10 cases) were killed by inflicted physical injury, and there was one death reviewed that was caused by medical neglect.
43

Figure 6.1c Cause of Child Abuse & Neglect Deaths Reviewed for Years of Death 2006‐2008 (n=14)
Cause of Death of Child Abuse and Neglect Victims Reviewed, 2006-2008 (n=14)
Medical Neglect
7%
Drowning7%
Asphyxia7%
Weapon, including body
part72%
Fall or crush7%
In most cases, ‘weapon, including body part’ means the child was killed at the hands of their caretaker (and not
from a gun). Many of these victim’s families were known to the Philadelphia Department of Human Services (DHS). In fact, at least 29% of the reviewed child abuse and neglect victims from 2006‐2008 had an open Child Protection Services (CPS) case at the time of their death. Figure 6.1d Child Abuse & Neglect Deaths Reviewed with Open CPS Case for Years of Death 2006‐2008 (n=14)
Percentage of Child Abuse and Neglect Victims Reviewed with Open CPS Case at
Time of Death, 2006-2008 (n=14)
Yes29%
No50%
Unknown21%
Recommendations:
Counties or cities need to conduct full investigations/reviews for any suspicious child deaths within their jurisdiction – as well as for the death of a child with a history of child protection services
Counties or cities need to help protect vulnerable siblings while investigating a potentially suspicious child death In Philadelphia, children who die from child abuse and neglect ultimately get reviewed by two separate child death review teams: by the PCDR teams and by DHS. This is in addition to the CIRT conference calls, which review every sudden, unexpected infant deaths and other suspicious child deaths.
DHS conducts the Act 33 Near Fatality and Fatality Reviews for all CPS fatalities or near fatalities where an indicated report has been made or a determination has not been made within 30 days. In addition, DHS conducts a Non‐Act 33 (Internal) Fatality Review for instances when DHS receives a report of death that does not meet requirements for the Act 33 Review.
44

Homicides (other than due to Child Abuse & Neglect) (n=235) Homicides (other than child abuse and neglect cases) accounted for an additional 235 deaths reviewed for years of death 2006‐2008. This category of death is larger than all reviewed cancer deaths, asthma deaths, infectious disease deaths, motor vehicle crash deaths, fire deaths, drowning deaths, drug‐related deaths, and suicide deaths combined. When averaged out over the last seven years, Philadelphia has experienced approximately one youth homicide (ages 21 and under) every four days. That’s almost eight youth homicides per month, every month, for the past several years. Homicides are not evenly distributed among the Philadelphia youth population. There are major gender, age, and racial/ethnic disparities. Most of the homicides reviewed were in the later teen years, with very few occurring under the age of 16 years. Almost all (95%) of the youth homicides were male, and nearly all of them (96%) were of a racial/ethnic minority: either Black, non‐Hispanic (90%) or Hispanic (6%). Figure 6.2a Age Groups of Homicide Victims Reviewed, by Year of Death 2006‐2008 (n=235)
Age Group 2006 2007 2008 Total 1‐4 Years 0 0 1 1 5‐9 Years 1 0 1 2
10‐14 Years 1 1 2 4 15‐19 Years 73 70 52 195 20‐21 Years 0* 0* 33 33
Total 75 71 89 235 *PCDR teams did not review 20‐21 year olds who died in 2006 or 2007.
Figure 6.2b Gender and Race/Ethnicity of Homicide Victims Reviewed for Years of Death 2006‐2008 (n=235)
Gender of Homicide Deaths Reviewed, 2006-2008 (n=235)
Male95%
Female5%
Race/Ethnicity Breakdown of Homicides Reviewed, 2006-2008 (n=235)
Black, Non-Hispanic
90%
Hispanic6%
White, Non-Hispanic
3%
Asian, Non-Hispanic
0%
45

Figure 6.2c Month of Year of Homicide Victims Reviewed for Years of Death 2006‐2008 (n=235)
Month of Death for Homicides Reviewed, 2006-2008 (n=235)
18
10
18
30
23
16
29
21
17
21
1715
0
5
10
15
20
25
30
35
Janu
ary
Februa
ryMarc
hApri
lMay
June Ju
ly
Augus
t
Septem
ber
Octobe
r
Novem
ber
Decem
ber
A large percentage of the homicide victims reviewed had juvenile delinquent and criminal histories of their own. Nearly three‐quarters of the homicide victims of 2008 had had a juvenile detention history, and an even larger percentage (81%) had had a criminal history prior to their death. In addition, at least 75% of the reviewed homicide victims (between the ages of 5 and 18 years) had a history of truancy problems in school. Figure 6.2d and Figure 6.2e Percentage of Homicide Victims Reviewed with Juvenile Detention History and Previous Criminal History for Year of Death 2008 (n=88)
Percentage of Homicide Victims who had a Juvenile Detention History, 2008 (n=88)
Yes72%
No28%
Percentage of Homicide Victims who had a Criminal History, 2008 (n=88)
Yes81%
No19%
Note: these graphs only includes those aged 9 and older Also: did not include 2006 and 2007 secondary to poor data quality/too many missing values
46

Figure 6.2f Percentage of Homicide Victims Reviewed with School Truancy Problem for Year of Death 2008 (n=28)
Homicide Cases Reviewed with History of Truancy Problems, Ages 5-18, 2008 (n=28)
Yes75%
No/Unknown/NotAnswered
25%
Only included 2008 data on truancy because 2006 and 2007 contained too many unknowns/missing values.
Almost all (93%) of the youth homicides reviewed were killed by a firearm. Another 5% were killed by a sharp instrument (such as a knife), and the remainder died as a result of arson or vehicular manslaughter. Figure 6.2g Type of Weapon Used on Homicide Victims Reviewed for Years of Death 2006‐2008 (n=235)
Percentage of Types of Weapon used in Homicide Deaths Reviewed, 2006-2008 (n=235)
Firearm93%
Sharp instrument
5%
Other (e.g. f ire, vehicular)
2%
47

Please note: this map consists of all homicide victims, ages 0 through 21 years, who died within Philadelphia from 2006 to 2008. Data source is the Philadelphia Medical Examiner’s Office database.
48

In approximately 55% of the youth homicide victims we reviewed, a primary defendant was identified. Of the identified primary defendants, over half of them (53%) was a friend or acquaintance of the victim. Close relatives (such as a sibling) accounted for 5% of the defendants, and boyfriend/girlfriend accounted for 1% of the identified defendants. Similar to the victim’s gender profile, the vast majority (98%) of identified defendants were males. Figure 6.2h Relationship of Defendant to Homicide Victim for Years of Death 2006‐2008 (n=131)
Relationship of Defendant to Homicide Victims Reviewed, 2006-2008 (n=131)
Close relative5%
Friend6%
Stranger38%
Other4%
Acquaintance47%
In 45% of cases, no defendant was identified. This graph only represents those defendants who were identified.
Figure 6.2h1 Gender and Age Groups of Defendants (n=131)
Gender of Identified Defendants, 2006-2008 (n=131)
Male98%
Female2%
Age Group of Identified Defendants, 2006-2008 (n=131)
15-19 years38%
25-29 years8%
20-24 years39%
Unknown10%
30-34 years4%35-40 years
1%
We wanted to look more closely at the percentage of these defendants with a known history of truancy problems, but such information is not currently captured by the current data collection tool. Other data points we were curious to look at but are also not captured by the current data collection tool included number of arrests and age of first arrest for homicide victims, and time of the day of the homicide. Recommendations:
Support violence interruption strategies in the community, such as engaging survivors of shooting injuries Support programs that provide services and supervision for youth and young adults who are considered high‐risk
to commit violent acts Support mental health initiatives that can provide a full understanding of the symptoms of trauma for youths
exposed to violence as well as an adequate capacity to see patients
49

Support conflict resolution teams in the schools Support truancy courts that will aggressively pursue cases, even for children as young as in Kindergarten
Suicides (n=15) Please note: while suicides did occur among Philadelphia youth who died in 2006, the cases were never reviewed by the PCDR teams. In addition, 2007 deaths only go through age 19, whereas 2008 deaths are reviewed through age 21 years. Suicides accounted for 15 (or just over 1%) of the child deaths reviewed by the PCDR teams for years of death 2006‐2008. Males made up 67% of the deaths, and hanging constituted the most common method (73%) of youth suicide in Philadelphia. Figure 6.3a Gender and Race/Ethnicity of Suicide Deaths Reviewed for Years of Death 2007‐2008 (n=15)
Gender of Suicides Reviewed, 2007-2008 (n=15)
Male67%
Female33%
Race/Ethnicity of Suicides Reviewed, 2007-2008 (n=15)
White, Non-Hispanic
27%
Black, Non-Hispanic
40%
Hispanic33%
Figure 6.3b Age Groups of Suicide Deaths Reviewed for Years of Death 2007‐2008 (n=15)
Age Groups of Suicides Reviewed, 2007-2008 (n=15)
2
1
0
1
7
4
0
1
2
3
4
5
6
7
10-14 Years 15-19 Years 20-21 Years
2007
2008
Figure 6.3c Method of Suicide by Age Group for Suicide Deaths Reviewed for Years of Death 2007‐2008 (n=15)
50

Method of Death in Suicides Reviewed, 2007-2008 (n=15)
Jumped in front of Train
7%
Hanging73%
Firearm13%
Fall7%
None of the cases reviewed from year of death 2007‐2008 killed themselves by drug ingestion.
Of the child deaths reviewed from 2007‐2008, only 20% had a known history of prior suicide threats, and only 13% had had a know prior suicide attempt. The number of prior suicide threats and attempts is likely to be underestimated because the team does not have access to information from mental health providers/systems other than the Department of Behavioral Health (DBH). Figure 6.3d Known History of Suicide Threats or Attempts of Suicide Deaths Reviewed for Year of Death 2007‐2008 (n=15)
Percentage of Suicide Victims Reviewed with Known Prior Suicide Threats, 2007-2008 (n=15)
Yes20%
No80%
Percentage of Suicide Victims Reviewed with
Known Prior Suicide Attempts, 2007-2008 (n=15)
Yes13%
No87%
51

If the team can learn what led a child to commit suicide, we could take a more effective preventive approach. There are many questions as part of our database that delve into the possible reasons that might have triggered the action, such as bullying, break‐up with a boyfriend, parents’ divorce, recent suicide of a friend, etc. Unfortunately, only one of the team members (DBH) was able to provide answers to these questions for a large number of the decedents. Most of the other team members could not answer these questions at all. Therefore, just because the team was not aware that bullying was an issue with any of the 15 suicides reviewed does not necessarily mean that none of the suicide victims had bullying as a possible reason for suicide. Figure 6.3e Listing of Most Common Reasons for Suicide of Suicide Deaths Reviewed for Year of Death 2007‐2008 (n=15)
4 or more out of 15: Argument with parent Break‐up with boyfriend/girlfriend 1 out of 15:
Pregnancy Sexual orientation Problems with the law Recent death of friend or relative
Parents’ divorce or separation 0 out of 15: Gambling/job problems/money problems Involvement in cult activities/internet/computer games Argument with friends Recent suicide of friend or relative
Religious/cultural issues Drugs/alcohol problems Move/new school Rumor mongering Bullying (as perpetrator or as victim) Recommendations
Support anti‐bullying efforts at schools Improve data collection methods for suicide victims (which might include a social interview with the family or a
special medical chart review of cases) Support standardization of police investigation of youth suicides (e.g. using computer forensics) Support youth suicide prevention initiatives in the community
52

Appendix
A. CDR Team Members Adult Parole and Probation Department Maureen Everly, Robert Malvestuto, Amy Snyder, Lindsay Ahlman, Charles Hoyt,* Kate Somerville*
American Red Cross Michael Kiley‐Zufelt* Anti‐Violence Partnership of Philadelphia Julie Good, Pam Kelberg, Kate Roach, Marla Davis Bellamy, Julie Rausch, Myra Maxwell* Belmont Center for Comprehensive Treatment Michael DeStefano* Community Behavioral Health Renee Finely, Hazel Carrawell, Mary Ellen Gregorski* Children’s Crisis Treatment Center Anne Holland Children’s Hospital of Philadelphia Joanne Wood, Marcia Francis, Glennis Pagano, Nadine Gracia, Cindy Christian, Sarah Frioux,* Heather McKeag,* Laura Brennan* Department of Behavioral Health Roland Lamb, Carissa Ferguson, Francis Addo, Catherine Williams, Joanne Butler* Department of Human Services Sheena Thomas‐Austin, Jacqueline Cunningham, Deborah Majette, Ann Baker, Belinda Moody, James Randolph, Charles Johnson, Paula Howard, Danelle Cooper, Cheryl Stewart, Steven Oakman,* Thomas Cieslinski,* Vanessa Williams‐Cain,* Theresa Childers,* Timene Farlow* District Attorney’s Office Thomas Delesandro, Namratha Ravikant, Jack O’Neill, Sian Fernas,* George Mosee, Jr* Don’t Fall Down In the Hood Harry James, Archye Leacock, Andre Chin Every Murder Is Real Victoria Greene* Federal Bureau of Investigation Elisa Lehman* Office of Supportive Housing Valerie Carter,* Lauren Tucker* Mantua Against Drugs C.B. Kimmins* Mothers In Charge Gloria Bryant, Dorothy Johnson‐Speight* Philadelphia Anti‐Drug, Anti‐Violence Network Michael Harris * denotes current member
Philadelphia Courts Darlene Gaines, Kenneth Freeman,* Lynn Roman* Philadelphia Department of Public Health Maternal, Child and Family Health: Chervida Molino, Adina Ekwerike, Tracey Mention, Kimberlee Mander‐Wilson Ambulatory Health Services: Warren Tillack, Robert Spencer,* Susan Robbins * Medical Examiner’s Office: Ian Hood, Arlene Pagan, Sylvia Urrata,* Amber Brubaker,* Sam Gulino* Philadelphia Health Management Corporation Donna Ferraro, Brook Bankes, Steven Rodgers (ChildLink)* Philadelphia Fire Department Fire: Lloyd Ayers, Richard Bossert, Andrew Robinson, Larry Jones, Daniel Parrish, Michael Grant, Michele French,* Mark Stewart* Emergency Medical Services: Thomas Hillman, Anne Raven, Larry Foster,* Ryan Morrison,* Eric Ackerman* Philadelphia Legal Assistance Belinda Holguin,* Ileana Garcia* Philadelphia Police Department Detectives: George Golden, Regina Byarm, Kathy Battle, Jim Griffin* Special Victim’s Unit: Barbara Weldon, Malachi Jones, Mike Boyle, Lisa Salvato,* Janet Jones* Philadelphia School District Alton Strange, Darlene Thompson, Amy Maisterra, Pam Brown, Bettyann Creighton, Michael Andrews* Public Citizens for Children and Youth Colleen McCauley Public Health Consultants Paul Fink,* Pat West* St. Christopher’s Hospital for Children Maria McColgan, Daniel R. Taylor,* Raquel Mora,* Edgar Collazo* St. Gabriel’s System Lisa Koury, Bette Kennedy Stop Child Abuse Now Michelle Chew, Vivian Drayton Temple University Hospital – Division of Trauma Scott Charles, Christina Campbell University of Pennsylvania Douglas Wiebe, Susan Sorenson Additional Persons Diane Edbril (CeaseFire PA), Tammy White (Safe & Sound), Sadiyah Rasheed & Sharron Williams (Grief Assistance Program) Rob Sheesley (Center for Grieving Children), Lisa Stalberg (Maternity Care Coalition) * denotes current member
53

B. Fatality Review Program Staff Members Roy Hoffman, MD, MPH – Medical Director Ugo Chizea‐Abuah, MSPH – Program Coordinator Monica Harmon, MSN, MPH – Nurse Abstractor Amber Brubaker, MSS, MLSP – Crisis Care Coordinator Sylvia Urrata, MSS – Bereavement Care Coordinator C. Resources and Links Pennsylvania Public Health Child Death Review Act (Act 87):
http://www.pacdrt.org/uploads/Pennsylvania_Public_Health_Child_Death_Review_Act_87_of_2008_Page__1_of_15.pdfLegislation that codified the voluntary process of child death review established in Pennsylvania in 1991.
Pennsylvania Child Death Review Confidentiality Statement:
http://www.pacdr.org/content/PA%20State%20CDR%20COnfid%20Individual.pdfThe state model which local Pennsylvania teams use for their team members
National Center for Child Death Review (NCCDR): http://www.childdeathreview.org/home.htm Resource center for state and local child death review programs, funded by the Maternal and Child Health Bureau NCCDR Case Reporting System:
http://www.childdeathreview.org/reports/CDRCaseReportForm2‐1‐11009.pdf Contains the questions the PCDR teams use for data collection at the reviews. Philadelphia Department of Public Health’s vital statistics reports:
http://www.phila.gov/health/Commissioner/VitalStatistics.html Listing of Philadelphia Vital Statistic Reports from 2003 through 2007
54