Embed Size (px)
Citation preview
CITY OF MELBOURNEANNUAL REPORT 2014–2015

City of Melbourne Annual Report 2014–15We are pleased to present the City of Melbourne’s Annual Report for 2014–15. This report describes the City of Melbourne’s performance over the 2014–15 financial year against the objectives of the 2014–15 Annual Plan and Budget and the four-year priorities of the Council Plan 2013–2017.
The report is designed to meet our obligations under section 131 of the Local Government Act 1989. It also draws on the Global Reporting Initiative (GRI) G4 framework for sustainability reporting, with a view to being able to report fully to core requirements of the G4 framework in future years.
The City of Melbourne has obtained external assurance for the financial and standard statements, as well as the performance statement contained in this report. External assurance was not sought on the GRI components of the report.
Our website at melbourne.vic.gov.au provides more information about City of Melbourne activities, policies and plans for the future.
We value your feedback on this report because it helps us make our next report better. If you’d like more information about any item in this report, just contact us and ask.
Email your feedback or questions to [email protected]
Write to us at: Improvement and Program Integration, City of Melbourne, GPO Box 1603 Melbourne VIC 3001
Speak to a Customer Relations Officer on +61 3 9658 9658.
FUTURE MELBOURNE COMMUNITY PLAN
10+ YEARS
ANNUAL PLAN AND BUDGET
YEARLY
COUNCIL PLAN
4 YEARS
MUNICIPAL PUBLIC HEALTH & WELLBEING
PLAN
MunicipalStrategic Statement
Ongoing evaluation and
review including community
input
ANNUAL REPORT
CONTENTS
Welcome to the City of Melbourne 2
Fast facts 2
Our vision and goals 3
Year in review 4
Message from The Lord Mayor 4
Message from the Chief Executive Officer 5
Message from the Chief Financial Officer 6
Highlights and summary of progress 7
2014–15 key projects 10
Sustainability at the City of Melbourne 11
Events calendar 13
Council governance 14
Our councillors 17
Council planning framework 21
Our reporting framework 22
Performance against our goals 23
Goal 1: A city for people 24
Goal 2: A creative city 34
Goal 3: A prosperous city 40
Goal 4: A knowledge city 46
Goal 5: An eco-city 52
Goal 6: A connected city 58
Goal 7: Resources are managed well 64
Goal 8: An accessible, transparent and responsive organisation 70
Our organisation 75
Our functions 76
Executive team 77
Involving the community in our decisions 78
Continuous improvement 80
Our people 81
Staff profile 82
Equality and diversity 84
Employee health and safety 85
Employee development and training 86
Our environmental performance 88
Risk management 91
Audit operations 92
Our partnerships and charters 94
Our procurement and supply chain 95
Interacting with customers 96
Inner Melbourne Action Plan 2014–15 97
Our reporting approach 98
Global Reporting Initiative Index 100
Property holdings 105
Victorian Local Government Indicators 106
Governance and Management Checklist 107
Local Government Performance Reporting Framework Performance Indicators 109
City of Melbourne 2014–15 Performance Statement 115
Financial Report 127
City of Melbourne Annual Report 2014–2015
September 2015
DisclaimerThis report is provided for information and it does not purport to be complete. While care has been taken to ensure the content in the report is accurate, we cannot guarantee it is without flaw of any kind. There may be errors and omissions or it may not be wholly appropriate for your particular purposes. In addition, the publication is a snapshot in time based on historic information which is liable to change. The City of Melbourne accepts no responsibility and disclaims all liability for any error, loss or other consequence which may arise from you relying on any information contained in this report.
To find out how you can participate in the decision-making process for the City of Melbourne’s current and future initiatives, visit melbourne.vic.gov.au/getinvolved
2
Welcome to the City of Melbourne
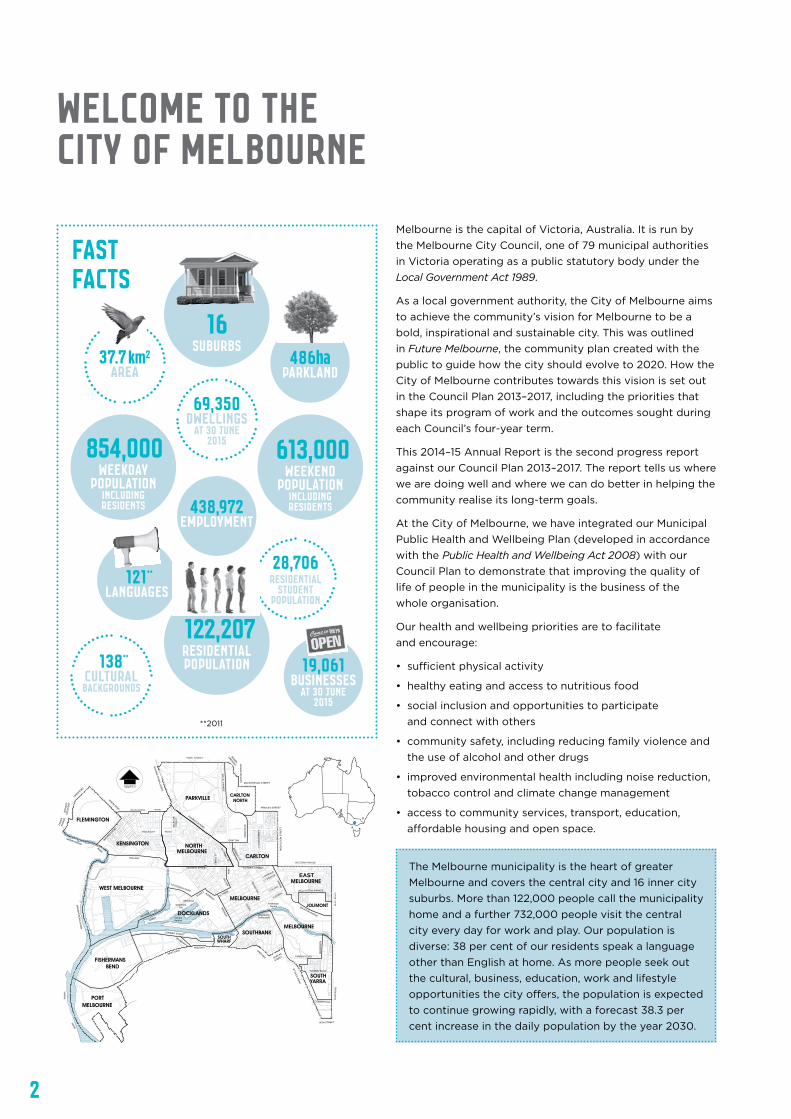
Melbourne is the capital of Victoria, Australia. It is run by the Melbourne City Council, one of 79 municipal authorities in Victoria operating as a public statutory body under the Local Government Act 1989.
As a local government authority, the City of Melbourne aims to achieve the community’s vision for Melbourne to be a bold, inspirational and sustainable city. This was outlined in Future Melbourne, the community plan created with the public to guide how the city should evolve to 2020. How the City of Melbourne contributes towards this vision is set out in the Council Plan 2013–2017, including the priorities that shape its program of work and the outcomes sought during each Council’s four-year term.
This 2014–15 Annual Report is the second progress report against our Council Plan 2013–2017. The report tells us where we are doing well and where we can do better in helping the community realise its long-term goals.
At the City of Melbourne, we have integrated our Municipal Public Health and Wellbeing Plan (developed in accordance with the Public Health and Wellbeing Act 2008) with our Council Plan to demonstrate that improving the quality of life of people in the municipality is the business of the whole organisation.
Our health and wellbeing priorities are to facilitate and encourage:
• sufficient physical activity
• healthy eating and access to nutritious food
• social inclusion and opportunities to participate and connect with others
• community safety, including reducing family violence and the use of alcohol and other drugs
• improved environmental health including noise reduction, tobacco control and climate change management
• access to community services, transport, education, affordable housing and open space.
The Melbourne municipality is the heart of greater Melbourne and covers the central city and 16 inner city suburbs. More than 122,000 people call the municipality home and a further 732,000 people visit the central city every day for work and play. Our population is diverse: 38 per cent of our residents speak a language other than English at home. As more people seek out the cultural, business, education, work and lifestyle opportunities the city offers, the population is expected to continue growing rapidly, with a forecast 38.3 per cent increase in the daily population by the year 2030.
854,000weekDAY
populationincLudingresidents 438,972
employment
FAST FACTS
RACECOURSE ROAD
VICTORIA STREET
VictoriaHarbour
WaterfrontCity
New QuayFederation
Square
SouthbankPromenade
CARLTON
TS YRADNUOB
MELBOURNE
YARRASOUTH
DOMAIN ROAD
NOS
RED
NA
MELBOURNE
SOUTHBANK
RECN
EPS
QUEENSW
ANSTONEBORT AL
LONSDALE
LT BOURKE
COLLINS
LIW
YELREDDA
DOCKLANDS
WELLINGTON PARADE
EUNEVA NOTNURB
MELBOURNEEAST
MELBOURNENORTHKENSINGTON
YAWLIAR
NORTHCARLTON
TEERTS REMIROL
SDNOP EENOOM KEERC
DAOR YARCSTOOF
DAOR DLEIFHTIMS
YELDUD
LEEP
VICTORIA STREET
GNIR
PS
SREDNILF
LAICREMMOC
MELBOURNE
PORT
JOLIMONT
PARKVILLE
TOORAK ROAD
TEERTS
FLEMINGTONREHSIF
FREEWAY
TEERT
ERR
OL
ST
S
REVI
R
ARRA
Y
HIGH STREET
DAOR
ADLI
K TS
DAO
R TN
UPDA
OR T
NUP
VICTORIA PARADE
TEERTS
NOSL
OH
CIN
NEWOB
TEERTS
NO
GYL
PRINCES STREET
TNEC
SERC
TEERTS
NOT
RAG MACPHERSON STREET
REVIR
KEER
C SD
NOP
EENO
OM
DAOR
MOSPE
ESO
RLEM
ROADMACAULAY
PARK STREET
GNONRYBIRAM
DAOR SGNAL
REVI
R GN
ONRY
BIRA
M
TNECSERCDRAN
OELEDARAP
SACRODYAW S
GNIKETAG TSEW
DAOR NOTGNIMELF
EDA
RAP
LAY
OR
GRATTAN
NOTS
NAWS
TS L
LENN
OC'O
FISHERMANS
WEST MELBOURNE
SOUTHWHARF
BEND
TS Y
ELEK
REB
16SUBURBS
69,350 dwellings
at 30 june2015
37.7 km2
AREA
121** languages
138** culturalbackgrounds
613,000weekend
populationincLudingresidents
19,061 businesses
at 30 june2015
486ha
parkland
28,706Residential
studentpopulation
**2011
122,207Residential population

3
OUR VISION AND GOALS
COMMUNITY VISIONFor Melbourne to be a bold, inspirational and sustainable city, as expressed in the Future Melbourne community plan (see futuremelbourne.com.au/wiki/view/FMPlan)
Our aimTo achieve the community’s vision of Melbourne as a bold, inspirational and sustainable city
Our goalsOur Council Plan 2013–2017 includes eight goals to guide us. The first six reflect our aspirations for the city. The final two relate to our internal performance and the good governance and management of our organisation.
1. A city for people
2. A creative city
3. A prosperous city
4. A knowledge city
5. An eco-city
6. A connected city
7. Resources are managed well
8. An accessible, transparent and responsive organisation
Our customersWe strive to make everything we do easier, better, faster and cheaper for our customers, gaining more value from our limited resources.
Our servicesOur diverse services can be grouped under the following six headings: Regulate; Activate city; Advance Melbourne; Design, Build and manage assets; Deliver community services; Governance and internal support.
WELCOME TO THE CITY OF MELBOURNE
4
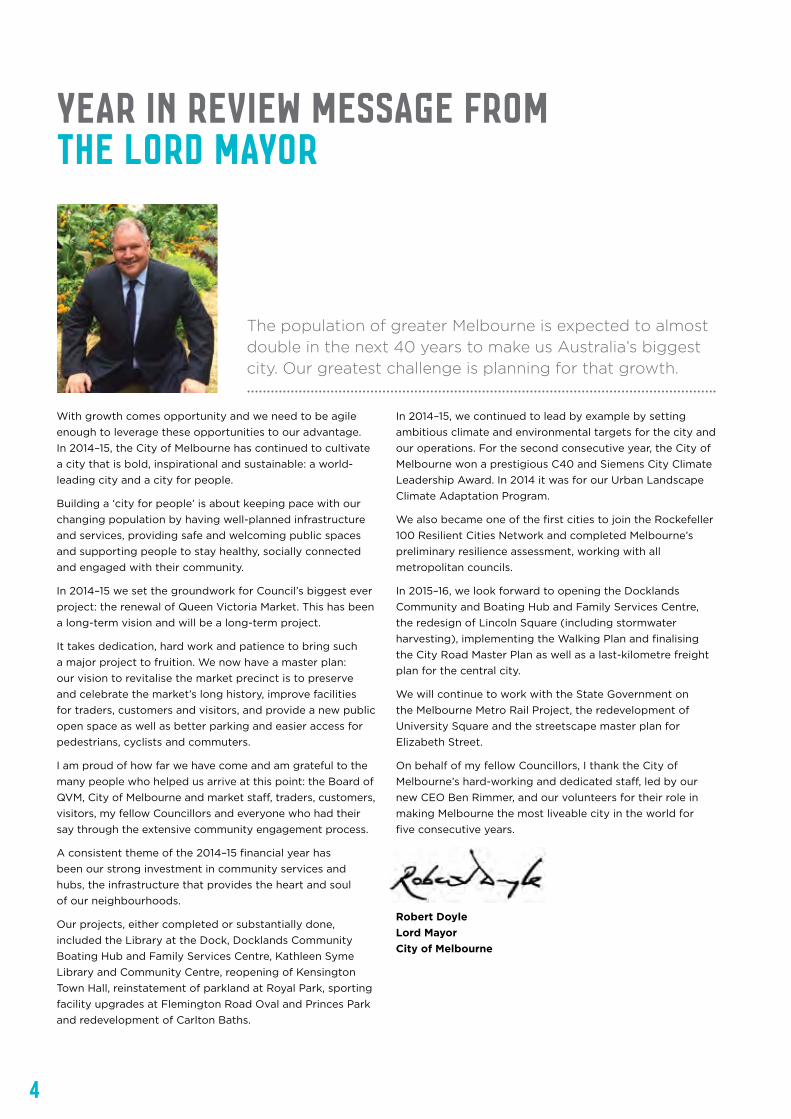
YEAR IN REVIEW Message from THE Lord Mayor
With growth comes opportunity and we need to be agile enough to leverage these opportunities to our advantage. In 2014–15, the City of Melbourne has continued to cultivate a city that is bold, inspirational and sustainable: a world-leading city and a city for people.
Building a ‘city for people’ is about keeping pace with our changing population by having well-planned infrastructure and services, providing safe and welcoming public spaces and supporting people to stay healthy, socially connected and engaged with their community.
In 2014–15 we set the groundwork for Council’s biggest ever project: the renewal of Queen Victoria Market. This has been a long-term vision and will be a long-term project.
It takes dedication, hard work and patience to bring such a major project to fruition. We now have a master plan: our vision to revitalise the market precinct is to preserve and celebrate the market’s long history, improve facilities for traders, customers and visitors, and provide a new public open space as well as better parking and easier access for pedestrians, cyclists and commuters.
I am proud of how far we have come and am grateful to the many people who helped us arrive at this point: the Board of QVM, City of Melbourne and market staff, traders, customers, visitors, my fellow Councillors and everyone who had their say through the extensive community engagement process.
A consistent theme of the 2014–15 financial year has been our strong investment in community services and hubs, the infrastructure that provides the heart and soul of our neighbourhoods.
Our projects, either completed or substantially done, included the Library at the Dock, Docklands Community Boating Hub and Family Services Centre, Kathleen Syme Library and Community Centre, reopening of Kensington Town Hall, reinstatement of parkland at Royal Park, sporting facility upgrades at Flemington Road Oval and Princes Park and redevelopment of Carlton Baths.
In 2014–15, we continued to lead by example by setting ambitious climate and environmental targets for the city and our operations. For the second consecutive year, the City of Melbourne won a prestigious C40 and Siemens City Climate Leadership Award. In 2014 it was for our Urban Landscape Climate Adaptation Program.
We also became one of the first cities to join the Rockefeller 100 Resilient Cities Network and completed Melbourne’s preliminary resilience assessment, working with all metropolitan councils.
In 2015–16, we look forward to opening the Docklands Community and Boating Hub and Family Services Centre, the redesign of Lincoln Square (including stormwater harvesting), implementing the Walking Plan and finalising the City Road Master Plan as well as a last-kilometre freight plan for the central city.
We will continue to work with the State Government on the Melbourne Metro Rail Project, the redevelopment of University Square and the streetscape master plan for Elizabeth Street.
On behalf of my fellow Councillors, I thank the City of Melbourne’s hard-working and dedicated staff, led by our new CEO Ben Rimmer, and our volunteers for their role in making Melbourne the most liveable city in the world for five consecutive years.
Robert Doyle Lord Mayor City of Melbourne
The population of greater Melbourne is expected to almost double in the next 40 years to make us Australia’s biggest city. Our greatest challenge is planning for that growth.
5
Message from THE Chief Executive Officer
What you should glean from the pages is the enormous passion our people have for the environment, economy, culture, built form and communities that make up this great city of Melbourne. The strength of this organisation is a reflection of the leadership and achievements of my predecessor, Dr Kathy Alexander, the organisation’s management team and all employees.
The City of Melbourne is driven by the best vision statement of any organisation I’ve seen – the Melbourne community’s vision to be ‘bold, inspirational and sustainable’. Achievements in 2014–15 live up to this promise many times over. I will mention just three initiatives that particularly reflect the organisation’s achievements.
Bold In a bold move to engage citizens in local democracy, the City of Melbourne appointed a randomly selected People’s Panel to take a deep look into what the city delivers and make recommendations for its future. This approach was a first for local government in Australia and it paid off, with the Council unanimously endorsing its first 10-Year Financial Plan, which included most of the panel’s recommendations.
Inspirational The City of Melbourne plays a significant role in shaping community attitudes to violence and gender equity – as a public institution, as the ‘guardian’ of our central city, and as the employer of some 1500 people. At our best we lead community attitudes and inspire others to even greater feats.
This year we have trained our staff to encourage bystander action, we have looked hard at the role that our services can play in response to family violence, and we are making change, as part of the Male Champions of Change program, to improve gender equality in our role as an employer.
Sustainable Melbourne must be prepared and able to respond to the challenges of a changing climate, rapid population growth and increasing urban pressures. Melbourne was the first Australian city to join the Rockefeller Foundation’s
prestigious 100 Resilient Cities network. As part of this, we have started working across the community to proactively address long-term sustainability concerns and have completed an Australian-first assessment of the challenges and opportunities facing Melbourne.
Next steps As you will read in this report, this organisation has achieved many significant outcomes for our community. In many parts of our work we provide a leadership role in Australia, or across the globe.
But good organisations challenge themselves to improve. That is why in March this year I commissioned an Organisational Capability Review. The completed report recognised the considerable talent and expertise of our managers and staff and also identified areas where we need to continue to improve.
The City of Melbourne Organisational Action Plan – One Melbourne, One CoM – was our response to the Organisational Capability Review. It outlines a number of activities to be completed over 2015–16 that will refresh and invigorate the organisation to even better support Council and the community.
I would like to thank our Lord Mayor, Deputy Lord Mayor and Councillors for their wisdom, leadership and contribution to this city. Most of all, I would like thank all City of Melbourne staff. You put a huge amount of work into achieving all that we did in the last year, and I’m confident that we will continue to make everything we do even better.
Ben Rimmer Chief Executive Officer City of Melbourne
I am proud to present this Annual Report for the first time as Chief Executive Officer of the City of Melbourne. The City of Melbourne delivers outstanding results for its ratepayers and the broader community of our city. This report demonstrates those achievements and accounts for our performance over the past year.
YEAR IN REVIEW
6
Message from THE Chief Financial Officer
The 10-Year Financial Plan identified a significant level of infrastructure investment required to support the projected growth in the city’s population over the next decade. The record level of investment will be in excess of $1.4 billion and includes funding for the renewal of the Queen Victoria Market, infrastructure to support population growth, increased open spaces, and funding to maintain the Council’s $3.4 billion in infrastructure assets. The 2014–15 financial statements should be read with an understanding of future infrastructure requirements to provide meaningful context.
The Council has delivered another strong financial result in 2014–15. This was able to be achieved through containing overall costs growth to less than two per cent while maintaining a high level of service standards and accommodating costs pressures associated with population growth. Total revenue grew by nine per cent year-on-year with increases across most major revenue streams. Notably, external capital contributions were significantly higher, with open space contributions being a major factor. The external funding for capital projects was and will be directed towards current and future capital works projects.
The strong operating performance resulted in an underlying surplus of $16.5 million, an operating surplus of $60.2 million and a comprehensive result of $121.7 million - all increases on the prior year and necessary to fund important future infrastructure. The underlying surplus is the best indicator of the organisation’s underlying financial performance and sustainability. It removes once-off non-cash gains/(losses) from asset revaluations (included in the comprehensive result), non-cash asset contributions and external capital contributions (included in both the operating surplus and comprehensive result).
As a result of the strong operating performance and some capital projects being carried forward, cash assets increased from $81.3 million to $106.5 million with no council debt as at 30 June 2015. The increased cash enabled the settlement
of a strategic land acquisition as part of the Queen Victoria Market renewal on 1 July 2015 for $76 million. The Council will go into modest borrowings in the near future to enable funding for critical infrastructure projects.
The Council’s balance sheet was strengthened during the year with net assets growing by $121.7 million to $3.6 billion. This was a culmination of the strong operating result, capital works delivered during the year and asset revaluations.
The Council’s current asset ratio, a measurement of our financial strength, increased from 1.33 to 1.64. This means for every $1 of current liability, the Council had $1.64 in current assets to meet those commitments. The Council remains in a very strong financial position with the 2014-15 financial result strengthening our financial flexibility to meet the city’s future infrastructure funding needs.
Phu Nguyen (CPA) Chief Financial Officer City of Melbourne
The Council’s first 10-Year Financial Plan was adopted in 2014–15 following extensive community engagement and having considered recommendations from a comprehensive People’s Panel (citizen’s jury) process.
June 2015
June 2014
$’000 $’000
Income statement surplus / (Deficit) 60.2 31.3
Comprehensive result surplus / (Deficit) 121.7 107.9
Underlying result 16.5 1.2
Cash assets 106.5 81.3
Net assets 3,648.9 3,527.2
Current asset ratio 1.64 1.33
7
HIGHLIGHTS AND SUMMARY OF PROGRESS
Below is a summary of our progress against each of our eight Council Plan goals. More detailed information about our performance is provided in the ‘Our Council 2014–15 performance’ section of this report.
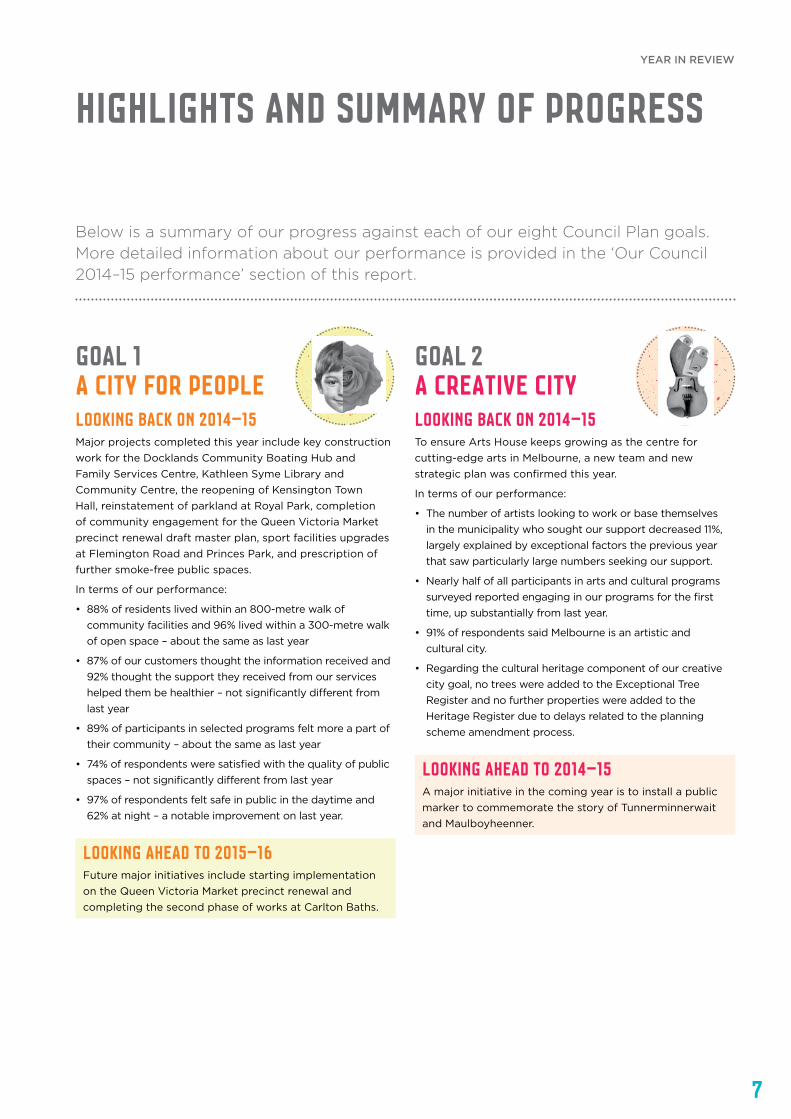
Goal 1 A city for people Looking back on 2014–15Major projects completed this year include key construction work for the Docklands Community Boating Hub and Family Services Centre, Kathleen Syme Library and Community Centre, the reopening of Kensington Town Hall, reinstatement of parkland at Royal Park, completion of community engagement for the Queen Victoria Market precinct renewal draft master plan, sport facilities upgrades at Flemington Road and Princes Park, and prescription of further smoke-free public spaces.
In terms of our performance:
• 88% of residents lived within an 800-metre walk of community facilities and 96% lived within a 300-metre walk of open space – about the same as last year
• 87% of our customers thought the information received and 92% thought the support they received from our services helped them be healthier – not significantly different from last year
• 89% of participants in selected programs felt more a part of their community – about the same as last year
• 74% of respondents were satisfied with the quality of public spaces – not significantly different from last year
• 97% of respondents felt safe in public in the daytime and 62% at night – a notable improvement on last year.
Goal 2 A creative cityLooking back on 2014–15To ensure Arts House keeps growing as the centre for cutting-edge arts in Melbourne, a new team and new strategic plan was confirmed this year.
In terms of our performance:
• The number of artists looking to work or base themselves in the municipality who sought our support decreased 11%, largely explained by exceptional factors the previous year that saw particularly large numbers seeking our support.
• Nearly half of all participants in arts and cultural programs surveyed reported engaging in our programs for the first time, up substantially from last year.
• 91% of respondents said Melbourne is an artistic and cultural city.
• Regarding the cultural heritage component of our creative city goal, no trees were added to the Exceptional Tree Register and no further properties were added to the Heritage Register due to delays related to the planning scheme amendment process.
Looking ahead to 2015–16Future major initiatives include starting implementation on the Queen Victoria Market precinct renewal and completing the second phase of works at Carlton Baths.
Looking ahead to 2014–15A major initiative in the coming year is to install a public marker to commemorate the story of Tunnerminnerwait and Maulboyheenner.
YEAR IN REVIEW
8
Looking ahead to 2015–16Future major initiatives include implementing the 2015–2019 Tourism Action Plan, developing and running business missions to key markets in China and Japan, and identifying activities to strengthen cross-council economic development activities.
Looking ahead to 2015–16A major initiative in the coming year is to implement the second stage of our Open Data Program.
Looking ahead to 2015–16Future major initiatives include progressing work on stormwater harvesting and integrated water management at various locations including Lincoln Square and University Square, and developing an implementation plan as part of our work under the 100 Resilient Cities program.
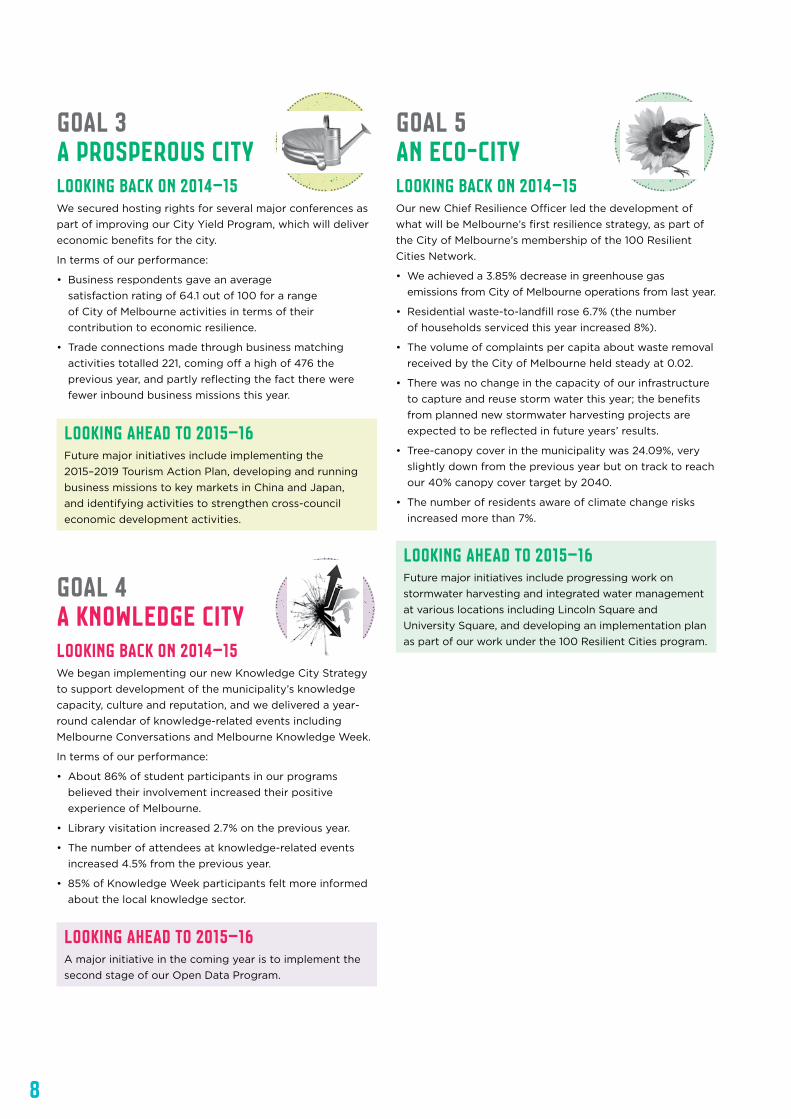
Goal 3 A prosperous city Looking back on 2014–15We secured hosting rights for several major conferences as part of improving our City Yield Program, which will deliver economic benefits for the city.
In terms of our performance:
• Business respondents gave an average satisfaction rating of 64.1 out of 100 for a range of City of Melbourne activities in terms of their contribution to economic resilience.
• Trade connections made through business matching activities totalled 221, coming off a high of 476 the previous year, and partly reflecting the fact there were fewer inbound business missions this year.
Goal 5 An eco-cityLooking back on 2014–15Our new Chief Resilience Officer led the development of what will be Melbourne’s first resilience strategy, as part of the City of Melbourne’s membership of the 100 Resilient Cities Network.
• We achieved a 3.85% decrease in greenhouse gas emissions from City of Melbourne operations from last year.
• Residential waste-to-landfill rose 6.7% (the number of households serviced this year increased 8%).
• The volume of complaints per capita about waste removal received by the City of Melbourne held steady at 0.02.
• There was no change in the capacity of our infrastructure to capture and reuse storm water this year; the benefits from planned new stormwater harvesting projects are expected to be reflected in future years’ results.
• Tree-canopy cover in the municipality was 24.09%, very slightly down from the previous year but on track to reach our 40% canopy cover target by 2040.
• The number of residents aware of climate change risks increased more than 7%.
Goal 4 A Knowledge city Looking back on 2014–15We began implementing our new Knowledge City Strategy to support development of the municipality’s knowledge capacity, culture and reputation, and we delivered a year-round calendar of knowledge-related events including Melbourne Conversations and Melbourne Knowledge Week.
In terms of our performance:
• About 86% of student participants in our programs believed their involvement increased their positive experience of Melbourne.
• Library visitation increased 2.7% on the previous year.
• The number of attendees at knowledge-related events increased 4.5% from the previous year.
• 85% of Knowledge Week participants felt more informed about the local knowledge sector.

9
Looking ahead to 2015–16A major initiative in the coming year will be to redevelop the corporate website as part of our digital transformation program.
Looking ahead to 2015–16Future major initiatives include working with the Victorian Government on the Melbourne Metro Rail Project, and beginning implementation of the streetscape master plan for Elizabeth Street.
Looking ahead to 2015–16A major initiative in the coming year will be to develop a Town Hall Precinct Plan.
Goal 8 An accessible, transparent and responsive organisationLooking back on 2014–15We introduced a new performance dashboard on our corporate website that allows residents and the public to track how well the City of Melbourne is delivering important services for the community each quarter.
• There were 115 Council and Future Melbourne Committee items handled in confidential session, or 28% of agenda items.
• The number of online City of Melbourne publications remained unchanged at 19.
• Visits to web-pages with Council registers and Council decisions made under the Planning and Environment Act 1987 increased 5%.
• Most residents surveyed are aware of (57%) and less than half (41%) had participated in our community engagement processes – slightly down from last year; 46% rated those processes good or very good – similar to last year.
Goal 6 A connected cityLooking back on 2014–15We rolled out ‘PayStay’ across the municipality – a new pay-by-phone parking system that makes parking more convenient.
• The number of street connections allowing pedestrians to move easily within and between blocks in the city remained unchanged at an average 0.88 connections per block.
• The average footpath space devoted to pedestrians in the city remained unchanged at about 19% of the total carriageway area.
• The proportion of city users who travelled primarily by bike or on foot to the city was 11.7%, and 72.5% within the city (2012–13).
Goal 7 Resources are managed wellLooking back on 2014–15In a major example of local democracy at work, we invited a randomly selected citizen’s jury to recommend how the Council should manage its spending and revenue over the next 10 years, resulting in our new Financial Plan.
• The City of Melbourne’s long-term underlying surplus was $16.52 million this year – significantly higher than last year.
• The rateable property assessments per employee at the City of Melbourne were 73.22 – up from 68.24 the previous year, reflecting a continued increasing trend in organisational productivity.
• Residents’ satisfaction rating for our services was 73 out of 100 – not significantly different from last year.
• Our voluntary and total workforce turnover was 7.83% and 16.99% respectively – both up from last year.
Beyond the measures of progress against our long-term goals detailed in this report, the City of Melbourne also publishes performance results on how we’re delivering to our customers on a range of services and programs. See our quarterly performance results at melbourne.vic.gov.au/AboutCouncil/Pages/QSDashboard.aspx.
YEAR IN REVIEW

DATE. 18.09.2015 JOB SIZE. 297mm(h) x 210mm(w)JOB NO. REV. CLIENT. JOB NAME.037316r05_COME_Annual Plan Budget Key Projects Graphics
© OPTIMO 2015
93 MONTAGUE ST. STH MELBOURNE VIC 3205 AUSTRALIAPH. (03) 9686 7766 | W. WWW.OD.COM.AU | E. [email protected]
Victoria Harbour
Yarra River
Yarra River
Yarra River
Mo
oni
e P
ond
s C
reek
MELBOURNECRICKETGROUND
YARRAPARK
MELBOURNEPARK
QUEEN
VICTORIA
GARDENS
ALEXANDRAGARDENS
KING'S
DOMAIN
BIRRARUNGMARR
BATMAN
PARK
SOUTH WHARF PROMENADE
POINT
PARK
DOCKLANDS
PARK
ETIHADSTADIUM
FLAGSTAFF
GARDENS
CARLTONGARDENS
FITZROYGARDENS
TREASURYGARDENS
ROYALBOTANIC
GARDENS
ENTERPRIZE
PARK
QUAY PARK
EastMelbourne
NorthMelbourne
Fitzroy
Southbank
PortMelbourne
Jolimont
Docklands
Carlton
WestMelbourne
FLINDERS ST
FLINDERS ST
EX
HIB
ITION
ST
EX
HIB
ITION
ST
ELIZ
AB
ETH
ST
ELIZ
AB
ETH
ST
SW
AN
STO
N S
T
SW
AN
STO
N S
T
RU
SS
ELL S
T
RU
SS
ELL S
T
SP
EN
CE
R S
T
KIN
G S
T
WILLIA
M S
T
WILLIA
M S
T
QU
EE
N S
T
QU
EE
N S
T
COLLINS ST
COLLINS ST
LA TROBE ST
LONSDALE ST
LONSDALE ST
BOURKE ST
BOURKE ST
BOURKE ST
SOUTHERN LINK RD
ST K
ILDA
RD
ST
KILD
A R
D
ALEXANDRA AV
SWAN ST
NORMANBY R
D
KINGS WAY
COVENTRY ST
DORCAS ST
BRUNTON ST
BATM
AN AVPOW
ER ST
GRANT ST
SOUTHERN LINK
RD
CLA
RE
ND
ON
ST
QU
EE
NS
BR
IDG
E S
T
BOULEVARD
ST
UR
T S
T
ST
UR
T S
T
SOUTHBANK
CITY RD
KAVANAGH S
T
MO
RAY
ST
WE
LLS
ST
COLLINS ST
BOURKE ST
FLINDERS ST
WU
RU
ND
JERI W
AY
LA TROBE ST
ADDERLEY ST
BO
LTE
BR
IDG
E
HA
RT
LEY
ST
LORIMER ST
INGLES ST
BOUNDARY ST
ROGERS ST
WESTGATE FREEWAY
WESTGATE FREEWAY
LORIMER ST
NORTH WHARF RD
DOCKLANDS DRIVE
HA
RB
OU
R E
SP
LAN
AD
E
WE
ST
ER
N L
INK
(CIT
YLI
NK
)
KING ST
MILLER ST
DR
YB
UR
GH
ST
CH
ET
WY
ND
ST
HO
WA
RD
ST
VICTORIA ST
BATMAN ST
DUDLEY ST
STANLEY STRODEN ST
SPENCER ST
AB
BO
TSFO
RD
ST
ROSSLYN ST
ADDERLEY ST
FOOTSCRAY RD
HAWKE
ST
ARDEN ST
WILLIA
M S
T
ELIZ
AB
ETH
ST
COURTNEY ST
WRECKYN S
TBLA
CKWOOD S
TP
EE
L S
T
ER
RO
L S
T
CA
PE
L S
T VICTORIA ST
QUEENSBERRY ST
QUEENSBERRY ST
LEV
ES
ON
ST
CU
RZ
ON
ST
DR
YB
UR
GH
ST
AB
BO
TS
FOR
D S
T
PELHAM ST
QU
EE
N S
T
NIC
HO
LSO
N S
T
ALBERT ST
NIC
HO
LSO
N S
T
VICTORIA PDELA TROBE ST
SP
RIN
G S
T
RA
TH
DO
WN
E S
T
PELHAM ST
SW
AN
ST
ON
ST
CA
RD
IGA
N S
T
LYG
ON
ST
DR
UM
MO
ND
ST
LEIC
ES
TE
R S
T
BO
UV
ER
IE S
T
PE
EL
ST
FRANKLIN ST
GRATTAN ST
QUEENSBERRY ST
VICTORIA ST
HOTHAM
PO
WLE
TT
CATHEDRAL PL
GIS
BO
RN
E S
T
CLA
RE
ND
ON
ST
LAN
SD
OW
NE
ST
WELLINGTON PDE SOUTH
WELLINGTON PDE
EA
DE
S S
T
JOLI
MO
NT
RD
CITY R
D
CE
CIL S
T
GRANT ST
MARKET ST
NORMANBY RD
ALEXANDRA AV
RUSSELL ST EXTENSION
FLEMINGTON RDVIL
LIERS S
THARCOURT ST
RO
YAL
PD
E
GRATTAN ST
STORY ST
CA
RD
IGA
N S
T
LYG
ON
ST
ELGIN ST
JOHNSON ST
FARADAY ST
BARKLY ST
BR
UN
SW
ICK
ST
YO
UN
G S
T
NA
PIE
R S
T
GE
OR
GE
ST
GO
RE
ST
SM
ITH
ST
ST DAVID ST
MOOR ST
GREEVES ST
VICTORIA ST
BELL ST
MO
NTAG
UE ST
SMYTHE LA
DOMAIN RD
FLINDERS ST
MELBOURNE CENTRAL
FLAGSTAFF
SOUTHERN CROSS
PARLIAMENT
• Parks and gardens
• Public health and safety
• Recreation and leisure
• Street cleaning and waste management
* Arts and cultural policy and programming
• Urban policy and design
• International and national connections
• Arts participation and activation
• Business
• City promotion and tourism
• Events
• Local laws compliance
• Visitor and resident information
• Research
• Building, development and planning
• Sustainable environmental management
• Property and assets
• Community Services
• Roads, transport and infrastructure
• Information technology
• Customer relations
• Legal, governance and corporate
• Communications, media and publications
For details on the full range of City of Melbourne services visit melbourne.vic.gov.au
2014-2015KEY PROJECTS
SERVICES
Bicycle Improvement ProgramIncluding Flemington Road and Arden St
$1,887,000
Return to Royal ParkReinstatement of parkland on the site of the old Royal Children’s Hospital in Parkville
$1,980,000
Urban LandscapesClimate AdaptationStreets and open spaces
$1,339,000
Queen Victoria Precinct Renewal$2,305,000
Recreation Infrastructure Improvements
Royal and Princes Parks
$6,200,000
Kathleen Syme Library and Community
Centre, Carlton
$4,500,000
Streetscape Improvements and Design
Undertaking of major streetscape improvements in the Central City in accordance with
the Streetscape Framework
$3,670,000
For more details on these projects see the Performance Against Our Goals section.
Neill Street Reserve, Carlton
Landscape and recreational facilities
improvements Stage 2
$2,280,000
10
11
We face a number of future challenges due to climate change, population growth, a changing demographic and economic volatility. These challenges have prompted us to look at new ways to respond, while maintaining and growing Melbourne’s position as one of the world’s most liveable cities.
We are tackling these challenges in partnership with our community, by sharing the responsibility for building and maintaining a healthy and resilient environment for today and into the future.
To ensure we lead by example, we focus on embedding sustainability thinking into everything we do. From empowering staff to look for sustainability opportunities in their existing roles, changing our processes and systems to drive sustainable outcomes, or creating unique programs in collaboration with our community to inspire change, we continually strive to pioneer the sustainability agenda.
Only by taking a holistic approach to considering the natural environment, our community, good governance and a healthy economy will we achieve all our Council goals and fulfil our community’s vision.
We report yearly on our sustainability progress using the Global Reporting Initiative (GRI) Sustainability Reporting Framework, the most widely used sustainability reporting standard in the world. We adopted this framework because it helps us identify, measure, report and assess how we are performing in our day-to-day activities in economic, social and environmental terms on the issues that matter most to our organisation and to our stakeholders. It provides measures and methods for assessing and reporting sustainability-related impacts and performance and is accepted as the world’s highest standard of sustainability reporting.
Building a Resilient CityA key focus for us this year has been building Melbourne’s resilience to ensure our city can meet current and future challenges.
Resilient Melbourne is a metropolitan-wide project, led by the City of Melbourne and funded by 100 Resilient Cities (100RC), to develop a strategy that will improve urban resilience across greater Melbourne. 100RC was pioneered by the Rockefeller Foundation and aims to help cities around the world become more resilient to the growing physical, social and economic challenges of the 21st century. Chronic stresses and acute shocks rarely happen in isolation. By considering shocks and stresses in the same strategy, a city can respond better to adverse events and be more effective in delivering core functions and services in good times and bad.
Melbourne was selected from 372 applicant cities around the world to be among the first wave of 33 cities to join the 100RC network. We were chosen because we were judged to be a leader in addressing many resilience issues and a city that would be willing to test and adopt further innovations.
Sustainability at the City of Melbourne
Sustainability is at the heart of our community’s vision for Melbourne. We pride ourselves on being a sustainability leader, setting ambitious goals for both our organisation and the community to preserve and improve the city we love.
Learn more about our goals for the city and how we are addressing our sustainability challenges and aspirations in each of the following areas: as a city for people, creative city, prosperous city, knowledge city, eco-city and connected city (pages 24 to 63)
Learn more about how the City of Melbourne is striving to embed sustainability at the heart of everything we do as an organisation, as reflected in our goals of ensuring:
• resources are managed well (see Goal 7 performance pages 64 to 69)
• we are an accessible, transparent and responsive organisation (see Goal 8 performance pages 70 to 74)
• we involve the community in our decisions, achieve continuous improvement, promote an engaging, safe and diverse workplace, reduce our environmental impacts, manage our risks and supply chain (see Our organisation pages 75 to 97).
• To understand how we have applied the Global Reporting Initiative in the context of our report, see pages 98 to 104.
YEAR IN REVIEW
12
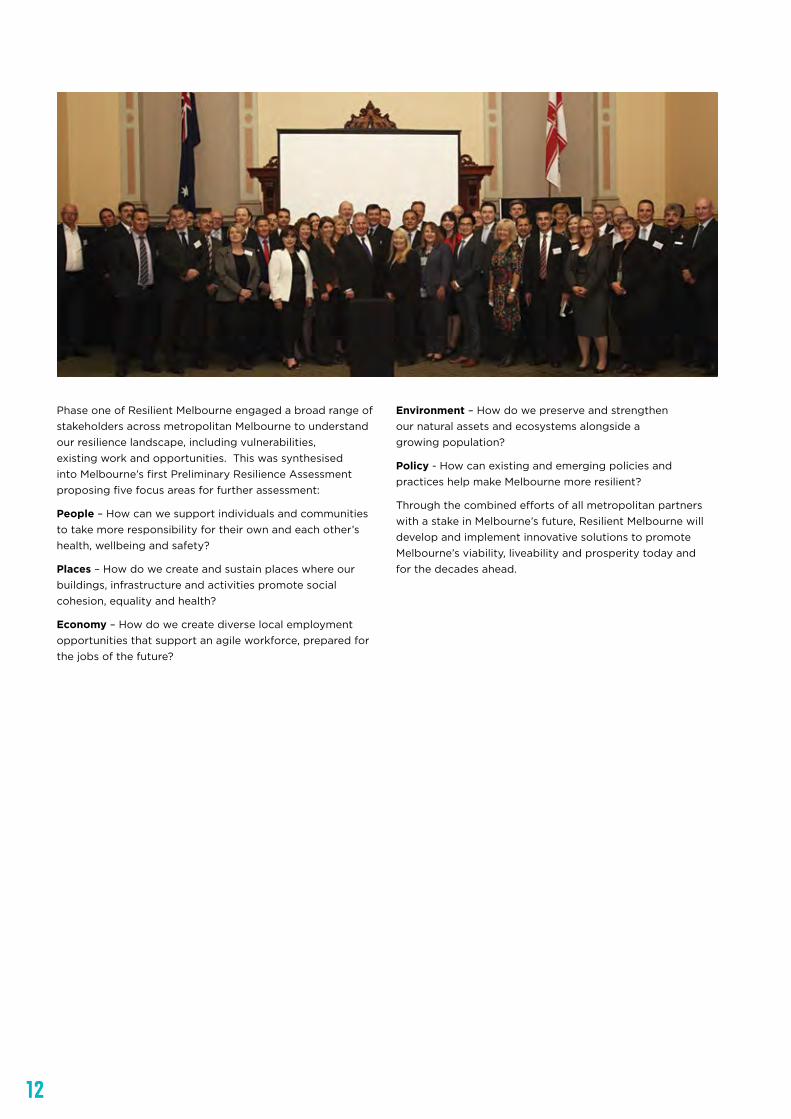
Phase one of Resilient Melbourne engaged a broad range of stakeholders across metropolitan Melbourne to understand our resilience landscape, including vulnerabilities, existing work and opportunities. This was synthesised into Melbourne’s first Preliminary Resilience Assessment proposing five focus areas for further assessment:
People – How can we support individuals and communities to take more responsibility for their own and each other’s health, wellbeing and safety?
Places – How do we create and sustain places where our buildings, infrastructure and activities promote social cohesion, equality and health?
Economy – How do we create diverse local employment opportunities that support an agile workforce, prepared for the jobs of the future?
Environment – How do we preserve and strengthen our natural assets and ecosystems alongside a growing population?
Policy - How can existing and emerging policies and practices help make Melbourne more resilient?
Through the combined efforts of all metropolitan partners with a stake in Melbourne’s future, Resilient Melbourne will develop and implement innovative solutions to promote Melbourne’s viability, liveability and prosperity today and for the decades ahead.
13
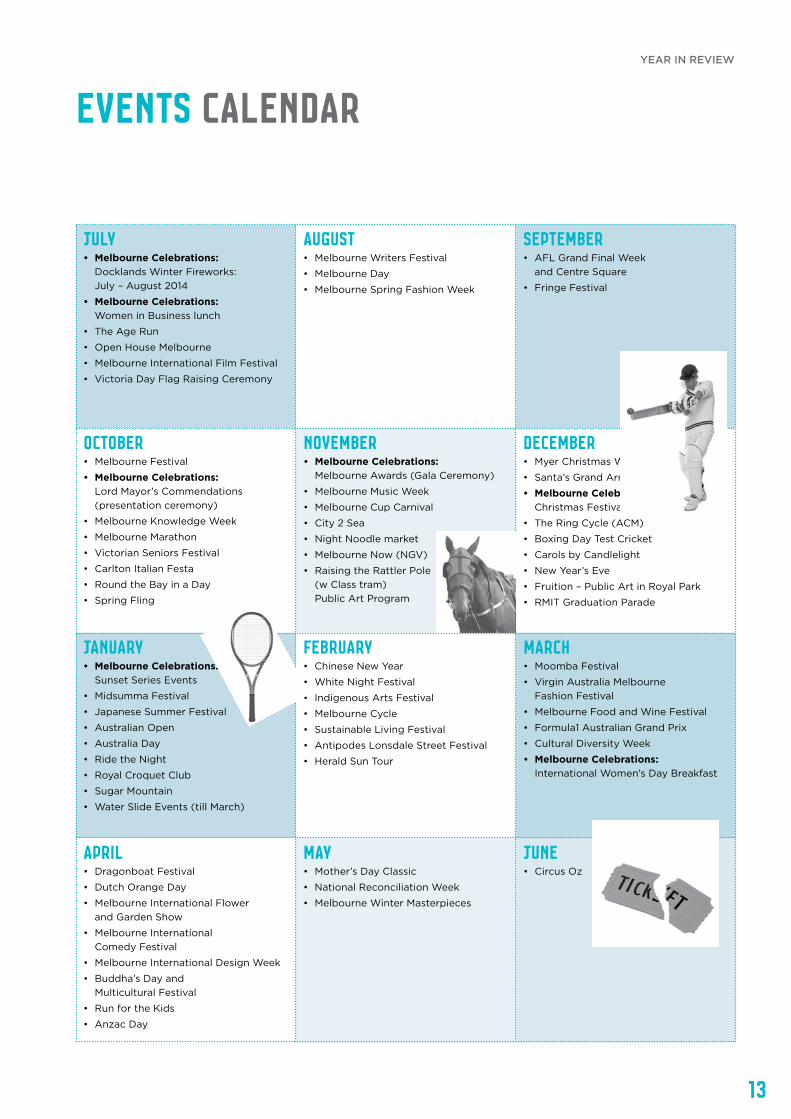
July• Melbourne Celebrations:
Docklands Winter Fireworks: July – August 2014
• Melbourne Celebrations: Women in Business lunch
• The Age Run
• Open House Melbourne
• Melbourne International Film Festival
• Victoria Day Flag Raising Ceremony
January• Melbourne Celebrations:
Sunset Series Events
• Midsumma Festival
• Japanese Summer Festival
• Australian Open
• Australia Day
• Ride the Night
• Royal Croquet Club
• Sugar Mountain
• Water Slide Events (till March)
November• Melbourne Celebrations:
Melbourne Awards (Gala Ceremony)
• Melbourne Music Week
• Melbourne Cup Carnival
• City 2 Sea
• Night Noodle market
• Melbourne Now (NGV)
• Raising the Rattler Pole (w Class tram) Public Art Program
September• AFL Grand Final Week
and Centre Square
• Fringe Festival
May• Mother’s Day Classic
• National Reconciliation Week
• Melbourne Winter Masterpieces
June• Circus Oz
EVENTS CALENDAR
March• Moomba Festival
• Virgin Australia Melbourne Fashion Festival
• Melbourne Food and Wine Festival
• Formula1 Australian Grand Prix
• Cultural Diversity Week
• Melbourne Celebrations: International Women’s Day Breakfast
April• Dragonboat Festival
• Dutch Orange Day
• Melbourne International Flower and Garden Show
• Melbourne International Comedy Festival
• Melbourne International Design Week
• Buddha’s Day and Multicultural Festival
• Run for the Kids
• Anzac Day
August• Melbourne Writers Festival
• Melbourne Day
• Melbourne Spring Fashion Week
February• Chinese New Year
• White Night Festival
• Indigenous Arts Festival
• Melbourne Cycle
• Sustainable Living Festival
• Antipodes Lonsdale Street Festival
• Herald Sun Tour
December• Myer Christmas Windows
• Santa’s Grand Arrival
• Melbourne Celebrations: Christmas Festival
• The Ring Cycle (ACM)
• Boxing Day Test Cricket
• Carols by Candlelight
• New Year’s Eve
• Fruition – Public Art in Royal Park
• RMIT Graduation Parade
October• Melbourne Festival
• Melbourne Celebrations: Lord Mayor’s Commendations (presentation ceremony)
• Melbourne Knowledge Week
• Melbourne Marathon
• Victorian Seniors Festival
• Carlton Italian Festa
• Round the Bay in a Day
• Spring Fling
YEAR IN REVIEW

14
Council governance
Statutory responsibility for local government lies with each Australian state or territory. An Act of each State Parliament specifies local government powers, duties and functions. In Victoria, the legal basis for councils is established under the Constitution Act 1975 and the Local Government Act 1989.
The City of Melbourne comprises a lord mayor and deputy lord mayor and nine councillors.
Under the provisions of the City of Melbourne Act 2001:
• Melbourne is not divided into wards
• the leadership team (Lord Mayor and Deputy Lord Mayor) is elected separately from councillors
• the preferential voting system is used to elect the leadership team and proportional representation is used to elect councillors.
The current Council was elected for a four-year term in October 2012. The next Council election is scheduled for October 2016. More information about local government elections is available from the Victorian Electoral Commission at vec.vic.gov.au.
Council decisions Councillors make decisions at Council meetings and Committee meetings (to which certain powers are delegated by the Council). Future Melbourne Committee meeting decisions are subject to a ‘referral notice process’, meaning that where fewer than six committee members vote in favour of a motion, or the Chair uses their casting vote, members have the option of referring the matter to the next Council meeting for decision.
Delegations Melbourne City Council’s powers under the Local Government Act 1989 or any other Act may be delegated to a Committee or Council, to a City of Melbourne officer (including the Chief Executive Officer), or sub-delegated to a City of Melbourne officer by the Chief Executive Officer. Staff members are accountable to the Chief Executive Officer. The Council and its committees make policy and staff members make decisions in accordance with that policy. The exercise of delegation is subject to the Council’s Delegations Policy.
15
Councillor conduct The City of Melbourne’s Councillor Code of Conduct outlines the role of the Council and provides an overview of councillor responsibilities in accordance with the Local Government Act 1989.
The code includes guidelines for rules of conduct, decision-making and use of City of Melbourne resources. It also includes procedures for disclosure of interests and conflicts of interest that go beyond legislative requirements.
All councillors received training on conflict of interest and misuse of position provisions as part of the new Council induction program, which took place in 2012. They receive regular communication via the City of Melbourne’s Governance and Legal branch and the Victorian Government, in regards to updated information, guidance and tools on these areas.
Councillor allowances Councillors are paid an allowance set by the Victorian Government. This allowance is paid in recognition of the demands placed on councillors in carrying out their civic and statutory duties, and for their work on policy development, as spokespeople on community matters and as representatives of the Melbourne City Council and Melbourne in Australia and overseas.
The allowances are:
Lord mayor – $180,163
Deputy lord mayor – $90,081
Councillors – $42,302
Councillors are also provided with a car park, office and executive support.
ExpensesCouncillors incur expenses in the course of fulfilling their roles. Expenditure is regulated by the Councillor Expenses and Resources Guidelines, as revised by the Council in May 2015 and consistent with section 75 of the Local Government Act 1989. Councillor expenses are reported in detail every quarter on our website.
Subsidiaries and trusts The City of Melbourne has three wholly-owned subsidiaries:
CityWide Service Solutions Pty Ltd – a company established to provide contract services on a competitive basis to local government and other public and private sector clients.
Queen Victoria Market Pty Ltd – a company established to manage and develop the Queen Victoria Market.
Enterprise Melbourne Pty Ltd – a company established to hold the registration for the Enterprise Melbourne Tianjin Representative Office, Tianjin, China.
The City of Melbourne has an interest in other entities including:
Sustainable Melbourne Fund – the City of Melbourne holds all units in this trust, a strategic trust established to support and promote sustainable development.
Regent Management Company Limited – shared with the Victorian Government, the City of Melbourne has a 50 per cent interest in this company, established to manage the historic Regent Theatre in Collins Street, Melbourne.
MAPS Group Limited trading as Procurement Australia – the City of Melbourne is majority shareholder of this company.
Documents available for inspection The Local Government Act 1989 and Local Government (General) Regulations 2004 require us to keep certain statutory registers and documents, most of which can be viewed on the City of Melbourne website, or, in certain cases, on application. Information on how to go about obtaining information and documents from the Council can be found in the ‘About Council’ section of our website, or by making a request in person at the Melbourne Town Hall Administrative Building, 120 Swanston Street, Melbourne during office hours.
The following documents are available:
(a) details of current allowances fixed for the Lord Mayor, Deputy Lord Mayor and Councillors
(b) the total annual remuneration for all senior officers in respect of the current financial year and the previous financial year, set out in a list that states—
(i) ranges of remuneration of senior officers, where the difference between the lower amount and the higher amount in each range must not exceed $10 000; and
(ii) the number of senior officers whose total annual remuneration falls within the ranges referred to in subparagraph (i)
(c) details of overseas or interstate travel (with the exception of interstate travel by land for less than 3 days) undertaken in an official capacity by Councillors or any member of Council staff in the previous 12 months, including the names of the Councillors or members of Council staff and the date, destination, purpose and total cost to the Council of the overseas or interstate travel, including accommodation costs
(d) names of Council officers who were required to submit a return of interest during the financial year and the dates the returns were submitted
(e) names of Councillors who submitted returns of interest during the financial year and the dates the returns were submitted
OUR COUNCIL
16
(f) agendas for and minutes of ordinary and special meetings held in the previous 12 months kept under section 93 of the Act except if the minutes relate to parts of meetings which have been closed to members of the public under section 89 of the Act
(g) a list of all special committees established by Council and the purpose for which each committee was established
(h) a list of all special committees established by the Council which were abolished or ceased to function during the financial year
(i) minutes of meetings of special committees established under section 86 of the Act and held in the previous 12 months except if the minutes relate to parts of meetings which have been closed to members of the public under section 89 of the Act
(j) a register of delegations kept under sections 87 and 98 of the Act, including the dates on which the last reviews under sections 86(6) and 98(6) of the Act took place
(k) submissions received in accordance with section 223 of the Act during the previous 12 months
(l) agreements to establish regional libraries under section 196 of the Act
(m) details of all property, finance and operating leases involving land, buildings, plant, computer equipment or vehicles entered into by the Council as lessor or lessee, including the name of the other party to the lease and the terms and the value of the lease
(n) a register of authorised officers appointed under section 224 of the Act
(o) a list of donations and grants made by the Council during the financial year, including the names of persons or bodies which have received a donation or grant and the amount of each donation or grant
(p) a list of the names of the organisations of which the Council was a member during the financial year and details of all membership fees and other amounts and services provided during that year to each organisation by the Council
(q) a list of contracts valued at $150,000 or more which the Council entered into during the financial year without first engaging in a competitive process; and which are not contracts referred to in section 186(5) or (5A) of the Act.
Participating in CouncilThe City of Melbourne welcomes community and stakeholder attendance and participation at Council and committee meetings. Members of the public can make submissions to the Council or a committee on matters listed on meeting agendas. A register of public submissions made under section 223 of the Local Government Act 1989 is available for viewing at the City of Melbourne’s offices.
Records of meetings, meeting dates and times and information on how to interact with the Council are provided on our website at melbourne.vic.gov.au.
17
OUR councillors
In 2014–15 the community was represented by the following office bearers on the Melbourne City Council. The positions held by office bearers in the profiles outlined below reflect membership of those bodies and committees which were operating during this time.
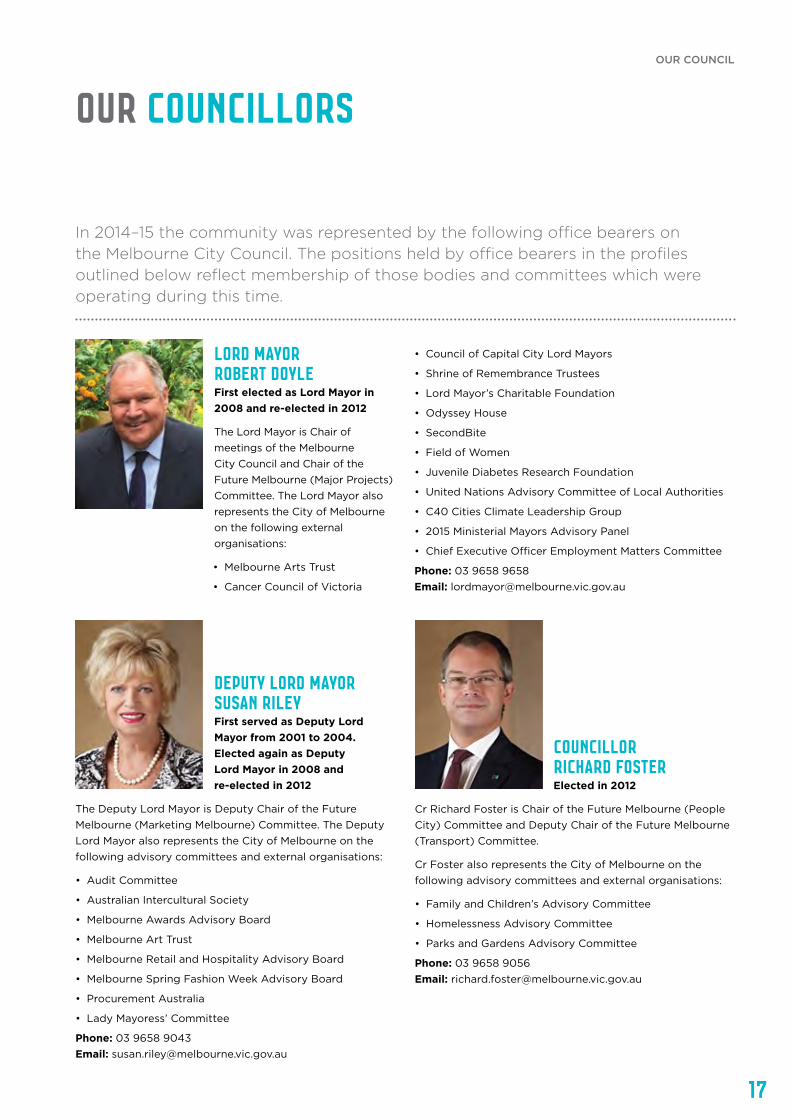
Lord Mayor Robert Doyle First elected as Lord Mayor in 2008 and re-elected in 2012
The Lord Mayor is Chair of meetings of the Melbourne City Council and Chair of the Future Melbourne (Major Projects) Committee. The Lord Mayor also represents the City of Melbourne on the following external organisations:
• Melbourne Arts Trust
• Cancer Council of Victoria
• Council of Capital City Lord Mayors
• Shrine of Remembrance Trustees
• Lord Mayor’s Charitable Foundation
• Odyssey House
• SecondBite
• Field of Women
• Juvenile Diabetes Research Foundation
• United Nations Advisory Committee of Local Authorities
• C40 Cities Climate Leadership Group
• 2015 Ministerial Mayors Advisory Panel
• Chief Executive Officer Employment Matters Committee
Phone: 03 9658 9658 Email: [email protected]
Deputy Lord Mayor Susan RileyFirst served as Deputy Lord Mayor from 2001 to 2004. Elected again as Deputy Lord Mayor in 2008 and re-elected in 2012
The Deputy Lord Mayor is Deputy Chair of the Future Melbourne (Marketing Melbourne) Committee. The Deputy Lord Mayor also represents the City of Melbourne on the following advisory committees and external organisations:
• Audit Committee
• Australian Intercultural Society
• Melbourne Awards Advisory Board
• Melbourne Art Trust
• Melbourne Retail and Hospitality Advisory Board
• Melbourne Spring Fashion Week Advisory Board
• Procurement Australia
• Lady Mayoress’ Committee
Phone: 03 9658 9043 Email: [email protected]
Councillor Richard FosterElected in 2012
Cr Richard Foster is Chair of the Future Melbourne (People City) Committee and Deputy Chair of the Future Melbourne (Transport) Committee.
Cr Foster also represents the City of Melbourne on the following advisory committees and external organisations:
• Family and Children’s Advisory Committee
• Homelessness Advisory Committee
• Parks and Gardens Advisory Committee
Phone: 03 9658 9056 Email: [email protected]
OUR COUNCIL
18
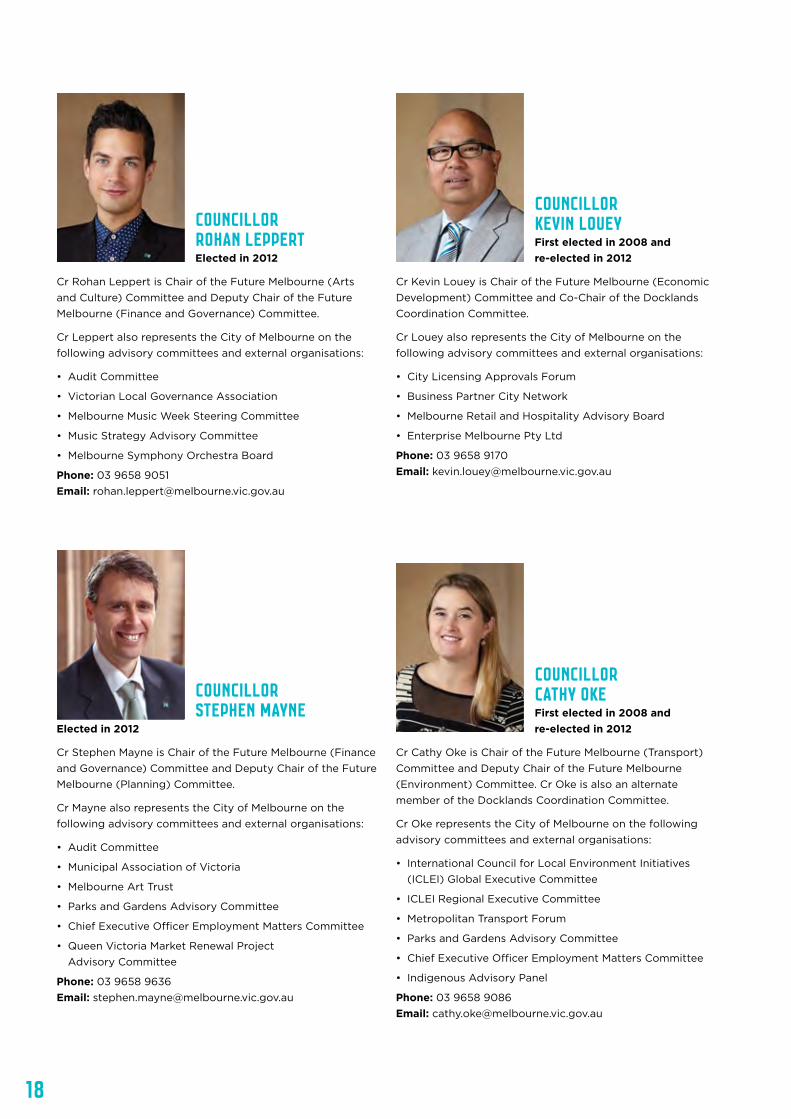
Councillor Rohan Leppert Elected in 2012
Cr Rohan Leppert is Chair of the Future Melbourne (Arts and Culture) Committee and Deputy Chair of the Future Melbourne (Finance and Governance) Committee.
Cr Leppert also represents the City of Melbourne on the following advisory committees and external organisations:
• Audit Committee
• Victorian Local Governance Association
• Melbourne Music Week Steering Committee
• Music Strategy Advisory Committee
• Melbourne Symphony Orchestra Board
Phone: 03 9658 9051 Email: [email protected]
Councillor Kevin LoueyFirst elected in 2008 and re-elected in 2012
Cr Kevin Louey is Chair of the Future Melbourne (Economic Development) Committee and Co-Chair of the Docklands Coordination Committee.
Cr Louey also represents the City of Melbourne on the following advisory committees and external organisations:
• City Licensing Approvals Forum
• Business Partner City Network
• Melbourne Retail and Hospitality Advisory Board
• Enterprise Melbourne Pty Ltd
Phone: 03 9658 9170 Email: [email protected]
Councillor Stephen Mayne
Elected in 2012
Cr Stephen Mayne is Chair of the Future Melbourne (Finance and Governance) Committee and Deputy Chair of the Future Melbourne (Planning) Committee.
Cr Mayne also represents the City of Melbourne on the following advisory committees and external organisations:
• Audit Committee
• Municipal Association of Victoria
• Melbourne Art Trust
• Parks and Gardens Advisory Committee
• Chief Executive Officer Employment Matters Committee
• Queen Victoria Market Renewal Project Advisory Committee
Phone: 03 9658 9636 Email: [email protected]
Councillor Cathy Oke First elected in 2008 and re-elected in 2012
Cr Cathy Oke is Chair of the Future Melbourne (Transport) Committee and Deputy Chair of the Future Melbourne (Environment) Committee. Cr Oke is also an alternate member of the Docklands Coordination Committee.
Cr Oke represents the City of Melbourne on the following advisory committees and external organisations:
• International Council for Local Environment Initiatives (ICLEI) Global Executive Committee
• ICLEI Regional Executive Committee
• Metropolitan Transport Forum
• Parks and Gardens Advisory Committee
• Chief Executive Officer Employment Matters Committee
• Indigenous Advisory Panel
Phone: 03 9658 9086 Email: [email protected]
19
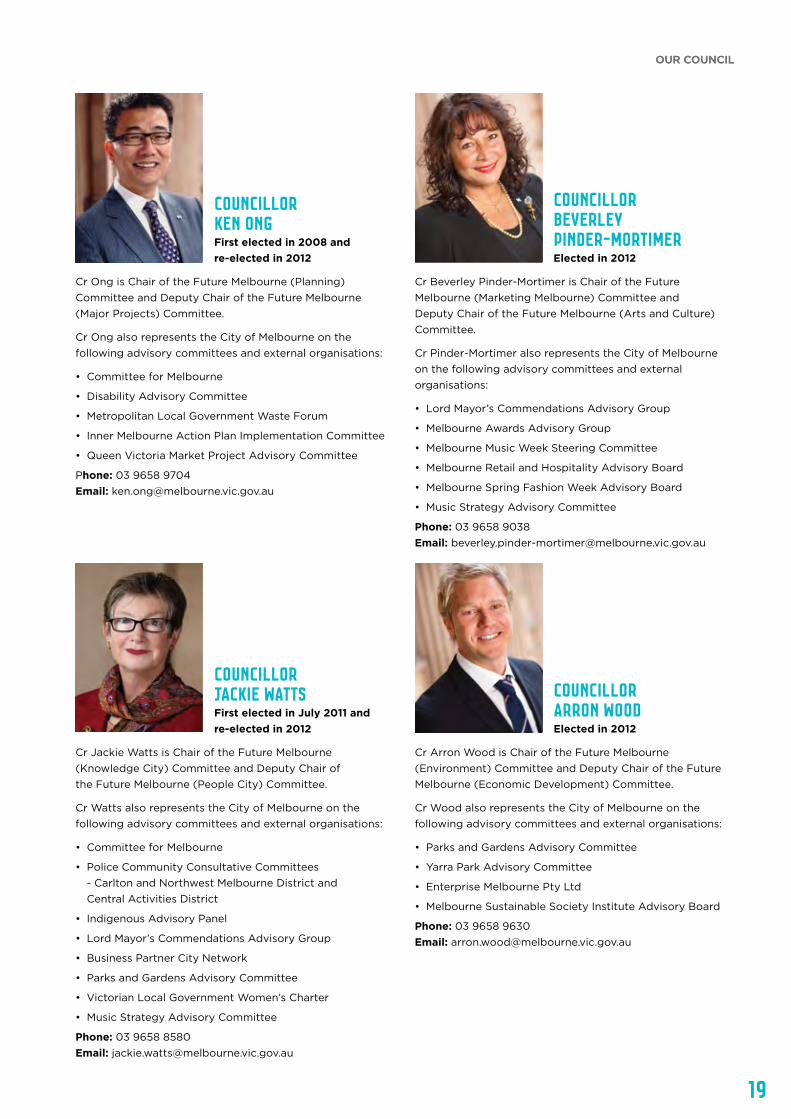
Councillor Ken OngFirst elected in 2008 and re-elected in 2012
Cr Ong is Chair of the Future Melbourne (Planning) Committee and Deputy Chair of the Future Melbourne (Major Projects) Committee.
Cr Ong also represents the City of Melbourne on the following advisory committees and external organisations:
• Committee for Melbourne
• Disability Advisory Committee
• Metropolitan Local Government Waste Forum
• Inner Melbourne Action Plan Implementation Committee
• Queen Victoria Market Project Advisory Committee
Phone: 03 9658 9704 Email: [email protected]
Councillor Beverley Pinder-Mortimer Elected in 2012
Cr Beverley Pinder-Mortimer is Chair of the Future Melbourne (Marketing Melbourne) Committee and Deputy Chair of the Future Melbourne (Arts and Culture) Committee.
Cr Pinder-Mortimer also represents the City of Melbourne on the following advisory committees and external organisations:
• Lord Mayor’s Commendations Advisory Group
• Melbourne Awards Advisory Group
• Melbourne Music Week Steering Committee
• Melbourne Retail and Hospitality Advisory Board
• Melbourne Spring Fashion Week Advisory Board
• Music Strategy Advisory Committee
Phone: 03 9658 9038 Email: [email protected]
Councillor Jackie WattsFirst elected in July 2011 and re-elected in 2012
Cr Jackie Watts is Chair of the Future Melbourne (Knowledge City) Committee and Deputy Chair of the Future Melbourne (People City) Committee.
Cr Watts also represents the City of Melbourne on the following advisory committees and external organisations:
• Committee for Melbourne
• Police Community Consultative Committees - Carlton and Northwest Melbourne District and Central Activities District
• Indigenous Advisory Panel
• Lord Mayor’s Commendations Advisory Group
• Business Partner City Network
• Parks and Gardens Advisory Committee
• Victorian Local Government Women’s Charter
• Music Strategy Advisory Committee
Phone: 03 9658 8580 Email: [email protected]
Councillor Arron Wood Elected in 2012
Cr Arron Wood is Chair of the Future Melbourne (Environment) Committee and Deputy Chair of the Future Melbourne (Economic Development) Committee.
Cr Wood also represents the City of Melbourne on the following advisory committees and external organisations:
• Parks and Gardens Advisory Committee
• Yarra Park Advisory Committee
• Enterprise Melbourne Pty Ltd
• Melbourne Sustainable Society Institute Advisory Board
Phone: 03 9658 9630 Email: [email protected]
OUR COUNCILOUR COUNCIL

20
Council special committees As well as Council meetings, Melbourne City Council has three special committees:
1. Future Melbourne Committee (meets twice monthly). This committee has delegated powers, duties and functions directly relating to, or ancillary to, all aspects of our activities. The Future Melbourne Committee’s terms of reference are grouped into 10 themes or portfolios:
• Arts and Culture
• Economic Development
• Environment
• Finance and Governance
• Knowledge City
• Major Projects
• Marketing Melbourne
• People City
• Planning
• Transport
All councillors participate in the Future Melbourne Committee.
2. Docklands Coordination Committee (meets annually). This committee manages coordination between the City of Melbourne and Places Victoria to ensure an open public discussion in this developing area. The committee, which includes senior representatives from both organisations, meets annually to monitor place management services within the coordination area.
3. Inner Melbourne Action Plan Implementation Committee (meets quarterly). This committee has delegated powers, duties and functions directly relating to, or ancillary to, overseeing implementation of the Inner Melbourne Action Plan in accordance with the agreed three-year implementation program. The committee comprises representatives from the local governments of Melbourne, Port Phillip, Stonnington, Yarra and Maribyrnong.
Committee meetingsMelbourne City Council meetings
Future Melbourne
Inner Melbourne Action Plan
Docklands Coordination
Number of meetings 14 24 4 1
LM Robert Doyle 14 23 •• ••
DLM Susan Riley 12 20 •• ••
Cr Richard Foster 12 22 •• ••
Cr Rohan Leppert 13 24 •• ••
Cr Kevin Louey 10 21 •• 1
Cr Stephen Mayne 14 24 •• ••
Cr Cathy Oke 10 20 •• *
Cr Ken Ong 14 22 4 ••
Cr Beverley Pinder-Mortimer 13 21 •• ••
Cr Jackie Watts 10 18 •• ••
Cr Arron Wood 12 21 •• ••
••Not a member *Alternate member
Council and committee meeting attendance
21
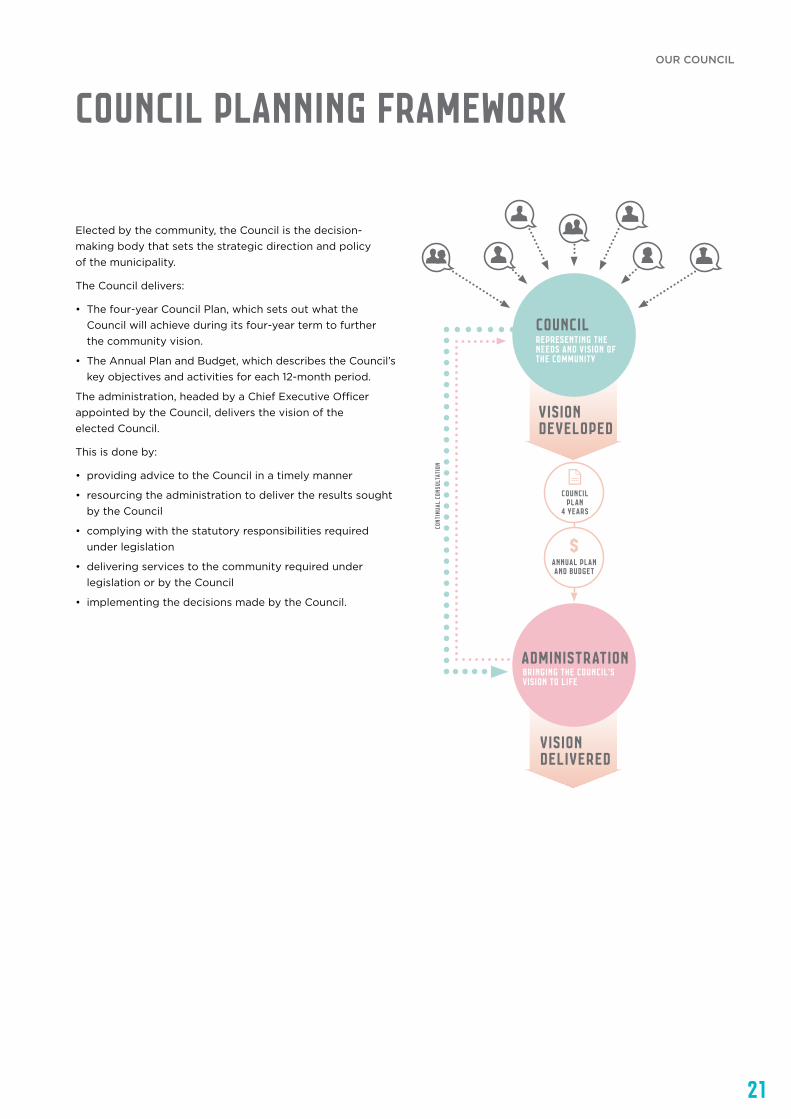
Elected by the community, the Council is the decision-making body that sets the strategic direction and policy of the municipality.
The Council delivers:
• The four-year Council Plan, which sets out what the Council will achieve during its four-year term to further the community vision.
• The Annual Plan and Budget, which describes the Council’s key objectives and activities for each 12-month period.
The administration, headed by a Chief Executive Officer appointed by the Council, delivers the vision of the elected Council.
This is done by:
• providing advice to the Council in a timely manner
• resourcing the administration to deliver the results sought by the Council
• complying with the statutory responsibilities required under legislation
• delivering services to the community required under legislation or by the Council
• implementing the decisions made by the Council.
COUNCIL PLANNING framework
COUNCILREPRESENTING THE NEEDS AND VISION OF THE COMMUNITY
VISION DELIVERED
VISION DEVELOPED
ADMINISTRATIONBRINGING THE COUNCIL’S VISION TO LIFE
ANNUAL PLAN AND BUDGET
CONT
INUA
L CO
NSUL
TATI
ON
COUNCIL PLAN
4 YEARS
OUR COUNCIL

22
HOW TO READ THE FOLLOWING Sections
The following section ‘Performance against our goals’ is divided into eight chapters, reflecting the eight goals that support our vision of being a bold, inspirational and sustainable city, as per the Council Plan 2013–2017.
Each goal chapter describes:
• the outcomes the Council aims to achieve within its four-year term, according to the Council Plan 2013–2017
• how well the Council performed over the last year, as measured by the indicators of progress towards the outcomes in the Council Plan
• the priorities and actions supporting those priorities the Council has implemented to achieve the four-year outcomes it seeks, including whether these actions were completed or are ongoing
• the major initiatives of the Council of the past 12 months (activities of particular importance under each goal, as listed in the Annual Plan and Budget 2014–15).
Goals one to six include a ‘Future Melbourne snapshot’. These provide a picture of how the municipality is tracking as a whole against the goals of the Future Melbourne Community Plan. The Future Melbourne Community Plan is broader than the Council Plan, and sets out what the community and the City of Melbourne together aspire to achieve by 2020.
A city for people
An accessible, transparent
and responsive organisation
Resources are managed well
A Connected City
An Eco-city
A Prosperous city
A Knowledge city
A Creative city
OUR REPORTING FRAMEWORK
Performance against our Goals
24
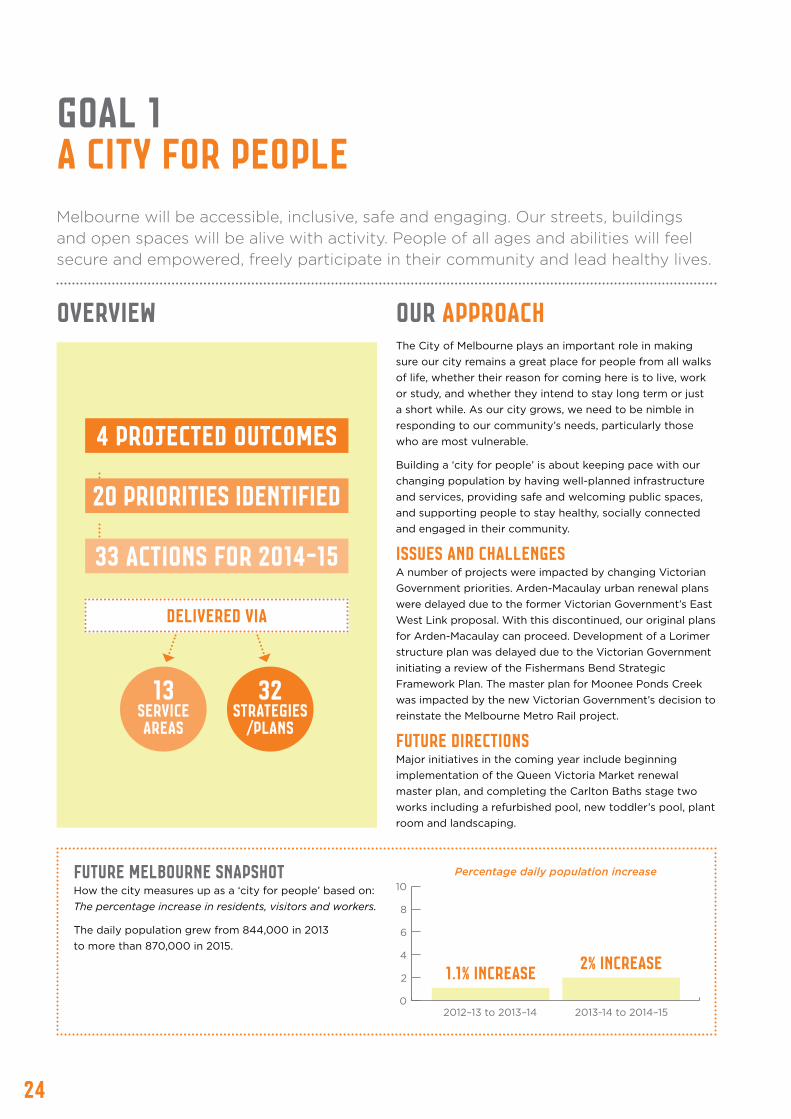
OVERVIEW OUR APPROACHThe City of Melbourne plays an important role in making sure our city remains a great place for people from all walks of life, whether their reason for coming here is to live, work or study, and whether they intend to stay long term or just a short while. As our city grows, we need to be nimble in responding to our community’s needs, particularly those who are most vulnerable.
Building a ‘city for people’ is about keeping pace with our changing population by having well-planned infrastructure and services, providing safe and welcoming public spaces, and supporting people to stay healthy, socially connected and engaged in their community.
issues and challenges A number of projects were impacted by changing Victorian Government priorities. Arden-Macaulay urban renewal plans were delayed due to the former Victorian Government’s East West Link proposal. With this discontinued, our original plans for Arden-Macaulay can proceed. Development of a Lorimer structure plan was delayed due to the Victorian Government initiating a review of the Fishermans Bend Strategic Framework Plan. The master plan for Moonee Ponds Creek was impacted by the new Victorian Government’s decision to reinstate the Melbourne Metro Rail project.
future directionS Major initiatives in the coming year include beginning implementation of the Queen Victoria Market renewal master plan, and completing the Carlton Baths stage two works including a refurbished pool, new toddler’s pool, plant room and landscaping.
Melbourne will be accessible, inclusive, safe and engaging. Our streets, buildings and open spaces will be alive with activity. People of all ages and abilities will feel secure and empowered, freely participate in their community and lead healthy lives.
Future Melbourne snapshot How the city measures up as a ‘city for people’ based on: The percentage increase in residents, visitors and workers.
The daily population grew from 844,000 in 2013 to more than 870,000 in 2015.
GOAL 1a CITY for people
4 PROJECTED OUTCOMES
33 actions for 2014-15
20 priorities identified
delivered via
13serviceareas
32strategies
/PLANS
0
2
4
6
8
10
2012–13 to 2013–14 2013-14 to 2014–15
1.1% increase 2% increase
Percentage daily population increase
25
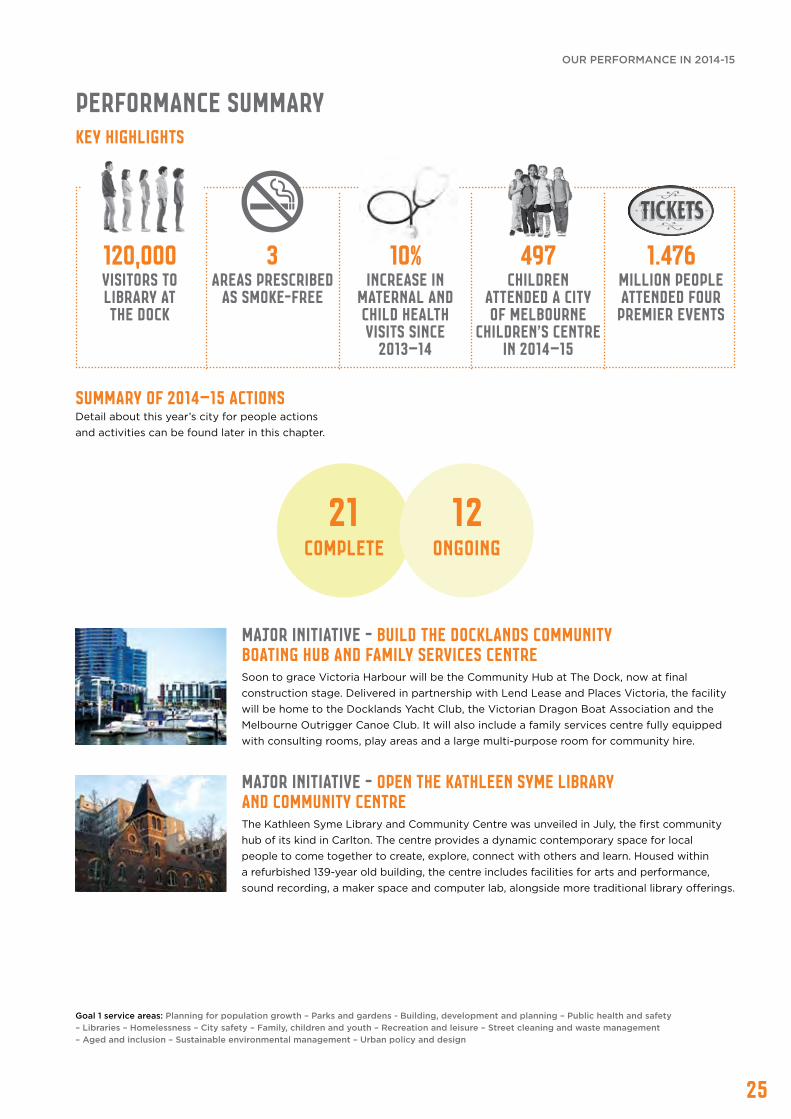
120,000 visitors to Library at the Dock
3areas prescribed
as smoke-free
10%increase IN
maternal and child health visits since
2013–14
497children
attended a City of Melbourne
children’s centre in 2014–15
1.476 million people attended four
premier events
Summary of 2014–15 actions Detail about this year’s city for people actions and activities can be found later in this chapter.
Goal 1 service areas: Planning for population growth – Parks and gardens - Building, development and planning – Public health and safety – Libraries – Homelessness – City safety – Family, children and youth – Recreation and leisure – Street cleaning and waste management – Aged and inclusion – Sustainable environmental management – Urban policy and design
Performance SummaryKEY HIGHLIGHTS
Major initiative - Build the Docklands Community Boating Hub and Family Services CentreSoon to grace Victoria Harbour will be the Community Hub at The Dock, now at final construction stage. Delivered in partnership with Lend Lease and Places Victoria, the facility will be home to the Docklands Yacht Club, the Victorian Dragon Boat Association and the Melbourne Outrigger Canoe Club. It will also include a family services centre fully equipped with consulting rooms, play areas and a large multi-purpose room for community hire.
Major initiative - Open the Kathleen Syme Library and Community CentreThe Kathleen Syme Library and Community Centre was unveiled in July, the first community hub of its kind in Carlton. The centre provides a dynamic contemporary space for local people to come together to create, explore, connect with others and learn. Housed within a refurbished 139-year old building, the centre includes facilities for arts and performance, sound recording, a maker space and computer lab, alongside more traditional library offerings.
12ongoing
21complete
OUR PERFORMANCE IN 2014-15
26
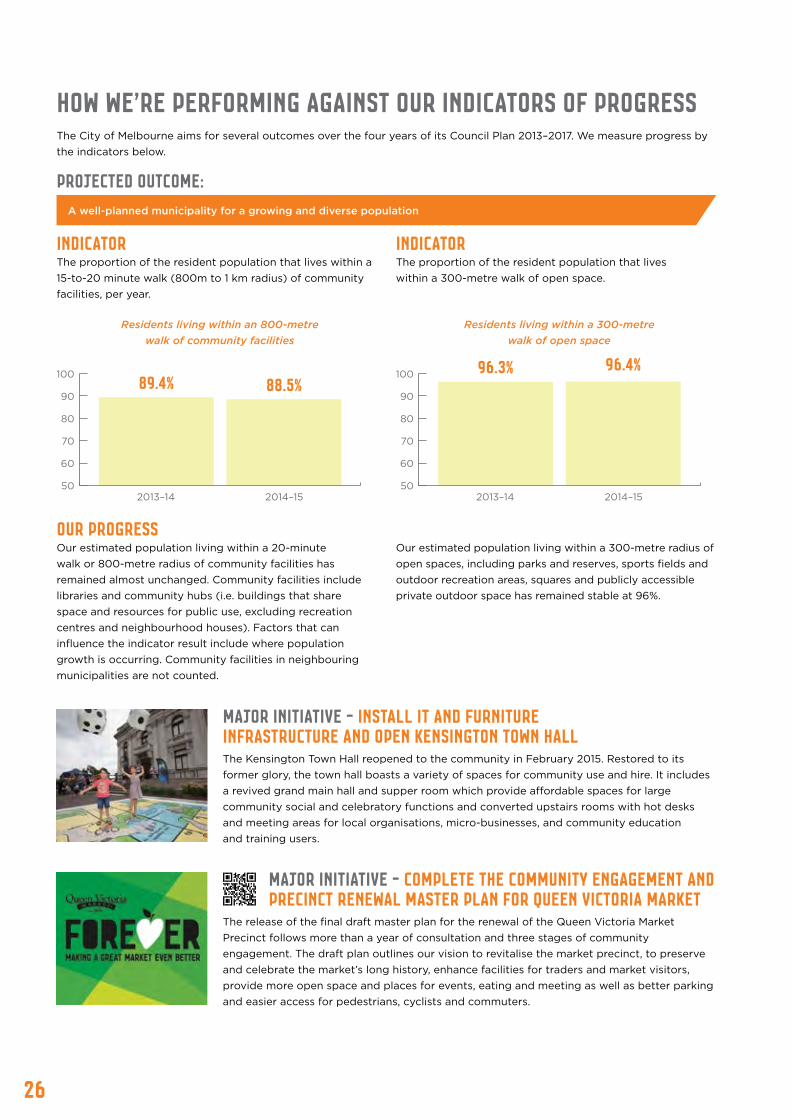
How we’re performing against our indicators of progressThe City of Melbourne aims for several outcomes over the four years of its Council Plan 2013–2017. We measure progress by the indicators below.
projected OUTCOME:
Our Progress Our estimated population living within a 20-minute walk or 800-metre radius of community facilities has remained almost unchanged. Community facilities include libraries and community hubs (i.e. buildings that share space and resources for public use, excluding recreation centres and neighbourhood houses). Factors that can influence the indicator result include where population growth is occurring. Community facilities in neighbouring municipalities are not counted.
Our estimated population living within a 300-metre radius of open spaces, including parks and reserves, sports fields and outdoor recreation areas, squares and publicly accessible private outdoor space has remained stable at 96%.
INDICATOR The proportion of the resident population that lives within a 15-to-20 minute walk (800m to 1 km radius) of community facilities, per year.
INDICATOR The proportion of the resident population that lives within a 300-metre walk of open space.
A well-planned municipality for a growing and diverse population
Major initiative - Install IT and furniture infrastructure and open Kensington Town HallThe Kensington Town Hall reopened to the community in February 2015. Restored to its former glory, the town hall boasts a variety of spaces for community use and hire. It includes a revived grand main hall and supper room which provide affordable spaces for large community social and celebratory functions and converted upstairs rooms with hot desks and meeting areas for local organisations, micro-businesses, and community education and training users.
Major initiative - Complete the community engagement and Precinct Renewal Master Plan for Queen Victoria Market
The release of the final draft master plan for the renewal of the Queen Victoria Market Precinct follows more than a year of consultation and three stages of community engagement. The draft plan outlines our vision to revitalise the market precinct, to preserve and celebrate the market’s long history, enhance facilities for traders and market visitors, provide more open space and places for events, eating and meeting as well as better parking and easier access for pedestrians, cyclists and commuters.
89.4% 88.5%
Residents living within an 800-metre walk of community facilities
2013–14 2014–1550
60
70
80
90
100
2013–14 2014–15
96.3% 96.4%
Residents living within a 300-metre walk of open space
50
60
70
80
90
100

27
projected OUTCOME:
INDICATOR The proportion of people using selected City of Melbourne services who reported the information they received from those services helps them to lead a healthier lifestyle.
INDICATOR The proportion of people using selected City of Melbourne services who reported the support they received from those services helps them to lead a healthier lifestyle.
Our Progress Of customers surveyed who used our services (including immunisation, maternal and child health services, parent support, Healthy Ageing community events, child care services, recreation and leisure centres) 87% reported the
information they received helped them lead a healthier lifestyle, and nearly 92% reported the support they received helped them lead a healthier lifestyle. The difference between last year and this year’s survey results is not material.
People who are informed and supported to be healthy
Major initiative - Implement up to six opportunities for smoke-free public spaces for consideration
An overwhelming 85 per cent of individuals and businesses voiced their support for banning smoking in Howey Place, Equitable Place and Block Place as part of extensive consultations held over several months involving meetings with local businesses and surveys with shoppers and visitors. These three areas now join The Causeway in becoming permanent outdoor smoke-free laneways. A two-month community engagement period began in May 2015 on the proposal to make City Square, the popular shopping precinct QV Melbourne and Goldsbrough Lane smoke-free areas.
Major initiative - Deliver phase one of the work related to sporting and park facilities in the Council’s Memorandum of Understanding with the Linking Melbourne Authority to reduce the impact from the proposeD East West Link.To mitigate the impact of the East West Link proposed by the Victorian Government at the time, the City of Melbourne and Linking Melbourne Authority agreed in 2013 to upgrade sporting facilities at Flemington Road Oval in Royal Park and Princes Park. While the East West Link was discontinued by the new government, the sporting facilities upgrade has gone ahead to cater for anticipated community recreational needs. A reconstructed playing field has reopened at the Flemington Road Oval and a new pavilion and sports lighting will be added to enable year-round use. The Princes Park sports area reopened for winter and now has seven soccer fields and four cricket pitches with sports lighting.
2013–14 2014–15
88.6% 87%
Customers reporting the information they received from us helped them lead a healthier lifestyle
80
85
90
95
100
90
92
94
96
98
100
2013–14 2014–15
95.1%
91.9%
Customers reporting the support they received from us helped them lead a healthier lifestyle
OUR PERFORMANCE IN 2014-15

28
projected OUTCOME:
INDICATOR The proportion of service users who feel more a part of their community through participation in selected City of Melbourne programs per year.
Our Progress Customers surveyed who participated in our programs (including Healthy Ageing community events, child care services, recreation and leisure centres, student programs and parent support) and reported they felt more a part of their community remained fairly stable at 89%.
People who participate and feel connected
Major initiative - Complete the Neil Street and Return to Royal Park projects and progress the Eastwood/Rankins, Hawke/Adderley and University Square Precinct projects as part of the Open Space Strategy implementationThe unveiling in March of reinstated parkland on the site of the former Royal Children’s Hospital marked a new lease of life for Royal Park, Melbourne’s largest inner-city park. Complementing the surrounding native Australian landscape is a new children’s nature-based play area, with indigenous-themed plant and park structures representing the seven Wurundjeri seasons. Other major work on open space this year has included facility and landscape upgrades at the Neil Street Reserve in Carlton, proposed improvements to the Eastwood/Rankins, Hawke/Adderley precincts and planning for a reimagined University Square in Carlton.
ANZAC DAY 100 year commemorationThe City of Melbourne sponsored the 100 year commemoration of ANZAC Day this year. Teams worked closely with the Returned and Services League on the event, which featured special programming including the March of the Medals, with the War Widows Guild leading the procession. More than 85,000 people attended the traditional Dawn Service.
Victorian Seniors Festival - Flash mobAlmost 60 older people from across Melbourne helped launch the Victorian Seniors Festival with a dazzling flash mob at Federation Square. Participants were full of praise for the flash mob, initiated by the Ageing and Inclusion team and Recreation Services. In the words of one participant “it provided interaction with others and was great exercise”.
Seedlings program sprouts award winsChildren from five local government children’s centres including Melbourne City Child Care and North Melbourne and Hotham Hub Children’s Centres took part in Seedlings, a pilot program encouraging children and their families to live more sustainably. All three City of Melbourne participating centres received multiple awards.
80
85
90
95
100
2013–14 2014–15
90.7% 89.1%
Customers who feel more a part of their community through participating in our programs
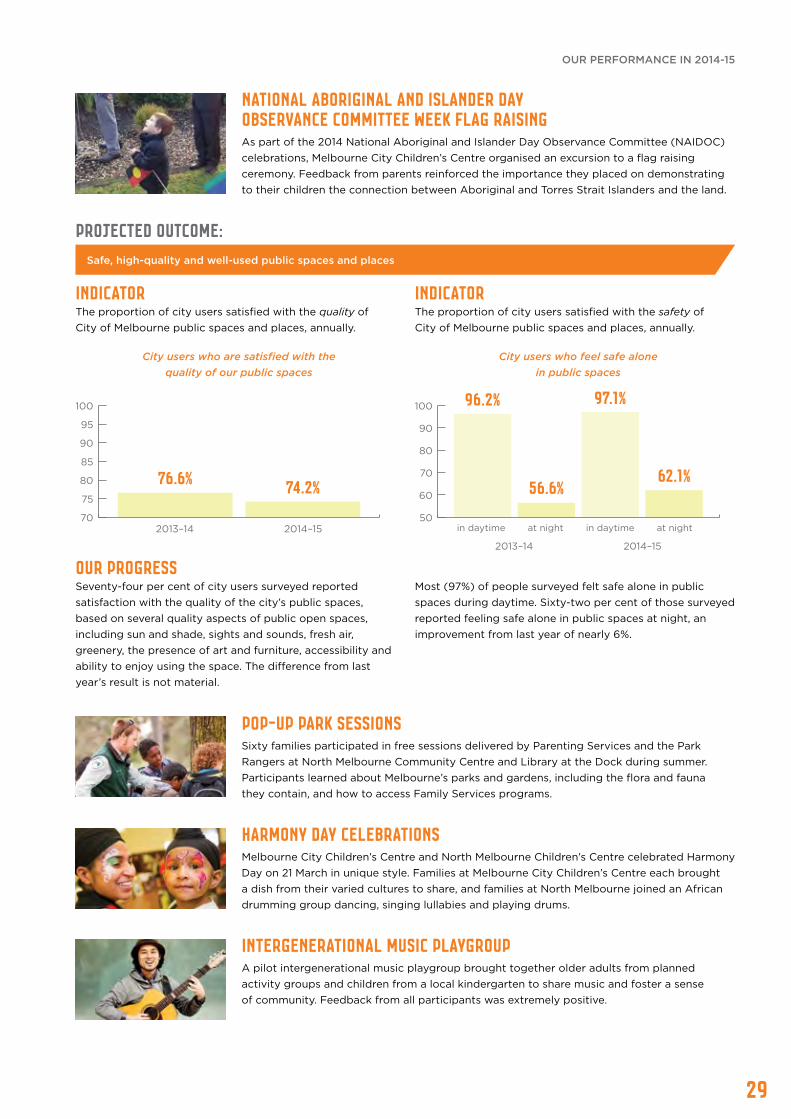
29
projected OUTCOME:Safe, high-quality and well-used public spaces and places
Our Progress Seventy-four per cent of city users surveyed reported satisfaction with the quality of the city’s public spaces, based on several quality aspects of public open spaces, including sun and shade, sights and sounds, fresh air, greenery, the presence of art and furniture, accessibility and ability to enjoy using the space. The difference from last year’s result is not material.
Most (97%) of people surveyed felt safe alone in public spaces during daytime. Sixty-two per cent of those surveyed reported feeling safe alone in public spaces at night, an improvement from last year of nearly 6%.
INDICATOR The proportion of city users satisfied with the quality of City of Melbourne public spaces and places, annually.
INDICATOR The proportion of city users satisfied with the safety of City of Melbourne public spaces and places, annually.
National Aboriginal and Islander Day Observance Committee Week flag raisingAs part of the 2014 National Aboriginal and Islander Day Observance Committee (NAIDOC) celebrations, Melbourne City Children’s Centre organised an excursion to a flag raising ceremony. Feedback from parents reinforced the importance they placed on demonstrating to their children the connection between Aboriginal and Torres Strait Islanders and the land.
Pop-up park sessions
Sixty families participated in free sessions delivered by Parenting Services and the Park Rangers at North Melbourne Community Centre and Library at the Dock during summer. Participants learned about Melbourne’s parks and gardens, including the flora and fauna they contain, and how to access Family Services programs.
Harmony Day celebrationsMelbourne City Children’s Centre and North Melbourne Children’s Centre celebrated Harmony Day on 21 March in unique style. Families at Melbourne City Children’s Centre each brought a dish from their varied cultures to share, and families at North Melbourne joined an African drumming group dancing, singing lullabies and playing drums.
Intergenerational music playgroupA pilot intergenerational music playgroup brought together older adults from planned activity groups and children from a local kindergarten to share music and foster a sense of community. Feedback from all participants was extremely positive.
70
75
80
85
90
95
100
2013–14 2014–15
76.6% 74.2%
City users who are satisfied with the quality of our public spaces
2013–14 2014–15
96.2%
56.6%62.1%
97.1%
City users who feel safe alonein public spaces
in daytime at night in daytime at night50
60
70
80
90
100
OUR PERFORMANCE IN 2014-15
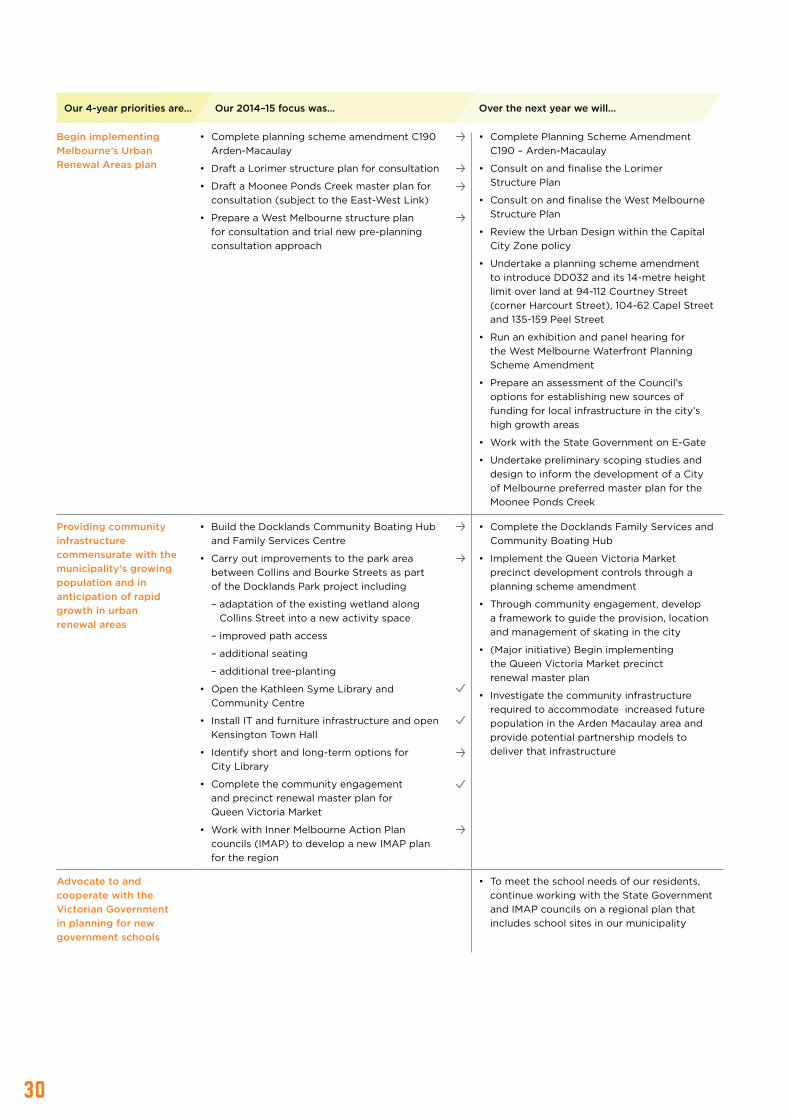
30
Begin implementing Melbourne’s Urban Renewal Areas plan
• Complete planning scheme amendment C190 Arden-Macaulay
• Draft a Lorimer structure plan for consultation
• Draft a Moonee Ponds Creek master plan for consultation (subject to the East-West Link)
• Prepare a West Melbourne structure plan for consultation and trial new pre-planning consultation approach
• Complete Planning Scheme Amendment C190 – Arden-Macaulay
• Consult on and finalise the Lorimer Structure Plan
• Consult on and finalise the West Melbourne Structure Plan
• Review the Urban Design within the Capital City Zone policy
• Undertake a planning scheme amendment to introduce DD032 and its 14-metre height limit over land at 94-112 Courtney Street (corner Harcourt Street), 104-62 Capel Street and 135-159 Peel Street
• Run an exhibition and panel hearing for the West Melbourne Waterfront Planning Scheme Amendment
• Prepare an assessment of the Council’s options for establishing new sources of funding for local infrastructure in the city’s high growth areas
• Work with the State Government on E-Gate
• Undertake preliminary scoping studies and design to inform the development of a City of Melbourne preferred master plan for the Moonee Ponds Creek
Providing community infrastructure commensurate with the municipality’s growing population and in anticipation of rapid growth in urban renewal areas
• Build the Docklands Community Boating Hub and Family Services Centre
• Carry out improvements to the park area between Collins and Bourke Streets as part of the Docklands Park project including
– adaptation of the existing wetland along Collins Street into a new activity space
– improved path access
– additional seating
– additional tree-planting
• Open the Kathleen Syme Library and Community Centre
• Install IT and furniture infrastructure and open Kensington Town Hall
• Identify short and long-term options for City Library
• Complete the community engagement and precinct renewal master plan for Queen Victoria Market
• Work with Inner Melbourne Action Plan councils (IMAP) to develop a new IMAP plan for the region
• Complete the Docklands Family Services and Community Boating Hub
• Implement the Queen Victoria Market precinct development controls through a planning scheme amendment
• Through community engagement, develop a framework to guide the provision, location and management of skating in the city
• (Major initiative) Begin implementing the Queen Victoria Market precinct renewal master plan
• Investigate the community infrastructure required to accommodate increased future population in the Arden Macaulay area and provide potential partnership models to deliver that infrastructure
Advocate to and cooperate with the Victorian Government in planning for new government schools
• To meet the school needs of our residents, continue working with the State Government and IMAP councils on a regional plan that includes school sites in our municipality
Our 4-year priorities are... Our 2014–15 focus was… Over the next year we will...

31
Facilitate private and public development of a diverse and more affordable housing stock to accommodate population growth
• Work with the Office of the Victorian Government Architect to develop the Victorian Apartment Design Standards, as part of our Housing Strategy implementation
• Continue to work with the Department of Environment Land Water and Planning to develop the Victorian Apartment Design Standards, as part of our Housing Strategy implementation
• Review the City of Melbourne Housing Strategy as it relates to affordable housing issues, following the release of the Australian Government’s Reform of the Federation White Paper
Protect the community from passive smoking by expanding smoke free areas
• Implement up to six opportunities for smoke-free public spaces for consideration
• Work with the State Government towards a ban on smoking in outdoor dining areas and, if appropriate, continue to implement smoke-free areas
Develop an electronic gaming machine policy for the municipality
• Review Melbourne Planning Scheme clause 22.12 (gaming premises) in light of the continued Capital City Zone expansion
Increase community participation in physical activity through our sport and recreation services
• Deliver phase one of the work related to sporting and park facilities in the Council’s Memorandum of Understanding with the Linking Melbourne Authority to reduce the impact from the proposed East-West Link
• Complete Carlton Baths stage two design and tender phase for new filtration plant, toddler pool and landscaping
• Develop a plan to provide more outdoor gym equipment and promote its use to the community
• Develop and deliver physical recreation programs and services targeting underrepresented groups and those with low physical activity, including by carrying out a gender equity audit of selected Council facilities
• Complete the committed Princes Park master plan works and Royal Park works and develop a revised strategy of use of those sporting facilities
• Audit a range of community and recreation facilities for gender equity
• Draft an Active Melbourne Strategy 2016-21
• Review, investigate and test opportunities with elite sporting organisations to provide measurable and achievable community recreation and health and well -being programs
• (Major initiative) Complete Carlton Baths Stage 2: a refurbished swimming pool, new toddlers pool, plant room and landscaping
Support the community to access nutritious and sustainable food through our Food Policy
• Build knowledge and skills to improve food security for all people in the municipality, as part of our Food Policy implementation
• Initiate and support food-related activities that strengthen social connections and access to nutritious, sustainable food
Address gender and equity issues in all new Council strategies and plans
• Improve access to interpreting and translation services to people who need support to access information about Council services and strategies
Strengthen partnerships to prevent crime and improve community safety
• Advocate to the State Government for better late night (after 1am) and early morning transport options in the central city
• Continue to improve the Safe City Cameras Program network
• Implement Year 2 actions from the Beyond the Safe City Strategy 2014–2017
Apply crime-prevention-through-environmental-design principles to increase safety in public spaces
• Implement crime-prevention-through-environmental-design improvements at Enterprize Park, King Street, Swanston Street, Flinders Street and North Melbourne, as per last year’s audit
• Consider the need to improve lighting in the Arden Street precinct, including the area used by The Huddle youth project
• Work supporting this priority is included in our regular business for the year
Our 4-year priorities are... Our 2014–15 focus was… Over the next year we will...
OUR PERFORMANCE IN 2014-15

32
Support the prevention of violence against society’s most vulnerable people with a focus on women and children
• Identify safe, welcoming and inclusive spaces and service sites in the municipality for women and children experiencing or at risk of violence
• Work supporting this priority is included in our regular business for the year
Provide programs and events for people to participate in community activities and civic life and connect with each other
• Investigate opportunities for involving local schools in civic events such as citizenship ceremonies
• Provide two opportunities for school choirs from the municipality to perform during citizenship ceremonies
Celebrate cultural and language diversity through a range of cultural activities
• Develop the Indigenous Heritage Action Plan 2015–2018
• Develop and implement the Reconciliation Action Plan 2014–17
• Review the Refugee Welcome Zone Declaration and recommit to activities that fall within local government’s responsibility
• Renew the City of Melbourne Multicultural Policy or draft a Cultural Diversity Statement containing an acknowledgment and recognition of the contribution refugees and asylum seekers make
• Facilitate and host activities for NAIDOC Week, Reconciliation Week and a range of cultural diversity events
Provide youth, aged and family-focused services for a growing community
• Identify and pilot opportunities for people of different ages and abilities to exchange skills and develop connections
• Implement African Australian community strategic partnerships to progress the Community Employment and Empowering Women Initiatives
Facilitate the sufficient availability of quality child care services in local areas and plan for future demand
• Implement the supply and demand plan for child care
• Building on studies and feasibility work done to date, indicate how and where the City of Melbourne will increase numbers of child care places in neighbourhoods (including the QVM precinct) to meet future demand
Support the social and economic development of Aboriginal and Torres Strait Islander people
• Implement 2015-18 Reconciliation Action Plan Year 1 actions including a partnership with the Jawun Indigenous Corporate Partnership and establishment of a City of Melbourne reconciliation forum
Contribute to developing sustainable pathways out of homelessness
• Work with the homelessness sector to develop a register of rough sleepers in the central city
• Identify how we can support housing initiatives in the central city for young people and adult target groups including: 1) short-term accommodation; 2) housing-first / supportive housing; 3) women-specific housing
• Implement Year 2 actions from the Homelessness Strategy 2014–2017
Our 4-year priorities are... Our 2014–15 focus was… Over the next year we will...
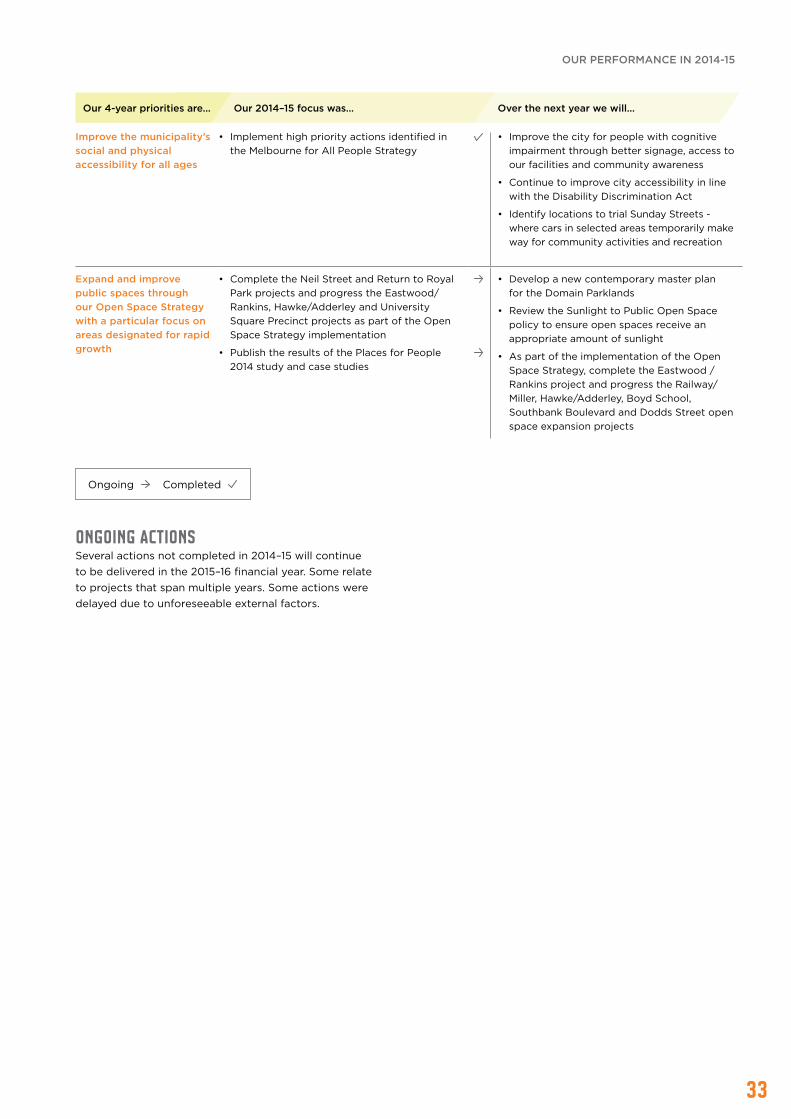
33
ONGOING ACTIONS Several actions not completed in 2014–15 will continue to be delivered in the 2015–16 financial year. Some relate to projects that span multiple years. Some actions were delayed due to unforeseeable external factors.
Ongoing Completed
Improve the municipality’s social and physical accessibility for all ages
• Implement high priority actions identified in the Melbourne for All People Strategy
• Improve the city for people with cognitive impairment through better signage, access to our facilities and community awareness
• Continue to improve city accessibility in line with the Disability Discrimination Act
• Identify locations to trial Sunday Streets - where cars in selected areas temporarily make way for community activities and recreation
Expand and improve public spaces through our Open Space Strategy with a particular focus on areas designated for rapid growth
• Complete the Neil Street and Return to Royal Park projects and progress the Eastwood/Rankins, Hawke/Adderley and University Square Precinct projects as part of the Open Space Strategy implementation
• Publish the results of the Places for People 2014 study and case studies
• Develop a new contemporary master plan for the Domain Parklands
• Review the Sunlight to Public Open Space policy to ensure open spaces receive an appropriate amount of sunlight
• As part of the implementation of the Open Space Strategy, complete the Eastwood / Rankins project and progress the Railway/Miller, Hawke/Adderley, Boyd School, Southbank Boulevard and Dodds Street open space expansion projects
Our 4-year priorities are... Our 2014–15 focus was… Over the next year we will...
OUR PERFORMANCE IN 2014-15
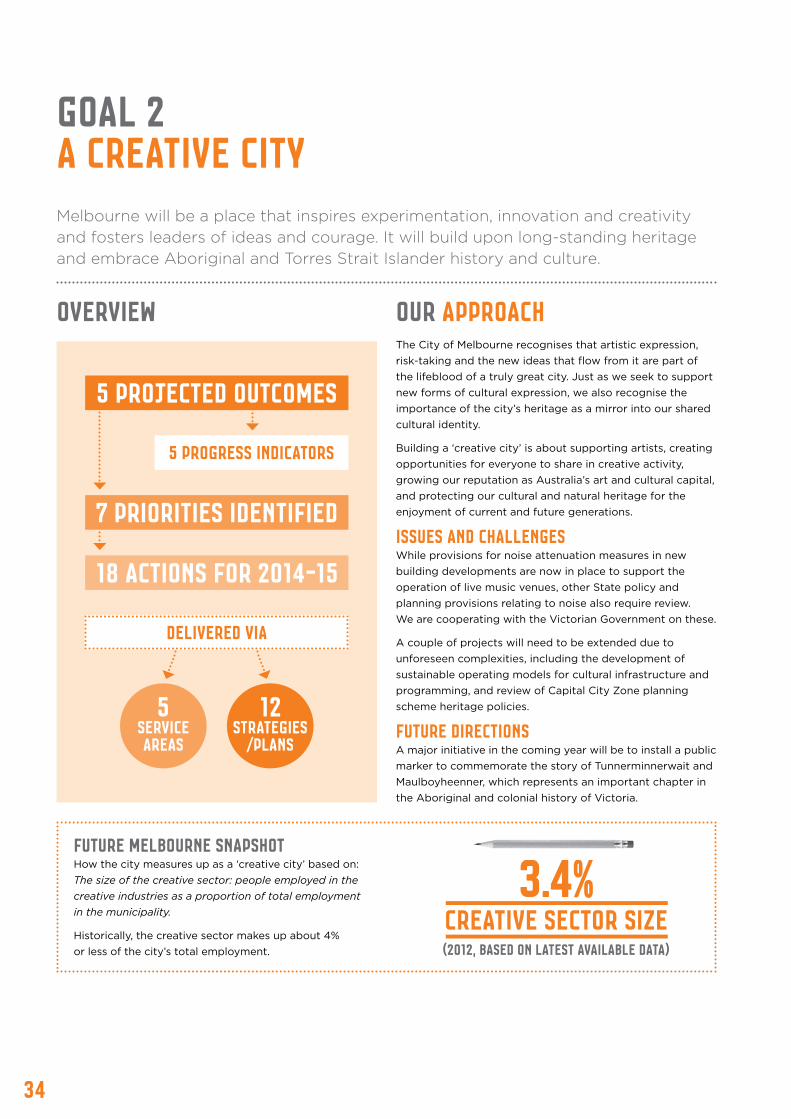
34
OVERVIEW OUR APPROACHThe City of Melbourne recognises that artistic expression, risk-taking and the new ideas that flow from it are part of the lifeblood of a truly great city. Just as we seek to support new forms of cultural expression, we also recognise the importance of the city’s heritage as a mirror into our shared cultural identity.
Building a ‘creative city’ is about supporting artists, creating opportunities for everyone to share in creative activity, growing our reputation as Australia’s art and cultural capital, and protecting our cultural and natural heritage for the enjoyment of current and future generations.
issues and challenges While provisions for noise attenuation measures in new building developments are now in place to support the operation of live music venues, other State policy and planning provisions relating to noise also require review. We are cooperating with the Victorian Government on these.
A couple of projects will need to be extended due to unforeseen complexities, including the development of sustainable operating models for cultural infrastructure and programming, and review of Capital City Zone planning scheme heritage policies.
future directionS A major initiative in the coming year will be to install a public marker to commemorate the story of Tunnerminnerwait and Maulboyheenner, which represents an important chapter in the Aboriginal and colonial history of Victoria.
Melbourne will be a place that inspires experimentation, innovation and creativity and fosters leaders of ideas and courage. It will build upon long-standing heritage and embrace Aboriginal and Torres Strait Islander history and culture.
Future Melbourne snapshot How the city measures up as a ‘creative city’ based on: The size of the creative sector: people employed in the creative industries as a proportion of total employment in the municipality.
Historically, the creative sector makes up about 4% or less of the city’s total employment.
GOAL 2a Creative city
5 PROJECTED OUTCOMES
18 actions for 2014-15
7 priorities identified
delivered via
5serviceareas
12strategies
/PLANS
5 progress indicators
(2012, based on latest available data)
3.4%creative sector size
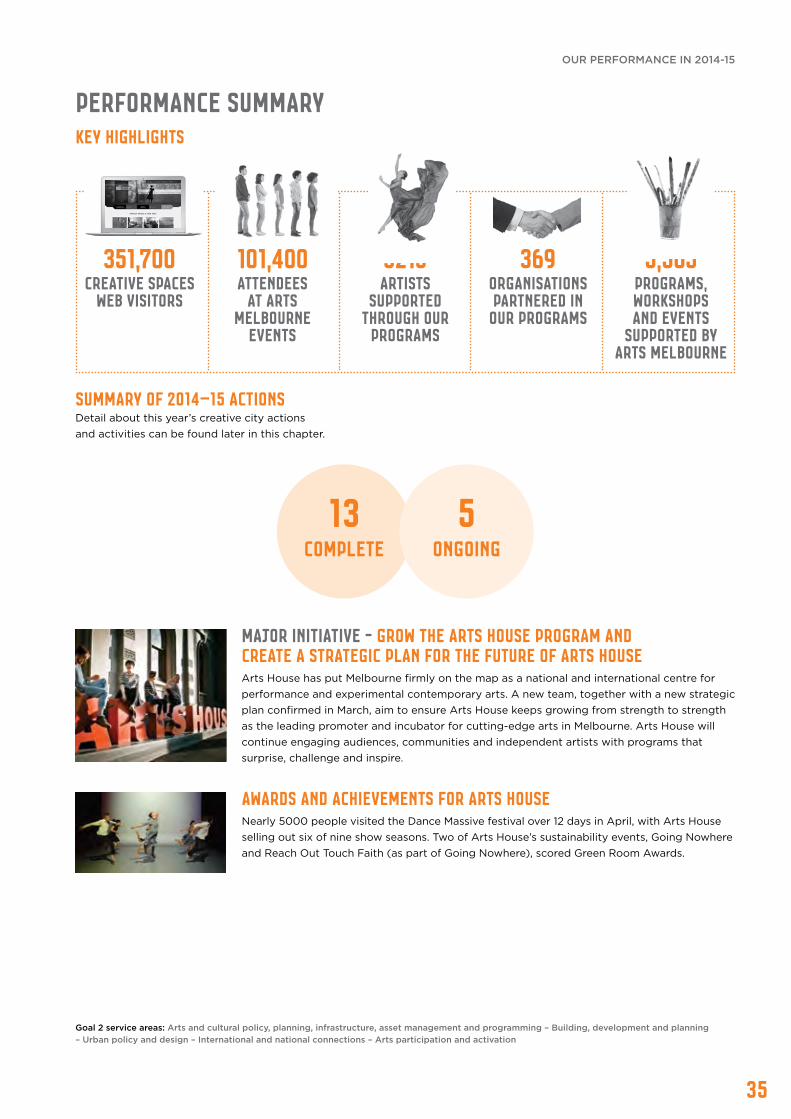
35
351,700Creative Spaces
web visitors
101,400 attendees
at Arts Melbourne
events
3213 artists
supported through our
programs
369organisations partnered in
our programs
5,565programs, workshops and events
supported by Arts Melbourne
Performance SummaryKEY HIGHLIGHTS
Summary of 2014–15 actions Detail about this year’s creative city actions and activities can be found later in this chapter.
Goal 2 service areas: Arts and cultural policy, planning, infrastructure, asset management and programming – Building, development and planning – Urban policy and design – International and national connections – Arts participation and activation
Major initiative - Grow the Arts House program and create a strategic plan for the future of Arts HouseArts House has put Melbourne firmly on the map as a national and international centre for performance and experimental contemporary arts. A new team, together with a new strategic plan confirmed in March, aim to ensure Arts House keeps growing from strength to strength as the leading promoter and incubator for cutting-edge arts in Melbourne. Arts House will continue engaging audiences, communities and independent artists with programs that surprise, challenge and inspire.
Awards and achievements for Arts HouseNearly 5000 people visited the Dance Massive festival over 12 days in April, with Arts House selling out six of nine show seasons. Two of Arts House’s sustainability events, Going Nowhere and Reach Out Touch Faith (as part of Going Nowhere), scored Green Room Awards.
5ongoing
13complete
OUR PERFORMANCE IN 2014-15
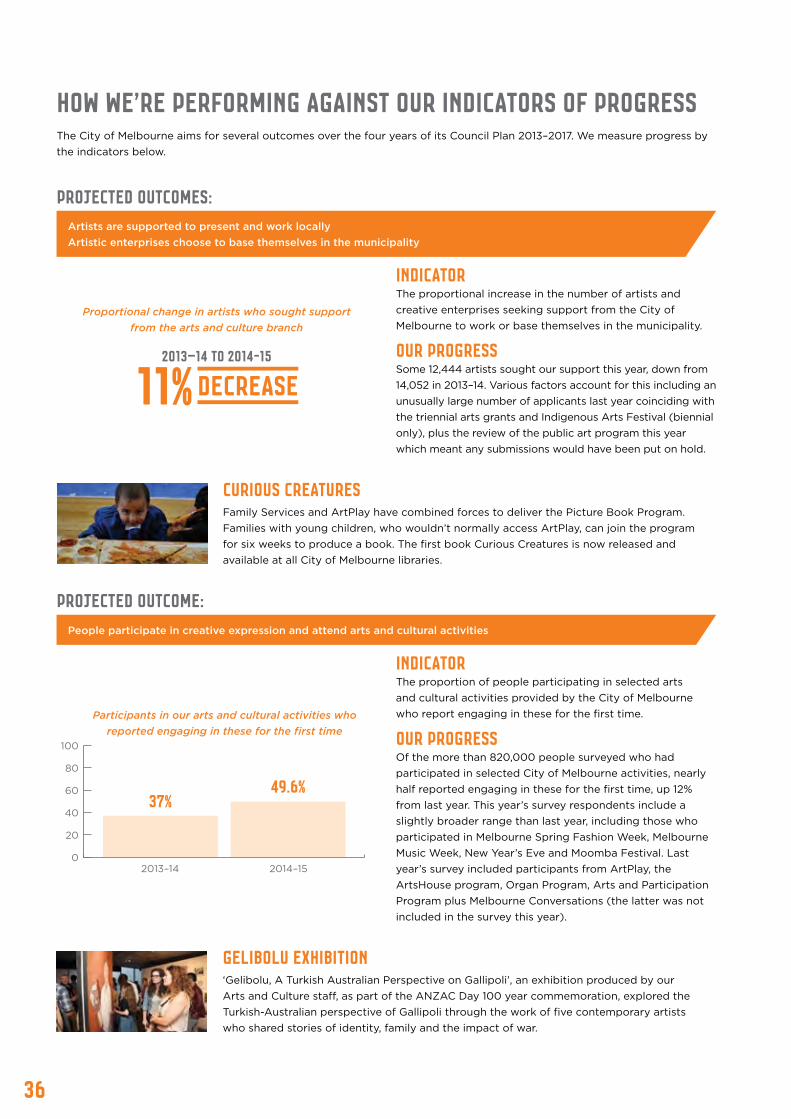
36
How we’re performing against our indicators of progressThe City of Melbourne aims for several outcomes over the four years of its Council Plan 2013–2017. We measure progress by the indicators below.
projected OUTCOMES:
projected OUTCOME:
INDICATOR The proportional increase in the number of artists and creative enterprises seeking support from the City of Melbourne to work or base themselves in the municipality.
Our Progress Some 12,444 artists sought our support this year, down from 14,052 in 2013–14. Various factors account for this including an unusually large number of applicants last year coinciding with the triennial arts grants and Indigenous Arts Festival (biennial only), plus the review of the public art program this year which meant any submissions would have been put on hold.
Indicator The proportion of people participating in selected arts and cultural activities provided by the City of Melbourne who report engaging in these for the first time.
Our Progress Of the more than 820,000 people surveyed who had participated in selected City of Melbourne activities, nearly half reported engaging in these for the first time, up 12% from last year. This year’s survey respondents include a slightly broader range than last year, including those who participated in Melbourne Spring Fashion Week, Melbourne Music Week, New Year’s Eve and Moomba Festival. Last year’s survey included participants from ArtPlay, the ArtsHouse program, Organ Program, Arts and Participation Program plus Melbourne Conversations (the latter was not included in the survey this year).
People participate in creative expression and attend arts and cultural activities
Artists are supported to present and work locally Artistic enterprises choose to base themselves in the municipality
Curious CreaturesFamily Services and ArtPlay have combined forces to deliver the Picture Book Program. Families with young children, who wouldn’t normally access ArtPlay, can join the program for six weeks to produce a book. The first book Curious Creatures is now released and available at all City of Melbourne libraries.
Gelibolu exhibition‘Gelibolu, A Turkish Australian Perspective on Gallipoli’, an exhibition produced by our Arts and Culture staff, as part of the ANZAC Day 100 year commemoration, explored the Turkish-Australian perspective of Gallipoli through the work of five contemporary artists who shared stories of identity, family and the impact of war.
2013–14 2014–15
37%49.6%
Participants in our arts and cultural activities who reported engaging in these for the first time
0
20
40
60
80
100
11%DECREASE2013–14 to 2014-15
Proportional change in artists who sought support from the arts and culture branch

37
projected OUTCOME:
projected OUTCOME:
INDICATOR The proportion of survey respondents who agree Melbourne is an artistic and cultural city.
Our Progress Ninety-one per cent of residents, workers, visitors and students surveyed agree the City of Melbourne is an artistic and cultural city.
A growing reputation as the centre for vibrant artistic and cultural life
The municipality’s cultural and natural heritage is protected for the appreciation of future generations
Our Progress No new trees were added to the Exceptional Tree Register as the necessary planning scheme amendments were delayed by the ministerial process and budgetary constraints. In the meantime, some trees were removed from the register due to their compromised condition.
Our Progress With 87 more properties added to the Heritage Register from 2012–13 to 2013–14, no further properties were added this year. While the Council adopted two heritage amendments including Amendments C198 and C215, these are awaiting approval by the Minister for Planning.
INDICATOR The percentage increase in the number of exceptional trees in the Exceptional Tree Register.
INDICATOR The percentage increase in the number of buildings and places with statutory heritage protection.
Partnership with Arts Access
The City of Melbourne partnered with Arts Access and the University of Melbourne to deliver a symposium entitled Beyond Access at the Melbourne Brain Centre. Discussions focused around research undertaken investigating the creative case for inclusion of artists with disabilities. Chair of Arts Access Victoria, Margherita Coppolino delivered a strong message advocating inclusion.
Open House MelbourneTwelve Melbourne organists each gave a 30-minute mini-recital as part of Open House Melbourne 2014. Performers played everything from JS Bach to football theme songs to the Pirates of the Caribbean score over two days. The total audience over the weekend was an impressive 9364. Staff and guest curators conducted 34 tours of the Arts and Heritage Collection in Little Bourke Street.
2013–14 2014–15
93.4% 91.4%
People who agree Melbourne is an artistic and cultural city
75
80
85
90
95
100
-4-3-2-101234
2012–13 to 2013–14 2013–14 to 2014–15
3.4% decrease
0.58% decrease
Percentage change in number of exceptional trees in Exceptional Tree Register
0
1
2
3
4
5
2013–14 2014–15
1.2% increase0% increase
Percentage change in number of protected heritage buildings and places
OUR PERFORMANCE IN 2014-15

38
Develop sustainable cultural physical infrastructure and programming
• Review and develop sustainable operating models for our current and future cultural infrastructure and programming
• Develop a cultural infrastructure framework related to the Community Infrastructure Framework to include the:
– Potential conversion of 602 Little Bourke Street into a mixed-use creative space
– Feasibility of an international live/work artists’ facility
• Develop a Cultural Infrastructure Framework that maps existing cultural infrastructure and recommends future strategies for growth, including funding and partnership models
Increase access to and participation in creative expression and arts and cultural experiences, including music
• Upon adoption of the Arts Strategy, identify and implement 2014-15 components
• Evaluate and review the 2014 Melbourne Indigenous Arts Festival and provide recommendations to the Council regarding its future
• Implement the renewed City of Melbourne Music Strategy and continue to support the Music Strategy Advisory Committee
• Participate in the Victorian Government’s review of noise controls and live music State Planning Policy
• Explore the Yarra Trams proposal for an arts line
• Deliver the first of the Melbourne- designed pavilions as part of the Melbourne Pavilions Program
• Run a music symposium comprising local, national and international representatives, as identified in the Melbourne Music Strategy
• Continue to work with stakeholders to implement the Yarra Trams proposal for an Arts Line
• Coordinate the installation and removal of the second Melbourne Pavilion in Queen Victoria Gardens as part of a four year program
Strengthen national and international artistic and cultural connections
• Partner with the State Government in the establishment of a City of Literature role
• Develop and run the Biennial Dance Massive Festival
• Deliver the biennial Going Nowhere international sustainable arts festival
• Deliver the Biennial Festival of Live Art
Support emerging artists • Grow the Arts House Program and create a strategic plan for the future of Arts House
• Implement the Arts House Strategic Plan
Contribute to artistic, cultural and heritage outcomes for the Aboriginal and Torres Strait Islander people
• Implement the Indigenous Heritage Action Plan 2012–2015 priorities including:
– implement the final stages of the process to publicly mark and acknowledge the events related to the Tunnerminnerwait and Maulboyheenner story and its connection to the history of Melbourne
– develop a GIS mapping tool that could support the further development of self-guided tours and/or a walking trail to celebrate Aboriginal culture in the municipality
• In collaboration with key partners, develop the content for the 2017 Melbourne Indigenous Arts Festival
Our 4-year priorities are... Our 2014–15 focus was… Over the next year we will...
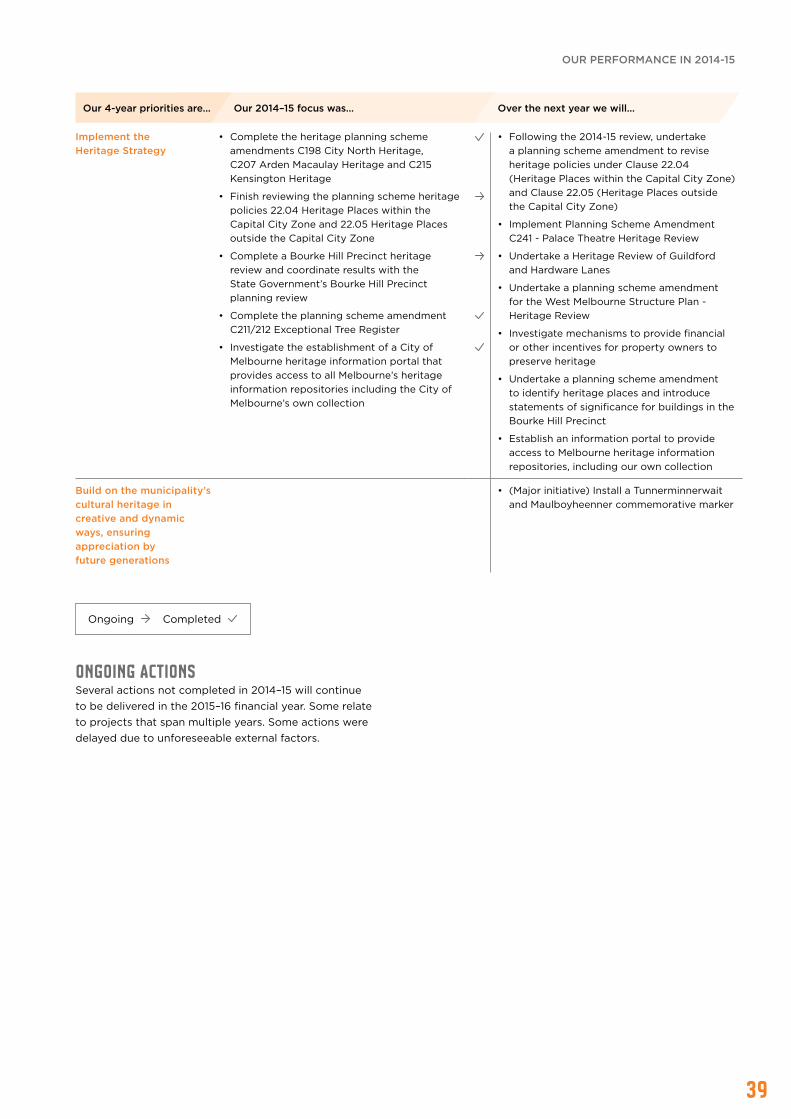
39
Implement the Heritage Strategy
• Complete the heritage planning scheme amendments C198 City North Heritage, C207 Arden Macaulay Heritage and C215 Kensington Heritage
• Finish reviewing the planning scheme heritage policies 22.04 Heritage Places within the Capital City Zone and 22.05 Heritage Places outside the Capital City Zone
• Complete a Bourke Hill Precinct heritage review and coordinate results with the State Government’s Bourke Hill Precinct planning review
• Complete the planning scheme amendment C211/212 Exceptional Tree Register
• Investigate the establishment of a City of Melbourne heritage information portal that provides access to all Melbourne’s heritage information repositories including the City of Melbourne’s own collection
• Following the 2014-15 review, undertake a planning scheme amendment to revise heritage policies under Clause 22.04 (Heritage Places within the Capital City Zone) and Clause 22.05 (Heritage Places outside the Capital City Zone)
• Implement Planning Scheme Amendment C241 - Palace Theatre Heritage Review
• Undertake a Heritage Review of Guildford and Hardware Lanes
• Undertake a planning scheme amendment for the West Melbourne Structure Plan - Heritage Review
• Investigate mechanisms to provide financial or other incentives for property owners to preserve heritage
• Undertake a planning scheme amendment to identify heritage places and introduce statements of significance for buildings in the Bourke Hill Precinct
• Establish an information portal to provide access to Melbourne heritage information repositories, including our own collection
Build on the municipality’s cultural heritage in creative and dynamic ways, ensuring appreciation by future generations
• (Major initiative) Install a Tunnerminnerwait and Maulboyheenner commemorative marker
Our 4-year priorities are... Our 2014–15 focus was… Over the next year we will...
ONGOING ACTIONS Several actions not completed in 2014–15 will continue to be delivered in the 2015–16 financial year. Some relate to projects that span multiple years. Some actions were delayed due to unforeseeable external factors.
Ongoing Completed
OUR PERFORMANCE IN 2014-15
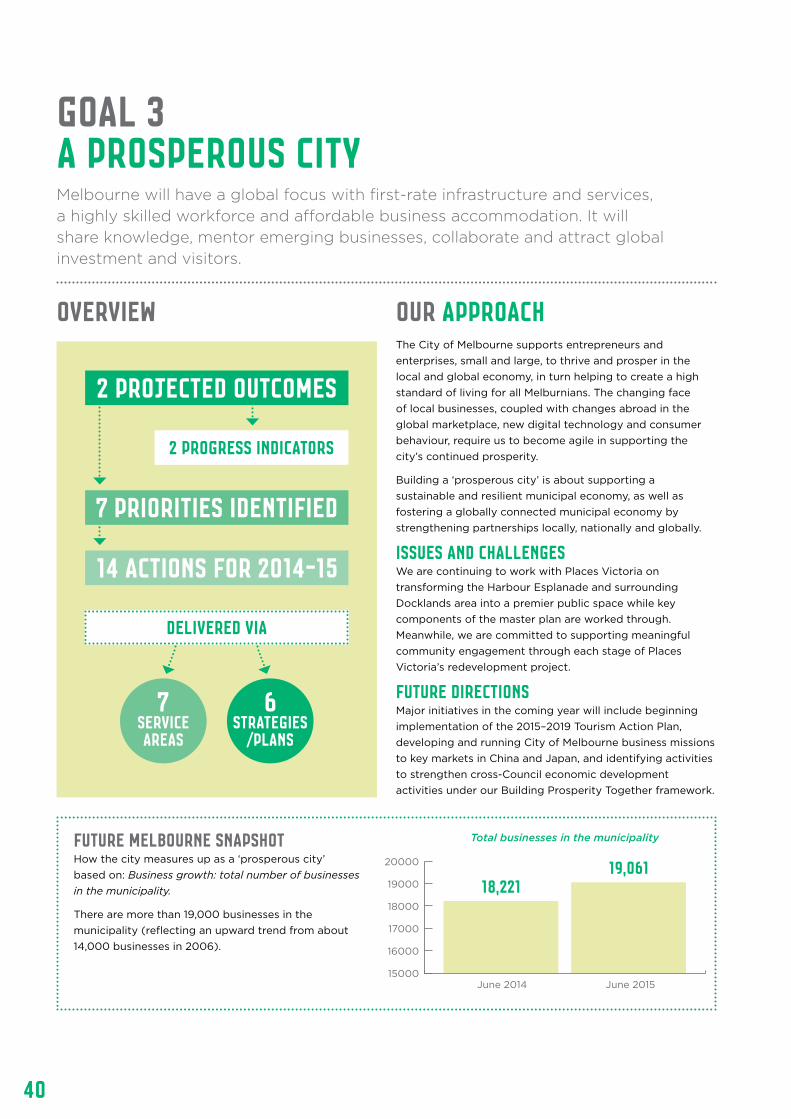
40
OVERVIEW OUR APPROACHThe City of Melbourne supports entrepreneurs and enterprises, small and large, to thrive and prosper in the local and global economy, in turn helping to create a high standard of living for all Melburnians. The changing face of local businesses, coupled with changes abroad in the global marketplace, new digital technology and consumer behaviour, require us to become agile in supporting the city’s continued prosperity.
Building a ‘prosperous city’ is about supporting a sustainable and resilient municipal economy, as well as fostering a globally connected municipal economy by strengthening partnerships locally, nationally and globally.
issues and challenges We are continuing to work with Places Victoria on transforming the Harbour Esplanade and surrounding Docklands area into a premier public space while key components of the master plan are worked through. Meanwhile, we are committed to supporting meaningful community engagement through each stage of Places Victoria’s redevelopment project.
future directionS Major initiatives in the coming year will include beginning implementation of the 2015–2019 Tourism Action Plan, developing and running City of Melbourne business missions to key markets in China and Japan, and identifying activities to strengthen cross-Council economic development activities under our Building Prosperity Together framework.
Melbourne will have a global focus with first-rate infrastructure and services, a highly skilled workforce and affordable business accommodation. It will share knowledge, mentor emerging businesses, collaborate and attract global investment and visitors.
GOAL 3a prosperous city
Future Melbourne snapshot How the city measures up as a ‘prosperous city’ based on: Business growth: total number of businesses in the municipality.
There are more than 19,000 businesses in the municipality (reflecting an upward trend from about 14,000 businesses in 2006).
2 PROJECTED OUTCOMES
14 actions for 2014-15
7 priorities identified
delivered via
7serviceareas
6strategies
/PLANS
2 progress indicators
June 2014 June 2015
18,22119,061
Total businesses in the municipality
15000
16000
17000
18000
19000
20000
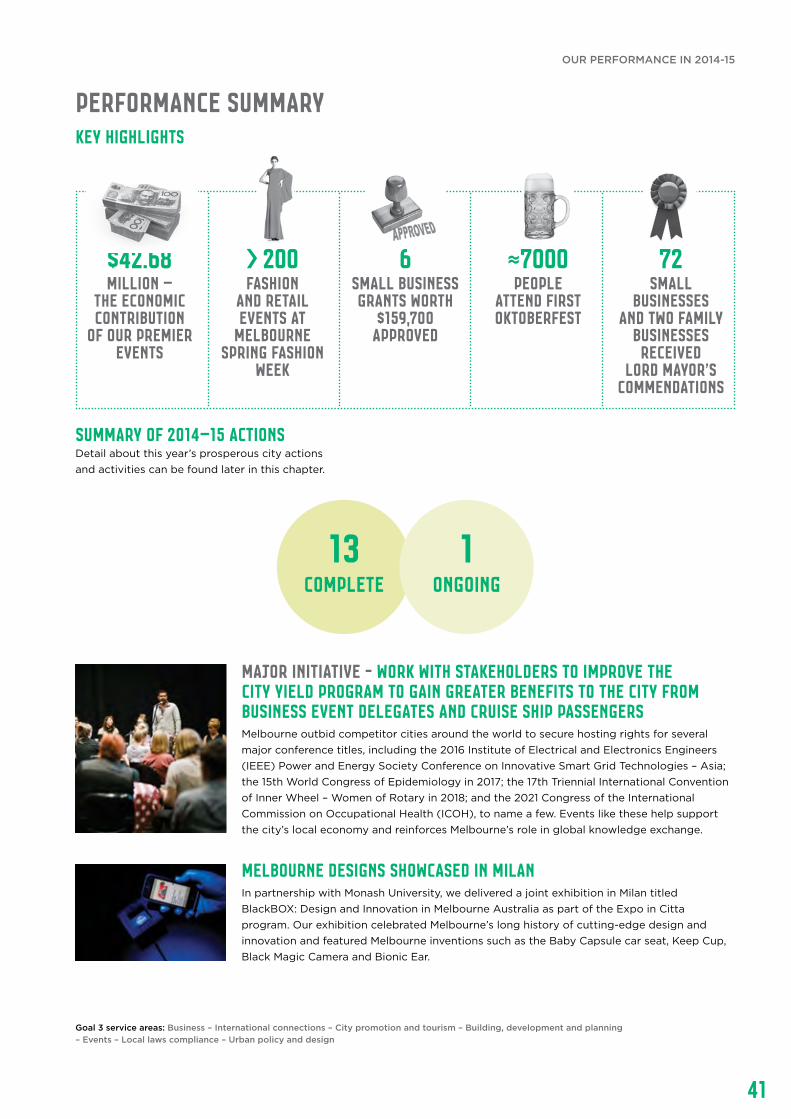
41
$42.68million –
the economic contribution
of our premier events
> 200fashion
and retail events at
Melbourne Spring Fashion
Week
6small business grants worth
$159,700 approved
≈7000people
attend First Oktoberfest
72 small
businesses and two family
businesses received
Lord Mayor’s Commendations
Summary of 2014–15 actions Detail about this year’s prosperous city actions and activities can be found later in this chapter.
Performance SummaryKEY HIGHLIGHTS
Goal 3 service areas: Business – International connections – City promotion and tourism – Building, development and planning – Events – Local laws compliance – Urban policy and design
Major initiative - Work with stakeholders to improve the City Yield Program to gain greater benefits to the city from business event delegates and cruise ship passengersMelbourne outbid competitor cities around the world to secure hosting rights for several major conference titles, including the 2016 Institute of Electrical and Electronics Engineers (IEEE) Power and Energy Society Conference on Innovative Smart Grid Technologies – Asia; the 15th World Congress of Epidemiology in 2017; the 17th Triennial International Convention of Inner Wheel – Women of Rotary in 2018; and the 2021 Congress of the International Commission on Occupational Health (ICOH), to name a few. Events like these help support the city’s local economy and reinforces Melbourne’s role in global knowledge exchange.
Melbourne designs showcased in MilanIn partnership with Monash University, we delivered a joint exhibition in Milan titled BlackBOX: Design and Innovation in Melbourne Australia as part of the Expo in Citta program. Our exhibition celebrated Melbourne’s long history of cutting-edge design and innovation and featured Melbourne inventions such as the Baby Capsule car seat, Keep Cup, Black Magic Camera and Bionic Ear.
1ongoing
13complete
OUR PERFORMANCE IN 2014-15
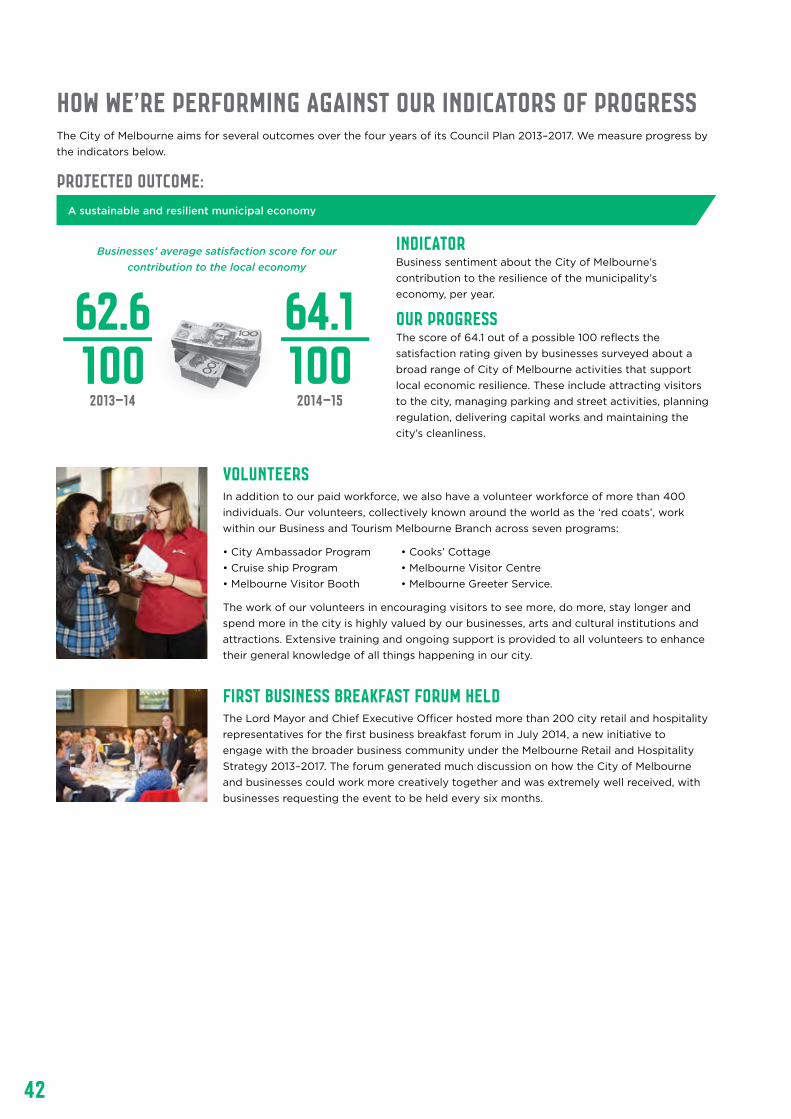
42
How we’re performing against our indicators of progressThe City of Melbourne aims for several outcomes over the four years of its Council Plan 2013–2017. We measure progress by the indicators below.
projected OUTCOME:
INDICATOR Business sentiment about the City of Melbourne’s contribution to the resilience of the municipality’s economy, per year.
Our Progress The score of 64.1 out of a possible 100 reflects the satisfaction rating given by businesses surveyed about a broad range of City of Melbourne activities that support local economic resilience. These include attracting visitors to the city, managing parking and street activities, planning regulation, delivering capital works and maintaining the city’s cleanliness.
A sustainable and resilient municipal economy
VolunteersIn addition to our paid workforce, we also have a volunteer workforce of more than 400 individuals. Our volunteers, collectively known around the world as the ‘red coats’, work within our Business and Tourism Melbourne Branch across seven programs:
• City Ambassador Program • Cooks’ Cottage • Cruise ship Program • Melbourne Visitor Centre • Melbourne Visitor Booth • Melbourne Greeter Service.
The work of our volunteers in encouraging visitors to see more, do more, stay longer and spend more in the city is highly valued by our businesses, arts and cultural institutions and attractions. Extensive training and ongoing support is provided to all volunteers to enhance their general knowledge of all things happening in our city.
First business breakfast forum held
The Lord Mayor and Chief Executive Officer hosted more than 200 city retail and hospitality representatives for the first business breakfast forum in July 2014, a new initiative to engage with the broader business community under the Melbourne Retail and Hospitality Strategy 2013–2017. The forum generated much discussion on how the City of Melbourne and businesses could work more creatively together and was extremely well received, with businesses requesting the event to be held every six months.
Businesses’ average satisfaction score for our contribution to the local economy
2013–14
62.6100
2014–15
64.1100
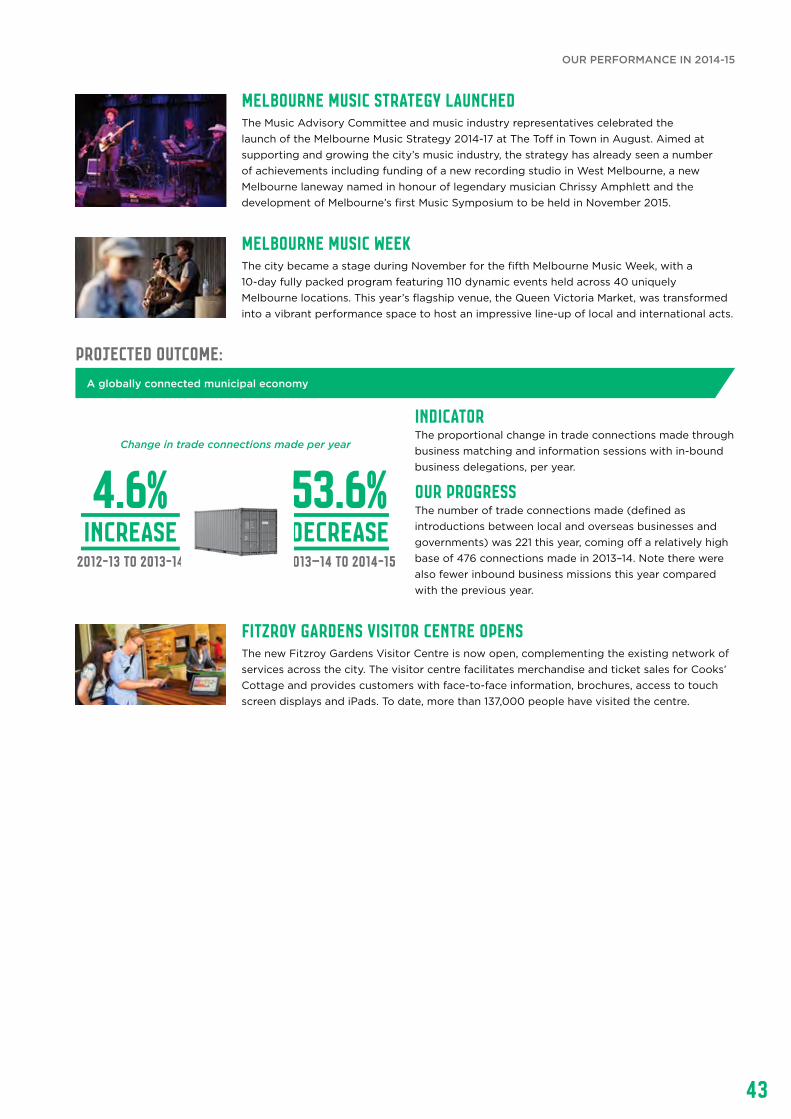
43
projected OUTCOME:
INDICATOR The proportional change in trade connections made through business matching and information sessions with in-bound business delegations, per year.
Our Progress The number of trade connections made (defined as introductions between local and overseas businesses and governments) was 221 this year, coming off a relatively high base of 476 connections made in 2013–14. Note there were also fewer inbound business missions this year compared with the previous year.
A globally connected municipal economy
Melbourne Music Strategy launched The Music Advisory Committee and music industry representatives celebrated the launch of the Melbourne Music Strategy 2014-17 at The Toff in Town in August. Aimed at supporting and growing the city’s music industry, the strategy has already seen a number of achievements including funding of a new recording studio in West Melbourne, a new Melbourne laneway named in honour of legendary musician Chrissy Amphlett and the development of Melbourne’s first Music Symposium to be held in November 2015.
Melbourne Music WeekThe city became a stage during November for the fifth Melbourne Music Week, with a 10-day fully packed program featuring 110 dynamic events held across 40 uniquely Melbourne locations. This year’s flagship venue, the Queen Victoria Market, was transformed into a vibrant performance space to host an impressive line-up of local and international acts.
Fitzroy Gardens Visitor Centre opens
The new Fitzroy Gardens Visitor Centre is now open, complementing the existing network of services across the city. The visitor centre facilitates merchandise and ticket sales for Cooks’ Cottage and provides customers with face-to-face information, brochures, access to touch screen displays and iPads. To date, more than 137,000 people have visited the centre.
Change in trade connections made per year
2012-13 to 2013-14 2013–14 TO 2014-15
4.6% 53.6%INCREASE DECREASE
OUR PERFORMANCE IN 2014-15
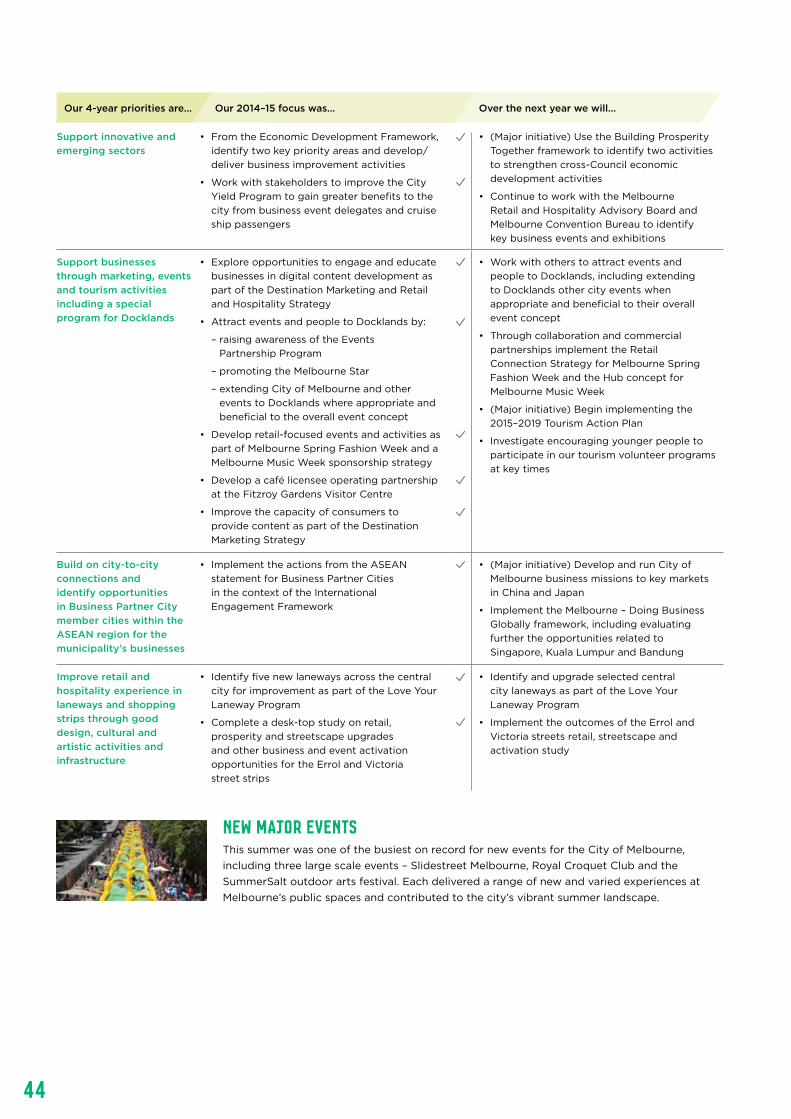
44
Support innovative and emerging sectors
• From the Economic Development Framework, identify two key priority areas and develop/deliver business improvement activities
• Work with stakeholders to improve the City Yield Program to gain greater benefits to the city from business event delegates and cruise ship passengers
• (Major initiative) Use the Building Prosperity Together framework to identify two activities to strengthen cross-Council economic development activities
• Continue to work with the Melbourne Retail and Hospitality Advisory Board and Melbourne Convention Bureau to identify key business events and exhibitions
Support businesses through marketing, events and tourism activities including a special program for Docklands
• Explore opportunities to engage and educate businesses in digital content development as part of the Destination Marketing and Retail and Hospitality Strategy
• Attract events and people to Docklands by:
– raising awareness of the Events Partnership Program
– promoting the Melbourne Star
– extending City of Melbourne and other events to Docklands where appropriate and beneficial to the overall event concept
• Develop retail-focused events and activities as part of Melbourne Spring Fashion Week and a Melbourne Music Week sponsorship strategy
• Develop a café licensee operating partnership at the Fitzroy Gardens Visitor Centre
• Improve the capacity of consumers to provide content as part of the Destination Marketing Strategy
• Work with others to attract events and people to Docklands, including extending to Docklands other city events when appropriate and beneficial to their overall event concept
• Through collaboration and commercial partnerships implement the Retail Connection Strategy for Melbourne Spring Fashion Week and the Hub concept for Melbourne Music Week
• (Major initiative) Begin implementing the 2015–2019 Tourism Action Plan
• Investigate encouraging younger people to participate in our tourism volunteer programs at key times
Build on city-to-city connections and identify opportunities in Business Partner City member cities within the ASEAN region for the municipality’s businesses
• Implement the actions from the ASEAN statement for Business Partner Cities in the context of the International Engagement Framework
• (Major initiative) Develop and run City of Melbourne business missions to key markets in China and Japan
• Implement the Melbourne – Doing Business Globally framework, including evaluating further the opportunities related to Singapore, Kuala Lumpur and Bandung
Improve retail and hospitality experience in laneways and shopping strips through good design, cultural and artistic activities and infrastructure
• Identify five new laneways across the central city for improvement as part of the Love Your Laneway Program
• Complete a desk-top study on retail, prosperity and streetscape upgrades and other business and event activation opportunities for the Errol and Victoria street strips
• Identify and upgrade selected central city laneways as part of the Love Your Laneway Program
• Implement the outcomes of the Errol and Victoria streets retail, streetscape and activation study
Our 4-year priorities are... Our 2014–15 focus was… Over the next year we will...
New major eventsThis summer was one of the busiest on record for new events for the City of Melbourne, including three large scale events – Slidestreet Melbourne, Royal Croquet Club and the SummerSalt outdoor arts festival. Each delivered a range of new and varied experiences at Melbourne’s public spaces and contributed to the city’s vibrant summer landscape.

45
Make information about the municipality available to businesses and investors
• Work supporting this priority is included in our regular business for the year
Support the development of a vibrant social enterprise sector
• Review and renew the 2010 Social Enterprise strategy
Support the development of and access to a Melbourne waterfront, and support the local port status of Victoria harbour
• Complete the Melbourne City Marina Facility fit-out
• Complete the feasibility work for the boating ramp as part of the Waterways Strategic Plan
• Continue to advocate with Places Victoria to advance the:
– Harbour Esplanade Master Plan
– Metropolitan Fire Brigade facility and
– marine services facility, Bolte Precinct, Docklands
• Develop a program or processes to raise awareness of accessibility issues amongst Melbourne retailers through the Melbourne for All People Strategy
• Develop a recreational fishing plan for Docklands waterways
• Develop a berthing strategy for Docklands waterways
• Work with the State Government to rationalise governance arrangements for the city’s waterways
• Work with Places Victoria to prepare an Implementation Plan to deliver the Harbour Esplanade Master Plan
Our 4-year priorities are... Our 2014–15 focus was… Over the next year we will...
ONGOING ACTIONS One action relating to the Harbour Esplanade Master Plan not completed in 2014–15 will continue to be delivered in the 2015–16 financial year, and key components of the master plan still need to be worked through with Places Victoria.
Ongoing Completed
OUR PERFORMANCE IN 2014-15
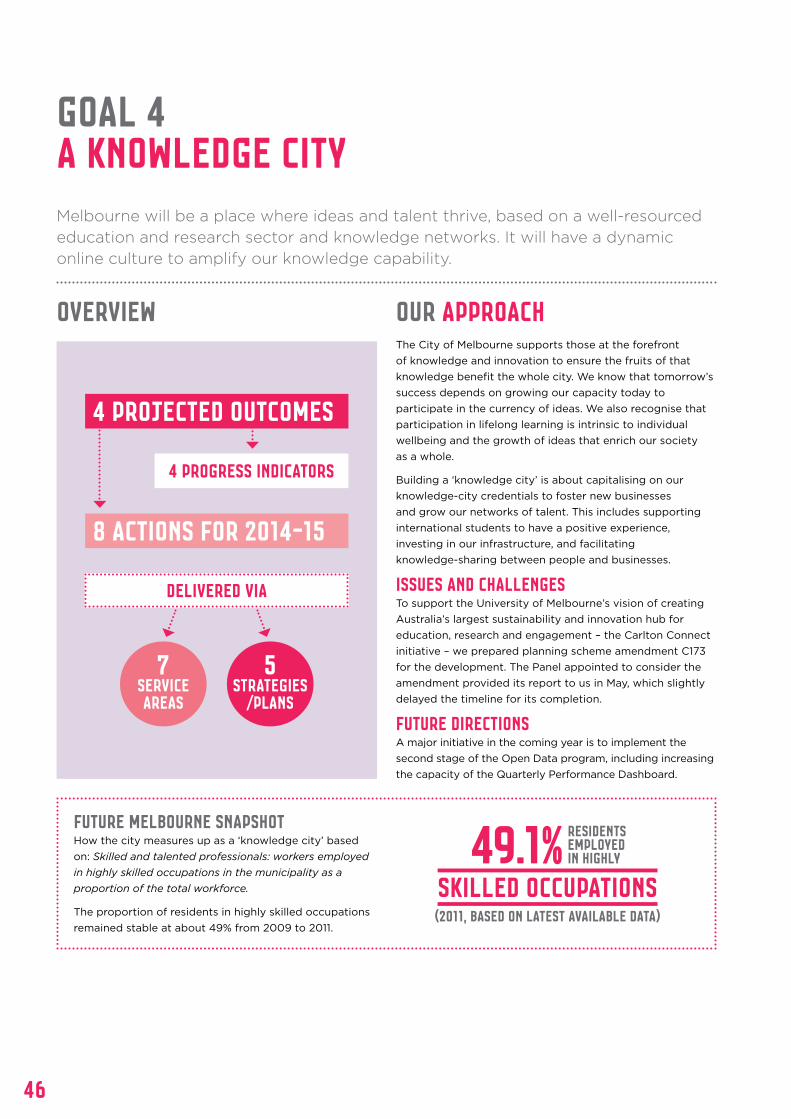
46
OVERVIEW OUR APPROACHThe City of Melbourne supports those at the forefront of knowledge and innovation to ensure the fruits of that knowledge benefit the whole city. We know that tomorrow’s success depends on growing our capacity today to participate in the currency of ideas. We also recognise that participation in lifelong learning is intrinsic to individual wellbeing and the growth of ideas that enrich our society as a whole.
Building a ‘knowledge city’ is about capitalising on our knowledge-city credentials to foster new businesses and grow our networks of talent. This includes supporting international students to have a positive experience, investing in our infrastructure, and facilitating knowledge-sharing between people and businesses.
issues and challenges To support the University of Melbourne’s vision of creating Australia’s largest sustainability and innovation hub for education, research and engagement – the Carlton Connect initiative – we prepared planning scheme amendment C173 for the development. The Panel appointed to consider the amendment provided its report to us in May, which slightly delayed the timeline for its completion.
future directionS A major initiative in the coming year is to implement the second stage of the Open Data program, including increasing the capacity of the Quarterly Performance Dashboard.
Melbourne will be a place where ideas and talent thrive, based on a well-resourced education and research sector and knowledge networks. It will have a dynamic online culture to amplify our knowledge capability.
GOAL 4a knowledge city
Future Melbourne snapshot How the city measures up as a ‘knowledge city’ based on: Skilled and talented professionals: workers employed in highly skilled occupations in the municipality as a proportion of the total workforce.
The proportion of residents in highly skilled occupations remained stable at about 49% from 2009 to 2011.
(2011, based on latest available data)
Residentsemployed in highly49.1%
skilled occupations
4 PROJECTED OUTCOMES
8 actions for 2014-15
delivered via
7serviceareas
5strategies
/PLANS
4 progress indicators
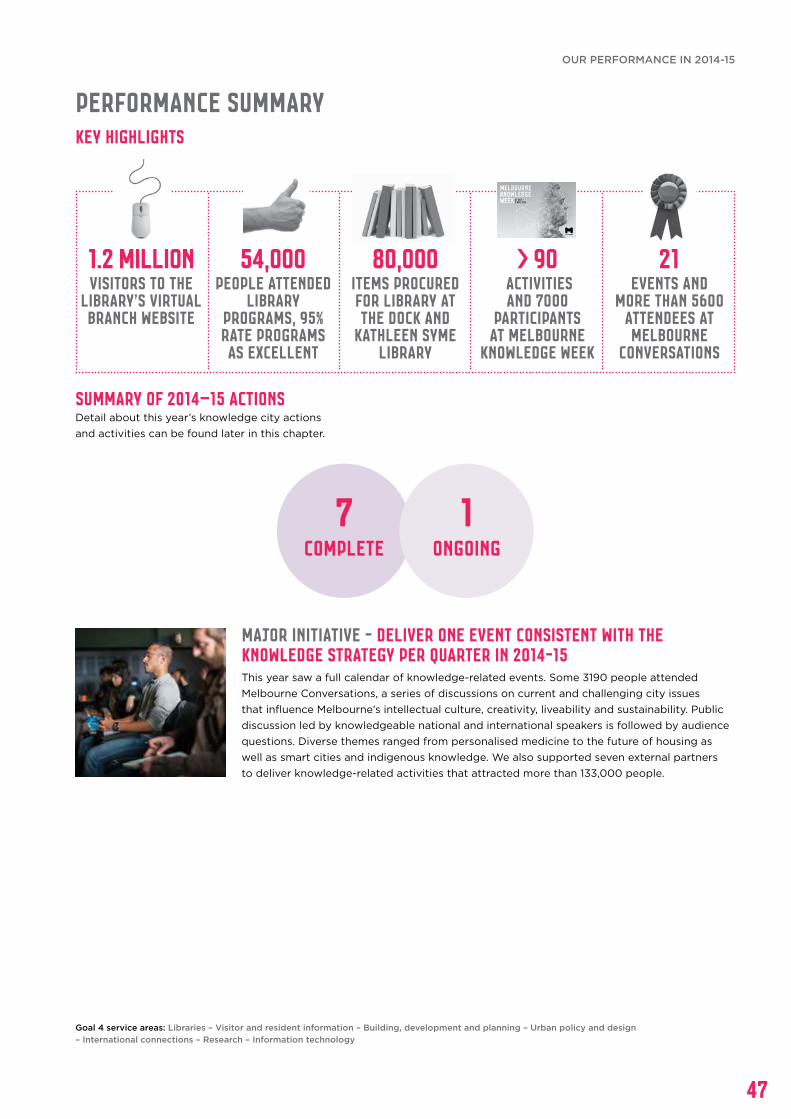
47
Performance SummaryKEY HIGHLIGHTS
Summary of 2014–15 actions Detail about this year’s knowledge city actions and activities can be found later in this chapter.
Goal 4 service areas: Libraries – Visitor and resident information – Building, development and planning – Urban policy and design – International connections – Research – Information technology
1.2 millionvisitors to the
library’s virtual branch website
54,000people attended
library programs, 95% rate programs as excellent
80,000items procured for Library at the Dock and
Kathleen Syme Library
> 90 activities and 7000
participants at Melbourne
Knowledge Week
21events and
more than 5600 attendees at Melbourne
Conversations
Major Initiative - Deliver one event consistent with the Knowledge Strategy per quarter in 2014-15This year saw a full calendar of knowledge-related events. Some 3190 people attended Melbourne Conversations, a series of discussions on current and challenging city issues that influence Melbourne’s intellectual culture, creativity, liveability and sustainability. Public discussion led by knowledgeable national and international speakers is followed by audience questions. Diverse themes ranged from personalised medicine to the future of housing as well as smart cities and indigenous knowledge. We also supported seven external partners to deliver knowledge-related activities that attracted more than 133,000 people.
1ongoing
7complete
OUR PERFORMANCE IN 2014-15
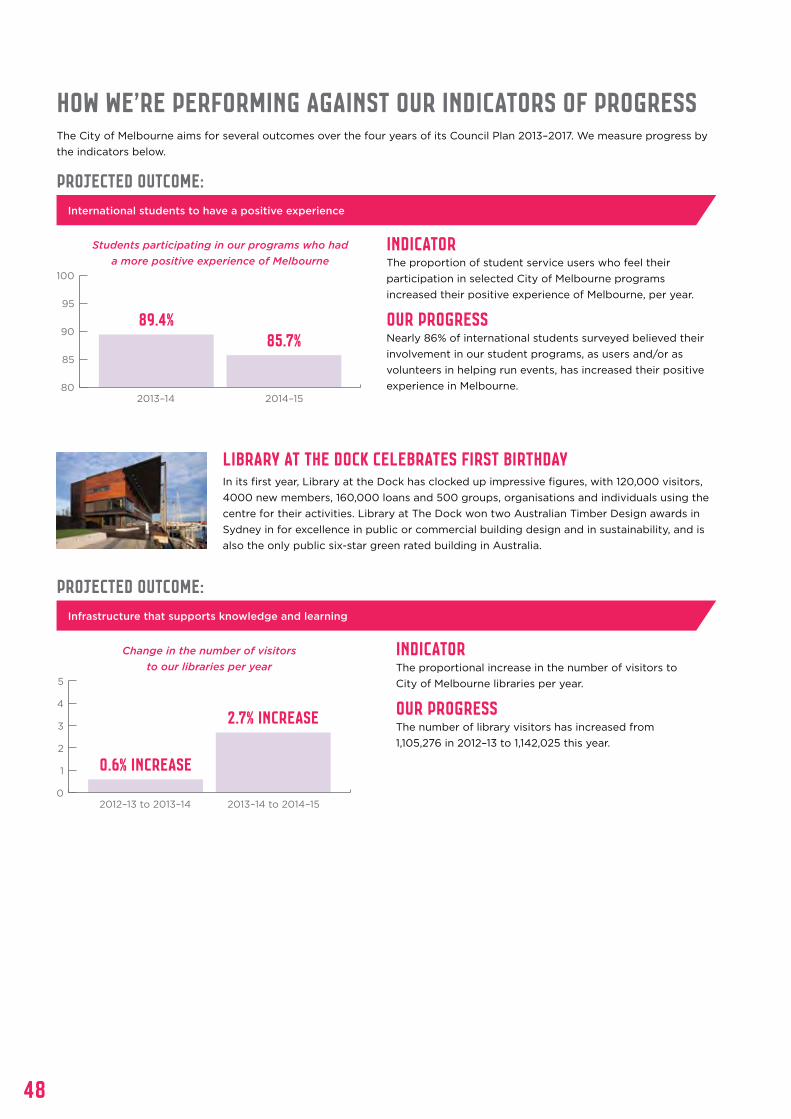
48
How we’re performing against our indicators of progressThe City of Melbourne aims for several outcomes over the four years of its Council Plan 2013–2017. We measure progress by the indicators below.
projected OUTCOME:
projected OUTCOME:
INDICATOR The proportion of student service users who feel their participation in selected City of Melbourne programs increased their positive experience of Melbourne, per year.
Our Progress Nearly 86% of international students surveyed believed their involvement in our student programs, as users and/or as volunteers in helping run events, has increased their positive experience in Melbourne.
INDICATOR The proportional increase in the number of visitors to City of Melbourne libraries per year.
Our Progress The number of library visitors has increased from 1,105,276 in 2012–13 to 1,142,025 this year.
International students to have a positive experience
Infrastructure that supports knowledge and learning
Library at the Dock celebrates first birthdayIn its first year, Library at the Dock has clocked up impressive figures, with 120,000 visitors, 4000 new members, 160,000 loans and 500 groups, organisations and individuals using the centre for their activities. Library at The Dock won two Australian Timber Design awards in Sydney in for excellence in public or commercial building design and in sustainability, and is also the only public six-star green rated building in Australia.
80
85
90
95
100
2013–14 2014–15
89.4%85.7%
Students participating in our programs who had a more positive experience of Melbourne
0
1
2
3
4
5
2012–13 to 2013–14 2013–14 to 2014–15
0.6% increase
2.7% increase
Change in the number of visitors to our libraries per year
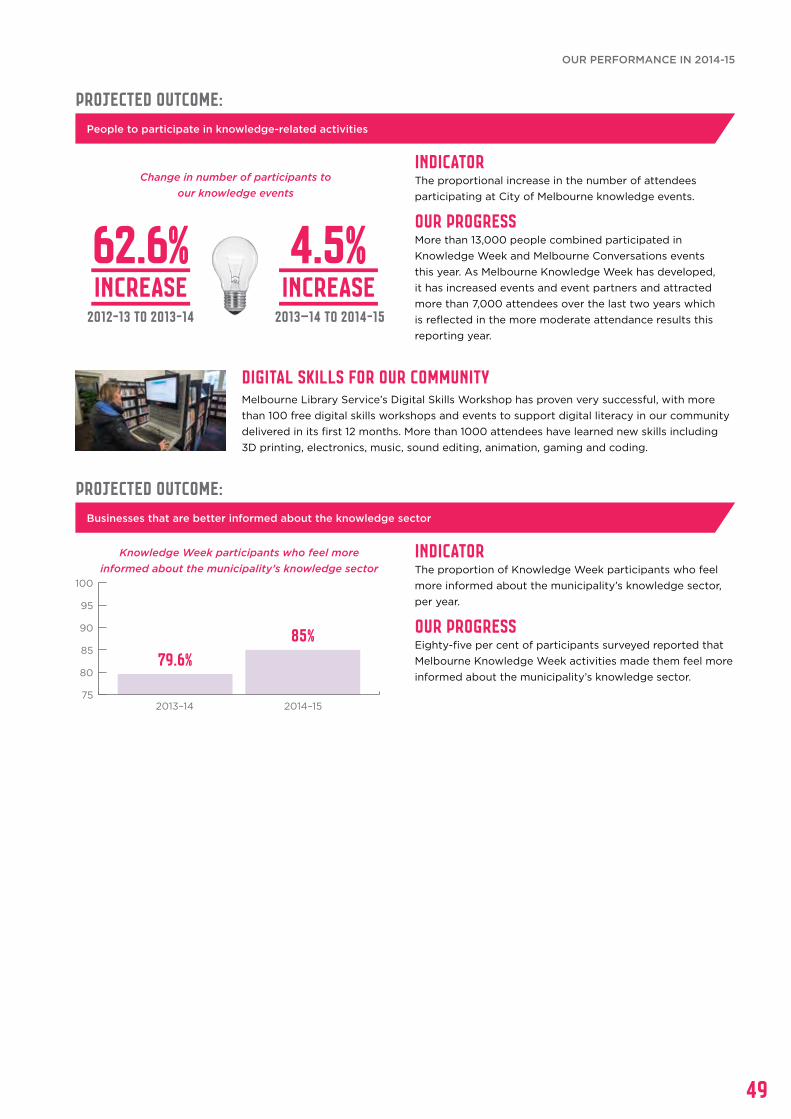
49
projected OUTCOME:
projected OUTCOME:
INDICATOR The proportional increase in the number of attendees participating at City of Melbourne knowledge events.
Our Progress More than 13,000 people combined participated in Knowledge Week and Melbourne Conversations events this year. As Melbourne Knowledge Week has developed, it has increased events and event partners and attracted more than 7,000 attendees over the last two years which is reflected in the more moderate attendance results this reporting year.
INDICATOR The proportion of Knowledge Week participants who feel more informed about the municipality’s knowledge sector, per year.
Our Progress Eighty-five per cent of participants surveyed reported that Melbourne Knowledge Week activities made them feel more informed about the municipality’s knowledge sector.
People to participate in knowledge-related activities
Businesses that are better informed about the knowledge sector
Digital skills for our communityMelbourne Library Service’s Digital Skills Workshop has proven very successful, with more than 100 free digital skills workshops and events to support digital literacy in our community delivered in its first 12 months. More than 1000 attendees have learned new skills including 3D printing, electronics, music, sound editing, animation, gaming and coding.
Change in number of participants to our knowledge events
2013–14 2014–15
79.6%85%
Knowledge Week participants who feel more informed about the municipality’s knowledge sector
75
80
85
90
95
100
2012-13 to 2013-14 2013–14 TO 2014-15
62.6% 4.5%INCREASE INCREASE
OUR PERFORMANCE IN 2014-15

50
Develop programs, relationships and initiatives to support the wellbeing of international students
• Host and participate in forums with the education sector, local governments and the State Government to explore opportunities to collaborate on international student wellbeing, housing and employment
• Implement Year 3 actions of the International Student Strategy 2013–2017
Provide high-quality municipal data and information to the knowledge sector and public
• Implement the Smart City Strategy and the associated governance body
• (Major initiative) Implement Stage 2 of the Open Data program, including increasing the capacity of the Quarterly Services Dashboard
• Implement selected actions from the Smart City Strategy
Support the development of knowledge precincts and innovation hubs as part of the City North Structure Plan
• Work with the proponent to complete a planning scheme amendment for the Carlton Connect precinct as per the City North Structure Plan
• Complete the University of Melbourne-led Carlton Connect Planning Scheme Amendment
Continue to provide comprehensive high-quality libraries and support neighbourhood learning programs
• Work supporting this priority is included in our regular business for the year
Develop a strategy for Wi-Fi hotspots in the municipality
• Continue to help the State Government with the city-wide wi-fi roll-out and associated opportunities
Encourage knowledge sector engagement and promote the municipality’s knowledge sector
• Implement the Knowledge Strategy
• Develop a growth strategy for Melbourne Knowledge Week
• Deliver one event consistent with the Knowledge Strategy per quarter in 2014–15
• Provide a City of Melbourne knowledge fellowship and communicate the knowledge gained by the fellow via our libraries
• Explore with Melbourne-based entrepreneurs, makers and service providers the potential for a high-tech, high-value manufacturing network and make recommendations in relation to the City of Melbourne’s role
• Continue to implement Knowledge City Strategy actions, including a knowledge city benchmarking framework, redeveloped website including a knowledge asset map, and a feasibility assessment related to hosting inbound delegations
• As part of the Melbourne Knowledge Week development plan, partner with key organisations and individuals to curate the program of events and activities
Develop strategies in partnership with the knowledge sector to attract experts to the municipality
• Provide a second City of Melbourne knowledge fellowship and determine the future of this program
• Run Knowledge Melbourne events and activities
Our 4-year priorities are... Our 2014–15 focus was… Over the next year we will...
ONGOING ACTIONS One action relating to the Carlton Connect precinct not completed in 2014–15 will continue to be delivered in the 2015–16 financial year. The initiative is subject to a planning scheme amendment which was delayed.
Ongoing Completed
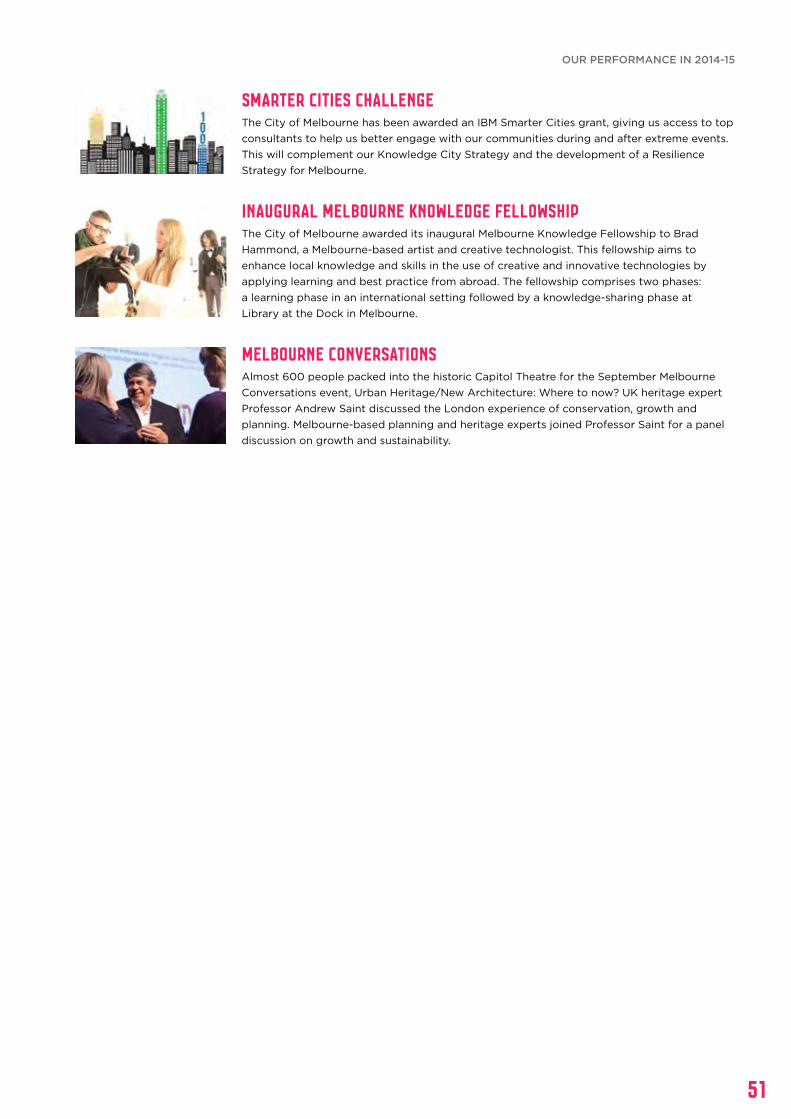
51
Smarter Cities ChallengeThe City of Melbourne has been awarded an IBM Smarter Cities grant, giving us access to top consultants to help us better engage with our communities during and after extreme events. This will complement our Knowledge City Strategy and the development of a Resilience Strategy for Melbourne.
Inaugural Melbourne Knowledge FellowshipThe City of Melbourne awarded its inaugural Melbourne Knowledge Fellowship to Brad Hammond, a Melbourne-based artist and creative technologist. This fellowship aims to enhance local knowledge and skills in the use of creative and innovative technologies by applying learning and best practice from abroad. The fellowship comprises two phases: a learning phase in an international setting followed by a knowledge-sharing phase at Library at the Dock in Melbourne.
Melbourne ConversationsAlmost 600 people packed into the historic Capitol Theatre for the September Melbourne Conversations event, Urban Heritage/New Architecture: Where to now? UK heritage expert Professor Andrew Saint discussed the London experience of conservation, growth and planning. Melbourne-based planning and heritage experts joined Professor Saint for a panel discussion on growth and sustainability.
OUR PERFORMANCE IN 2014-15
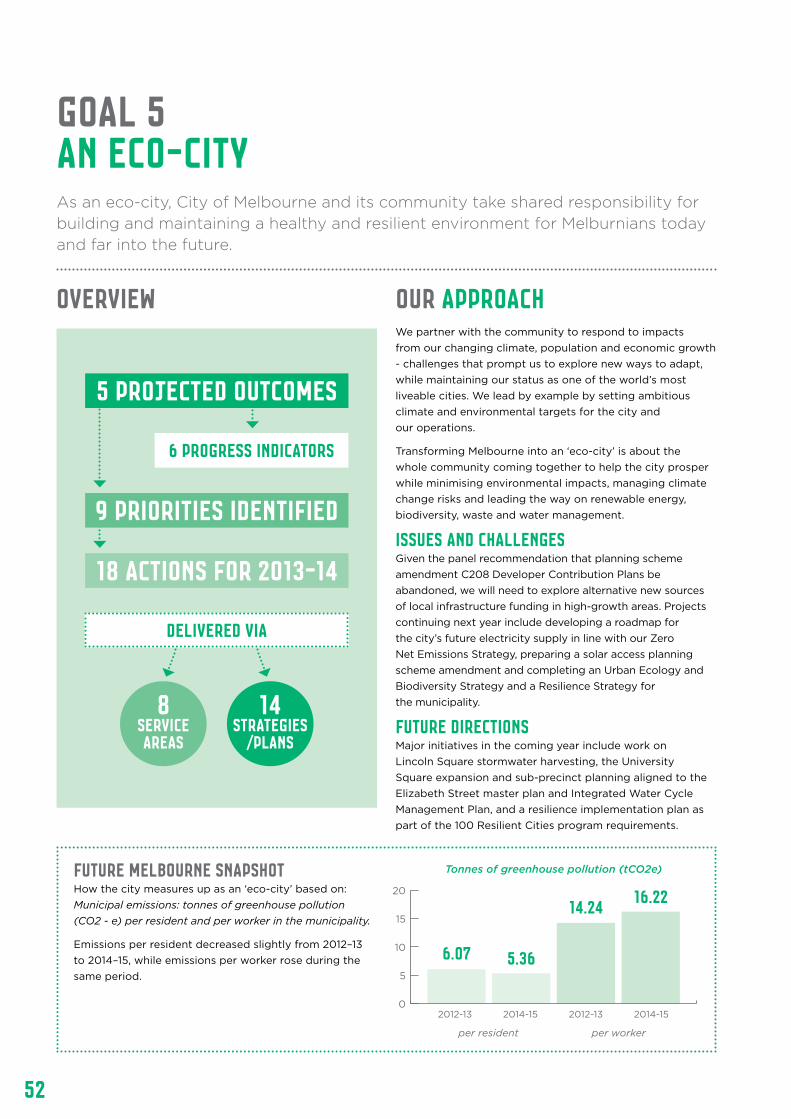
52
OVERVIEW OUR APPROACHWe partner with the community to respond to impacts from our changing climate, population and economic growth - challenges that prompt us to explore new ways to adapt, while maintaining our status as one of the world’s most liveable cities. We lead by example by setting ambitious climate and environmental targets for the city and our operations.
Transforming Melbourne into an ‘eco-city’ is about the whole community coming together to help the city prosper while minimising environmental impacts, managing climate change risks and leading the way on renewable energy, biodiversity, waste and water management.
issues and challenges Given the panel recommendation that planning scheme amendment C208 Developer Contribution Plans be abandoned, we will need to explore alternative new sources of local infrastructure funding in high-growth areas. Projects continuing next year include developing a roadmap for the city’s future electricity supply in line with our Zero Net Emissions Strategy, preparing a solar access planning scheme amendment and completing an Urban Ecology and Biodiversity Strategy and a Resilience Strategy for the municipality.
future directionS Major initiatives in the coming year include work on Lincoln Square stormwater harvesting, the University Square expansion and sub-precinct planning aligned to the Elizabeth Street master plan and Integrated Water Cycle Management Plan, and a resilience implementation plan as part of the 100 Resilient Cities program requirements.
As an eco-city, City of Melbourne and its community take shared responsibility for building and maintaining a healthy and resilient environment for Melburnians today and far into the future.
GOAL 5an ECO-CITY
Future Melbourne snapshot How the city measures up as an ‘eco-city’ based on: Municipal emissions: tonnes of greenhouse pollution (CO2 - e) per resident and per worker in the municipality.
Emissions per resident decreased slightly from 2012–13 to 2014–15, while emissions per worker rose during the same period.
5 PROJECTED OUTCOMES
18 actions for 2013-14
9 priorities identified
delivered via
8serviceareas
14strategies
/PLANS
6 progress indicators
0
5
10
15
20
per resident per worker
6.07 5.36
16.2214.24
Tonnes of greenhouse pollution (tCO2e)
2012-13 2014-15 2012-13 2014-15
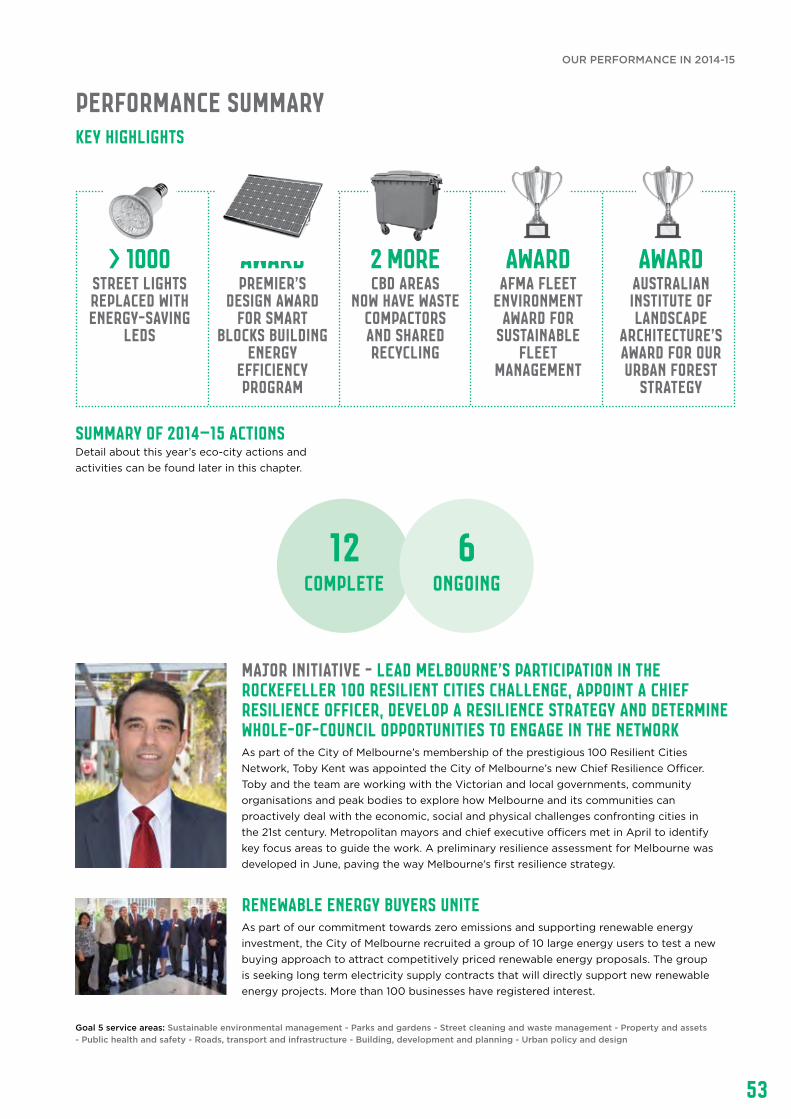
53
Performance SummaryKEY HIGHLIGHTS
Summary of 2014–15 actions Detail about this year’s eco-city actions and activities can be found later in this chapter.
Goal 5 service areas: Sustainable environmental management - Parks and gardens - Street cleaning and waste management - Property and assets - Public health and safety - Roads, transport and infrastructure - Building, development and planning - Urban policy and design
> 1000street lights replaced with energy-saving
LEDs
AwardPremier’s
Design Award for Smart
Blocks building energy
efficiency program
2 MORECBD areas
now have Waste compactors and shared recycling
AWARD AfMA Fleet
Environment Award for
sustainable fleet
management
AWARDAustralian Institute of Landscape
Architecture’s Award for our Urban Forest
Strategy
Major Initiative - Lead Melbourne’s participation in the Rockefeller 100 Resilient Cities Challenge, appoint a Chief Resilience Officer, develop a resilience strategy and determine whole-of-council opportunities to engage in the networkAs part of the City of Melbourne’s membership of the prestigious 100 Resilient Cities Network, Toby Kent was appointed the City of Melbourne’s new Chief Resilience Officer. Toby and the team are working with the Victorian and local governments, community organisations and peak bodies to explore how Melbourne and its communities can proactively deal with the economic, social and physical challenges confronting cities in the 21st century. Metropolitan mayors and chief executive officers met in April to identify key focus areas to guide the work. A preliminary resilience assessment for Melbourne was developed in June, paving the way Melbourne’s first resilience strategy.
Renewable energy buyers uniteAs part of our commitment towards zero emissions and supporting renewable energy investment, the City of Melbourne recruited a group of 10 large energy users to test a new buying approach to attract competitively priced renewable energy proposals. The group is seeking long term electricity supply contracts that will directly support new renewable energy projects. More than 100 businesses have registered interest.
6ongoing
12complete
OUR PERFORMANCE IN 2014-15
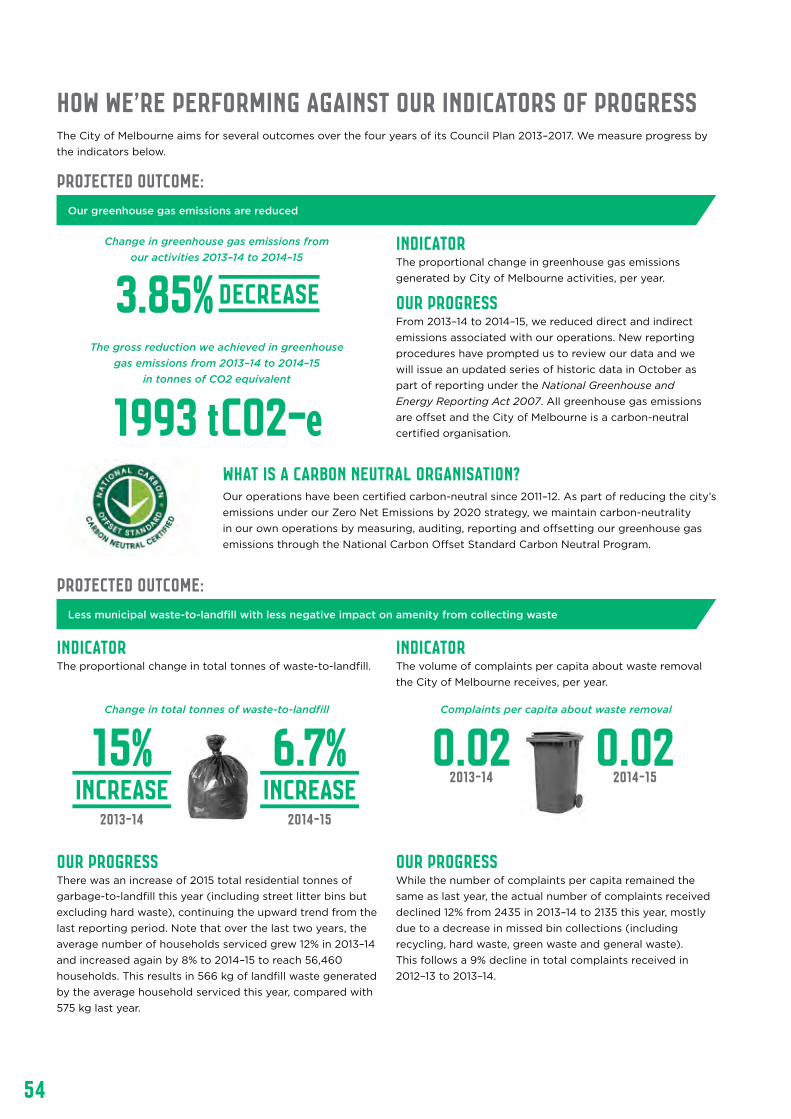
54
How we’re performing against our indicators of progressThe City of Melbourne aims for several outcomes over the four years of its Council Plan 2013–2017. We measure progress by the indicators below.
projected OUTCOME:
INDICATOR The proportional change in greenhouse gas emissions generated by City of Melbourne activities, per year.
Our Progress From 2013–14 to 2014–15, we reduced direct and indirect emissions associated with our operations. New reporting procedures have prompted us to review our data and we will issue an updated series of historic data in October as part of reporting under the National Greenhouse and Energy Reporting Act 2007. All greenhouse gas emissions are offset and the City of Melbourne is a carbon-neutral certified organisation.
Our greenhouse gas emissions are reduced
projected OUTCOME:Less municipal waste-to-landfill with less negative impact on amenity from collecting waste
INDICATOR The proportional change in total tonnes of waste-to-landfill.
INDICATOR The volume of complaints per capita about waste removal the City of Melbourne receives, per year.
Our Progress There was an increase of 2015 total residential tonnes of garbage-to-landfill this year (including street litter bins but excluding hard waste), continuing the upward trend from the last reporting period. Note that over the last two years, the average number of households serviced grew 12% in 2013–14 and increased again by 8% to 2014–15 to reach 56,460 households. This results in 566 kg of landfill waste generated by the average household serviced this year, compared with 575 kg last year.
Our Progress While the number of complaints per capita remained the same as last year, the actual number of complaints received declined 12% from 2435 in 2013–14 to 2135 this year, mostly due to a decrease in missed bin collections (including recycling, hard waste, green waste and general waste). This follows a 9% decline in total complaints received in 2012–13 to 2013–14.
1993 tCO2-eThe gross reduction we achieved in greenhouse
gas emissions from 2013–14 to 2014–15 in tonnes of CO2 equivalent
Change in greenhouse gas emissions from our activities 2013–14 to 2014–15
Complaints per capita about waste removalChange in total tonnes of waste-to-landfill
What is a carbon neutral organisation? Our operations have been certified carbon-neutral since 2011–12. As part of reducing the city’s emissions under our Zero Net Emissions by 2020 strategy, we maintain carbon-neutrality in our own operations by measuring, auditing, reporting and offsetting our greenhouse gas emissions through the National Carbon Offset Standard Carbon Neutral Program.
3.85%DECREASE
0.022013-14
0.022014-15
2013-14
15%INCREASE
2014-15
6.7%INCREASE
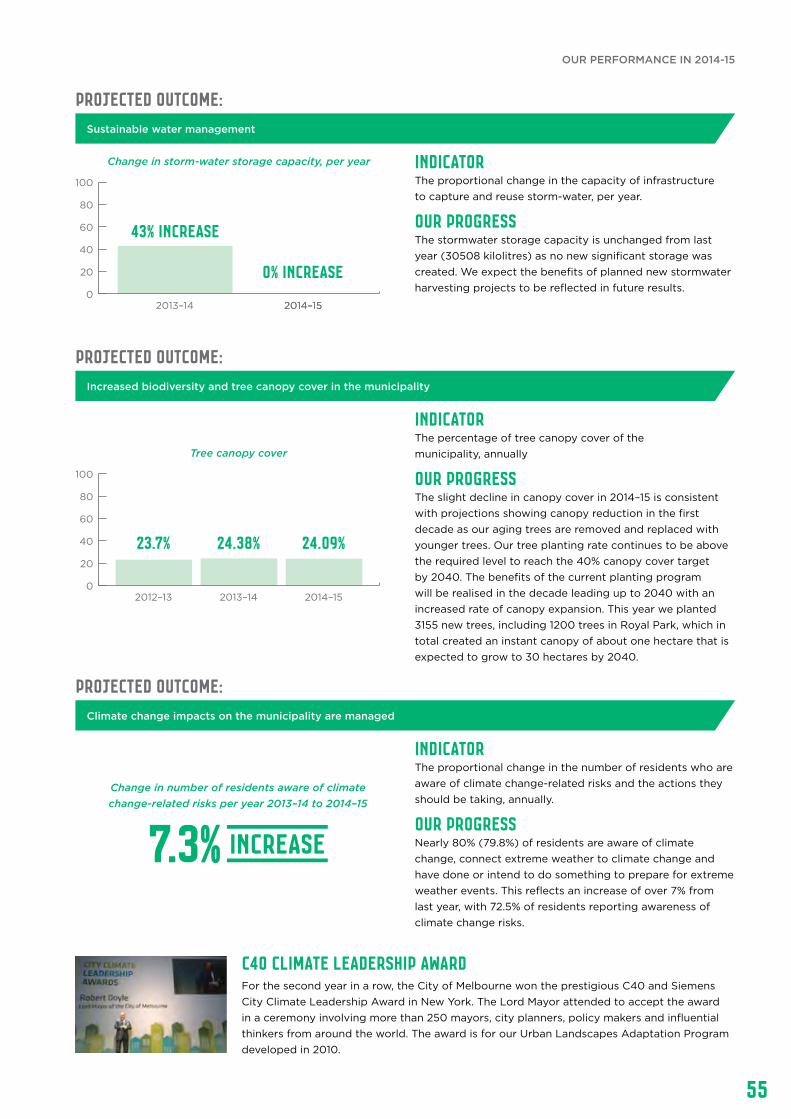
55
projected OUTCOME:
INDICATOR The proportional change in the capacity of infrastructure to capture and reuse storm-water, per year.
Our Progress The stormwater storage capacity is unchanged from last year (30508 kilolitres) as no new significant storage was created. We expect the benefits of planned new stormwater harvesting projects to be reflected in future results.
Sustainable water management
projected OUTCOME:
INDICATOR The percentage of tree canopy cover of the municipality, annually
Our Progress The slight decline in canopy cover in 2014–15 is consistent with projections showing canopy reduction in the first decade as our aging trees are removed and replaced with younger trees. Our tree planting rate continues to be above the required level to reach the 40% canopy cover target by 2040. The benefits of the current planting program will be realised in the decade leading up to 2040 with an increased rate of canopy expansion. This year we planted 3155 new trees, including 1200 trees in Royal Park, which in total created an instant canopy of about one hectare that is expected to grow to 30 hectares by 2040.
Increased biodiversity and tree canopy cover in the municipality
Climate change impacts on the municipality are managed
projected OUTCOME:
INDICATOR The proportional change in the number of residents who are aware of climate change-related risks and the actions they should be taking, annually.
Our Progress Nearly 80% (79.8%) of residents are aware of climate change, connect extreme weather to climate change and have done or intend to do something to prepare for extreme weather events. This reflects an increase of over 7% from last year, with 72.5% of residents reporting awareness of climate change risks.
C40 Climate Leadership AwardFor the second year in a row, the City of Melbourne won the prestigious C40 and Siemens City Climate Leadership Award in New York. The Lord Mayor attended to accept the award in a ceremony involving more than 250 mayors, city planners, policy makers and influential thinkers from around the world. The award is for our Urban Landscapes Adaptation Program developed in 2010.
Change in number of residents aware of climate change-related risks per year 2013–14 to 2014–15
7.3% INCREASE
0
20
40
60
80
100
2013–14 2014–15
43% INCREASE
0% INCREASE
Change in storm-water storage capacity, per year
2014–15
0
20
40
60
80
100
2012–13 2013–14 2014–15
23.7% 24.38% 24.09%
Tree canopy cover
OUR PERFORMANCE IN 2014-15
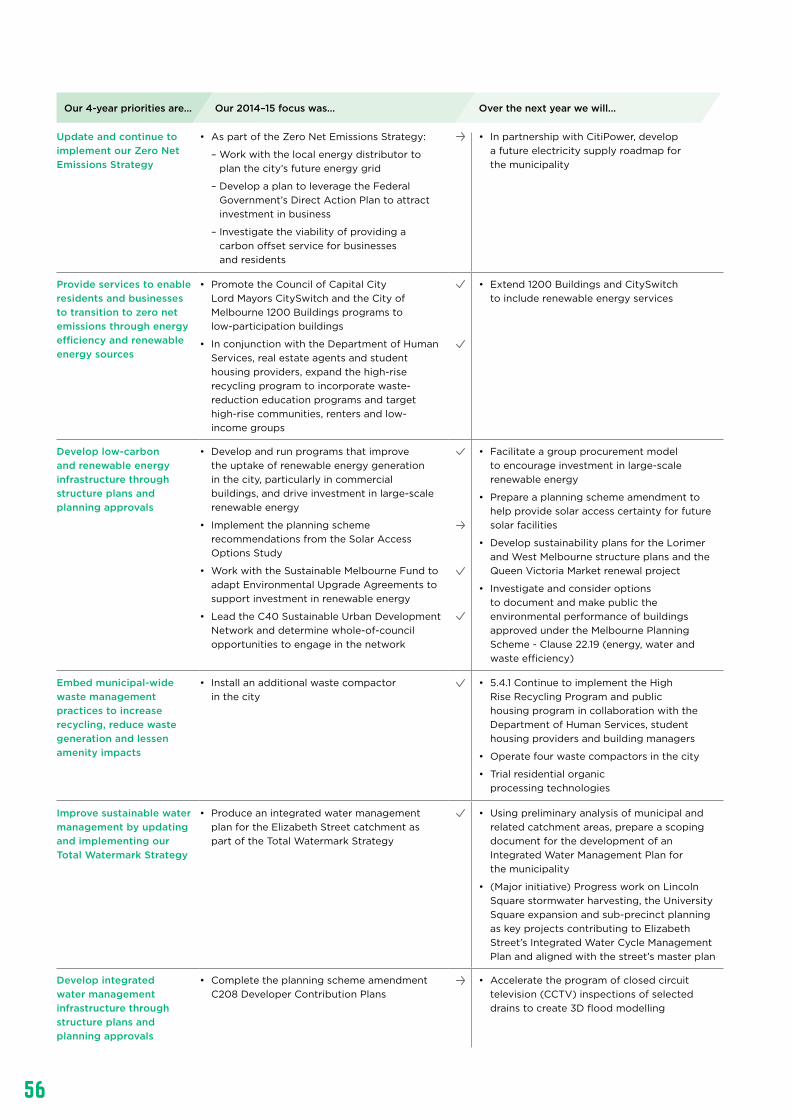
56
Update and continue to implement our Zero Net Emissions Strategy
• As part of the Zero Net Emissions Strategy:
– Work with the local energy distributor to plan the city’s future energy grid
– Develop a plan to leverage the Federal Government’s Direct Action Plan to attract investment in business
– Investigate the viability of providing a carbon offset service for businesses and residents
• In partnership with CitiPower, develop a future electricity supply roadmap for the municipality
Provide services to enable residents and businesses to transition to zero net emissions through energy efficiency and renewable energy sources
• Promote the Council of Capital City Lord Mayors CitySwitch and the City of Melbourne 1200 Buildings programs to low-participation buildings
• In conjunction with the Department of Human Services, real estate agents and student housing providers, expand the high-rise recycling program to incorporate waste-reduction education programs and target high-rise communities, renters and low-income groups
• Extend 1200 Buildings and CitySwitch to include renewable energy services
Develop low-carbon and renewable energy infrastructure through structure plans and planning approvals
• Develop and run programs that improve the uptake of renewable energy generation in the city, particularly in commercial buildings, and drive investment in large-scale renewable energy
• Implement the planning scheme recommendations from the Solar Access Options Study
• Work with the Sustainable Melbourne Fund to adapt Environmental Upgrade Agreements to support investment in renewable energy
• Lead the C40 Sustainable Urban Development Network and determine whole-of-council opportunities to engage in the network
• Facilitate a group procurement model to encourage investment in large-scale renewable energy
• Prepare a planning scheme amendment to help provide solar access certainty for future solar facilities
• Develop sustainability plans for the Lorimer and West Melbourne structure plans and the Queen Victoria Market renewal project
• Investigate and consider options to document and make public the environmental performance of buildings approved under the Melbourne Planning Scheme - Clause 22.19 (energy, water and waste efficiency)
Embed municipal-wide waste management practices to increase recycling, reduce waste generation and lessen amenity impacts
• Install an additional waste compactor in the city
• 5.4.1 Continue to implement the High Rise Recycling Program and public housing program in collaboration with the Department of Human Services, student housing providers and building managers
• Operate four waste compactors in the city
• Trial residential organic processing technologies
Improve sustainable water management by updating and implementing our Total Watermark Strategy
• Produce an integrated water management plan for the Elizabeth Street catchment as part of the Total Watermark Strategy
• Using preliminary analysis of municipal and related catchment areas, prepare a scoping document for the development of an Integrated Water Management Plan for the municipality
• (Major initiative) Progress work on Lincoln Square stormwater harvesting, the University Square expansion and sub-precinct planning as key projects contributing to Elizabeth Street’s Integrated Water Cycle Management Plan and aligned with the street’s master plan
Develop integrated water management infrastructure through structure plans and planning approvals
• Complete the planning scheme amendment C208 Developer Contribution Plans
• Accelerate the program of closed circuit television (CCTV) inspections of selected drains to create 3D flood modelling
Our 4-year priorities are... Our 2014–15 focus was… Over the next year we will...
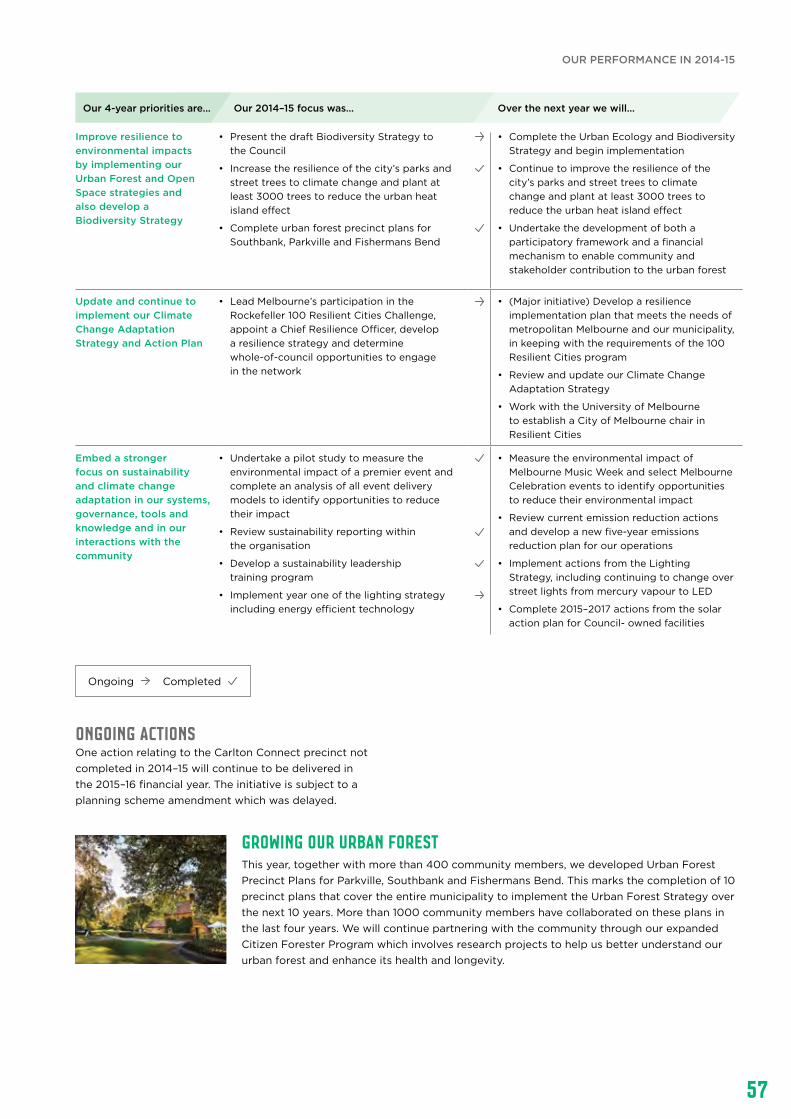
57
Improve resilience to environmental impacts by implementing our Urban Forest and Open Space strategies and also develop a Biodiversity Strategy
• Present the draft Biodiversity Strategy to the Council
• Increase the resilience of the city’s parks and street trees to climate change and plant at least 3000 trees to reduce the urban heat island effect
• Complete urban forest precinct plans for Southbank, Parkville and Fishermans Bend
• Complete the Urban Ecology and Biodiversity Strategy and begin implementation
• Continue to improve the resilience of the city’s parks and street trees to climate change and plant at least 3000 trees to reduce the urban heat island effect
• Undertake the development of both a participatory framework and a financial mechanism to enable community and stakeholder contribution to the urban forest
Update and continue to implement our Climate Change Adaptation Strategy and Action Plan
• Lead Melbourne’s participation in the Rockefeller 100 Resilient Cities Challenge, appoint a Chief Resilience Officer, develop a resilience strategy and determine whole-of-council opportunities to engage in the network
• (Major initiative) Develop a resilience implementation plan that meets the needs of metropolitan Melbourne and our municipality, in keeping with the requirements of the 100 Resilient Cities program
• Review and update our Climate Change Adaptation Strategy
• Work with the University of Melbourne to establish a City of Melbourne chair in Resilient Cities
Embed a stronger focus on sustainability and climate change adaptation in our systems, governance, tools and knowledge and in our interactions with the community
• Undertake a pilot study to measure the environmental impact of a premier event and complete an analysis of all event delivery models to identify opportunities to reduce their impact
• Review sustainability reporting within the organisation
• Develop a sustainability leadership training program
• Implement year one of the lighting strategy including energy efficient technology
• Measure the environmental impact of Melbourne Music Week and select Melbourne Celebration events to identify opportunities to reduce their environmental impact
• Review current emission reduction actions and develop a new five-year emissions reduction plan for our operations
• Implement actions from the Lighting Strategy, including continuing to change over street lights from mercury vapour to LED
• Complete 2015–2017 actions from the solar action plan for Council- owned facilities
Our 4-year priorities are... Our 2014–15 focus was… Over the next year we will...
ONGOING ACTIONS One action relating to the Carlton Connect precinct not completed in 2014–15 will continue to be delivered in the 2015–16 financial year. The initiative is subject to a planning scheme amendment which was delayed.
Ongoing Completed
Growing our urban forestThis year, together with more than 400 community members, we developed Urban Forest Precinct Plans for Parkville, Southbank and Fishermans Bend. This marks the completion of 10 precinct plans that cover the entire municipality to implement the Urban Forest Strategy over the next 10 years. More than 1000 community members have collaborated on these plans in the last four years. We will continue partnering with the community through our expanded Citizen Forester Program which involves research projects to help us better understand our urban forest and enhance its health and longevity.
OUR PERFORMANCE IN 2014-15
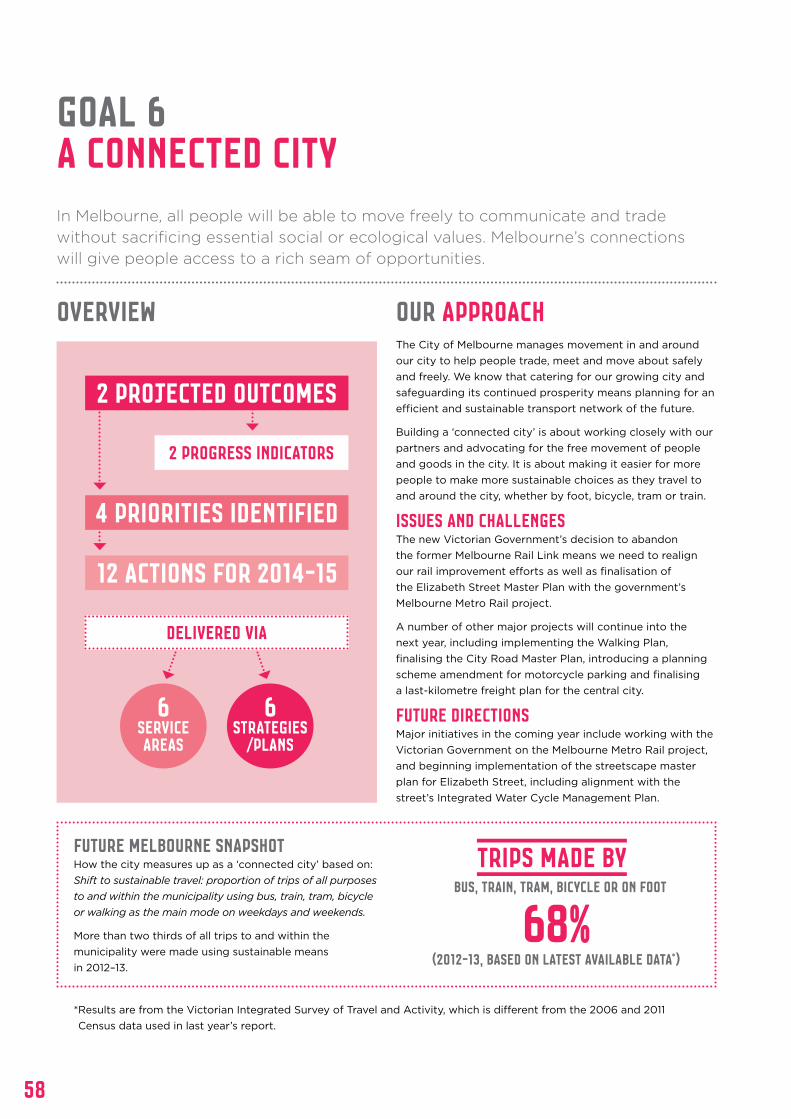
58
OVERVIEW OUR APPROACHThe City of Melbourne manages movement in and around our city to help people trade, meet and move about safely and freely. We know that catering for our growing city and safeguarding its continued prosperity means planning for an efficient and sustainable transport network of the future.
Building a ‘connected city’ is about working closely with our partners and advocating for the free movement of people and goods in the city. It is about making it easier for more people to make more sustainable choices as they travel to and around the city, whether by foot, bicycle, tram or train.
issues and challenges The new Victorian Government’s decision to abandon the former Melbourne Rail Link means we need to realign our rail improvement efforts as well as finalisation of the Elizabeth Street Master Plan with the government’s Melbourne Metro Rail project.
A number of other major projects will continue into the next year, including implementing the Walking Plan, finalising the City Road Master Plan, introducing a planning scheme amendment for motorcycle parking and finalising a last-kilometre freight plan for the central city.
future directionS Major initiatives in the coming year include working with the Victorian Government on the Melbourne Metro Rail project, and beginning implementation of the streetscape master plan for Elizabeth Street, including alignment with the street’s Integrated Water Cycle Management Plan.
In Melbourne, all people will be able to move freely to communicate and trade without sacrificing essential social or ecological values. Melbourne’s connections will give people access to a rich seam of opportunities.
GOAL 6a CONNECTED CITY
Future Melbourne snapshot How the city measures up as a ‘connected city’ based on: Shift to sustainable travel: proportion of trips of all purposes to and within the municipality using bus, train, tram, bicycle or walking as the main mode on weekdays and weekends.
More than two thirds of all trips to and within the municipality were made using sustainable means in 2012–13.
bus, train, tram, bicycle or on foot
* Results are from the Victorian Integrated Survey of Travel and Activity, which is different from the 2006 and 2011 Census data used in last year’s report.
12 actions for 2014-15
delivered via
6serviceareas
6strategies
/PLANS
2 progress indicators
68%
2 PROJECTED OUTCOMES
4 priorities identified
(2012-13, based on latest available data*)
TRIPS MADE BY
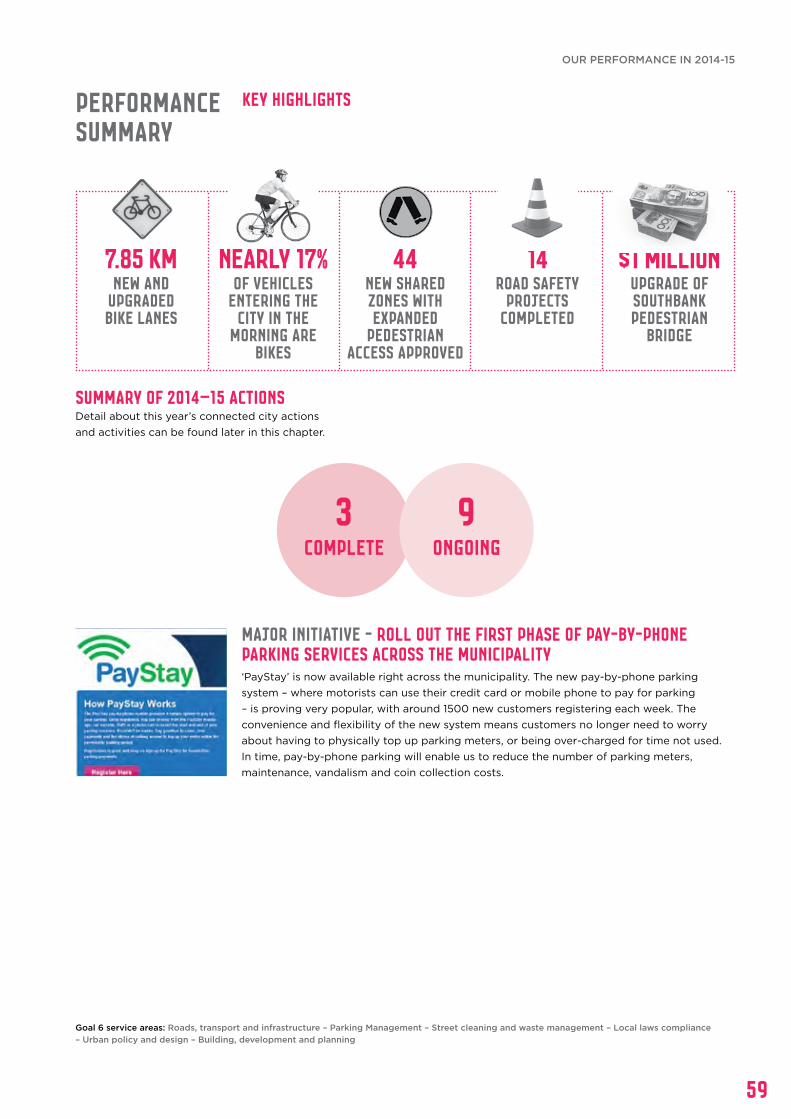
59
Goal 6 service areas: Roads, transport and infrastructure – Parking Management – Street cleaning and waste management – Local laws compliance – Urban policy and design – Building, development and planning
Performance Summary
KEY HIGHLIGHTS
Summary of 2014–15 actions Detail about this year’s connected city actions and activities can be found later in this chapter.
7.85 kmnew and
upgraded bike lanes
Nearly 17%of vehicles
entering the city in the
morning are bikes
44new shared zones with expanded
pedestrian access approved
14road safety
projects completed
$1 millionupgrade of Southbank Pedestrian
Bridge
Major Initiative - Roll out the first phase of pay-by-phone parking services across the municipality‘PayStay’ is now available right across the municipality. The new pay-by-phone parking system – where motorists can use their credit card or mobile phone to pay for parking – is proving very popular, with around 1500 new customers registering each week. The convenience and flexibility of the new system means customers no longer need to worry about having to physically top up parking meters, or being over-charged for time not used. In time, pay-by-phone parking will enable us to reduce the number of parking meters, maintenance, vandalism and coin collection costs.
9ongoing
3complete
OUR PERFORMANCE IN 2014-15

60
How we’re performing against our indicators of progressThe City of Melbourne aims for several outcomes over the four years of its Council Plan 2013–2017. We measure progress by the indicators below.
projected OUTCOME:
INDICATOR The number of street connections that allow pedestrian movement in the municipality.
Our Progress The number of pedestrian street connections is measured in two ways. The first relates to the average connections per block allowing pedestrians to travel safely from one side of the street to the other, and from one street to another, including via mid-block pedestrian crossings, lanes and arcades.
The second measure relates to the average area of footpaths, roads and nature-strips combined that is devoted to pedestrians. This year, the average connections per block and footpath space remained unchanged.
People and goods can move efficiently within the municipality
Love Your LanewayTogether with ‘Laneway Champions’ comprising local residents and businesses, the City of Melbourne is improving the use and aesthetics of laneways in high-density areas focusing on better waste and stormwater management, better access and lighting, as well as artistic and cultural use. The laneways chosen this year to undergo a makeover under the Love Your Laneway Program are AC/DC Lane, Stevenson Lane, Sniders Lane, Flinders Court, Rothsay Lane and Amphlett Lane.
0
20
40
60
80
100
2013–14 2014–15
19% 19%
Average footpath space outof total carriageway area
Average connections per block for pedestrians
0.882013-14
0.882014-15
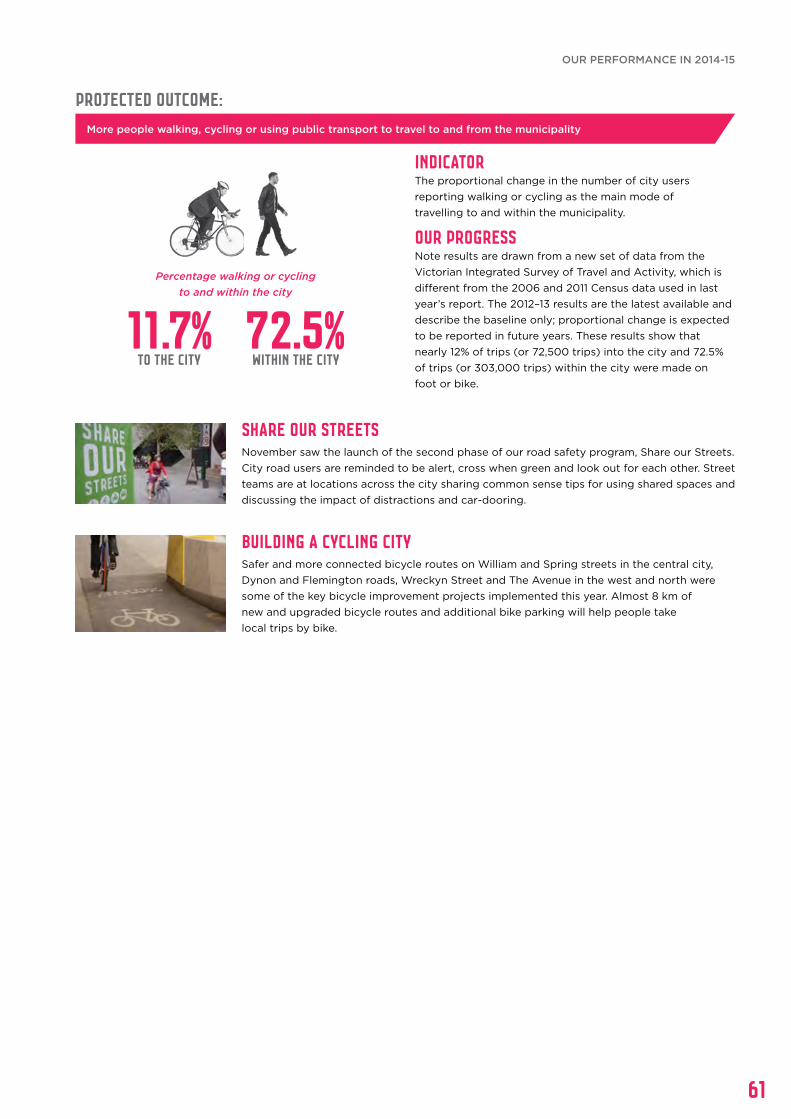
61
projected OUTCOME:
INDICATOR The proportional change in the number of city users reporting walking or cycling as the main mode of travelling to and within the municipality.
Our Progress Note results are drawn from a new set of data from the Victorian Integrated Survey of Travel and Activity, which is different from the 2006 and 2011 Census data used in last year’s report. The 2012–13 results are the latest available and describe the baseline only; proportional change is expected to be reported in future years. These results show that nearly 12% of trips (or 72,500 trips) into the city and 72.5% of trips (or 303,000 trips) within the city were made on foot or bike.
More people walking, cycling or using public transport to travel to and from the municipality
Share Our StreetsNovember saw the launch of the second phase of our road safety program, Share our Streets. City road users are reminded to be alert, cross when green and look out for each other. Street teams are at locations across the city sharing common sense tips for using shared spaces and discussing the impact of distractions and car-dooring.
Building a cycling city Safer and more connected bicycle routes on William and Spring streets in the central city, Dynon and Flemington roads, Wreckyn Street and The Avenue in the west and north were some of the key bicycle improvement projects implemented this year. Almost 8 km of new and upgraded bicycle routes and additional bike parking will help people take local trips by bike.
TO the city11.7%
within the city72.5%
Percentage walking or cycling to and within the city
OUR PERFORMANCE IN 2014-15

62
Expand and prioritise a connected, safe and easy to access pedestrian network
• Implement the Walking Plan including planning scheme amendments to support through-block links and other pedestrian network benefits
• Implement actions from the Walking Plan including upgrading pedestrian traffic signals along Elizabeth Street, Exhibition Street and Russell Street, installing new zebra crossings within the central city and across the municipality, installing new shared zones within the central city and lowering speed limits on local Kensington roads to 40km/h
• Exhibit a planning scheme amendment to require, in future, walking links through city blocks
Make the municipality more bicycle friendly through our Bicycle Plan 2012-16 and endorse a new bicycle plan by March 2016
• Implement year three actions of the bike plan including capital works on:
– Lorimer Street and Dynon Road shared paths
– Spring Street, The Avenue, Gisborne Street, Albert Street-to-La Trobe Street connection
– Arden Street route and pedestrian/bicycle bridge
– Leveson Street at Courtney Street
– Smithfield Epsom and Macaulay Roads upgrades
– Flemington Road separated lanes
– Queensbridge Street-to-Market Street and Bridge Road-to-Yarra Park connections
– Elizabeth Street and Chelmsford contra-flow
– bike corrals
• Complete the Bike Plan 2012–16, including Year 4 projects such as the installation of Arden Street, Epsom Road and Smithfield Road bike lanes and the installation of additional bike hoops and bike corrals across the municipality, as well as outstanding actions carried over from the previous years
Our 4-year priorities are... Our 2014–15 focus was… Over the next year we will...
Great streets make great cities
Each year our Streetscape Improvements Program aims to enhance the city’s streets and laneways through road and footpath works, landscaping and other improvements. This year more than $4 million was spent on improvements in Elizabeth Street, Lonsdale Street, Spencer Street, Little Lonsdale Street, Literature Lane, Westwood Place, Brights Place, Healeys Lane and Crombie Lane.
Drainage upgradeAs part of our ongoing flood mitigation works, the stormwater drain beneath the busy intersection of King and Collins streets was recently upgraded. The project was undertaken over a single weekend and involved intensive, close, around-the-clock co-operation between Citywide, VicRoads, Yarra Trams and City of Melbourne engineering officers.
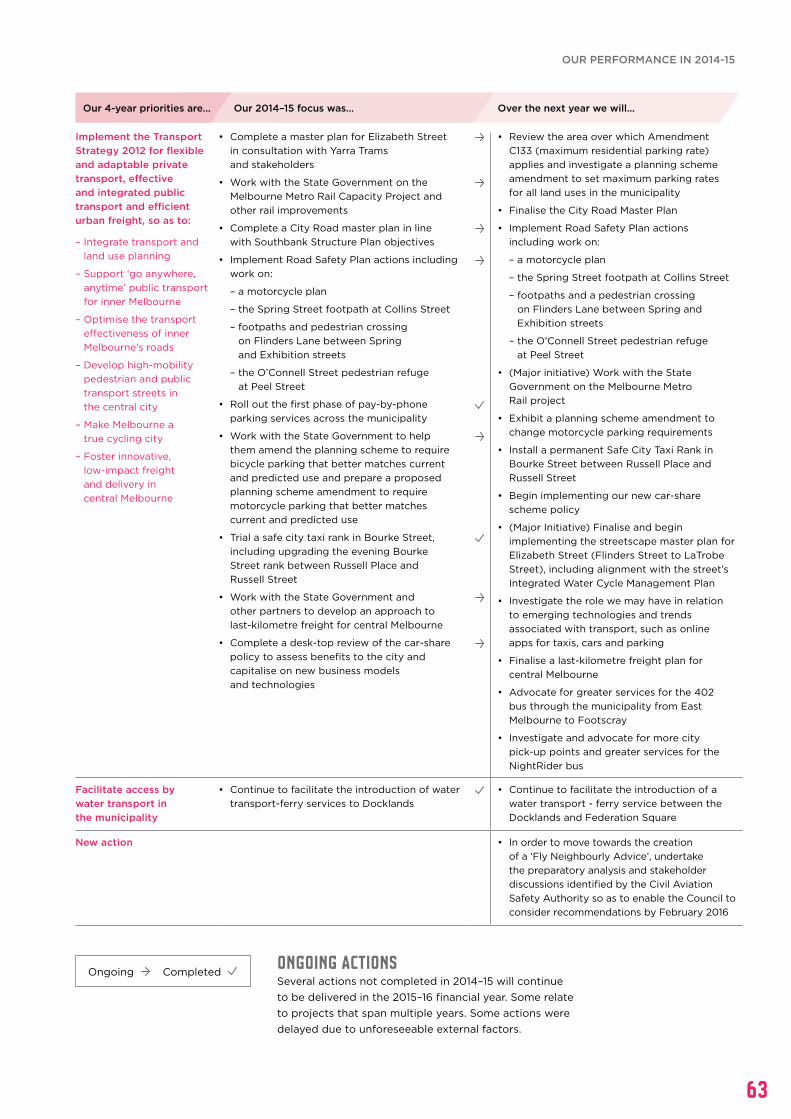
63
Implement the Transport Strategy 2012 for flexible and adaptable private transport, effective and integrated public transport and efficient urban freight, so as to:
– Integrate transport and land use planning
– Support ‘go anywhere, anytime’ public transport for inner Melbourne
– Optimise the transport effectiveness of inner Melbourne’s roads
– Develop high-mobility pedestrian and public transport streets in the central city
– Make Melbourne a true cycling city
– Foster innovative, low-impact freight and delivery in central Melbourne
• Complete a master plan for Elizabeth Street in consultation with Yarra Trams and stakeholders
• Work with the State Government on the Melbourne Metro Rail Capacity Project and other rail improvements
• Complete a City Road master plan in line with Southbank Structure Plan objectives
• Implement Road Safety Plan actions including work on:
– a motorcycle plan
– the Spring Street footpath at Collins Street
– footpaths and pedestrian crossing on Flinders Lane between Spring and Exhibition streets
– the O’Connell Street pedestrian refuge at Peel Street
• Roll out the first phase of pay-by-phone parking services across the municipality
• Work with the State Government to help them amend the planning scheme to require bicycle parking that better matches current and predicted use and prepare a proposed planning scheme amendment to require motorcycle parking that better matches current and predicted use
• Trial a safe city taxi rank in Bourke Street, including upgrading the evening Bourke Street rank between Russell Place and Russell Street
• Work with the State Government and other partners to develop an approach to last-kilometre freight for central Melbourne
• Complete a desk-top review of the car-share policy to assess benefits to the city and capitalise on new business models and technologies
• Review the area over which Amendment C133 (maximum residential parking rate) applies and investigate a planning scheme amendment to set maximum parking rates for all land uses in the municipality
• Finalise the City Road Master Plan
• Implement Road Safety Plan actions including work on:
– a motorcycle plan
– the Spring Street footpath at Collins Street
– footpaths and a pedestrian crossing on Flinders Lane between Spring and Exhibition streets
– the O’Connell Street pedestrian refuge at Peel Street
• (Major initiative) Work with the State Government on the Melbourne Metro Rail project
• Exhibit a planning scheme amendment to change motorcycle parking requirements
• Install a permanent Safe City Taxi Rank in Bourke Street between Russell Place and Russell Street
• Begin implementing our new car-share scheme policy
• (Major Initiative) Finalise and begin implementing the streetscape master plan for Elizabeth Street (Flinders Street to LaTrobe Street), including alignment with the street’s Integrated Water Cycle Management Plan
• Investigate the role we may have in relation to emerging technologies and trends associated with transport, such as online apps for taxis, cars and parking
• Finalise a last-kilometre freight plan for central Melbourne
• Advocate for greater services for the 402 bus through the municipality from East Melbourne to Footscray
• Investigate and advocate for more city pick-up points and greater services for the NightRider bus
Facilitate access by water transport in the municipality
• Continue to facilitate the introduction of water transport-ferry services to Docklands
• Continue to facilitate the introduction of a water transport - ferry service between the Docklands and Federation Square
New action • In order to move towards the creation of a ‘Fly Neighbourly Advice’, undertake the preparatory analysis and stakeholder discussions identified by the Civil Aviation Safety Authority so as to enable the Council to consider recommendations by February 2016
Our 4-year priorities are... Our 2014–15 focus was… Over the next year we will...
ONGOING ACTIONS Several actions not completed in 2014–15 will continue to be delivered in the 2015–16 financial year. Some relate to projects that span multiple years. Some actions were delayed due to unforeseeable external factors.
Ongoing Completed
OUR PERFORMANCE IN 2014-15

64
OVERVIEW OUR APPROACHAs an organisation, the City of Melbourne aims to constantly improve what we deliver and how we deliver it. We strive to make everything we do easier, better, faster and cheaper for our customers, gaining more value from our limited resources. Ensuring our ‘resources are managed well’ is about making sure we are financially sustainable as an organisation, our customers are satisfied with the service they receive and that we attract, retain and develop the workforce we need.
issues and challenges Third-party factors have slightly delayed the completion of a feasibility study for the future use of Council-owned land known as the Council House precinct and consideration of the study’s findings will occur in the new year. The work on a People Strategy will continue into the new year and be refocused to reflect the change in direction following our Organisational Capability Review.
future directionS A major initiative in the coming year is developing a Town Hall Precinct Plan, including considering options such as library services and exhibition space for city memorabilia.
An organisation that manages its resources well will use what it has available efficiently and effectively to achieve its goals and ensure the community will continue to grow and prosper locally, nationally and internationally.
GOAL 7resources are managed well
As an organisation where ‘resources are managed well’ we continue to look for ways to achieve this in every facet of what we do. Find out more on how we apply this approach throughout our business in these sections:
• Continuous improvement (page 80)
• Our people (pages 81 to 87) describing our approach to fostering a talented, engaged workforce as well as safe and diverse workplace
• Our procurement and supply chain (page 95).
10serviceareas
9strategies
/PLANS
3 PROJECTED OUTCOMES
4 progress indicators
7 actions for 2013-14
5 priorities identified
delivered via

65
Goal 7 service areas: Finance – Information technology – Customer relations – Human resources – Learning and development – Property and assets – Building, development and planning – Lean thinking – Corporate planning and performance – Sustainability
Performance SummaryKEY HIGHLIGHTS
IBACgold starrating for City of Melbourne’s
protected disclosure procedures
AWARD.Procurement
Australia Award for City of
Melbourne’s sustainable
procurement
90 hoursper year – customer
time saved by streamlining permits for
events
200 hoursper year –
staff time saved by streamlining
planning and building permits
First10-Year
Financial Plan developed
Summary of 2014–15 actions Detail about this year’s actions and activities to ensure resources are managed well can be found later in this chapter.
Major initiative - Implement the community engagement process agreed for the 10-Year Financial Plan
In a bold move to engage citizens in local democracy, the City of Melbourne invited a representative panel of 43 residents and business owners, selected by random sample, to recommend how the Council should manage its spending and revenue over the next 10 years. The ‘People’s Panel’ met five times from August to November 2014 and delivered 11 key recommendations on a range of issues from planning for more public open space to continuing to deliver a high standard of services and the redevelopment of the Queen Victoria Market. In arriving at its recommendations, the panel called on experts and considered the views of the community gathered from broader engagement. On 30 June, the Council unanimously endorsed its first 10-Year Financial Plan, which reflects most of the panel’s recommendations.
3ongoing
4complete
OUR PERFORMANCE IN 2014-15
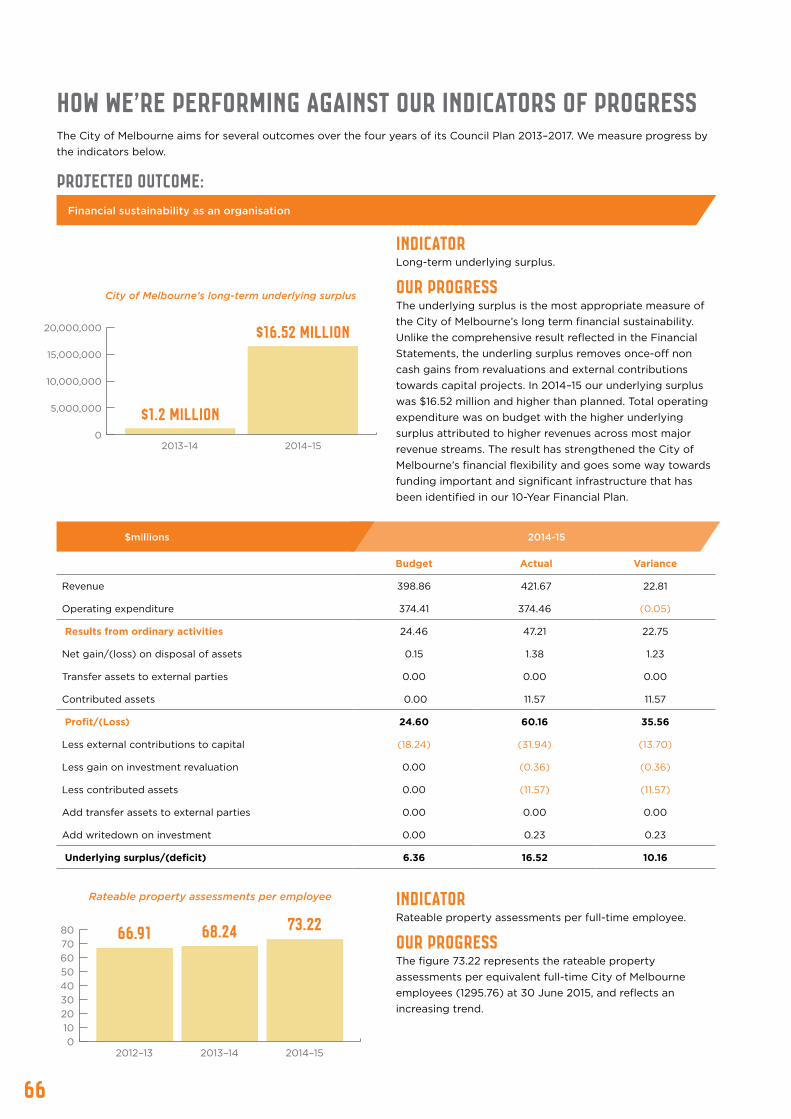
66
How we’re performing against our indicators of progressThe City of Melbourne aims for several outcomes over the four years of its Council Plan 2013–2017. We measure progress by the indicators below.
projected OUTCOME:
INDICATOR Long-term underlying surplus.
Our Progress The underlying surplus is the most appropriate measure of the City of Melbourne’s long term financial sustainability. Unlike the comprehensive result reflected in the Financial Statements, the underling surplus removes once-off non cash gains from revaluations and external contributions towards capital projects. In 2014–15 our underlying surplus was $16.52 million and higher than planned. Total operating expenditure was on budget with the higher underlying surplus attributed to higher revenues across most major revenue streams. The result has strengthened the City of Melbourne’s financial flexibility and goes some way towards funding important and significant infrastructure that has been identified in our 10-Year Financial Plan.
INDICATOR Rateable property assessments per full-time employee.
Our Progress The figure 73.22 represents the rateable property assessments per equivalent full-time City of Melbourne employees (1295.76) at 30 June 2015, and reflects an increasing trend.
Financial sustainability as an organisation
2014-15$millions
Budget Actual Variance
Revenue 398.86 421.67 22.81
Operating expenditure 374.41 374.46 (0.05)
Results from ordinary activities 24.46 47.21 22.75
Net gain/(loss) on disposal of assets 0.15 1.38 1.23
Transfer assets to external parties 0.00 0.00 0.00
Contributed assets 0.00 11.57 11.57
Profit/(Loss) 24.60 60.16 35.56
Less external contributions to capital (18.24) (31.94) (13.70)
Less gain on investment revaluation 0.00 (0.36) (0.36)
Less contributed assets 0.00 (11.57) (11.57)
Add transfer assets to external parties 0.00 0.00 0.00
Add writedown on investment 0.00 0.23 0.23
Underlying surplus/(deficit) 6.36 16.52 10.16
0
5,000,000
10,000,000
15,000,000
20,000,000
2013–14 2014–15
$1.2 million
$16.52 million
City of Melbourne’s long-term underlying surplus
01020304050607080
2012–13 2013–14 2014–15
66.91 68.24 73.22
Rateable property assessments per employee

67
projected OUTCOME:
INDICATOR Customer satisfaction with how City of Melbourne staff deliver services.
Our Progress The score of 73 out of a possible 100 is drawn from an annual survey by the Department of Transport, Planning and Local Infrastructure of residents’ satisfaction with their local council’s customer service performance. This year’s result reflects a non-statistically significant decrease of one point from last year.
Customers who are satisfied with the service they receive
Success for Indigenous Trainee ProgramFor the second year running, a City of Melbourne trainee was nominated for the Aplus Koori Trainee of the Year. Congratulations to City of Melbourne Indigenous trainee graduate Bridget Caldwell. Bridget completed her 12-month traineeship in the Human Resources team in February 2014 and was successful in obtaining a fixed-term role in the same area until February 2015. This year three Indigenous trainees completed their traineeships in the Human Resources, Engineering Services and Community Services teams.
projected OUTCOME:
INDICATOR Staff retention rate / workforce turnover.
Our Progress Our workforce turnover rate (including voluntary and involuntary turnover) for all staff types this year was almost 17%, up from the previous year.
The attraction, retention and development of the workforce we need
0
20
40
60
80
100
2013–14 2014–15
Customer satisfaction with our services
74 73
0
10
20
30
40
50
total turnover voluntary turnover
13.22% 16.99%7.83%6.28%
Workforce turnover rate
2012-13 2014-15 2012-13 2014-15
OUR PERFORMANCE IN 2014-15
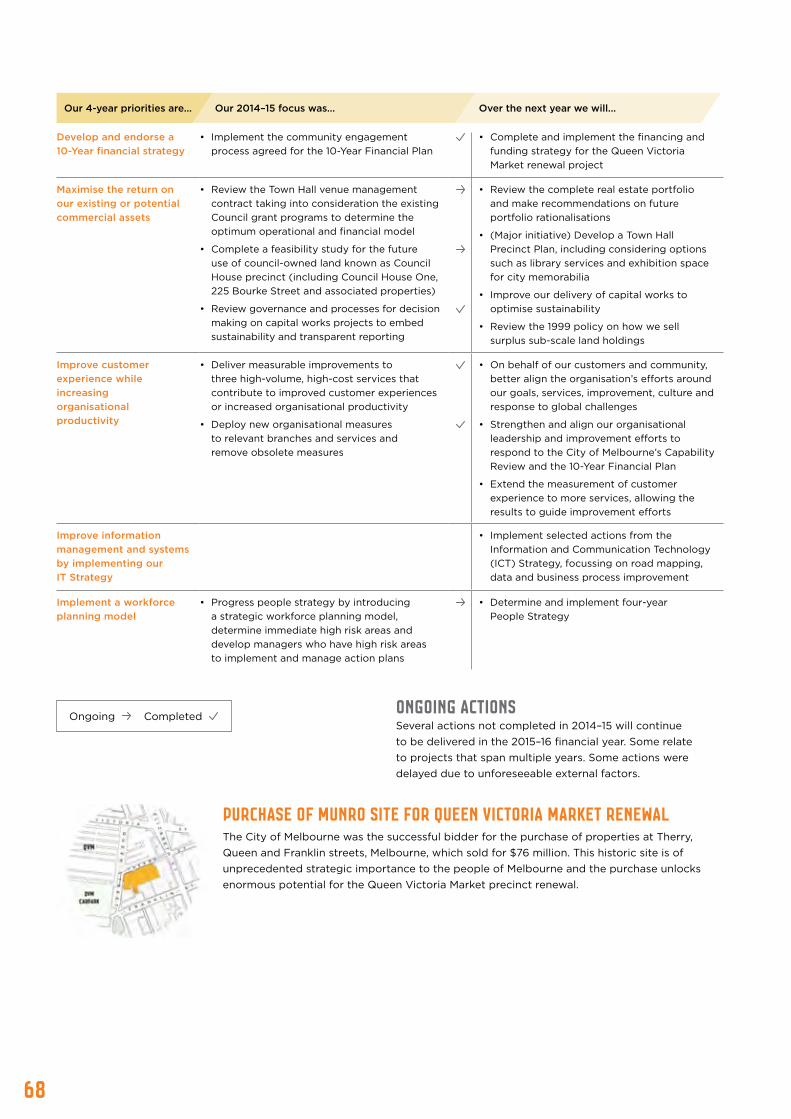
68
Develop and endorse a 10-Year financial strategy
• Implement the community engagement process agreed for the 10-Year Financial Plan
• Complete and implement the financing and funding strategy for the Queen Victoria Market renewal project
Maximise the return on our existing or potential commercial assets
• Review the Town Hall venue management contract taking into consideration the existing Council grant programs to determine the optimum operational and financial model
• Complete a feasibility study for the future use of council-owned land known as Council House precinct (including Council House One, 225 Bourke Street and associated properties)
• Review governance and processes for decision making on capital works projects to embed sustainability and transparent reporting
• Review the complete real estate portfolio and make recommendations on future portfolio rationalisations
• (Major initiative) Develop a Town Hall Precinct Plan, including considering options such as library services and exhibition space for city memorabilia
• Improve our delivery of capital works to optimise sustainability
• Review the 1999 policy on how we sell surplus sub-scale land holdings
Improve customer experience while increasing organisational productivity
• Deliver measurable improvements to three high-volume, high-cost services that contribute to improved customer experiences or increased organisational productivity
• Deploy new organisational measures to relevant branches and services and remove obsolete measures
• On behalf of our customers and community, better align the organisation’s efforts around our goals, services, improvement, culture and response to global challenges
• Strengthen and align our organisational leadership and improvement efforts to respond to the City of Melbourne’s Capability Review and the 10-Year Financial Plan
• Extend the measurement of customer experience to more services, allowing the results to guide improvement efforts
Improve information management and systems by implementing our IT Strategy
• Implement selected actions from the Information and Communication Technology (ICT) Strategy, focussing on road mapping, data and business process improvement
Implement a workforce planning model
• Progress people strategy by introducing a strategic workforce planning model, determine immediate high risk areas and develop managers who have high risk areas to implement and manage action plans
• Determine and implement four-year People Strategy
Our 4-year priorities are... Our 2014–15 focus was… Over the next year we will...
ONGOING ACTIONS Several actions not completed in 2014–15 will continue to be delivered in the 2015–16 financial year. Some relate to projects that span multiple years. Some actions were delayed due to unforeseeable external factors.
Ongoing Completed
Purchase of Munro site for Queen Victoria Market renewalThe City of Melbourne was the successful bidder for the purchase of properties at Therry, Queen and Franklin streets, Melbourne, which sold for $76 million. This historic site is of unprecedented strategic importance to the people of Melbourne and the purchase unlocks enormous potential for the Queen Victoria Market precinct renewal.
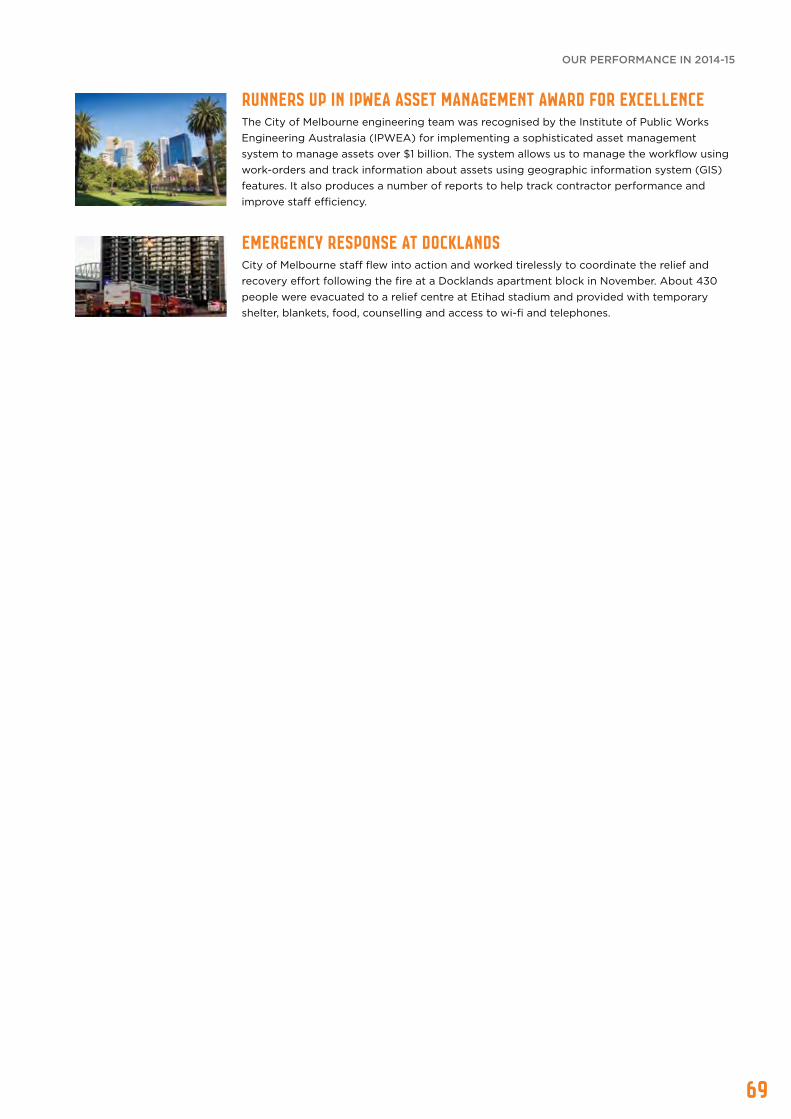
69
Emergency response at DocklandsCity of Melbourne staff flew into action and worked tirelessly to coordinate the relief and recovery effort following the fire at a Docklands apartment block in November. About 430 people were evacuated to a relief centre at Etihad stadium and provided with temporary shelter, blankets, food, counselling and access to wi-fi and telephones.
Runners up in IPWEA Asset Management Award for ExcellenceThe City of Melbourne engineering team was recognised by the Institute of Public Works Engineering Australasia (IPWEA) for implementing a sophisticated asset management system to manage assets over $1 billion. The system allows us to manage the workflow using work-orders and track information about assets using geographic information system (GIS) features. It also produces a number of reports to help track contractor performance and improve staff efficiency.
OUR PERFORMANCE IN 2014-15
70
OVERVIEW OUR APPROACHAs an organisation, the City of Melbourne strives to improve opportunities for the community to participate in and engage with our decision-making. We seek to share information about our decisions and performance with our community. Ensuring we are an ‘accessible, transparent and responsive organisation’ is about increasing public disclosure of and access to information to become one of the most transparent councils in Australia, fostering a more involved community as well as a better informed community.
issues and challenges The delivery of mobile, accessible, transparent and engaging digital communications covering the corporate website and internal web content is a multi-year project that will continue into the new year.
future directionS A major initiative in the coming year will be to consolidate and redevelop the corporate website as part of the digital transformation program.
An accessible, transparent and responsive organisation is willing to share what it has done and why it has done it with people who need to know. It acts in a professional, timely manner and ensures the community can feel a sense of pride in its operations.
GOAL 8an accessible, transparentand responsive organisation
To become an ‘accessible, transparent and responsive organisation’ we continue to look for ways to achieve this in every facet of what we do. Find out more on how we apply this approach in different areas of our business in these sections:
• Involving the community in our decisions (pages 78 to 79), demonstrating our commitment to being accessible and responsive to our community
• Our reporting approach (pages 98 to 99), describing how we have improved the transparency of our reporting.
6 actions for 2014-15
delivered via
5serviceareas
3strategies
/PLANS
7 progress indicators
3 PROJECTED OUTCOMES
3 priorities identified
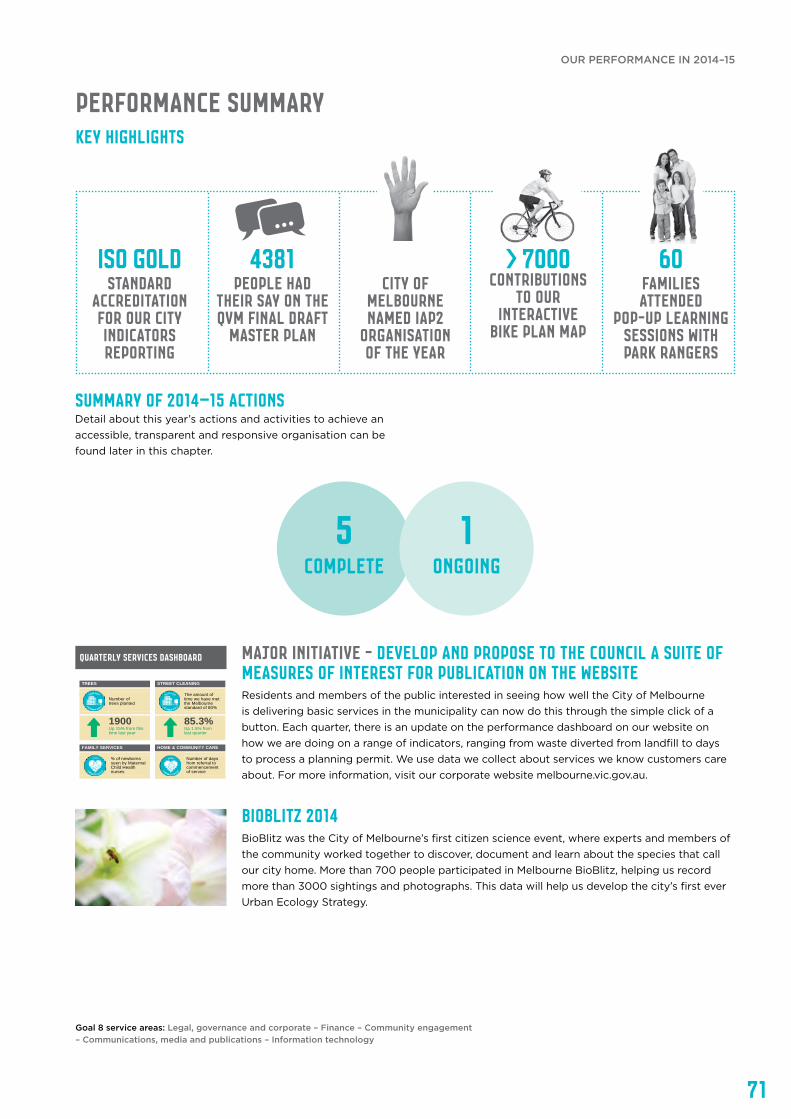
71
ISO goldstandard
accreditation for our city indicators reporting
4381people had
their say on the QVM Final Draft
Master Plan
City of Melbourne named IAP2
Organisation of the Year
> 7000 contributions
to our interactive
Bike Plan map
60families attended
pop-up learning sessions with park rangers
Summary of 2014–15 actions Detail about this year’s actions and activities to achieve an accessible, transparent and responsive organisation can be found later in this chapter.
Performance SummaryKEY HIGHLIGHTS
Goal 8 service areas: Legal, governance and corporate – Finance – Community engagement – Communications, media and publications – Information technology
Major initiative - Develop and propose to the Council a suite of measures of interest for publication on the websiteResidents and members of the public interested in seeing how well the City of Melbourne is delivering basic services in the municipality can now do this through the simple click of a button. Each quarter, there is an update on the performance dashboard on our website on how we are doing on a range of indicators, ranging from waste diverted from landfill to days to process a planning permit. We use data we collect about services we know customers care about. For more information, visit our corporate website melbourne.vic.gov.au.
BioBlitz 2014BioBlitz was the City of Melbourne’s first citizen science event, where experts and members of the community worked together to discover, document and learn about the species that call our city home. More than 700 people participated in Melbourne BioBlitz, helping us record more than 3000 sightings and photographs. This data will help us develop the city’s first ever Urban Ecology Strategy.
QUARTERLY SERVICES DASHBOARD
TREES STREET CLEANING WASTE COLLECTION
Number of trees planted
The amount of time we have met the Melbourne standard of 80%
% of bins missed per households serviced
1900 Up 15% from this time last year
85.3% Up 1.5% from last quarter
0.57% Down 0.15% from last quarter
FAMILY SERVICES HOME & COMMUNITY CARE RECREATION CENTRES
% of newborns seen by Maternal Child Health nurses
Number of days from referral to commencement of service
Number of memberships
99.5 Down 0.5% from last quarter
15 Down 1 day from last quarter
5238 Up 6% from last quarter
PLANNING PERMITS HEALTH INSPECTIONS TOURISM
Number of days to process planning permit applications
Number of food premises inspected
Number of visitor contacts (includes visitor centre, booth, shuttle and city ambassador program)
63 Up 2 days from last quarter
997 Up 17% from last quarter
437,060 Up 5% from last quarter
IMPROVEMENT HIGHLIGHT
Fundraising permits allow charities to collect money on our footpaths. Handbill permits offer businesses the opportunity to distribute printed materials. A new online system for both permit types has cut the processing time by 90% (from 20 minutes to two) and waiting time from 4 days to on-the-spot. In the process we have released 129 hours of staff time a year to invest in other services we provide. This is better and easier for our customers.
EASIER
BETTER
1ongoing
5complete
OUR PERFORMANCE IN 2014–15
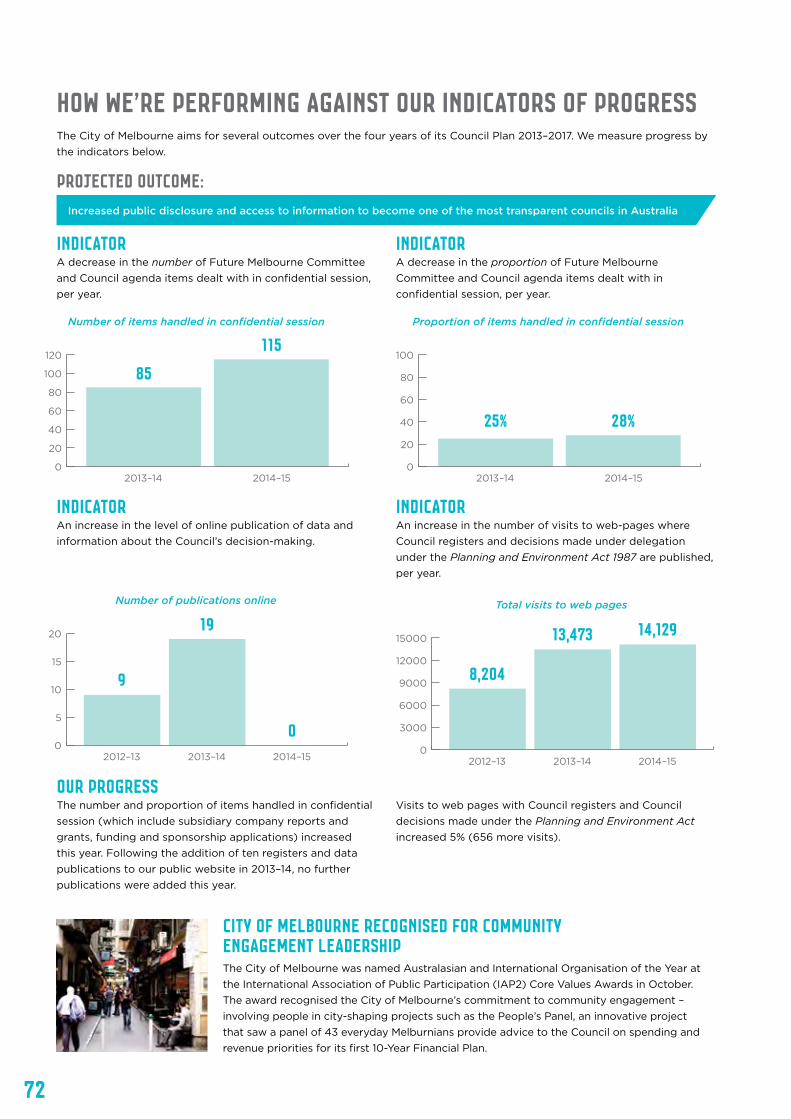
72
How we’re performing against our indicators of progressThe City of Melbourne aims for several outcomes over the four years of its Council Plan 2013–2017. We measure progress by the indicators below.
projected OUTCOME:
INDICATOR A decrease in the number of Future Melbourne Committee and Council agenda items dealt with in confidential session, per year.
INDICATOR A decrease in the proportion of Future Melbourne Committee and Council agenda items dealt with in confidential session, per year.
INDICATOR An increase in the level of online publication of data and information about the Council’s decision-making.
INDICATOR An increase in the number of visits to web-pages where Council registers and decisions made under delegation under the Planning and Environment Act 1987 are published, per year.
Our Progress The number and proportion of items handled in confidential session (which include subsidiary company reports and grants, funding and sponsorship applications) increased this year. Following the addition of ten registers and data publications to our public website in 2013–14, no further publications were added this year.
Visits to web pages with Council registers and Council decisions made under the Planning and Environment Act increased 5% (656 more visits).
Increased public disclosure and access to information to become one of the most transparent councils in Australia
City of Melbourne recognised for community engagement leadershipThe City of Melbourne was named Australasian and International Organisation of the Year at the International Association of Public Participation (IAP2) Core Values Awards in October. The award recognised the City of Melbourne’s commitment to community engagement – involving people in city-shaping projects such as the People’s Panel, an innovative project that saw a panel of 43 everyday Melburnians provide advice to the Council on spending and revenue priorities for its first 10-Year Financial Plan.
0
20
40
60
80
100
120
2013–14 2014–15
85115
Number of items handled in confidential session
0
5
10
15
20
2012–13 2013–14 2014–15
9
19
0
Number of publications online
0
20
40
60
80
100
2013–14 2014–15
25% 28%
Proportion of items handled in confidential session
0
3000
6000
9000
12000
15000
2012–13 2013–14 2014–15
8,204
13,473 14,129Total visits to web pages
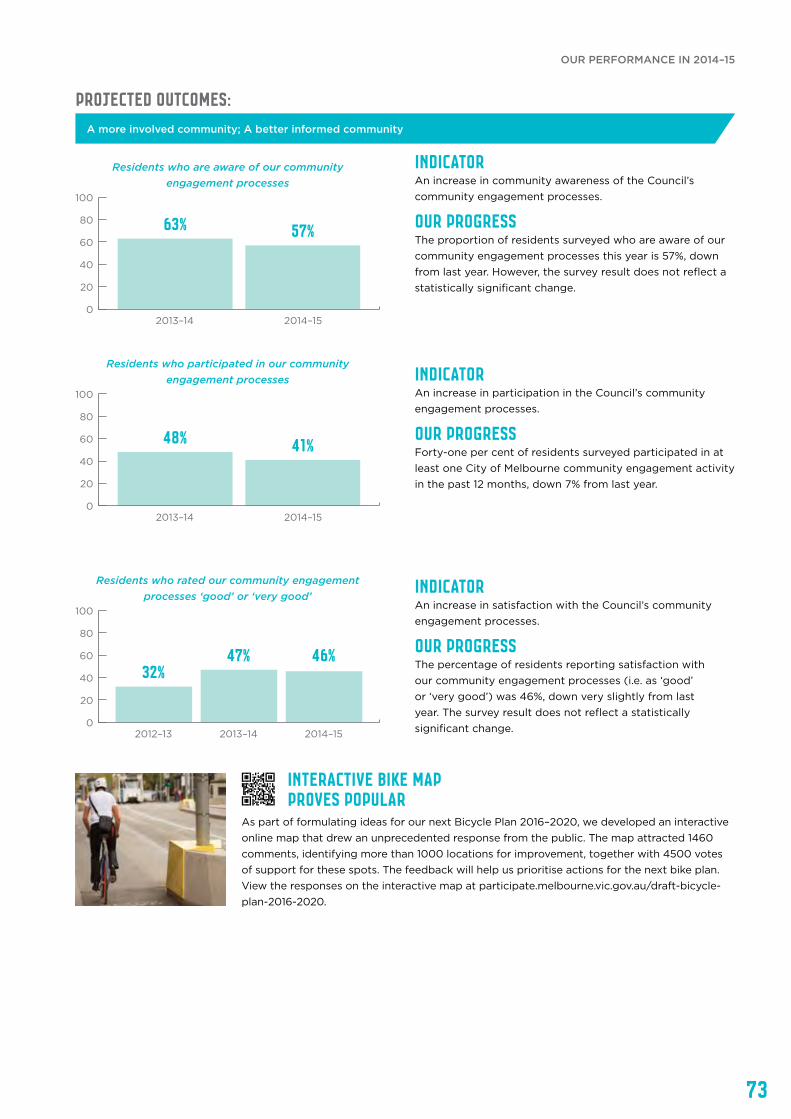
73
projected OUTCOMES:
INDICATOR An increase in community awareness of the Council’s community engagement processes.
Our Progress The proportion of residents surveyed who are aware of our community engagement processes this year is 57%, down from last year. However, the survey result does not reflect a statistically significant change.
INDICATOR An increase in participation in the Council’s community engagement processes.
Our Progress Forty-one per cent of residents surveyed participated in at least one City of Melbourne community engagement activity in the past 12 months, down 7% from last year.
INDICATOR An increase in satisfaction with the Council’s community engagement processes.
Our Progress The percentage of residents reporting satisfaction with our community engagement processes (i.e. as ‘good’ or ‘very good’) was 46%, down very slightly from last year. The survey result does not reflect a statistically significant change.
A more involved community; A better informed community
Interactive bike map proves popular
As part of formulating ideas for our next Bicycle Plan 2016–2020, we developed an interactive online map that drew an unprecedented response from the public. The map attracted 1460 comments, identifying more than 1000 locations for improvement, together with 4500 votes of support for these spots. The feedback will help us prioritise actions for the next bike plan. View the responses on the interactive map at participate.melbourne.vic.gov.au/draft-bicycle-plan-2016-2020.
0
20
40
60
80
100
2013–14 2014–15
63% 57%
Residents who are aware of our communityengagement processes
0
20
40
60
80
100
2013–14 2014–15
48% 41%
Residents who participated in our community engagement processes
0
20
40
60
80
100
2012–13 2013–14 2014–15
32%47% 46%
Residents who rated our community engagement processes ‘good’ or ‘very good’
OUR PERFORMANCE IN 2014–15

74
Improve transparency by increasing accessibility to information, advice or consultation we consider when making decisions
• Implement an online system for disclosing public submissions to Future Melbourne Committee and Council meetings
• Develop and propose to the Council a suite of measures of interest for publication on the website
• Publish on the website a list of City of Melbourne properties valued over $5 million
• Test and embed a framework to improve the way we commission, develop, implement, report and evaluate organisational strategies
Continue to increase and improve opportunities for our community to participate and engage with us
• Evaluate the results of community engagement forums, our community engagement audit and community engagement research and implement the findings
• Continue to implement recommendations from the community engagement audit
• Plan and run three developer forums to improve communication with the development industry and increase our contribution to public debate about planning and major development applications
• Refresh the Future Melbourne Community Plan based on the long-term challenges and opportunities facing the city and aspirations of the community
Make our information and data accessible to our community and stakeholders where possible
• Deliver mobile, accessible, transparent and engaging digital communications via:
– a redeveloped corporate site (including all current sub-sites) supported by a new governance framework and processes
– a redeveloped intranet
– a redeveloped service directory
– improved functionality (based on a new content management system)
– content renewal and migration based on a content strategy
• Continue to build our capacity to engage our community and stakeholders via digital channels (e.g. Participate Melbourne)
• (Major initiative) As part of the digital transformation program, consolidate and redevelop the corporate website; redevelop the service directory
• Produce a public year-end media report
Our 4-year priorities are... Our 2014–15 focus was... Over the next year we will...
ONGOING ACTIONS One action relating to the delivery of digital communications not completed in 2014–15 will continue to be delivered in the 2015–16 financial year. The project was re-scoped following review.
Ongoing Completed
Gold standard on City DataThe City of Melbourne was awarded a gold standard accreditation for its reporting of indicators of city services and quality of life under the new international standard ISO 37120. The indicators demonstrate Melbourne’s sustainable development of communities and commitment to comparable reporting of open data. We are among the first 20 cities in the world to join this new ISO program and the first Australian city.
OUR ORGANISATION
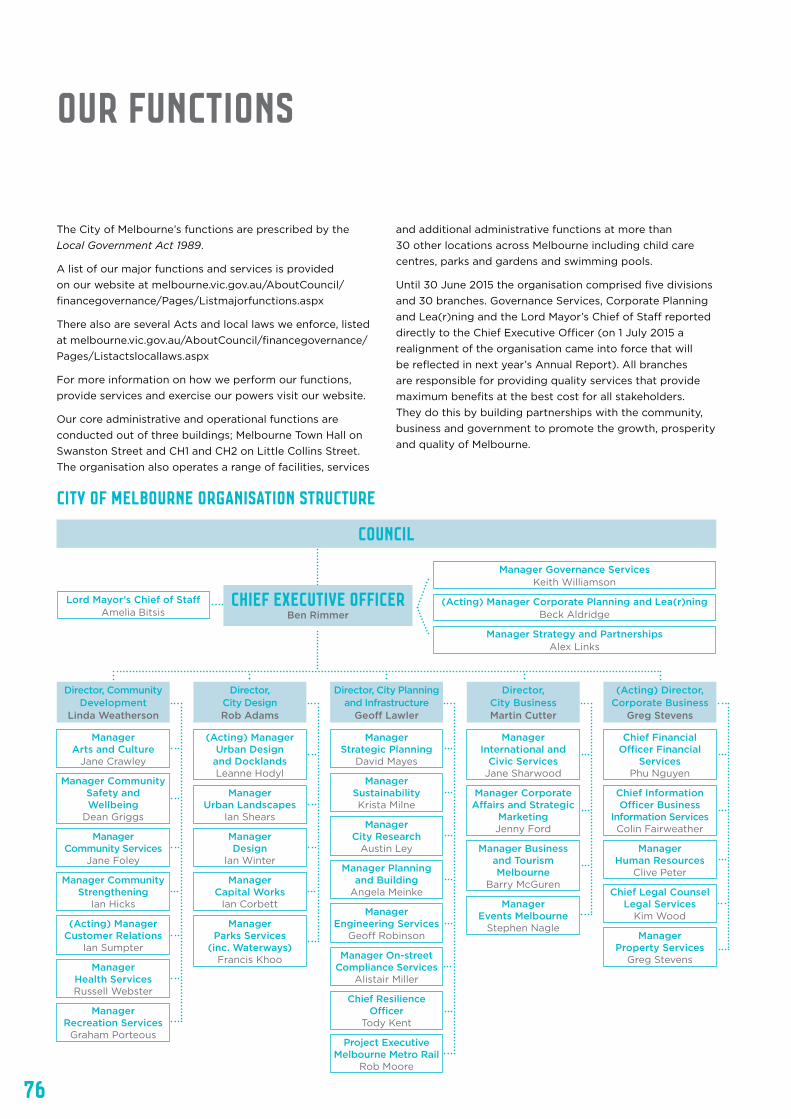
76
Director, Community Development
Linda Weatherson
Director, City Design Rob Adams
Director, City Planning and Infrastructure
Geoff Lawler
Director, City Business Martin Cutter
(Acting) Director, Corporate Business
Greg Stevens
Chief Executive OfficerBen Rimmer
Council
OUR FUNCTIONS
The City of Melbourne’s functions are prescribed by the Local Government Act 1989.
A list of our major functions and services is provided on our website at melbourne.vic.gov.au/AboutCouncil/ financegovernance/Pages/Listmajorfunctions.aspx
There also are several Acts and local laws we enforce, listed at melbourne.vic.gov.au/AboutCouncil/financegovernance/Pages/Listactslocallaws.aspx
For more information on how we perform our functions, provide services and exercise our powers visit our website.
Our core administrative and operational functions are conducted out of three buildings; Melbourne Town Hall on Swanston Street and CH1 and CH2 on Little Collins Street. The organisation also operates a range of facilities, services
and additional administrative functions at more than 30 other locations across Melbourne including child care centres, parks and gardens and swimming pools.
Until 30 June 2015 the organisation comprised five divisions and 30 branches. Governance Services, Corporate Planning and Lea(r)ning and the Lord Mayor’s Chief of Staff reported directly to the Chief Executive Officer (on 1 July 2015 a realignment of the organisation came into force that will be reflected in next year’s Annual Report). All branches are responsible for providing quality services that provide maximum benefits at the best cost for all stakeholders. They do this by building partnerships with the community, business and government to promote the growth, prosperity and quality of Melbourne.
Lord Mayor’s Chief of StaffAmelia Bitsis
Manager Governance ServicesKeith Williamson
(Acting) Manager Corporate Planning and Lea(r)ning Beck Aldridge
Manager Strategy and Partnerships Alex Links
Manager Arts and Culture
Jane Crawley
(Acting) Manager Urban Design
and Docklands Leanne Hodyl
Manager Strategic Planning
David Mayes
Manager International and
Civic Services Jane Sharwood
Chief Financial Officer Financial
Services Phu Nguyen
Manager Community Strengthening
Ian Hicks
Manager Capital Works
Ian Corbett
Manager Planning and Building
Angela MeinkeManager
Events Melbourne Stephen Nagle
Chief Legal Counsel Legal Services
Kim Wood
Manager Community Safety and Wellbeing
Dean Griggs
Manager Urban Landscapes
Ian Shears
Manager Sustainability Krista Milne
Manager Corporate Affairs and Strategic
Marketing Jenny Ford
Chief Information Officer Business
Information Services Colin Fairweather
(Acting) Manager Customer Relations
Ian Sumpter
Manager Parks Services
(inc. Waterways) Francis Khoo
Manager Engineering Services
Geoff Robinson Manager Property Services
Greg Stevens
Manager Community Services
Jane Foley
Manager Design
Ian Winter
Manager City Research
Austin Ley Manager Business and Tourism Melbourne
Barry McGuren
Manager Human Resources
Clive Peter
Manager Health Services Russell Webster
Manager Recreation Services
Graham Porteous
Manager On-street Compliance Services
Alistair Miller
Chief Resilience Officer
Tody Kent
Project Executive Melbourne Metro Rail
Rob Moore
City of Melbourne Organisation structure
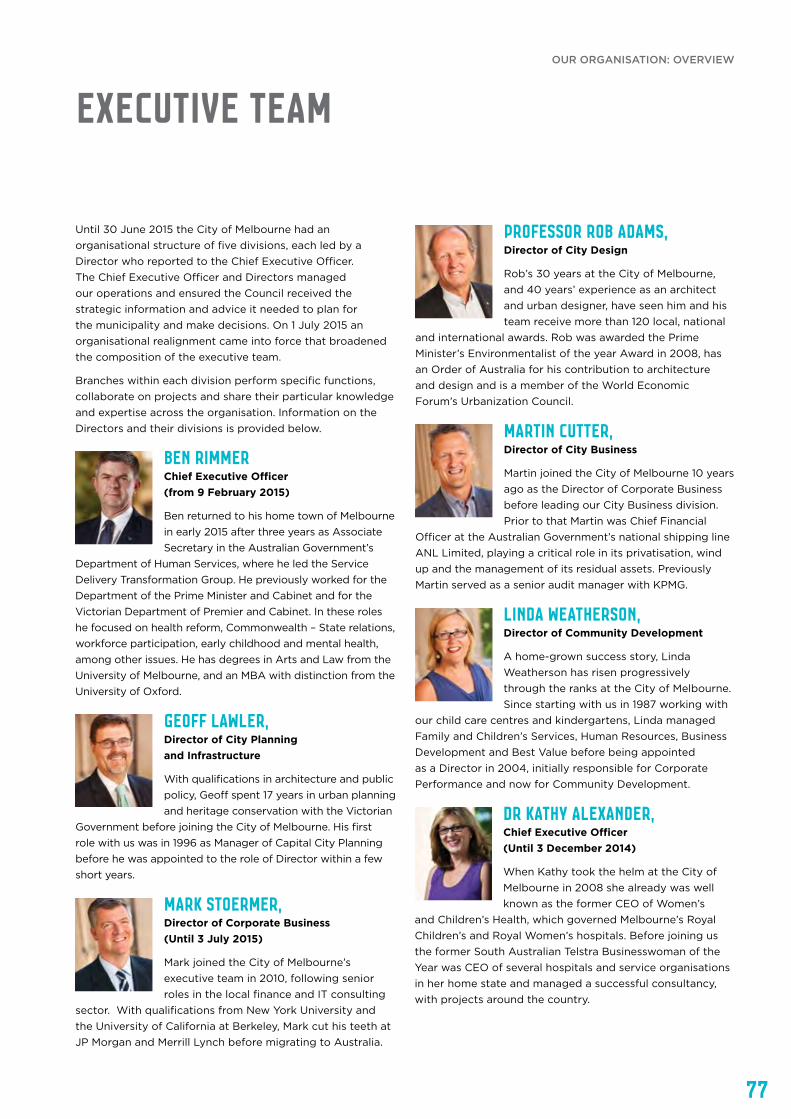
77
Executive Team
Until 30 June 2015 the City of Melbourne had an organisational structure of five divisions, each led by a Director who reported to the Chief Executive Officer. The Chief Executive Officer and Directors managed our operations and ensured the Council received the strategic information and advice it needed to plan for the municipality and make decisions. On 1 July 2015 an organisational realignment came into force that broadened the composition of the executive team.
Branches within each division perform specific functions, collaborate on projects and share their particular knowledge and expertise across the organisation. Information on the Directors and their divisions is provided below.
Ben Rimmer Chief Executive Officer (from 9 February 2015)
Ben returned to his home town of Melbourne in early 2015 after three years as Associate Secretary in the Australian Government’s
Department of Human Services, where he led the Service Delivery Transformation Group. He previously worked for the Department of the Prime Minister and Cabinet and for the Victorian Department of Premier and Cabinet. In these roles he focused on health reform, Commonwealth – State relations, workforce participation, early childhood and mental health, among other issues. He has degrees in Arts and Law from the University of Melbourne, and an MBA with distinction from the University of Oxford.
Linda Weatherson, Director of Community Development
A home-grown success story, Linda Weatherson has risen progressively through the ranks at the City of Melbourne. Since starting with us in 1987 working with
our child care centres and kindergartens, Linda managed Family and Children’s Services, Human Resources, Business Development and Best Value before being appointed as a Director in 2004, initially responsible for Corporate Performance and now for Community Development.
Dr Kathy Alexander, Chief Executive Officer (Until 3 December 2014)
When Kathy took the helm at the City of Melbourne in 2008 she already was well known as the former CEO of Women’s
and Children’s Health, which governed Melbourne’s Royal Children’s and Royal Women’s hospitals. Before joining us the former South Australian Telstra Businesswoman of the Year was CEO of several hospitals and service organisations in her home state and managed a successful consultancy, with projects around the country.
Mark Stoermer, Director of Corporate Business (Until 3 July 2015)
Mark joined the City of Melbourne’s executive team in 2010, following senior roles in the local finance and IT consulting
sector. With qualifications from New York University and the University of California at Berkeley, Mark cut his teeth at JP Morgan and Merrill Lynch before migrating to Australia.
Geoff Lawler, Director of City Planning and Infrastructure
With qualifications in architecture and public policy, Geoff spent 17 years in urban planning and heritage conservation with the Victorian
Government before joining the City of Melbourne. His first role with us was in 1996 as Manager of Capital City Planning before he was appointed to the role of Director within a few short years.
Martin Cutter, Director of City Business
Martin joined the City of Melbourne 10 years ago as the Director of Corporate Business before leading our City Business division. Prior to that Martin was Chief Financial
Officer at the Australian Government’s national shipping line ANL Limited, playing a critical role in its privatisation, wind up and the management of its residual assets. Previously Martin served as a senior audit manager with KPMG.
Professor Rob Adams, Director of City Design
Rob’s 30 years at the City of Melbourne, and 40 years’ experience as an architect and urban designer, have seen him and his team receive more than 120 local, national
and international awards. Rob was awarded the Prime Minister’s Environmentalist of the year Award in 2008, has an Order of Australia for his contribution to architecture and design and is a member of the World Economic Forum’s Urbanization Council.
OUR ORGANISATION: OVERVIEW
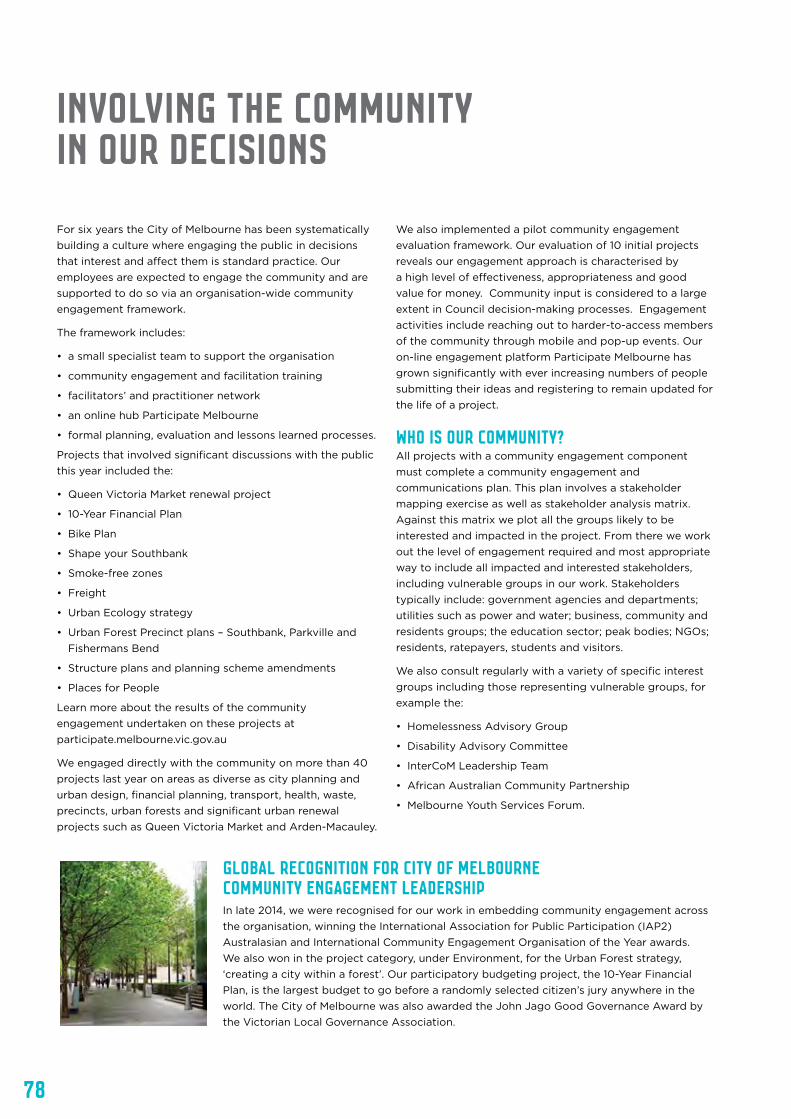
78
Involving the community in our decisions For six years the City of Melbourne has been systematically building a culture where engaging the public in decisions that interest and affect them is standard practice. Our employees are expected to engage the community and are supported to do so via an organisation-wide community engagement framework.
The framework includes:
• a small specialist team to support the organisation
• community engagement and facilitation training
• facilitators’ and practitioner network
• an online hub Participate Melbourne
• formal planning, evaluation and lessons learned processes.
Projects that involved significant discussions with the public this year included the:
• Queen Victoria Market renewal project
• 10-Year Financial Plan
• Bike Plan
• Shape your Southbank
• Smoke-free zones
• Freight
• Urban Ecology strategy
• Urban Forest Precinct plans – Southbank, Parkville and Fishermans Bend
• Structure plans and planning scheme amendments
• Places for People
Learn more about the results of the community engagement undertaken on these projects at participate.melbourne.vic.gov.au
We engaged directly with the community on more than 40 projects last year on areas as diverse as city planning and urban design, financial planning, transport, health, waste, precincts, urban forests and significant urban renewal projects such as Queen Victoria Market and Arden-Macauley.
We also implemented a pilot community engagement evaluation framework. Our evaluation of 10 initial projects reveals our engagement approach is characterised by a high level of effectiveness, appropriateness and good value for money. Community input is considered to a large extent in Council decision-making processes. Engagement activities include reaching out to harder-to-access members of the community through mobile and pop-up events. Our on-line engagement platform Participate Melbourne has grown significantly with ever increasing numbers of people submitting their ideas and registering to remain updated for the life of a project.
Who is our community?All projects with a community engagement component must complete a community engagement and communications plan. This plan involves a stakeholder mapping exercise as well as stakeholder analysis matrix. Against this matrix we plot all the groups likely to be interested and impacted in the project. From there we work out the level of engagement required and most appropriate way to include all impacted and interested stakeholders, including vulnerable groups in our work. Stakeholders typically include: government agencies and departments; utilities such as power and water; business, community and residents groups; the education sector; peak bodies; NGOs; residents, ratepayers, students and visitors.
We also consult regularly with a variety of specific interest groups including those representing vulnerable groups, for example the:
• Homelessness Advisory Group
• Disability Advisory Committee
• InterCoM Leadership Team
• African Australian Community Partnership
• Melbourne Youth Services Forum.
Global recognition for City of Melbourne community engagement leadership In late 2014, we were recognised for our work in embedding community engagement across the organisation, winning the International Association for Public Participation (IAP2) Australasian and International Community Engagement Organisation of the Year awards. We also won in the project category, under Environment, for the Urban Forest strategy, ‘creating a city within a forest’. Our participatory budgeting project, the 10-Year Financial Plan, is the largest budget to go before a randomly selected citizen’s jury anywhere in the world. The City of Melbourne was also awarded the John Jago Good Governance Award by the Victorian Local Governance Association.
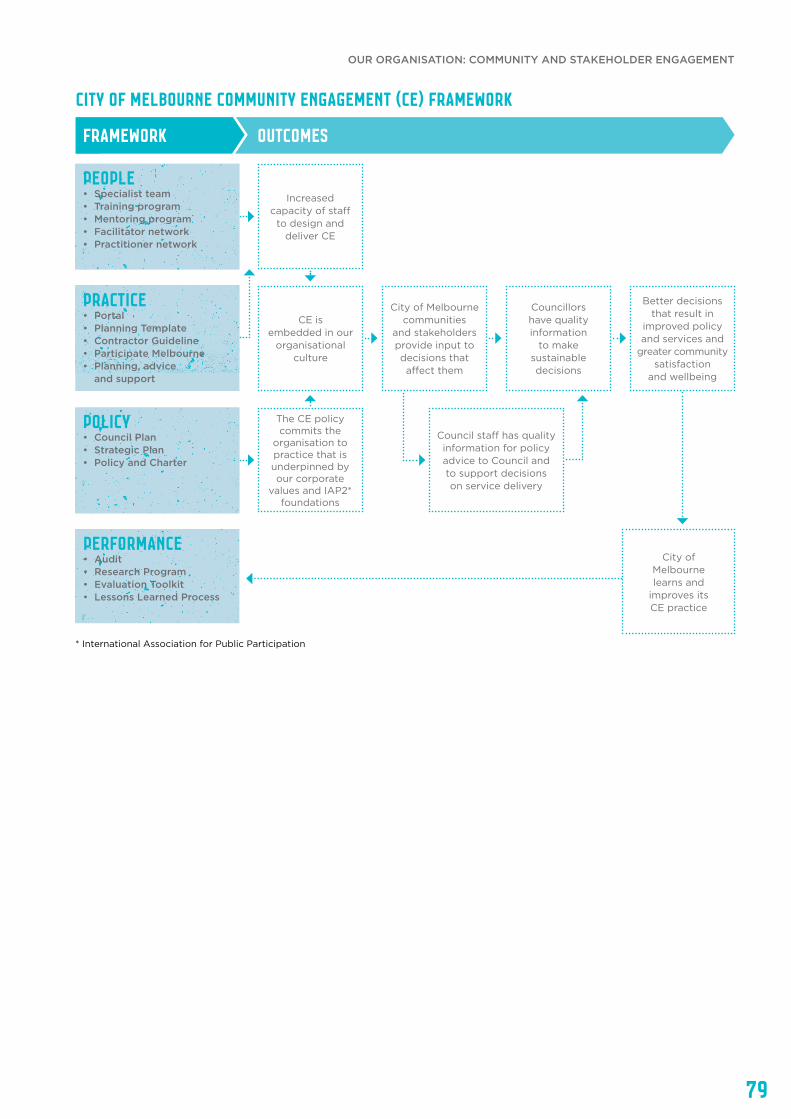
79
City of Melbourne Community Engagement (CE) Framework
FRAMEWORK OUTCOMES
Increased capacity of staff
to design and deliver CE
People• Specialist team• Training program• Mentoring program• Facilitator network• Practitioner network
CE is embedded in our
organisational culture
City of Melbourne communities
and stakeholders provide input to decisions that affect them
Councillors have quality information
to make sustainable decisions
Better decisions that result in
improved policy and services and
greater community satisfaction
and wellbeing
PRACTICE• Portal• Planning Template• Contractor Guideline• Participate Melbourne• Planning, advice
and support
The CE policy commits the
organisation to practice that is underpinned by our corporate
values and IAP2* foundations
Council staff has quality information for policy advice to Council and to support decisions on service delivery
POLICY• Council Plan• Strategic Plan• Policy and Charter
City of Melbourne learns and
improves its CE practice
Performance• Audit• Research Program• Evaluation Toolkit• Lessons Learned Process
* International Association for Public Participation
OUR ORGANISATION: COMMUNITY AND STAKEHOLDER ENGAGEMENT
80
Action Result
Improved application and permit process for handbills and fundraising.
No wait time for the customer and staff time saved 129 hours.
New process implemented to mount new safe city cameras.
Saving $35,000 per camera installation, total costs $315,000.
Agreed new process for families requiring additional days of child care.
Increased service delivery for families and increased revenue of $2000 per annum.
Introduced new water efficiency strategies to our irrigation systems in Park Services.
A 21% reduction in water bill costs, a saving of $126,617.
Customers moved from South Yarra Centre to the Boyd Centre for Family Services.
Increased services to these clients and financial savings of $7863 per annum.
A cross-section of organisational wins from this year’s winlog
CONTINUOUS IMPROVEMENT CITY OF MELBOURNE ORGANISATIONAL CAPABILITY REVIEWIn March 2015, the Chief Executive Officer commissioned an Organisational Capability Review, an independent, forward-looking assessment of the City of Melbourne’s ability to meet future objectives and challenges. The review was completed by three independent reviewers, who identified a number of organisational strengths and areas of improvement. In response to the review, the Chief Executive Officer and executive leadership team developed the City of Melbourne Organisational Action Plan – One Melbourne, One CoM, an initial blueprint for change. It is a first step in refreshing and reinvigorating our organisation to best support the Council and the community and is being implemented through 2015–16.
Continuous improvement – the City of Melbourne WayOur application of Lean Thinking over the past six years has paid off with the creation of a solid foundation of improvement within the organisation. Recent employee surveys and external audits validate that a culture of continuous improvement exists and, for many, it is simply now the way we work at the City of Melbourne.
Since our improvement effort began, thousands of days of staff time have been saved, which has allowed our staff to refocus their efforts on meeting other customer needs and to absorb the continually rising demand for services that a rapidly increasing population brings.
Particular highlights this year included:
• Looking at ways to deliver better value to our customers. Over the past three years our park rangers collaborated closely with events staff applying Lean Thinking concepts to their work. By removing obstacles that prevented park rangers being able to devote more of their time in parks instead of being tied up in back-office work, there has been a dramatic turnaround in the number of ranger hours
spent in parks, increasing from 35% in November 2014 up to 70% in June 2015. Embedding a culture of continuous improvement and problem solving has made it faster, cheaper, easier and better for both staff and customers.
• Improving the way we handle permits in two key areas – construction site permits and event permits. This was a large-scale piece of work, which started with looking at the problem of customers often having to obtain more than one type of planning and building permit from us, resulting in staff issuing more than 10,000 permits each year. We looked at four of the most frequently requested construction permits and streamlined the process by incorporating one permit into another. By reducing the number of permits processed by 600 per year, we saved 200 hours of staff time. By automating the application lodgement and payment process, we expect a further 760 staff hours per year will be saved, freeing up officers to inspect high-risk sites.
We also looked at event permits, which are typically required for about 1000 events held each year in Melbourne’s public open spaces and can consume significant time and energy for both staff and customer, especially for larger events. By incorporating one of the approvals into the event permit, reducing the information required from customers and streamlining the number of exchanges needed between customer and staff, we managed to save 90 hours of our customers’ time. For us, the streamlined process has released 273 hours a year to invest in other services we provide. The result: better and easier for our customers.
81
Our people
We recognise that having a healthy and engaged workforce is critical to the long-term sustainability of our organisation. Creating a safe and diverse workplace, and offering opportunities for learning and development, ensures we will continue to attract and retain the workforce we need to deliver on our commitments.
The National Employment Standards (NES) underpin the Melbourne City Council Enterprise Agreement 2013, which provides the legal framework through which our employment terms and conditions are established for most of our employees. For executive employees, employment terms and conditions are governed by the NES, Local Government Industry Award 2010 and individual employment contracts. Policies and procedures are developed at the discretion of the organisation to support good governance and to provide transparency and clarity to all employees about the principles, rules and guidelines that apply.
People managers are required to ensure their employees know the values, policies and procedures to guide their behaviour and to encourage a workplace culture that is safe, supportive and respects differences.
All employees (full-time, part-time and casuals) have access to a range of benefits and services designed to help them maintain a healthy work-life balance and reach their full potential. This includes access to a range of professional and personal development activities, flexible work arrangements, health and wellbeing advice and programmes, and leave variations. We also host The Club, a non-profit association that aims to improve work-life balance and create a cooperative work environment. Our people benefit from a wide range of social, recreational and sporting activities and services organised by The Club, ranging from discounted zoo and cinema tickets to subsidised gym memberships and entry to sporting and theatre events.
We are currently in the process of developing a People Strategy. The People Strategy aligns to Goal 7: ‘Resources are managed well’. Over the next year we will progress the strategy by introducing a strategic workforce planning model, determine immediate high-risk areas and develop managers who have high-risk areas to implement and manage action plans. We will also focus on creating a more flexible and mobile workforce to allow employees to focus on outputs and accommodate flexible requirements.
Employee code of conductAll our employees are expected to adhere to our Employee Code of Conduct. The code also applies to service providers, representatives and agents who act on our behalf. The document is given to all new employees with their letter of offer.
Enterprise AgreementThe City of Melbourne has a single enterprise agreement that covers 95 per cent of employees. The current agreement includes sustainability targets, work conditions and employee benefits. To maintain our position as a fair and flexible employer, we monitor the agreement’s operation and application through a staff consultative committee that meets quarterly. The Enterprise Agreement was operational from December 2013 and has a nominal expiry date of 30 June 2016.
Staff classifications• Classification 1 and 2 – child care workers, school crossing
supervisors, fitness instructors, information officers
• Classification 3 – child care workers, compliance officers, office administrative support
• Classification 4 – administrative support, environmental health, project officers, kindergarten teachers
• Classification 5 and 6 – professionals, analysts, programmers, technical staff, maternal and child health nurses, immunisation nurses, event managers
• Classification 7 – team leaders and professionals
• Executive – managers, directors and the Chief Executive Officer
The City of Melbourne strives to make Melbourne great. Our high-calibre, talented workforce is vital to the daily delivery of excellent service to the community and achievement of our long-term vision.
Our people matter to us. We monitor our workforce turnover rates as part of Council Plan Goal 7.
OUR ORGANISATION: CONTINUOUS IMPROVEMENT
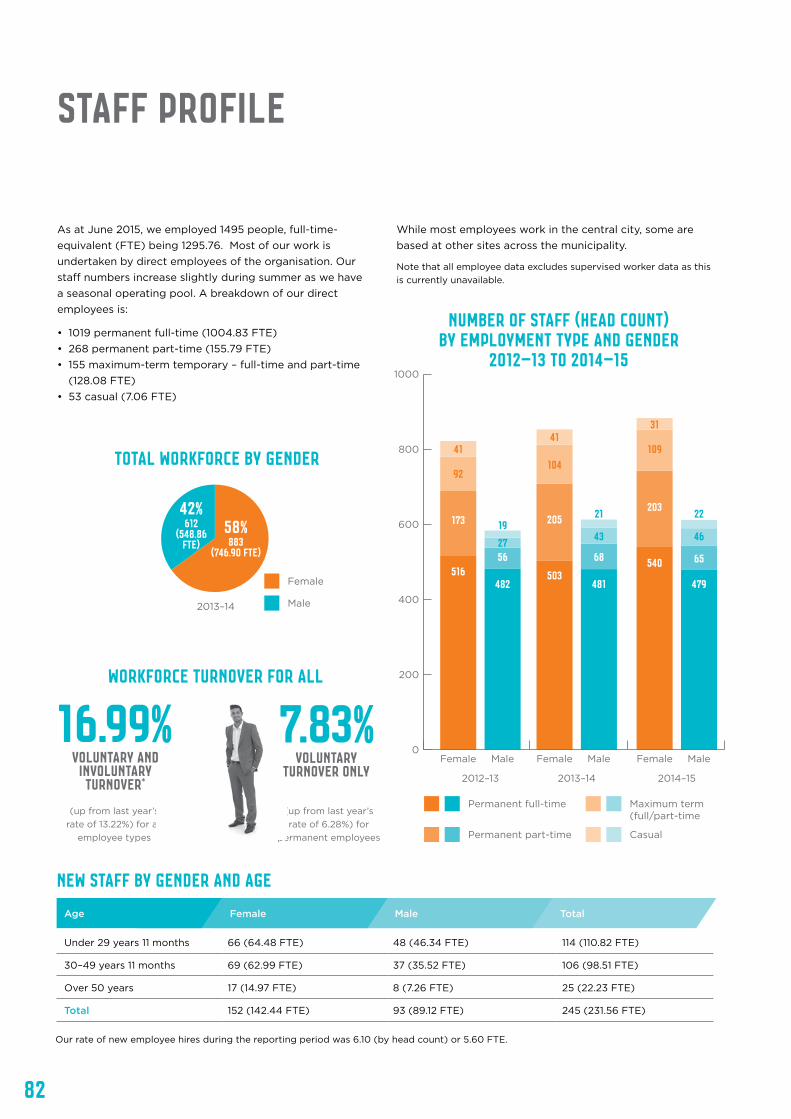
82
STAFF pROFILE
As at June 2015, we employed 1495 people, full-time-equivalent (FTE) being 1295.76. Most of our work is undertaken by direct employees of the organisation. Our staff numbers increase slightly during summer as we have a seasonal operating pool. A breakdown of our direct employees is:
• 1019 permanent full-time (1004.83 FTE)• 268 permanent part-time (155.79 FTE)• 155 maximum-term temporary – full-time and part-time
(128.08 FTE)• 53 casual (7.06 FTE)
While most employees work in the central city, some are based at other sites across the municipality.
Note that all employee data excludes supervised worker data as this is currently unavailable.
(up from last year’s rate of 13.22%) for all
employee types
(up from last year’s rate of 6.28%) for
permanent employees
0
200
400
600
800
1000
2012–13 2013–14 2014–15
Number of sta� (head count) by employment type and gender 2012–13 to 2014–15
516482 481
68
43
21
479
65
46
22
503
205
104
41
540
203
109
31
562719173
92
41
Female
Permanent full-time
Male Female Male Female Male
Permanent part-time
Maximum term (full/part-time
Casual
Female
Male
Total workforce by gender
2013–14
58%42%
883(746.90 FTE)
612(548.86
FTE)
Under 29 years 11 months 66 (64.48 FTE) 48 (46.34 FTE) 114 (110.82 FTE)
30–49 years 11 months 69 (62.99 FTE) 37 (35.52 FTE) 106 (98.51 FTE)
Over 50 years 17 (14.97 FTE) 8 (7.26 FTE) 25 (22.23 FTE)
Total 152 (142.44 FTE) 93 (89.12 FTE) 245 (231.56 FTE)
Age Female Male Total
NEW STAFF BY GENDER AND AGE
TOTAL WORKFORCE BY GENDER
workforce turnover for all
Number of staff (head count) by employment type and gender
2012–13 to 2014–15
Our rate of new employee hires during the reporting period was 6.10 (by head count) or 5.60 FTE.
16.99%voluntary and
involuntary turnover*
7.83%voluntary
turnover only
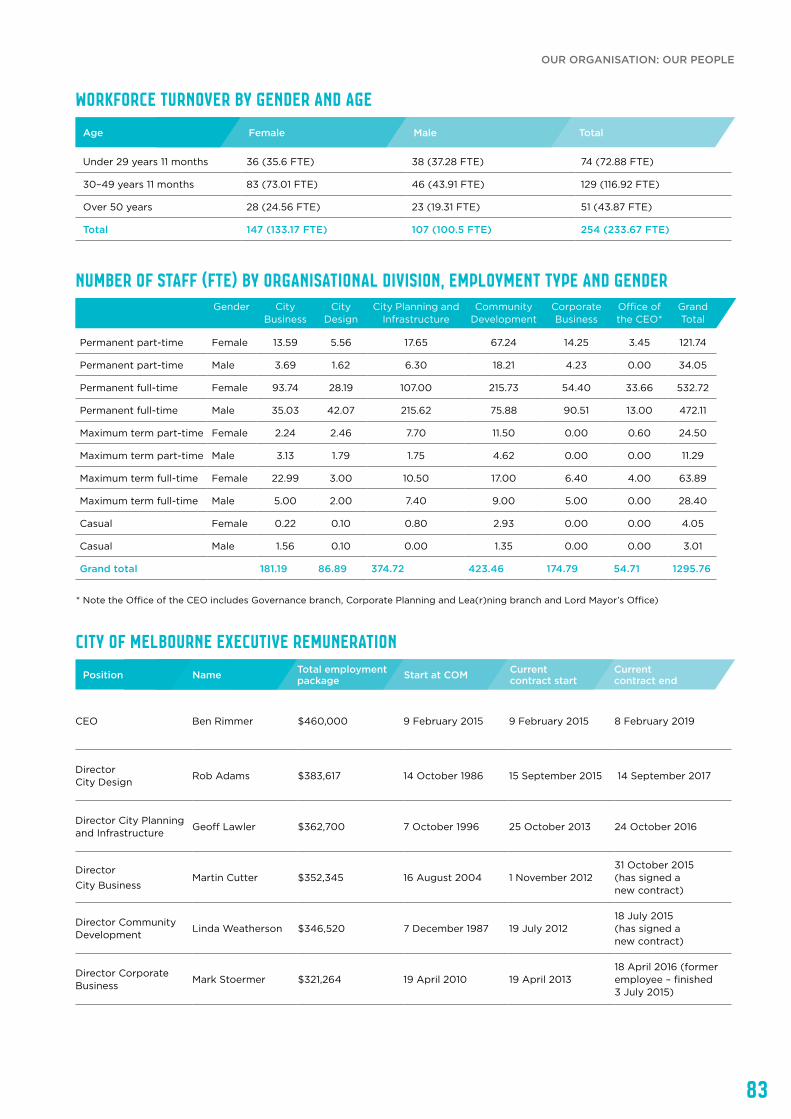
83
workforce turnover BY GENDER AND AGE
Under 29 years 11 months 36 (35.6 FTE) 38 (37.28 FTE) 74 (72.88 FTE)
30–49 years 11 months 83 (73.01 FTE) 46 (43.91 FTE) 129 (116.92 FTE)
Over 50 years 28 (24.56 FTE) 23 (19.31 FTE) 51 (43.87 FTE)
Total 147 (133.17 FTE) 107 (100.5 FTE) 254 (233.67 FTE)
Age Female Male Total
Number of staff (FTE) by organisational division, employment type and genderGender City
BusinessCity
DesignCity Planning and
InfrastructureCommunity
DevelopmentCorporate Business
Office of the CEO*
Grand Total
Permanent part-time Female 13.59 5.56 17.65 67.24 14.25 3.45 121.74
Permanent part-time Male 3.69 1.62 6.30 18.21 4.23 0.00 34.05
Permanent full-time Female 93.74 28.19 107.00 215.73 54.40 33.66 532.72
Permanent full-time Male 35.03 42.07 215.62 75.88 90.51 13.00 472.11
Maximum term part-time Female 2.24 2.46 7.70 11.50 0.00 0.60 24.50
Maximum term part-time Male 3.13 1.79 1.75 4.62 0.00 0.00 11.29
Maximum term full-time Female 22.99 3.00 10.50 17.00 6.40 4.00 63.89
Maximum term full-time Male 5.00 2.00 7.40 9.00 5.00 0.00 28.40
Casual Female 0.22 0.10 0.80 2.93 0.00 0.00 4.05
Casual Male 1.56 0.10 0.00 1.35 0.00 0.00 3.01
Grand total 181.19 86.89 374.72 423.46 174.79 54.71 1295.76
Name Total employment package Start at COM Current
contract startCurrent contract endPosition
City of Melbourne executive remuneration
CEO Ben Rimmer $460,000 9 February 2015 9 February 2015 8 February 2019
Director City Design
Rob Adams $383,617 14 October 1986 15 September 2015 14 September 2017
Director City Planning and Infrastructure
Geoff Lawler $362,700 7 October 1996 25 October 2013 24 October 2016
Director City Business
Martin Cutter $352,345 16 August 2004 1 November 201231 October 2015 (has signed a new contract)
Director Community Development
Linda Weatherson $346,520 7 December 1987 19 July 201218 July 2015 (has signed a new contract)
Director Corporate Business
Mark Stoermer $321,264 19 April 2010 19 April 201318 April 2016 (former employee – finished 3 July 2015)
* Note the Office of the CEO includes Governance branch, Corporate Planning and Lea(r)ning branch and Lord Mayor’s Office)
OUR ORGANISATION: OUR PEOPLE

84
Equality and diversity
Embracing equality and diversity involves recognising the value of our individual differences and treating everyone fairly, equally and with respect.
We strive to provide a work environment that is safe and supportive, free of discrimination, harassment and bullying, and where all individuals associated with the organisation treat each other fairly and with respect.
We are committed to promoting flexible workplace practices in support of diversity, increasing the representation of women in key leadership positions, and encouraging styles of management which actively embrace diversity and inclusion.
Our Chief Executive Officer has joined the Male Champions of Change Program and has led six ‘Listen and Learn’ forums designed to uncover the barriers for gender equity, identify the culture and conditions that allow women to thrive, and understand what an inclusive leader looks like.
Training was provided across the organisation in our suite of policies and procedures to support people managers and staff to identify and address gender inequality in the workplace and change social norms that condone violence against women. In 2015 we will again participate in the United Gender Equity Staff Attitude Survey which will help us understand the impact of our policy and training interventions by comparing with 2014 benchmark results.
We have a network of volunteer contact officers trained to help employees identify options and resources to deal with workplace discrimination and harassment. Every few years we conduct a Diversity Census to gain a snapshot of the current diversity make-up within our organisation. This helps us develop programs, policies, initiatives and strategies to
suit the diversity of our employees now and in the future, allowing us to grow in the area of diversity. The next diversity Census will be in 2016.
To help us assess how well our equality and diversity goals are supported in the workplace, we collect data on the gender and age makeup of our workforce (see ‘Staff profile’ on pages 82 to 83) and incidents of discrimination. There were no incidents of discrimination recorded during the reporting year.
Definitions: *Award employees (Class 1 to Class 7 also including senior officer staff) **Executive employees (Exec 1 to Exec 5)
Ratio of basic salary and remuneration of women to men by employee category
Sustains Innovation
and Creativity
BENEFITS OF DIVERSITY
IMPROVES Attraction and
Retention
Improves Employee
Satisfaction and Performance
Strengthens Equal
OpportunityImproves teamwork
Improves Organisational
Perceptions and Reputation
Increases Recruitment
Options
female to males1 2.20executive employees**
male to females1 0.46
female to males1 0.80award employees*
male to females1 1.44(previous year was 0.73)
(previous year was 1.45)
(previous year was similar at 2.18)
(previous year was the same at 0.46)

85
Employee health and safety We strive to provide a safe and healthy workplace and environment for our staff, suppliers, contractors, volunteers and visitors. Each person is responsible for recognising workplace hazards and correcting or reporting them in a timely manner.
Our Occupational Health and Safety Policy Statement outlines our approach to safety in the workplace. We manage risk and occupational hazards by continuously evaluating and improving work environments and our occupational health and safety (OHS) management system.
This system is audited against the Australian Safety Standard AS/NZS 4801:2001 and our accreditation was maintained in 2014–15. This is the second year we have reported OHS rates data. The data below is representative of our employees only; currently we do not record this data for contractors. There were zero fatalities recorded during 2014–15.
We have a proactive injury prevention strategy and an early intervention approach to all work-related injuries and illnesses that focuses on sustainable return-to-work programs.
This year we successfully reduced the number of lost days and number of employees on alternative duties by a significant margin. We achieved this by proactively managing claims, adopting early intervention and constant follow-up with employees, medical professionals and our workcover agent to determine employees’ capacity for work. Employees with work-related injuries are referred to a local clinic so medical intervention can begin straight away. We also provide Employee Assistance Program referrals for employees who require counselling help.
* LTIFR calculated as number of Lost Time Injuries recorded in the reporting period divided by total hours worked multiplied by 1,000,000
** TRIFR calculated as number of Lost Time Injuries plus number of Medical Treatment Injuries (MTIs) recorded in the reporting period divided by total hours worked multiplied by 1,000,000
*** Absentee Rate (AR) is total sick leave absences as a percentage of ordinary time available. Last year’s AR rate was 3.42% as reported in Annual Report. This includes sick leave with and without medical certificate, carers leave, sick unpaid leave, sick pending workcover and workcover.
7.1 30.6 0 3.77 0
Lost Time Injury Frequency Rate (LTIFR)*
Total Recordable Injury Frequency Rate (TRIFR)**
Occupational Disease Rate (ODR) Absentee Rate (AR)*** Total work-related
fatalities
Under 29 years 11 months 16.52 23.59 51.04 67.45 39.88 11.48 3.75 0.00 213.71
30–49 years 11 months 2.48 29.34 122.96 121.66 158.21 150.6 96.94 20.81 703.00
Over 50 years 6.06 18.59 80.37 44.41 71.22 67.77 57.6 33.03 379.05
Grand Total 25.06 71.52 254.37 233.52 269.31 229.85 158.29 53.84 1295.76
Grand totalAge Group Class 1 Class 5Class 3 Class 7 /
Snr Off.*Class 2 Class 6Class 4 Exec
Employee classification by age group (FTE)
Grand totalGender Class 1 Class 5Class 3 Class 7 /
Snr Off.*Class 2 Class 6Class 4 Exec
Employee classification by gender (FTE)
Female 9.95 50.94 143.16 144.1 168.87 132.08 80.96 16.84 746.9
Male 15.11 20.58 111.21 89.42 100.44 97.77 77.33 37.00 548.86
Grand total 25.06 71.52 254.37 233.52 269.31 229.85 158.29 53.84 1295.76
*Snr Off. – senior officer
OUR ORGANISATION: OUR PEOPLE
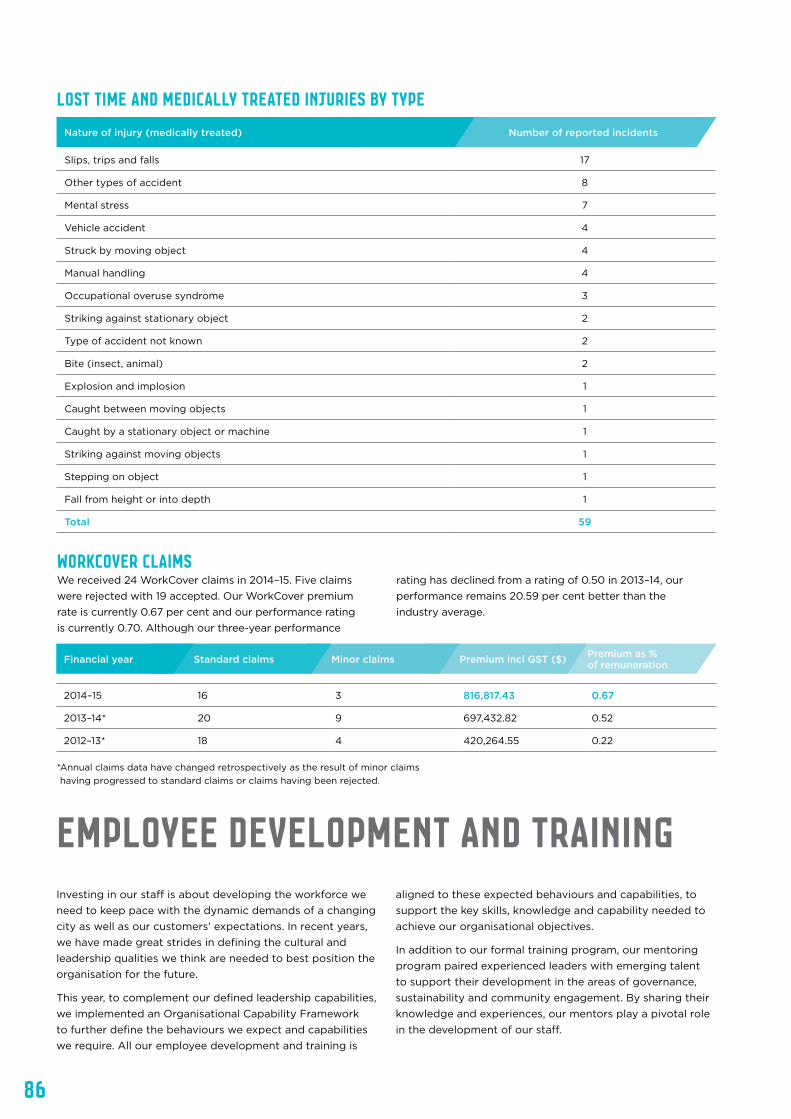
86
Nature of injury (medically treated) Number of reported incidents
WorkCover claims We received 24 WorkCover claims in 2014–15. Five claims were rejected with 19 accepted. Our WorkCover premium rate is currently 0.67 per cent and our performance rating is currently 0.70. Although our three-year performance
rating has declined from a rating of 0.50 in 2013–14, our performance remains 20.59 per cent better than the industry average.
Lost Time and Medically Treated Injuries by type
Financial year Standard claims Minor claims Premium incl GST ($) Premium as % of remuneration
2014–15 16 3 816,817.43 0.67
2013–14* 20 9 697,432.82 0.52
2012–13* 18 4 420,264.55 0.22
Employee development and training Investing in our staff is about developing the workforce we need to keep pace with the dynamic demands of a changing city as well as our customers’ expectations. In recent years, we have made great strides in defining the cultural and leadership qualities we think are needed to best position the organisation for the future.
This year, to complement our defined leadership capabilities, we implemented an Organisational Capability Framework to further define the behaviours we expect and capabilities we require. All our employee development and training is
aligned to these expected behaviours and capabilities, to support the key skills, knowledge and capability needed to achieve our organisational objectives.
In addition to our formal training program, our mentoring program paired experienced leaders with emerging talent to support their development in the areas of governance, sustainability and community engagement. By sharing their knowledge and experiences, our mentors play a pivotal role in the development of our staff.
Slips, trips and falls 17
Other types of accident 8
Mental stress 7
Vehicle accident 4
Struck by moving object 4
Manual handling 4
Occupational overuse syndrome 3
Striking against stationary object 2
Type of accident not known 2
Bite (insect, animal) 2
Explosion and implosion 1
Caught between moving objects 1
Caught by a stationary object or machine 1
Striking against moving objects 1
Stepping on object 1
Fall from height or into depth 1
Total 59
* Annual claims data have changed retrospectively as the result of minor claims having progressed to standard claims or claims having been rejected.
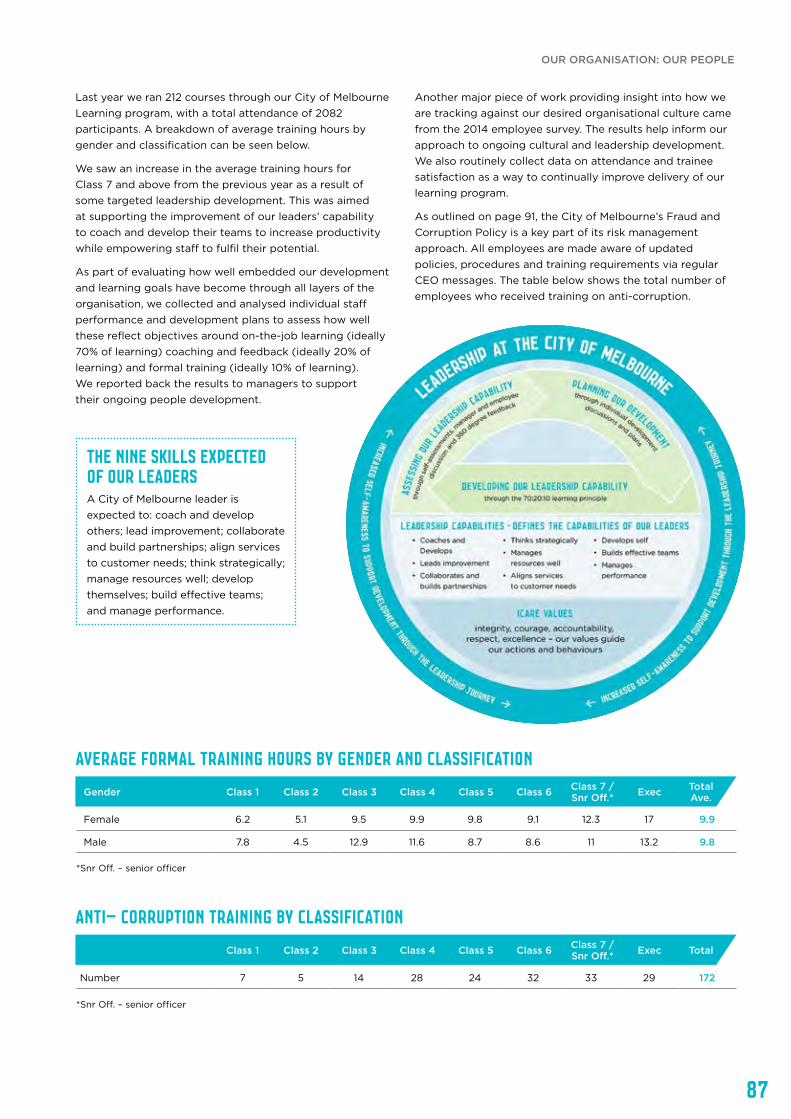
87
Average formal training hours by gender and classification
Anti– corruption training by classification
The nine skills expected of our leadersA City of Melbourne leader is expected to: coach and develop others; lead improvement; collaborate and build partnerships; align services to customer needs; think strategically; manage resources well; develop themselves; build effective teams; and manage performance.
TotalAve.Gender Class 1 Class 5Class 3 Class 7 /
Snr Off.*Class 2 Class 6Class 4 Exec
Female 6.2 5.1 9.5 9.9 9.8 9.1 12.3 17 9.9
Male 7.8 4.5 12.9 11.6 8.7 8.6 11 13.2 9.8
TotalClass 1 Class 5Class 3 Class 7 /Snr Off.*Class 2 Class 6Class 4 Exec
Number 7 5 14 28 24 32 33 29 172
Last year we ran 212 courses through our City of Melbourne Learning program, with a total attendance of 2082 participants. A breakdown of average training hours by gender and classification can be seen below.
We saw an increase in the average training hours for Class 7 and above from the previous year as a result of some targeted leadership development. This was aimed at supporting the improvement of our leaders’ capability to coach and develop their teams to increase productivity while empowering staff to fulfil their potential.
As part of evaluating how well embedded our development and learning goals have become through all layers of the organisation, we collected and analysed individual staff performance and development plans to assess how well these reflect objectives around on-the-job learning (ideally 70% of learning) coaching and feedback (ideally 20% of learning) and formal training (ideally 10% of learning). We reported back the results to managers to support their ongoing people development.
Another major piece of work providing insight into how we are tracking against our desired organisational culture came from the 2014 employee survey. The results help inform our approach to ongoing cultural and leadership development. We also routinely collect data on attendance and trainee satisfaction as a way to continually improve delivery of our learning program.
As outlined on page 91, the City of Melbourne’s Fraud and Corruption Policy is a key part of its risk management approach. All employees are made aware of updated policies, procedures and training requirements via regular CEO messages. The table below shows the total number of employees who received training on anti-corruption.
*Snr Off. – senior officer
*Snr Off. – senior officer
OUR ORGANISATION: OUR PEOPLE

88
One of our key goals is to become an eco-city. To support this goal, we have developed a number of key city-wide strategies such as Zero Net Emissions by 2020, Total Watermark – City as a Catchment, and the Climate Change Adaptation Strategy.
To lead and inspire action throughout the community we ensure we continually improve our own operations. The City of Melbourne has been a carbon neutral organisation since 2011–12 and we focus on reducing the impact of our organisation. This year we measured the footprint of the Moomba Festival as part of a plan to reduce the environmental impacts of our major events. We also have implemented a new online environmental data management system to keep track of how we are going, and highlight further improvements.
Our four key focus areas for the organisation and the city are reducing greenhouse gas emissions, supporting renewable energy, and improved water and waste management.
In the upcoming year, we are developing a new Five-Year Emissions Reduction Plan for the organisation and installing $800,000 of solar on our facilities.
Water managementOur ambition is a healthy city in a healthy catchment. We want the whole of Melbourne’s community – residents, workers and businesses alike – to think about water and its role in our future.
As one of the biggest water users in the municipality, we have a leadership role to play in continuing to implement integrated water cycle management. This year we extended our approach to managing the city as a catchment with the installation of the Fitzroy Gardens stormwater harvesting system. The stormwater tank, twice the size of an Olympic swimming pool, will keep the heritage landscape healthy while future-proofing the gardens from the effects of climate change. It will save about 70 million litres of potable water each year, reducing our water use in the garden by 60 per cent.
Another stormwater harvesting system was completed at Alexandra and Queen Victoria Gardens. This system uses the existing ornamental ponds in Queen Victoria Gardens as stormwater storage, with the aquatic plants helping to clean the water. Providing 20 million litres of water for irrigation every year, the system reduces our water use in these gardens by 55 per cent and increases our resilience to climate change impacts. To share information about these systems and other sustainable water management initiatives undertaken by the Council, the Urban Water website (melbourne.vic.gov.au/urbanwater) was completed this year. The website is an education tool that helps the community to understand how we are managing water for the future and creates a culture of knowledge sharing among organisations in the water industry.
Our Environmental Performance
Source Volume of water withdrawn
Surface water, including water from wetlands, rivers, lakes and oceans* 97,247 KL
Groundwater Not applicable
Rainwater collected directly and stored by the organisation** 73,467 KL
Wastewater from another organisation Not applicable
Municipal water supplies or other water utilities*** 1,020,061 KL
Total water withdrawal by source
The City of Melbourne plays a key role in managing and improving environmental outcomes across the city. We set ambitious targets, support innovation and new technologies, and work with the community to support city-scale change.
* Surface water is total water withdrawn from Royal Park wetland ** From stormwater harvesting systems; manual and automatic (IRRInet) water meters readings
*** Municipal water supplies or other water utilities have been taken directly from CoM’s new environmental data management system and includes all mains water used by the organisation.
We also monitor our environmental actions as part of Council Plan Goal 5
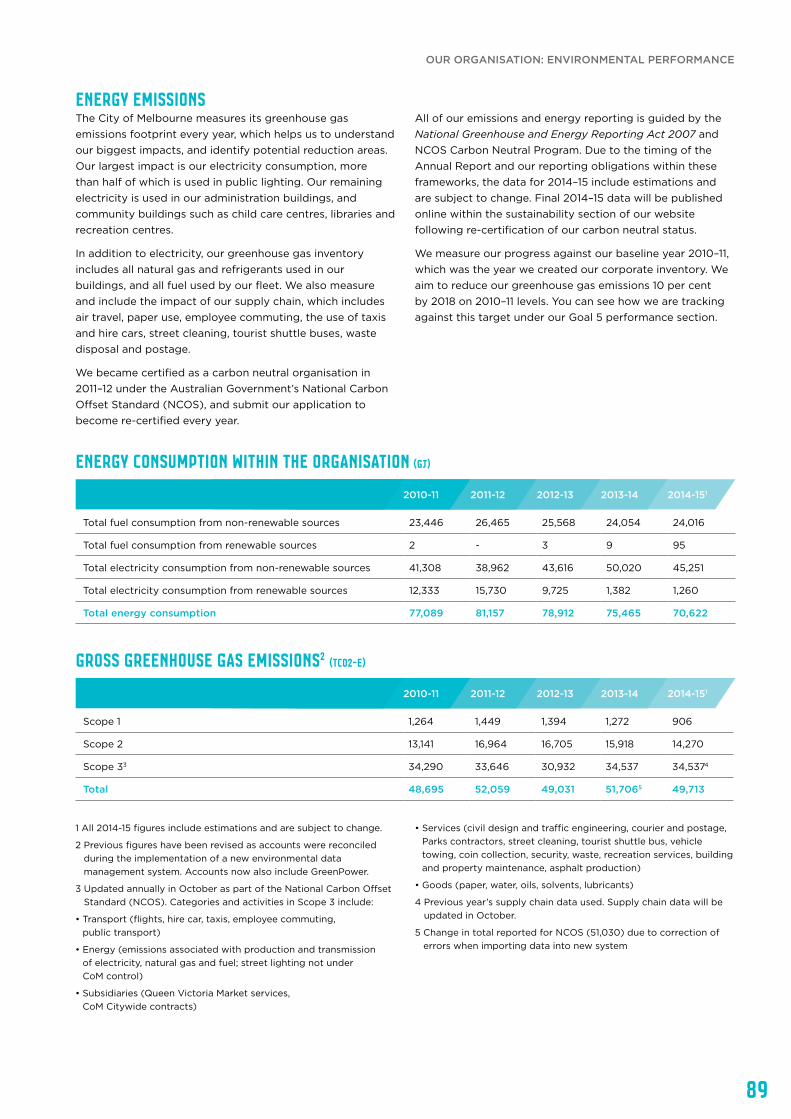
89
Gross greenhouse gas emissions2 (tCo2-e)
Energy consumption within the organisation (GJ)
Energy emissionsThe City of Melbourne measures its greenhouse gas emissions footprint every year, which helps us to understand our biggest impacts, and identify potential reduction areas. Our largest impact is our electricity consumption, more than half of which is used in public lighting. Our remaining electricity is used in our administration buildings, and community buildings such as child care centres, libraries and recreation centres.
In addition to electricity, our greenhouse gas inventory includes all natural gas and refrigerants used in our buildings, and all fuel used by our fleet. We also measure and include the impact of our supply chain, which includes air travel, paper use, employee commuting, the use of taxis and hire cars, street cleaning, tourist shuttle buses, waste disposal and postage.
We became certified as a carbon neutral organisation in 2011–12 under the Australian Government’s National Carbon Offset Standard (NCOS), and submit our application to become re-certified every year.
All of our emissions and energy reporting is guided by the National Greenhouse and Energy Reporting Act 2007 and NCOS Carbon Neutral Program. Due to the timing of the Annual Report and our reporting obligations within these frameworks, the data for 2014–15 include estimations and are subject to change. Final 2014–15 data will be published online within the sustainability section of our website following re-certification of our carbon neutral status.
We measure our progress against our baseline year 2010–11, which was the year we created our corporate inventory. We aim to reduce our greenhouse gas emissions 10 per cent by 2018 on 2010–11 levels. You can see how we are tracking against this target under our Goal 5 performance section.
2010-11
2010-11
2011-12
2011-12
2012-13
2012-13
2013-14
2013-14
2014-151
2014-151
Total fuel consumption from non-renewable sources 23,446 26,465 25,568 24,054 24,016
Total fuel consumption from renewable sources 2 - 3 9 95
Total electricity consumption from non-renewable sources 41,308 38,962 43,616 50,020 45,251
Total electricity consumption from renewable sources 12,333 15,730 9,725 1,382 1,260
Total energy consumption 77,089 81,157 78,912 75,465 70,622
Scope 1 1,264 1,449 1,394 1,272 906
Scope 2 13,141 16,964 16,705 15,918 14,270
Scope 33 34,290 33,646 30,932 34,537 34,5374
Total 48,695 52,059 49,031 51,7065 49,713
1 All 2014-15 figures include estimations and are subject to change.
2 Previous figures have been revised as accounts were reconciled during the implementation of a new environmental data management system. Accounts now also include GreenPower.
3 Updated annually in October as part of the National Carbon Offset Standard (NCOS). Categories and activities in Scope 3 include:
• Transport (flights, hire car, taxis, employee commuting, public transport)
• Energy (emissions associated with production and transmission of electricity, natural gas and fuel; street lighting not under CoM control)
• Subsidiaries (Queen Victoria Market services, CoM Citywide contracts)
• Services (civil design and traffic engineering, courier and postage, Parks contractors, street cleaning, tourist shuttle bus, vehicle towing, coin collection, security, waste, recreation services, building and property maintenance, asphalt production)
• Goods (paper, water, oils, solvents, lubricants)
4 Previous year’s supply chain data used. Supply chain data will be updated in October.
5 Change in total reported for NCOS (51,030) due to correction of errors when importing data into new system
OUR ORGANISATION: ENVIRONMENTAL PERFORMANCE
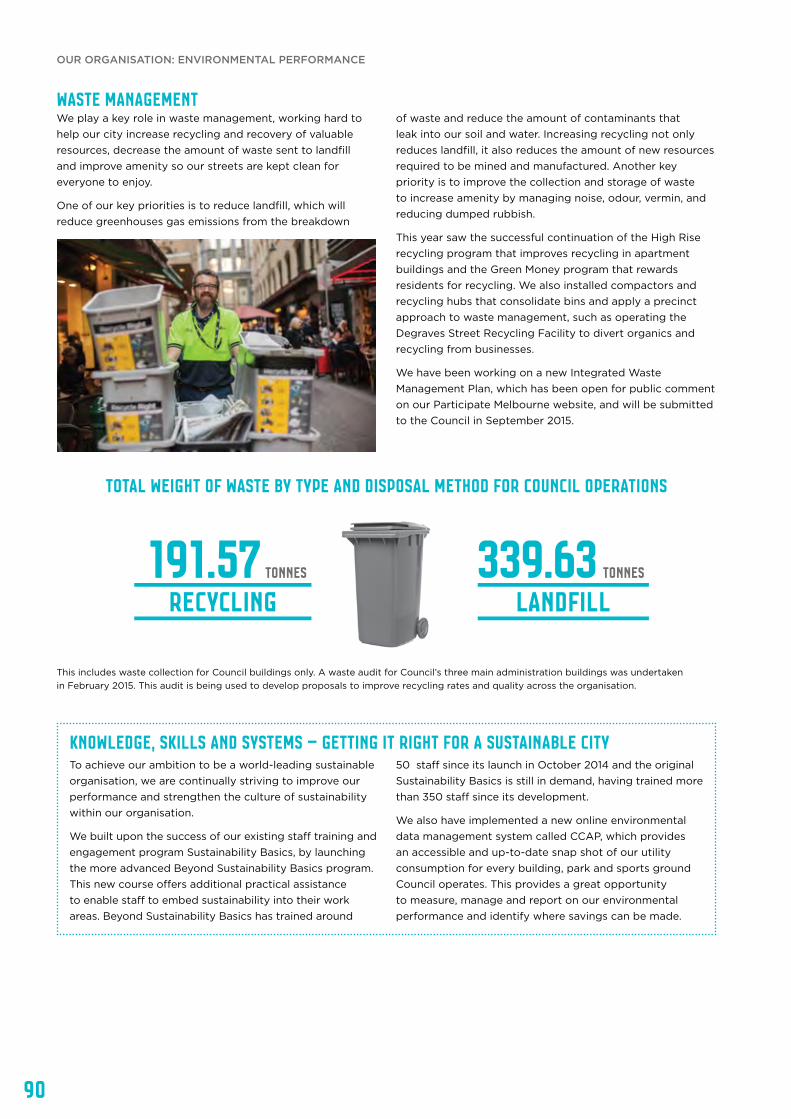
90
Waste management We play a key role in waste management, working hard to help our city increase recycling and recovery of valuable resources, decrease the amount of waste sent to landfill and improve amenity so our streets are kept clean for everyone to enjoy.
One of our key priorities is to reduce landfill, which will reduce greenhouses gas emissions from the breakdown
of waste and reduce the amount of contaminants that leak into our soil and water. Increasing recycling not only reduces landfill, it also reduces the amount of new resources required to be mined and manufactured. Another key priority is to improve the collection and storage of waste to increase amenity by managing noise, odour, vermin, and reducing dumped rubbish.
This year saw the successful continuation of the High Rise recycling program that improves recycling in apartment buildings and the Green Money program that rewards residents for recycling. We also installed compactors and recycling hubs that consolidate bins and apply a precinct approach to waste management, such as operating the Degraves Street Recycling Facility to divert organics and recycling from businesses.
We have been working on a new Integrated Waste Management Plan, which has been open for public comment on our Participate Melbourne website, and will be submitted to the Council in September 2015.
Knowledge, skills and systems – getting it right for a sustainable cityTo achieve our ambition to be a world-leading sustainable organisation, we are continually striving to improve our performance and strengthen the culture of sustainability within our organisation.
We built upon the success of our existing staff training and engagement program Sustainability Basics, by launching the more advanced Beyond Sustainability Basics program. This new course offers additional practical assistance to enable staff to embed sustainability into their work areas. Beyond Sustainability Basics has trained around
50 staff since its launch in October 2014 and the original Sustainability Basics is still in demand, having trained more than 350 staff since its development.
We also have implemented a new online environmental data management system called CCAP, which provides an accessible and up-to-date snap shot of our utility consumption for every building, park and sports ground Council operates. This provides a great opportunity to measure, manage and report on our environmental performance and identify where savings can be made.
Total weight of waste by type and disposal method for council operations
This includes waste collection for Council buildings only. A waste audit for Council’s three main administration buildings was undertaken in February 2015. This audit is being used to develop proposals to improve recycling rates and quality across the organisation.
tonnes339.63landfill
tonnes191.57recycling
OUR ORGANISATION: ENVIRONMENTAL PERFORMANCE
91
RISK MANAGEMENT
• Inability of our workforce to provide community services
• Increased severity and frequency of floods, drought and fires may cause major damage or the loss of key uninsured assets and infrastructure: parks and gardens, roads, drains, infrastructure and buildings valued below the excess level. Assets may be uninsured due to a financial justification (for example we do not insure our trees or roads) or because certain classes of insurance protection are unavailable
• Reputational issues and potential liability exposure
• Adverse effects on economic investments
• Negative impact on public health, wellbeing and mortality
• Negative impact on the liveability, livelihoods, connectedness and economic prosperity of Melbourne and its community
• A community not adequately prepared for flood, extreme heat and rainfall events
• Community concern if we fail to respond
• Interruption to critical infrastructure such as transport, utilities, and health and emergency services
• Increased impacts to biodiversity and the ecosystems services they provide
Consequences for the organisation Consequences for the municipality
Managing climate change risksOur actions in response to these risks and consequences fall in four main areas:
1. Working with the environment
2. Preparing the community
3. Improving infrastructure and planning
4. Sharing knowledge and learning.
Broader environmental sustainability is addressed at a strategic and operational level across the organisation. It is central to the way we work.
In 2015 we will review and update our Climate Change Adaptation Strategy. By working collaboratively and engaging with stakeholders, internal and external, including residents, visitors, businesses, workers and vulnerable communities, we will create a clear understanding of what climate change means to them and how they can adapt.
The City of Melbourne has four policies to help guide our risk management approach: the Risk Management Policy, Business Continuity Policy, Crisis Management Policy and Fraud and Corruption Policy. These are enacted through the Risk Management Framework and various processes and procedures. They also detail the objectives and key responsibilities and timeframes for the review, reporting and approval of risks. Our risk management approach is based on the international standard for risk management, AS/NZS ISO 31000:2009.
Risk management planning is done as an organisation-wide exercise, covering the top strategic risks as well as operational and project risks. It also is part of the daily business activities of individual branches and contractors. Integrated quarterly and annual reporting of strategic risks is undertaken by the Chief Executive Officer and Directors; key risks are reported to the Audit Committee throughout the year.
Adapting to climate changeThe City of Melbourne has done substantial work on climate change adaptation, including the release of the City Of Melbourne Climate Change Adaptation Strategy in 2009. This strategy identified four key risks facing Melbourne including extreme heat and bushfires, sea level rise, reduced rainfall and drought and intense rainfall and storms.
We are working to further understand what our future climate might look like, and how this could affect the City of Melbourne’s environment, people, and economy.
Adaptation is a combination of measures that a) reduce risk from climate hazards and b) build resilience to climate change. These are two quite different lenses that operate in the same system, binding the city’s people, environment and economy.
As a city, failure to respond to climate could have the following potential consequences:
OUR ORGANISATION: RISK MANAGEMENT

92
Audit CommitteeIn line with good governance practices and in accordance with section 139 of the Local Government Act 1989, the City of Melbourne has operated an Audit Committee since 1996. The committee oversees the activities of our external and internal auditors and gives us independent advice on appropriate accounting, auditing, internal control, business risk management, compliance and reporting systems, processes and practices within the organisation.
The Audit Committee met five times during 2014–15 and considered issues including our:
• risk profile
• statement of annual accounts and performance report as well as reports on our wholly owned subsidiaries
• occupational health and safety risks
• information technology risks
• fraud and corruption risks
• business continuity planning and exercises
• governance responsibilities applicable to associated entities and trusts in which we have either an indirect interest or stake
• legal action reports
• internal audit reports.
AUDIT Operations
Financial implications and costs of climate changeThe City of Melbourne has identified many adaptation projects to help manage our future climate risks. Diversity in projects and actions make it difficult to compare and prioritise their contribution to our adaptation efforts.
To support decision-making, we developed an adaptation cost curve framework that provides a better basis for understanding and comparing the benefits of our actions. The framework offers a consistent way of thinking about the value of adaptation benefits and a model for assessing the financial value and cost-effectiveness of our actions.
We will use this framework to assess the value of potential future actions, and use these outputs to make better informed decisions.
OUR ORGANISATION: RISK MANAGEMENT
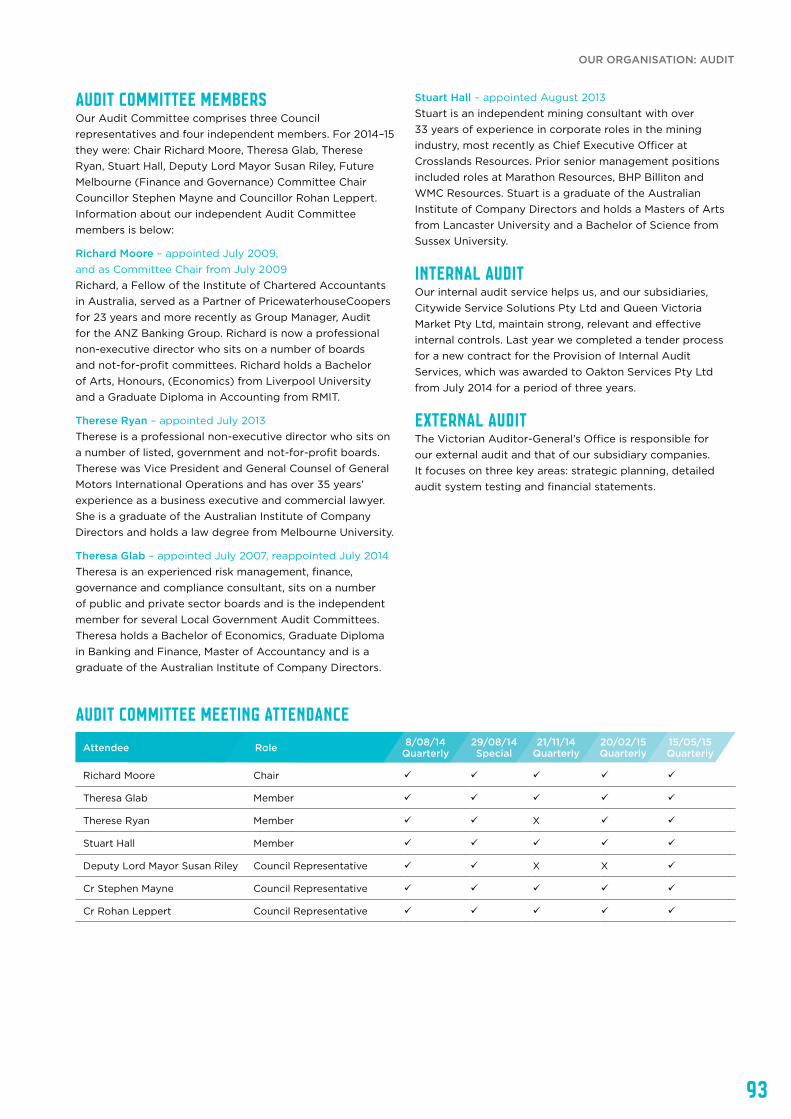
93
Audit Committee membersOur Audit Committee comprises three Council representatives and four independent members. For 2014–15 they were: Chair Richard Moore, Theresa Glab, Therese Ryan, Stuart Hall, Deputy Lord Mayor Susan Riley, Future Melbourne (Finance and Governance) Committee Chair Councillor Stephen Mayne and Councillor Rohan Leppert. Information about our independent Audit Committee members is below:
Richard Moore – appointed July 2009, and as Committee Chair from July 2009 Richard, a Fellow of the Institute of Chartered Accountants in Australia, served as a Partner of PricewaterhouseCoopers for 23 years and more recently as Group Manager, Audit for the ANZ Banking Group. Richard is now a professional non-executive director who sits on a number of boards and not-for-profit committees. Richard holds a Bachelor of Arts, Honours, (Economics) from Liverpool University and a Graduate Diploma in Accounting from RMIT.
Therese Ryan – appointed July 2013 Therese is a professional non-executive director who sits on a number of listed, government and not-for-profit boards. Therese was Vice President and General Counsel of General Motors International Operations and has over 35 years’ experience as a business executive and commercial lawyer. She is a graduate of the Australian Institute of Company Directors and holds a law degree from Melbourne University.
Theresa Glab – appointed July 2007, reappointed July 2014 Theresa is an experienced risk management, finance, governance and compliance consultant, sits on a number of public and private sector boards and is the independent member for several Local Government Audit Committees. Theresa holds a Bachelor of Economics, Graduate Diploma in Banking and Finance, Master of Accountancy and is a graduate of the Australian Institute of Company Directors.
Stuart Hall – appointed August 2013 Stuart is an independent mining consultant with over 33 years of experience in corporate roles in the mining industry, most recently as Chief Executive Officer at Crosslands Resources. Prior senior management positions included roles at Marathon Resources, BHP Billiton and WMC Resources. Stuart is a graduate of the Australian Institute of Company Directors and holds a Masters of Arts from Lancaster University and a Bachelor of Science from Sussex University.
Internal auditOur internal audit service helps us, and our subsidiaries, Citywide Service Solutions Pty Ltd and Queen Victoria Market Pty Ltd, maintain strong, relevant and effective internal controls. Last year we completed a tender process for a new contract for the Provision of Internal Audit Services, which was awarded to Oakton Services Pty Ltd from July 2014 for a period of three years.
External auditThe Victorian Auditor-General’s Office is responsible for our external audit and that of our subsidiary companies. It focuses on three key areas: strategic planning, detailed audit system testing and financial statements.
Audit Committee meeting attendance8/08/14
QuarterlyRoleAttendee 29/08/14Special
21/11/14Quarterly
20/02/15Quarterly
15/05/15Quarterly
Richard Moore Chair ü ü ü ü ü
Theresa Glab Member ü ü ü ü ü
Therese Ryan Member ü ü X ü ü
Stuart Hall Member ü ü ü ü ü
Deputy Lord Mayor Susan Riley Council Representative ü ü X X ü
Cr Stephen Mayne Council Representative ü ü ü ü ü
Cr Rohan Leppert Council Representative ü ü ü ü ü
OUR ORGANISATION: AUDIT
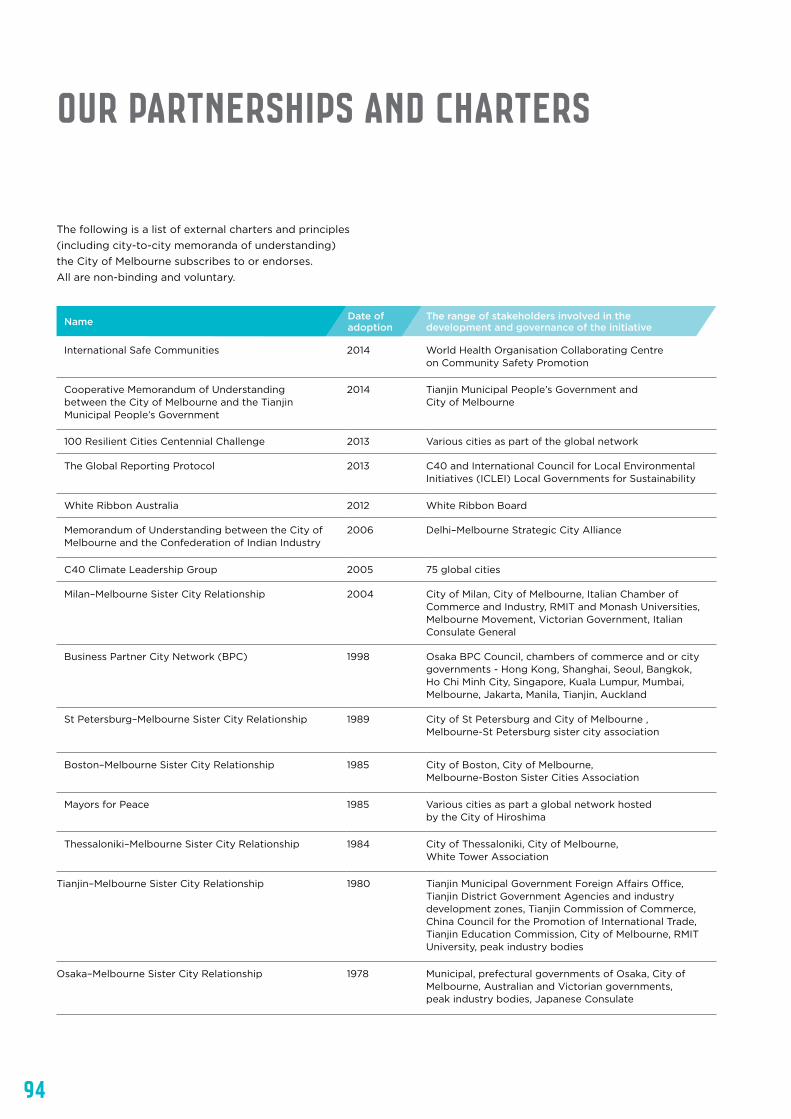
94
Our partnerships and charters
The following is a list of external charters and principles (including city-to-city memoranda of understanding) the City of Melbourne subscribes to or endorses. All are non-binding and voluntary.
Name Date of adoption
The range of stakeholders involved in the development and governance of the initiative
International Safe Communities 2014 World Health Organisation Collaborating Centre on Community Safety Promotion
Cooperative Memorandum of Understanding between the City of Melbourne and the Tianjin Municipal People’s Government
2014 Tianjin Municipal People’s Government and City of Melbourne
100 Resilient Cities Centennial Challenge 2013 Various cities as part of the global network
The Global Reporting Protocol 2013 C40 and International Council for Local Environmental Initiatives (ICLEI) Local Governments for Sustainability
White Ribbon Australia 2012 White Ribbon Board
Memorandum of Understanding between the City of Melbourne and the Confederation of Indian Industry
2006 Delhi–Melbourne Strategic City Alliance
C40 Climate Leadership Group 2005 75 global cities
Milan–Melbourne Sister City Relationship 2004 City of Milan, City of Melbourne, Italian Chamber of Commerce and Industry, RMIT and Monash Universities, Melbourne Movement, Victorian Government, Italian Consulate General
Business Partner City Network (BPC) 1998 Osaka BPC Council, chambers of commerce and or city governments - Hong Kong, Shanghai, Seoul, Bangkok, Ho Chi Minh City, Singapore, Kuala Lumpur, Mumbai, Melbourne, Jakarta, Manila, Tianjin, Auckland
St Petersburg–Melbourne Sister City Relationship 1989 City of St Petersburg and City of Melbourne , Melbourne-St Petersburg sister city association
Boston–Melbourne Sister City Relationship 1985 City of Boston, City of Melbourne, Melbourne-Boston Sister Cities Association
Mayors for Peace 1985 Various cities as part a global network hosted by the City of Hiroshima
Thessaloniki–Melbourne Sister City Relationship 1984 City of Thessaloniki, City of Melbourne, White Tower Association
Tianjin–Melbourne Sister City Relationship 1980 Tianjin Municipal Government Foreign Affairs Office, Tianjin District Government Agencies and industry development zones, Tianjin Commission of Commerce, China Council for the Promotion of International Trade, Tianjin Education Commission, City of Melbourne, RMIT University, peak industry bodies
Osaka–Melbourne Sister City Relationship 1978 Municipal, prefectural governments of Osaka, City of Melbourne, Australian and Victorian governments, peak industry bodies, Japanese Consulate
95
Our Procurement And Supply Chain
In accordance with the Local Government Act 1989 the City of Melbourne has developed a procurement policy encompassing the principles, processes and procedures applied to the purchase of all goods, services and work by the organisation.
Our procurement policy states that in procuring goods, work and services under a contractual arrangement, we will:
• support our corporate strategy, aims and objectives
• ensure we achieve best value in terms of time, cost and value
• establish and put in place appropriate performance measures
• commit to achieving sustainability objectives
• provide effective and efficient commercial arrangements.
The policy uses a sustainable approach to procurement to reduce the social, financial and environmental impact of the procurement cycle. As a result we seek to procure environmentally preferred products and services and to do business with contractors and providers who have similar sustainability objectives and policies. However, we do not screen new suppliers using sustainability criteria per se.
Whenever practicable and relevant, we give preference to the supply of goods, machinery or material manufactured or produced in Australia or New Zealand, and work collaboratively with suppliers to achieve these objectives.
The organisation has a procurement and corporate contract management system that prescribes best practice methodologies in its contract management and processes and is adhered to at all times.
While there were no major changes in 2014–15 in our procurement structure, we carried out a strategic review of our existing procurement model. The City of Melbourne has always operated with a fully decentralised procurement model, allowing employees across the organisation at various locations the authority to purchase goods and
services within a set delegation. A cross-organisational working group came together a year ago to investigate the effectiveness of procurement across the organisation with the aim of achieving the following:
• reduced risk
• value for money
• sustainability outcomes
• a simpler way to do business.
We intend to roll out a new, more contemporary procurement model in the organisation in 2015–16.
During 2014–15, we processed 44 tenders and awarded 42 service and capital contracts.
Contracts were awarded or extended in the following key service categories (not including miscellaneous one-off services):
• street cleaning
• event delivery
• marketing services
• aged and inclusion services
• consultancy and other work.
See also melbourne.vic.gov.au/AboutCouncil/Tenders/Pages/Registerofmajorservicecontracts.aspx for a list of all current major service contracts greater than $1 million annually.
For large service contracts with a value greater than $500,000, strategic service reviews are carried out to determine whether or not the service is still required, if it should continue to be contracted out or brought in-house and whether the service meets our sustainability objectives. However, there is no centralised system for monitoring compliance. Note: these reviews do not apply to capital works contracts.
OUR ORGANISATION: PROCUREMENT AND SUPPLY CHAIN
96
Interacting With Customers
Legislative complianceThe following pieces of legislation set out basic standards for how we look after our customers’ interests.
Privacy and Data Protection Act 2014 Standards set out by Victoria’s Privacy and Data Protection Act 2014 and our Privacy Policy Statement control how we manage personal information. Privacy compliance is included in our staff induction program. We have a dedicated privacy team within our Governance Services branch to help staff and members of the public with privacy-related queries or issues.
Two privacy complaints were received by the organisation during the 2014-15 financial year. Both were resolved internally. No complaints from regulatory bodies were received and no losses of customer data occurred.
Disability Act 2006
The City of Melbourne strives to ensure equity of access in all in planning, community support and service delivery functions in accordance with the Disability Discrimination Act 1992 (Cth) and Victoria’s Disability Act 2006.
The Melbourne for All People 2014-17 Strategy has provided a more integrated approach to meeting the needs and aspirations of all people who come to the city. Specific initiatives continue to reduce and eliminate barriers within our city and enhance inclusion and participation of people with a disability. While this work continues across most branches of Council, key achievements of note include:
• The hosting of a Changing Places Seminar in September 2014 which attracted over 150 participants and highlighted the need for dignified toilet facilities for people of all ages with a disability.
• A partnership agreement was signed with the National Disability Recruitment Service to support recruitment of people with a disability to City of Melbourne.
• Exploration of navigation barriers experienced for people who are vision impaired, blind, hearing impaired, deaf, and deaf and blind in getting around the city. The City of Melbourne and other significant stakeholders are looking at innovative solutions that can be implemented.
Protected Disclosure Act 2012 To access our procedures, please refer to www.melbourne.vic.gov.au/AboutCouncil/financegovernance/Pages/ProtectedDisclosures.aspx
During 2014–15 no disclosures were notified to the Independent Broad-based Anti-corruption Commission.
Carers Recognition Act 2012 We have taken all practicable measures to comply with our responsibilities under Victoria’s Carers Recognition Act 2012. We have promoted the principles of the Act to people in care relationships who receive City of Melbourne Home and Community Care services, to people in care relationships and to the wider community through ways including:
• providing information via our intake and information service
• assessing and responding to the needs of primary carers
• recognising the role of carers by including carers in the assessment, planning, delivery and review of services that impact on them and their role as carers
• providing respite and planned activity services to provide the primary carer a break from caring responsibilities
• providing links to Victorian Government resource materials on our website
• providing information to organisations represented in Council and community networks.
Our services have policies that satisfy the Community Care Common Standards, which incorporate recognition of carers in relation to services that impact on them in their role as carers.
Domestic Animals Act 1994 In consultation with the Victorian Department of Environment and Primary Industries, every four years we prepare a Domestic Animal Management Plan in accordance with Victoria’s Domestic Animals Act 1994 as a framework to guide our decisions.
As part of delivering the 2013–2017 plan we have continued to increase engagement with the community, including increasing the presence of officers in parks and holding pop-up events to provide responsible pet ownership education.
Our four-year plan recognises the importance of balancing the needs of pet owners and those of other community members in our ever growing and developing city.
Our customers are our community. In interacting with them, we are guided by certain legislative standards and requirements. We also have a general commitment towards providing a positive experience to those we serve.
OUR ORGANISATION: INTERACTING WITH CUSTOMERS
97
INNER MELBOURNE Action plan 2014-15
Customer health and safety Customer health and safety is addressed through our risk management procedures (see page 90) and responsibilities under occupational health and safety legislation. Health and safety impacts are assessed for all our services and products in accordance with legislation, our occupational health and safety management system and internal policies and
procedures. This requirement is evidenced through internal and external audit results. Due to the diverse nature of our services and products, no statistical evaluation is undertaken on the percentage of services and products for which health and safety impacts are assessed for improvement.
The Inner Melbourne Action Plan (IMAP) is the successful collaboration between the cities of Melbourne, Port Phillip, Yarra, Maribyrnong and Stonnington. IMAP seeks to help foster creativity, liveability, prosperity and sustainability across the inner Melbourne region. Key strategic directions are transport and connectedness, housing affordability, environmental sustainability and liveability.
IMAP identified 11 regional strategies and 57 actions for implementation across the inner Melbourne region. Now in its ninth year, the IMAP partnership has completed or progressed implementation on about 75 per cent of these actions. Key achievements during 2014–15 have been:
Affordable housing and InfrastructurePhase two of the Community Land Trust project began, including development of four case studies and financial instruments to develop this housing option in Australia. An affordable housing forum is proposed for November 2015.
A joint planning study for providing active and passive recreation spaces for a larger population is being developed by the Metropolitan Planning Authority and Sport and Recreation Victoria.
SustainabilityThe Energy Mapping project undertaken with the Commonwealth Scientific and Industrial Research Organisation (CSIRO) was completed and a communications plan developed for making the research modelling publically available.
The Growing Green Guide – a ‘how to’ manual for developing green roofs, walls and facades – was awarded the 2014 Victoria Landscape Architecture Award for education. The project was also promoted through a paper at the Seventh Liveable Cities conference in New South Wales in July 2014 and ongoing research on rooftop ecosystems to improve green roof performance, through partnering an Australian Research Council (ARC) linkage grant to the University of Melbourne.
The Sustainable Design Factsheet series was extended, and agreement reached with Council Alliance for a Sustainable Built Environment (CASBE) to administer the design standards in future.
Regional tourismThe Visitor Sign Master Style Guide project team arranged for a Transport for London representative to visit in February to provide insights and workshops on administering the Legible London pedestrian signage system.
IMAP and the University of Melbourne began joint research on the impact of urban manufacturing businesses on the economy, highlighting the pressures they face, and engaging with stakeholders at a May workshop.
A Victoria Tourism Industry Council media release highlighted IMAP’s work at the International AIDS conference. An agreement with Destination Melbourne Ltd saw the IMAP map published as the Melbourne Official Visitors Map.
Looking ahead A review of IMAP, undertaken in response to Plan Melbourne, will be finalised in 2015–16, setting out new priorities for projects to be undertaken over the next five to 10 years.
The IMAP Councils have supported the Inner City Regional Management Forum projects to develop liveability indicators and investigate integrated service models.
OUR ORGANISATION: INNER MELBOURNE ACTION PLAN 2014-15

98
Our Reporting Approach
Global Reporting Initiative The Global Reporting Initiative (GRI) is an international not-for-profit organisation. GRI’s mission is to make sustainability reporting standard practice for all companies and organisations. It promotes the use of sustainability reporting as a way for organisations to become more sustainable and contribute to sustainable development.
A sustainability report conveys disclosures on an organisation’s most critical impacts – be they positive or negative – on the environment, society and the economy.
Creating a report that mattersA robust sustainability report is far more than a mere data gathering or compliance exercise. It makes abstract issues tangible and concrete, helping organisations to set goals, measure performance, and manage change.
As part of our effort to be an accessible, transparent and responsive organisation that manages its resources well, a commitment was made in 2012–13 to develop the Annual Report in accordance with GRI’s Sustainability Reporting Framework, G4. This will be the second year in a row we have incorporated the G4 framework into our Annual Report.
Identifying the issues that matter most The City of Melbourne’s Annual Report contents are substantially determined by the requirements of the Local Government Act 1989 and Council Plan 2013–2017. The Council Plan in turn reflects the community’s goals identified in the development of Future Melbourne in 2008, representing some 15,000 views from across the community to guide the city’s development to 2020.
Like most local governments, we have a long history of reporting both financial and non-financial performance to stakeholders. Many of these disclosures align with the GRI Framework. Therefore we have used these ‘must report’ disclosures as the starting point in understanding the most important issues for the City of Melbourne.
Below is a description of the original process we used in 2014 to identify issues to be included in our Annual Report.
The City of Melbourne seeks to improve its understanding and management of the issues that matter most to the way we operate and the community we serve. To help us meet this ambition, we have applied the newest Global Reporting Initiative (GRI) Sustainability Reporting Framework (version G4) in the development of the Annual Report 2014–15. Where possible, we have reported fully against the core requirements of the G4 framework; in other areas we have noted where our current reporting and data collection approaches allow us to enter a partial report only. We have not sought external assurance for the GRI components of this report.
ValidationOutputs aggregated into final issues list and reviewed against the GRI principle of ‘completeness’
List of issues reviewed by Annual Report working group
Issues approved by Annual Report leadership group
Prioritisation Staff workshop held to sense-check ‘must report’ issues, identify new ones and categorise and prioritise all issues
Identification Mapped ‘must report’ indicators from Local Government Act 1989, Council Plan 2013–17 and Corporate Risk Register
To confirm the issues identified from this process were still relevant for the purposes of this report from the point of view of our external stakeholders, this year we also
completed a stock-take of feedback we received from major community engagement activities we held over the last 12 months. See page 78 for detail about these activities.
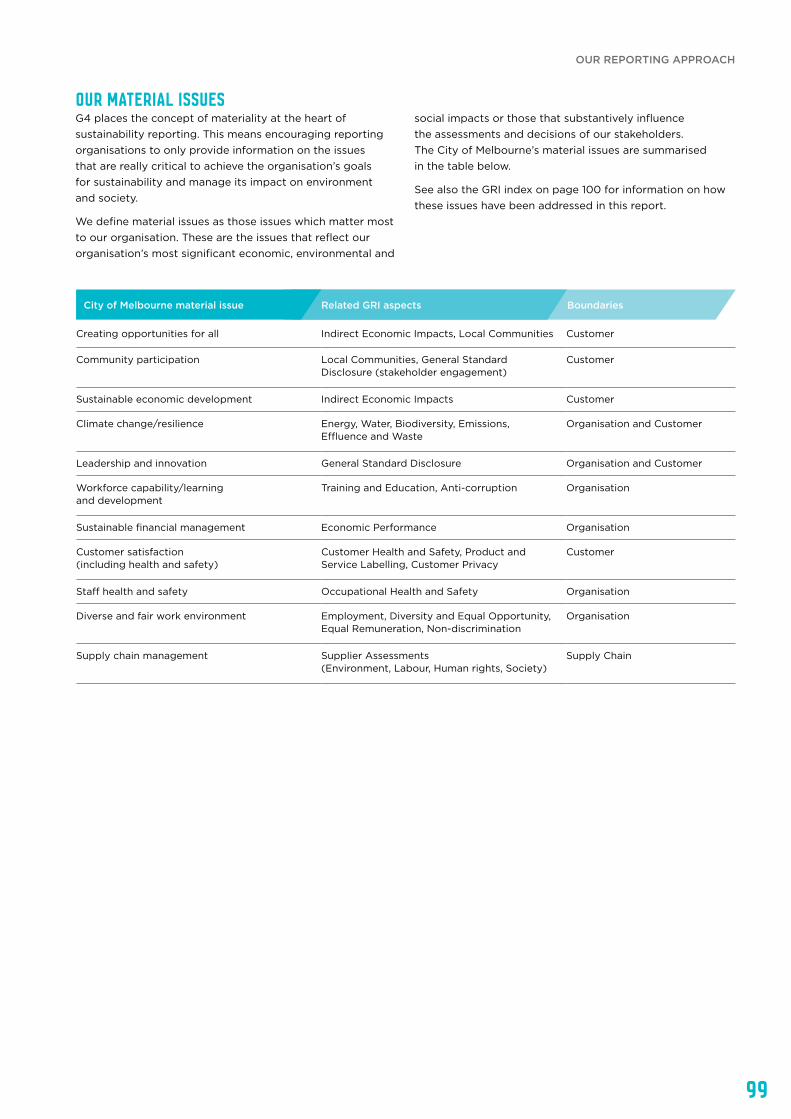
99
City of Melbourne material issue Related GRI aspects Boundaries
Our material issuesG4 places the concept of materiality at the heart of sustainability reporting. This means encouraging reporting organisations to only provide information on the issues that are really critical to achieve the organisation’s goals for sustainability and manage its impact on environment and society.
We define material issues as those issues which matter most to our organisation. These are the issues that reflect our organisation’s most significant economic, environmental and
social impacts or those that substantively influence the assessments and decisions of our stakeholders. The City of Melbourne’s material issues are summarised in the table below.
See also the GRI index on page 100 for information on how these issues have been addressed in this report.
Creating opportunities for all Indirect Economic Impacts, Local Communities Customer
Community participation Local Communities, General Standard Disclosure (stakeholder engagement)
Customer
Sustainable economic development Indirect Economic Impacts Customer
Climate change/resilience Energy, Water, Biodiversity, Emissions, Effluence and Waste
Organisation and Customer
Leadership and innovation General Standard Disclosure Organisation and Customer
Workforce capability/learning and development
Training and Education, Anti-corruption Organisation
Sustainable financial management Economic Performance Organisation
Customer satisfaction (including health and safety)
Customer Health and Safety, Product and Service Labelling, Customer Privacy
Customer
Staff health and safety Occupational Health and Safety Organisation
Diverse and fair work environment Employment, Diversity and Equal Opportunity, Equal Remuneration, Non-discrimination
Organisation
Supply chain management Supplier Assessments (Environment, Labour, Human rights, Society)
Supply Chain
OUR REPORTING APPROACH
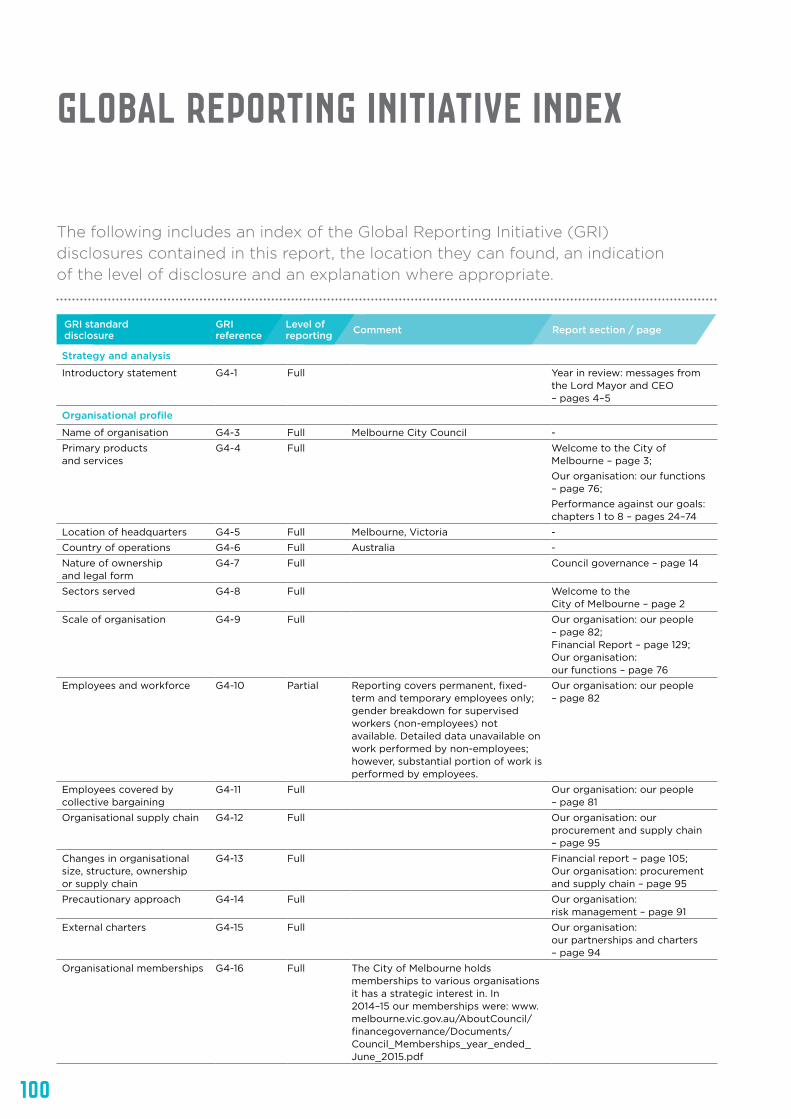
100
GRI reference
GRI standard disclosure
Level of reporting Comment Report section / page
The following includes an index of the Global Reporting Initiative (GRI) disclosures contained in this report, the location they can found, an indication of the level of disclosure and an explanation where appropriate.
Global Reporting Initiative Index
Strategy and analysis
Introductory statement G4-1 Full Year in review: messages from the Lord Mayor and CEO – pages 4–5
Organisational profile
Name of organisation G4-3 Full Melbourne City Council -
Primary products and services
G4-4 Full Welcome to the City of Melbourne – page 3; Our organisation: our functions – page 76;Performance against our goals: chapters 1 to 8 – pages 24–74
Location of headquarters G4-5 Full Melbourne, Victoria -
Country of operations G4-6 Full Australia -
Nature of ownership and legal form
G4-7 Full Council governance – page 14
Sectors served G4-8 Full Welcome to the City of Melbourne – page 2
Scale of organisation G4-9 Full Our organisation: our people – page 82; Financial Report – page 129; Our organisation: our functions – page 76
Employees and workforce G4-10 Partial Reporting covers permanent, fixed-term and temporary employees only; gender breakdown for supervised workers (non-employees) not available. Detailed data unavailable on work performed by non-employees; however, substantial portion of work is performed by employees.
Our organisation: our people – page 82
Employees covered by collective bargaining
G4-11 Full Our organisation: our people – page 81
Organisational supply chain G4-12 Full Our organisation: our procurement and supply chain – page 95
Changes in organisational size, structure, ownership or supply chain
G4-13 Full Financial report – page 105; Our organisation: procurement and supply chain – page 95
Precautionary approach G4-14 Full Our organisation: risk management – page 91
External charters G4-15 Full Our organisation: our partnerships and charters – page 94
Organisational memberships G4-16 Full The City of Melbourne holds memberships to various organisations it has a strategic interest in. In 2014–15 our memberships were: www.melbourne.vic.gov.au/AboutCouncil/financegovernance/Documents/Council_Memberships_year_ended_June_2015.pdf
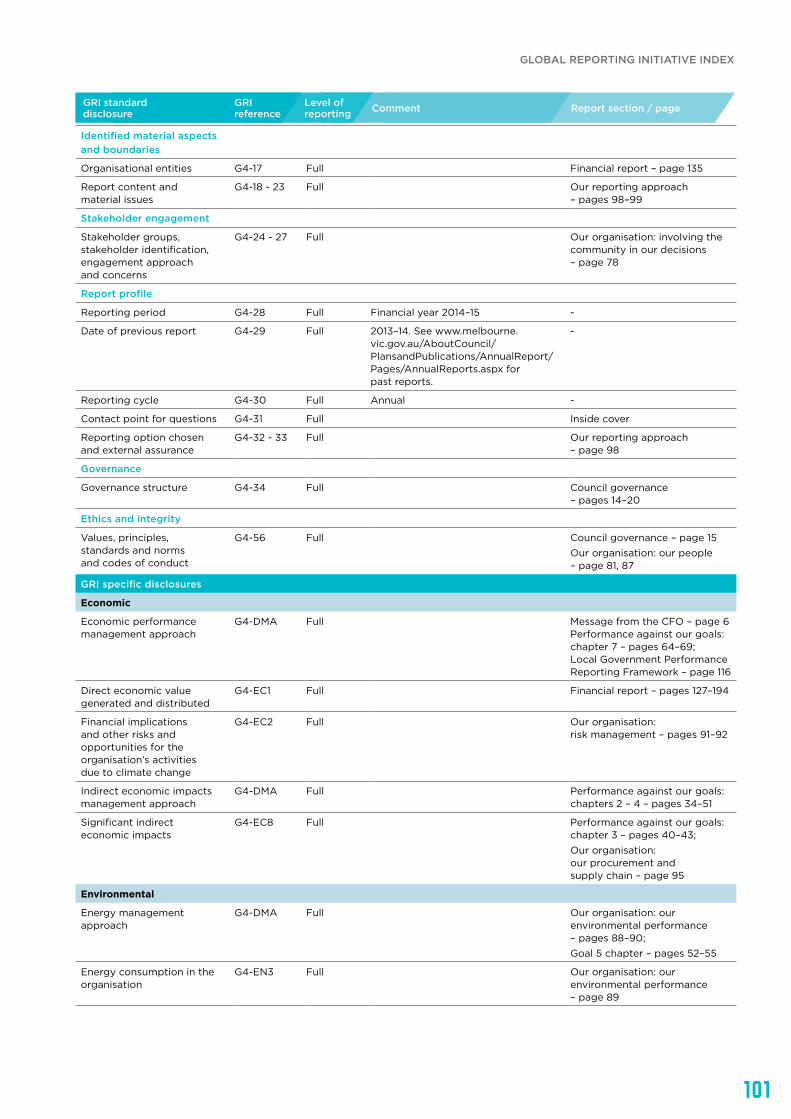
101
GRI reference
GRI standard disclosure
Level of reporting Comment Report section / page
Identified material aspects and boundaries
Organisational entities G4-17 Full Financial report – page 135
Report content and material issues
G4-18 - 23 Full Our reporting approach – pages 98–99
Stakeholder engagement
Stakeholder groups, stakeholder identification, engagement approach and concerns
G4-24 - 27 Full Our organisation: involving the community in our decisions – page 78
Report profile
Reporting period G4-28 Full Financial year 2014–15 -
Date of previous report G4-29 Full 2013–14. See www.melbourne.vic.gov.au/AboutCouncil/PlansandPublications/AnnualReport/Pages/AnnualReports.aspx for past reports.
-
Reporting cycle G4-30 Full Annual -
Contact point for questions G4-31 Full Inside cover
Reporting option chosen and external assurance
G4-32 - 33 Full Our reporting approach – page 98
Governance
Governance structure G4-34 Full Council governance – pages 14–20
Ethics and integrity
Values, principles, standards and norms and codes of conduct
G4-56 Full Council governance – page 15Our organisation: our people – page 81, 87
GRI specific disclosures
Economic
Economic performance management approach
G4-DMA Full Message from the CFO – page 6 Performance against our goals: chapter 7 – pages 64–69; Local Government Performance Reporting Framework – page 116
Direct economic value generated and distributed
G4-EC1 Full Financial report – pages 127–194
Financial implications and other risks and opportunities for the organisation’s activities due to climate change
G4-EC2 Full Our organisation: risk management – pages 91–92
Indirect economic impacts management approach
G4-DMA Full Performance against our goals: chapters 2 – 4 – pages 34–51
Significant indirect economic impacts
G4-EC8 Full Performance against our goals: chapter 3 – pages 40–43; Our organisation: our procurement and supply chain – page 95
Environmental
Energy management approach
G4-DMA Full Our organisation: our environmental performance – pages 88–90;Goal 5 chapter – pages 52–55
Energy consumption in the organisation
G4-EN3 Full Our organisation: our environmental performance – page 89
GLOBAL REPORTING INITIATIVE INDEX
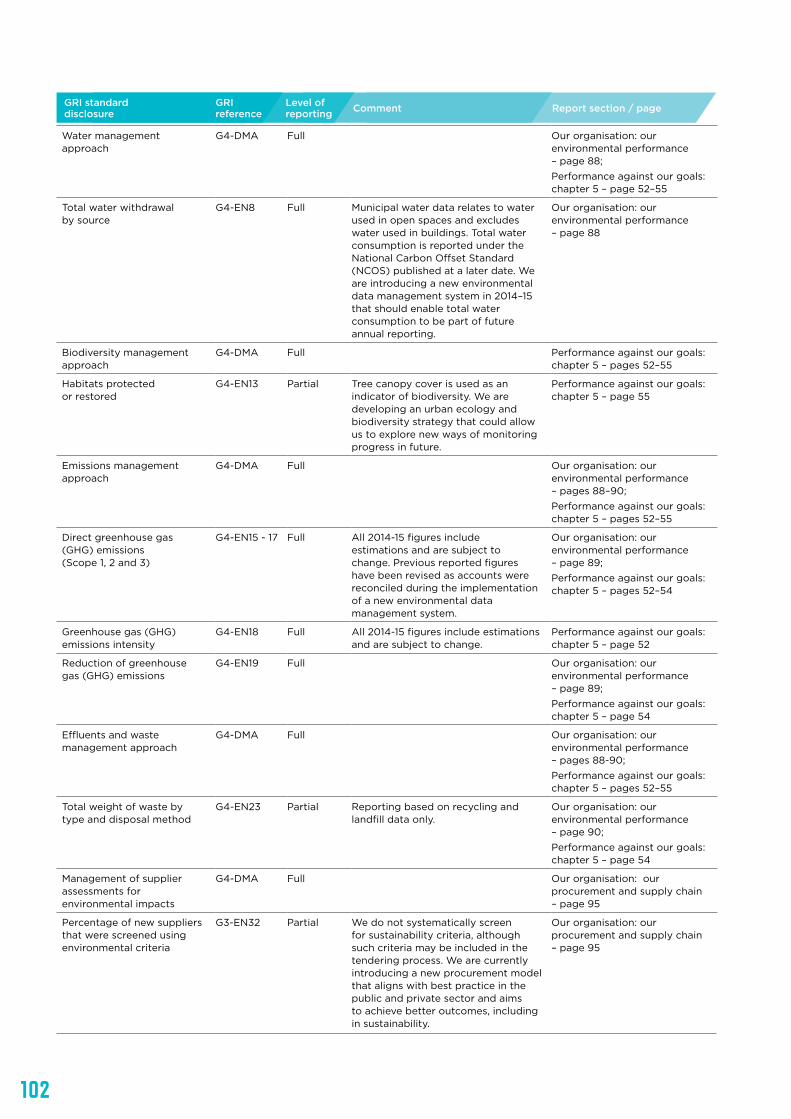
102
GRI reference
GRI standard disclosure
Level of reporting Comment Report section / page
Water management approach
G4-DMA Full Our organisation: our environmental performance – page 88;Performance against our goals: chapter 5 – page 52–55
Total water withdrawal by source
G4-EN8 Full Municipal water data relates to water used in open spaces and excludes water used in buildings. Total water consumption is reported under the National Carbon Offset Standard (NCOS) published at a later date. We are introducing a new environmental data management system in 2014–15 that should enable total water consumption to be part of future annual reporting.
Our organisation: our environmental performance – page 88
Biodiversity management approach
G4-DMA Full Performance against our goals: chapter 5 – pages 52–55
Habitats protected or restored
G4-EN13 Partial Tree canopy cover is used as an indicator of biodiversity. We are developing an urban ecology and biodiversity strategy that could allow us to explore new ways of monitoring progress in future.
Performance against our goals: chapter 5 – page 55
Emissions management approach
G4-DMA Full Our organisation: our environmental performance – pages 88–90;Performance against our goals: chapter 5 – pages 52–55
Direct greenhouse gas (GHG) emissions (Scope 1, 2 and 3)
G4-EN15 - 17 Full All 2014-15 figures include estimations and are subject to change. Previous reported figures have been revised as accounts were reconciled during the implementation of a new environmental data management system.
Our organisation: our environmental performance – page 89;Performance against our goals: chapter 5 – pages 52–54
Greenhouse gas (GHG) emissions intensity
G4-EN18 Full All 2014-15 figures include estimations and are subject to change.
Performance against our goals: chapter 5 – page 52
Reduction of greenhouse gas (GHG) emissions
G4-EN19 Full Our organisation: our environmental performance – page 89;Performance against our goals: chapter 5 – page 54
Effluents and waste management approach
G4-DMA Full Our organisation: our environmental performance – pages 88-90;Performance against our goals: chapter 5 – pages 52–55
Total weight of waste by type and disposal method
G4-EN23 Partial Reporting based on recycling and landfill data only.
Our organisation: our environmental performance – page 90;Performance against our goals: chapter 5 – page 54
Management of supplier assessments for environmental impacts
G4-DMA Full Our organisation: our procurement and supply chain – page 95
Percentage of new suppliers that were screened using environmental criteria
G3-EN32 Partial We do not systematically screen for sustainability criteria, although such criteria may be included in the tendering process. We are currently introducing a new procurement model that aligns with best practice in the public and private sector and aims to achieve better outcomes, including in sustainability.
Our organisation: our procurement and supply chain – page 95
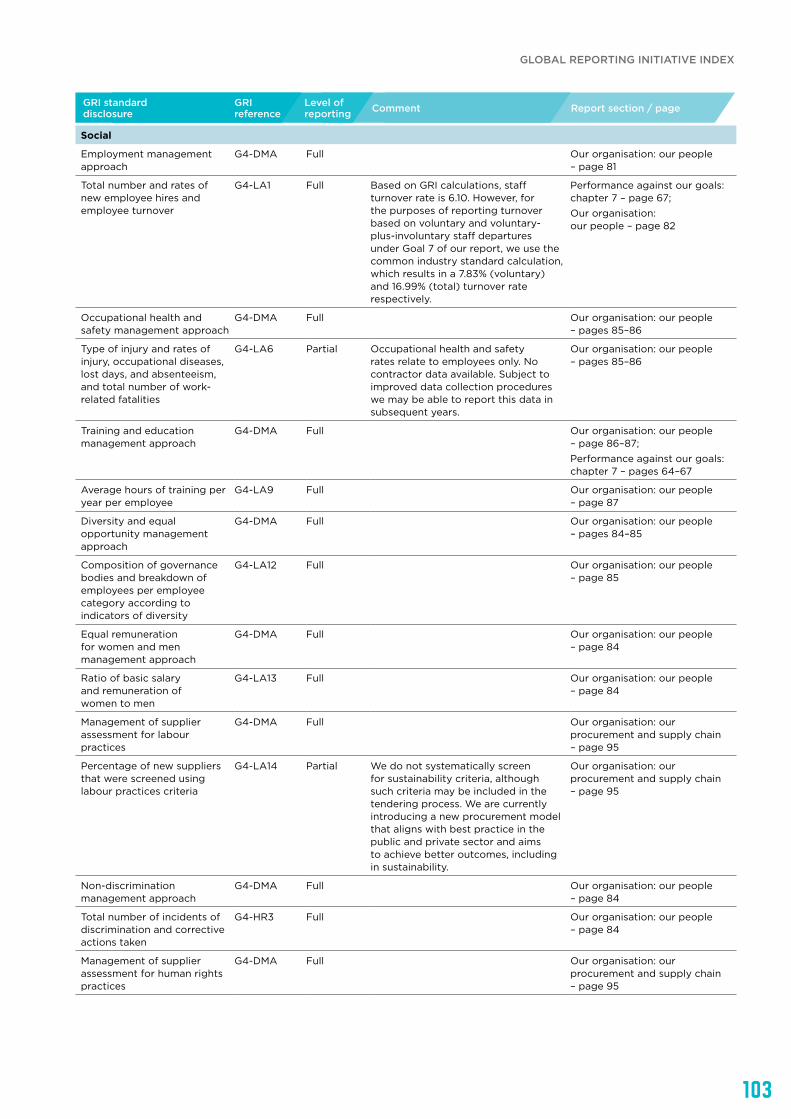
103
GRI reference
GRI standard disclosure
Level of reporting Comment Report section / page
Social
Employment management approach
G4-DMA Full Our organisation: our people – page 81
Total number and rates of new employee hires and employee turnover
G4-LA1 Full Based on GRI calculations, staff turnover rate is 6.10. However, for the purposes of reporting turnover based on voluntary and voluntary-plus-involuntary staff departures under Goal 7 of our report, we use the common industry standard calculation, which results in a 7.83% (voluntary) and 16.99% (total) turnover rate respectively.
Performance against our goals: chapter 7 – page 67; Our organisation: our people – page 82
Occupational health and safety management approach
G4-DMA Full Our organisation: our people – pages 85–86
Type of injury and rates of injury, occupational diseases, lost days, and absenteeism, and total number of work-related fatalities
G4-LA6 Partial Occupational health and safety rates relate to employees only. No contractor data available. Subject to improved data collection procedures we may be able to report this data in subsequent years.
Our organisation: our people – pages 85–86
Training and education management approach
G4-DMA Full Our organisation: our people – page 86–87;Performance against our goals: chapter 7 – pages 64–67
Average hours of training per year per employee
G4-LA9 Full Our organisation: our people – page 87
Diversity and equal opportunity management approach
G4-DMA Full Our organisation: our people – pages 84–85
Composition of governance bodies and breakdown of employees per employee category according to indicators of diversity
G4-LA12 Full Our organisation: our people – page 85
Equal remuneration for women and men management approach
G4-DMA Full Our organisation: our people – page 84
Ratio of basic salary and remuneration of women to men
G4-LA13 Full Our organisation: our people – page 84
Management of supplier assessment for labour practices
G4-DMA Full Our organisation: our procurement and supply chain – page 95
Percentage of new suppliers that were screened using labour practices criteria
G4-LA14 Partial We do not systematically screen for sustainability criteria, although such criteria may be included in the tendering process. We are currently introducing a new procurement model that aligns with best practice in the public and private sector and aims to achieve better outcomes, including in sustainability.
Our organisation: our procurement and supply chain – page 95
Non-discrimination management approach
G4-DMA Full Our organisation: our people – page 84
Total number of incidents of discrimination and corrective actions taken
G4-HR3 Full Our organisation: our people – page 84
Management of supplier assessment for human rights practices
G4-DMA Full Our organisation: our procurement and supply chain – page 95
GLOBAL REPORTING INITIATIVE INDEX

104
GRI reference
GRI standard disclosure
Level of reporting Comment Report section / page
Percentage of new suppliers that were screened using human rights criteria
G4-HR10 Partial We do not systematically screen for sustainability criteria, although such criteria may be included in the tendering process. We are currently introducing a new procurement model that aligns with best practice in the public and private sector and aims to achieve better outcomes, including in sustainability.
Our organisation: procurement and supply chain – page 95
Local communities management approach
G4-DMA Full Our organisation: involving the community in our decisions – pages 78–79; Performance against our goals: chapters 1, 8 – pages 24–29, 70–73
Percentage of operations with implemented local community engagement, impact assessments, and development programs
G4-SO1 Full Our organisation: involving the community in our decisions – page 78
Anti-corruption management approach
G4-DMA Full Council governance – page 15;Our organisation: our people – pages 86–87
Communication and training on anti-corruption policies and procedures
G4-SO4 Full Council governance – page 15;Our organisation: our people – page 87
Management of supplier assessment for social impacts
G4-DMA Full Our organisation: our procurement and supply chain – page 95
Percentage of new suppliers that were screened using criteria for impacts on society
G4-SO9 Partial We do not systematically screen for sustainability criteria, although such criteria may be included in the tendering process. We are currently introducing a new procurement model that aligns with best practice in the public and private sector and aims to achieve better outcomes, including in sustainability.
Our organisation: our procurement and supply chain – page 95
Customer health and safety management approach
G4-DMA Full The diverse nature of our services and products means no data is available on the percentage for which health and safety impacts are assessed for improvement.
Our organisation: interacting with customers – pages 96–97;Local Government Performance Reporting Framework – pages 109–110
Percentage of significant product and service categories for which health and safety impacts are assessed for improvement
G4-PR1 Partial All products and services are assessed for health and safety impacts in accordance with our legislative obligations and policy procedures. The diverse nature of our services and products means no statistical evaluation is available.
Our organisation: interacting with customers – page 97
Product and service labelling management approach
G4-DMA Full Our organisation: continuous improvement– page 80;Our organisation: interacting with customers – pages 96–97;Performance against our goals: chapter 7 – page 64–67;Local Government Performance Reporting Framework – pages 109–114
Results of surveys measuring customer satisfaction
G4-PR5 Full Performance against our goals: chapter 7 – page 67Local Government Performance Reporting Framework – pages 109–114
Customer privacy management approach
G4-DMA Full Our organisation: interacting with customers – page 96
Total number of substantiated complaints regarding breaches of customer privacy and losses of customer data
G4-PR8 Full Our organisation: interacting with customers – page 96
GLOBAL REPORTING INITIATIVE INDEX

105
Address 2014 Consolidated value $million
2015 Consolidated value $million
2013 Consolidated value $million
property HOLDINGS
Royal Park, Flemington Road, PARKVILLE VIC 3052 $287.5 $287.1 $307.8
Fawkner Park, 24–88 Commercial Road, SOUTH YARRA VIC 3141
$190.1 $190.1 $189.6
Fitzroy Gardens, 230-298 Wellington Parade, EAST MELBOURNE VIC 3002
$168.6 $162.8 $162.9
Kings Domain, Alexandra Avenue, MELBOURNE VIC 3004 $130.9 $130.9 $130.9
Queen Victoria Market, 65–159 Victoria Street, MELBOURNE VIC 3000
$103.8 $103.3 $80.8
Princes Park, 200–590 Royal Parade, CARLTON NORTH VIC 3054
$97.4 $97.4 $97.1
Melbourne Town Hall – “including Administration Building” 90-130 Swanston Street, MELBOURNE VIC 3000
$95.4 $96.3 $81.1
Council House 2, 218–242 Little Collins Street, MELBOURNE VIC 3000
$53.7 $53.7 $51.1
Flagstaff Gardens, 309–311 William Street, WEST MELBOURNE VIC 3003
$50.3 $50.3 $49.3
Birrarung Marr, Batman Avenue, MELBOURNE VIC 3000 $40.4 $40.4 $41.1
Carlton Gardens South, Victoria Street, CARLTON VIC 3053 $36.2 $36.2 $36.3
Alexandra Gardens, St Kilda Road, MELBOURNE VIC 3004 $33.7 $33.7 $33.7
Queen Victoria Gardens, St Kilda Road, MELBOURNE VIC 3004
$33.0 $33.0 $32.7
Alexandra Park, Alexandra Avenue, MELBOURNE VIC 3004 $31.6 $31.6 $31.7
Council House, 196–212 Little Collins Street, MELBOURNE VIC 3000
$31.0 $31.0 $25.9
Carlton Gardens North, 1-111 Carlton Street, CARLTON VIC 3053
$29.6 $29.6 $29.6
Treasury Gardens, 2–18 Spring Street, EAST MELBOURNE VIC 3002
$29.3 $29.3 $29.4
J.J. Holland Park, 67–121 Kensington Road, KENSINGTON VIC 3031
$27.8 $27.8 $23.1
Carlton Baths, 216–248 Rathdowne Street, CARLTON VIC 3053
$25.0 $25.0 $29.0
City Square, 199–209 Collins Street, MELBOURNE VIC 3000 $19.5 $19.0 $19.3
• All valuations as at 30 June of the respective year.
• The consolidated values contained within this list include both land and building asset values applicable to the specific sites.
• The land values included in the Council Asset Register relate to land holdings both owned and controlled by the Council.
• The City of Melbourne has significant crown land holdings controlled on behalf of the Crown via various structures including
crown grants, committees of management and other reservations.
• The Council is required to value land and building assets pursuant to the provisions of AASB 116 and AASB 13. The ‘fair value’ applicable to land value assessments, specifically parks and alike, are significantly adjusted against full market value reflecting legislative provisions, site control, use restrictions and other limitations directly associated with their public use.
Significant changes to our facilities in 2014–15• Waterways office has relocated from leased accommodation to premises purchased
by the City of Melbourne in 2014 and was refurbished in January to February 2015.• Library at the Dock was completed October 2014, and Kathleen Syme refurbished
during 2014–15 for opening in July. • Kensington Town Hall was refurbished in 2014–15 and re-opened as a community hub
and function space.
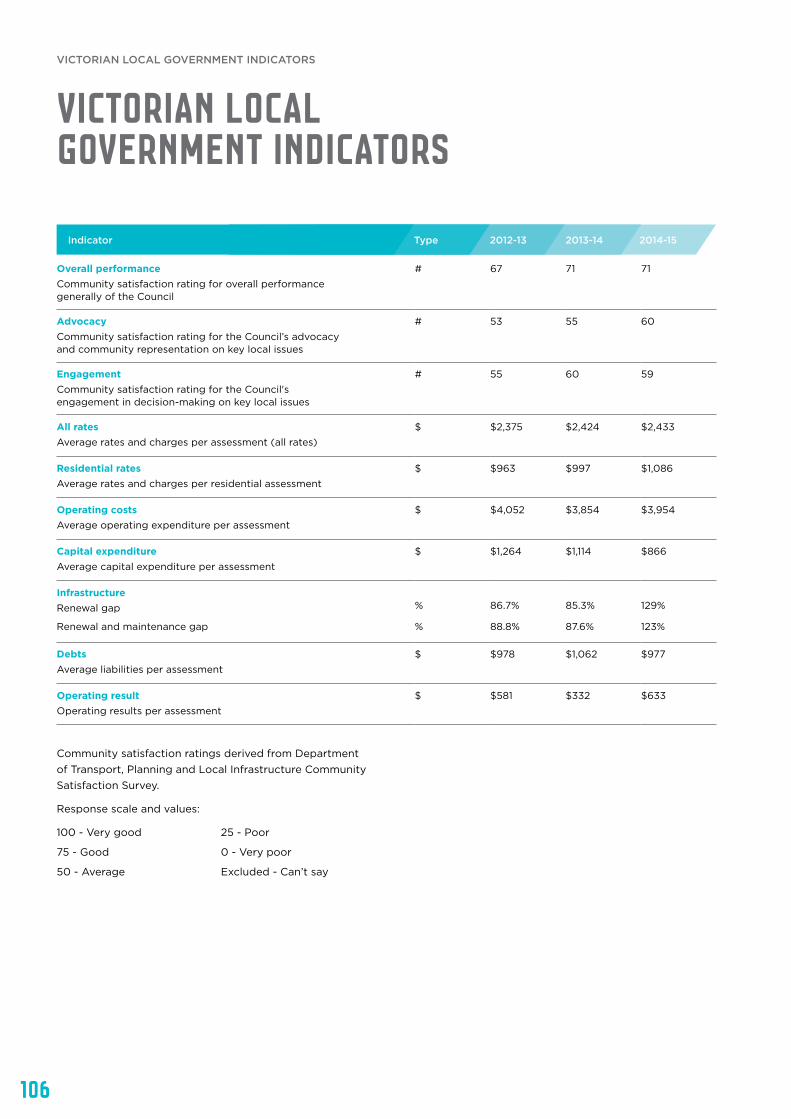
106
Type 2012-13 2013-14 2014-15
Overall performanceCommunity satisfaction rating for overall performance generally of the Council
# 67 71 71
AdvocacyCommunity satisfaction rating for the Council’s advocacy and community representation on key local issues
# 53 55 60
Engagement Community satisfaction rating for the Council's engagement in decision-making on key local issues
# 55 60 59
All ratesAverage rates and charges per assessment (all rates)
$ $2,375 $2,424 $2,433
Residential rates Average rates and charges per residential assessment
$ $963 $997 $1,086
Operating costs Average operating expenditure per assessment
$ $4,052 $3,854 $3,954
Capital expenditure Average capital expenditure per assessment
$ $1,264 $1,114 $866
Infrastructure Renewal gap
%
86.7%
85.3%
129%
Renewal and maintenance gap % 88.8% 87.6% 123%
Debts Average liabilities per assessment
$ $978 $1,062 $977
Operating result Operating results per assessment
$ $581 $332 $633
Victorian Local Government Indicators
Indicator
Community satisfaction ratings derived from Department of Transport, Planning and Local Infrastructure Community Satisfaction Survey.
Response scale and values:
100 - Very good
75 - Good
50 - Average
25 - Poor
0 - Very poor
Excluded - Can’t say
VICTORIAN LOCAL GOVERNMENT INDICATORS
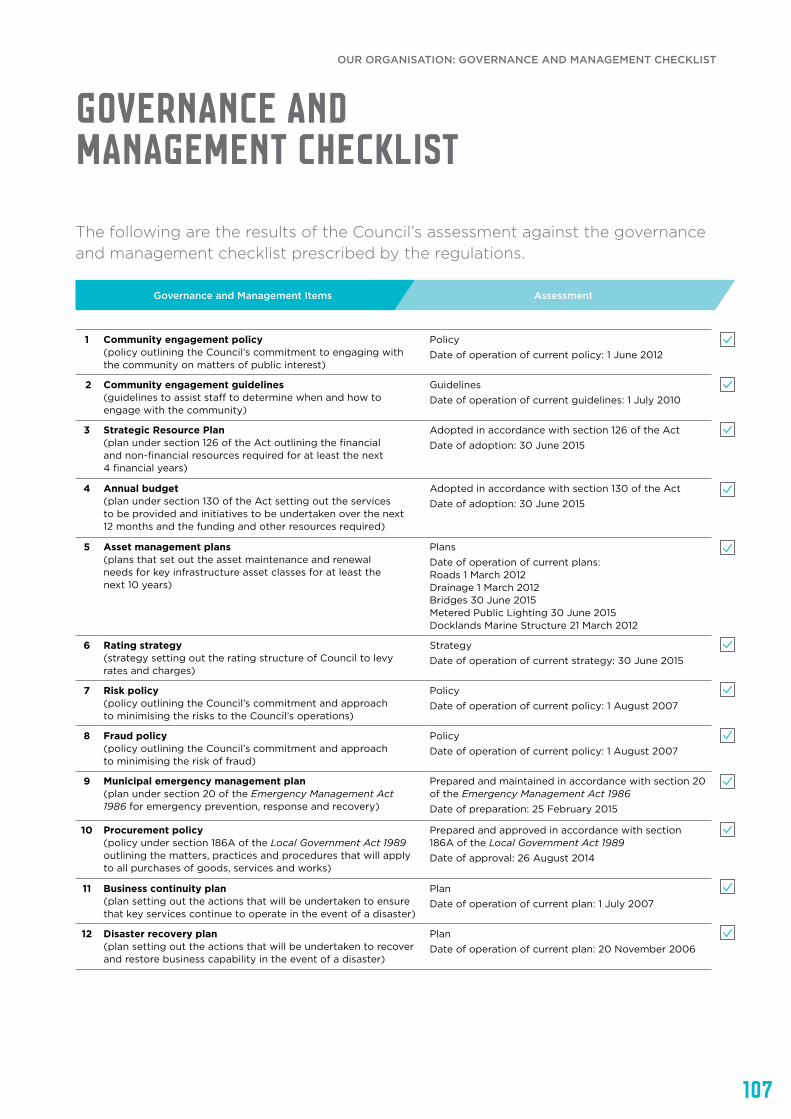
107
Governance and Management Checklist
1 Community engagement policy (policy outlining the Council’s commitment to engaging with the community on matters of public interest)
Policy Date of operation of current policy: 1 June 2012
2 Community engagement guidelines (guidelines to assist staff to determine when and how to engage with the community)
Guidelines Date of operation of current guidelines: 1 July 2010
3 Strategic Resource Plan (plan under section 126 of the Act outlining the financial and non-financial resources required for at least the next 4 financial years)
Adopted in accordance with section 126 of the Act Date of adoption: 30 June 2015
4 Annual budget (plan under section 130 of the Act setting out the services to be provided and initiatives to be undertaken over the next 12 months and the funding and other resources required)
Adopted in accordance with section 130 of the ActDate of adoption: 30 June 2015
5 Asset management plans (plans that set out the asset maintenance and renewal needs for key infrastructure asset classes for at least the next 10 years)
PlansDate of operation of current plans: Roads 1 March 2012 Drainage 1 March 2012 Bridges 30 June 2015 Metered Public Lighting 30 June 2015 Docklands Marine Structure 21 March 2012
6 Rating strategy (strategy setting out the rating structure of Council to levy rates and charges)
StrategyDate of operation of current strategy: 30 June 2015
7 Risk policy (policy outlining the Council’s commitment and approach to minimising the risks to the Council’s operations)
PolicyDate of operation of current policy: 1 August 2007
8 Fraud policy (policy outlining the Council’s commitment and approach to minimising the risk of fraud)
Policy Date of operation of current policy: 1 August 2007
9 Municipal emergency management plan (plan under section 20 of the Emergency Management Act 1986 for emergency prevention, response and recovery)
Prepared and maintained in accordance with section 20 of the Emergency Management Act 1986 Date of preparation: 25 February 2015
10 Procurement policy (policy under section 186A of the Local Government Act 1989 outlining the matters, practices and procedures that will apply to all purchases of goods, services and works)
Prepared and approved in accordance with section 186A of the Local Government Act 1989 Date of approval: 26 August 2014
11 Business continuity plan (plan setting out the actions that will be undertaken to ensure that key services continue to operate in the event of a disaster)
PlanDate of operation of current plan: 1 July 2007
12 Disaster recovery plan (plan setting out the actions that will be undertaken to recover and restore business capability in the event of a disaster)
PlanDate of operation of current plan: 20 November 2006
Governance and Management Items Assessment
The following are the results of the Council’s assessment against the governance and management checklist prescribed by the regulations.
OUR ORGANISATION: GOVERNANCE AND MANAGEMENT CHECKLIST
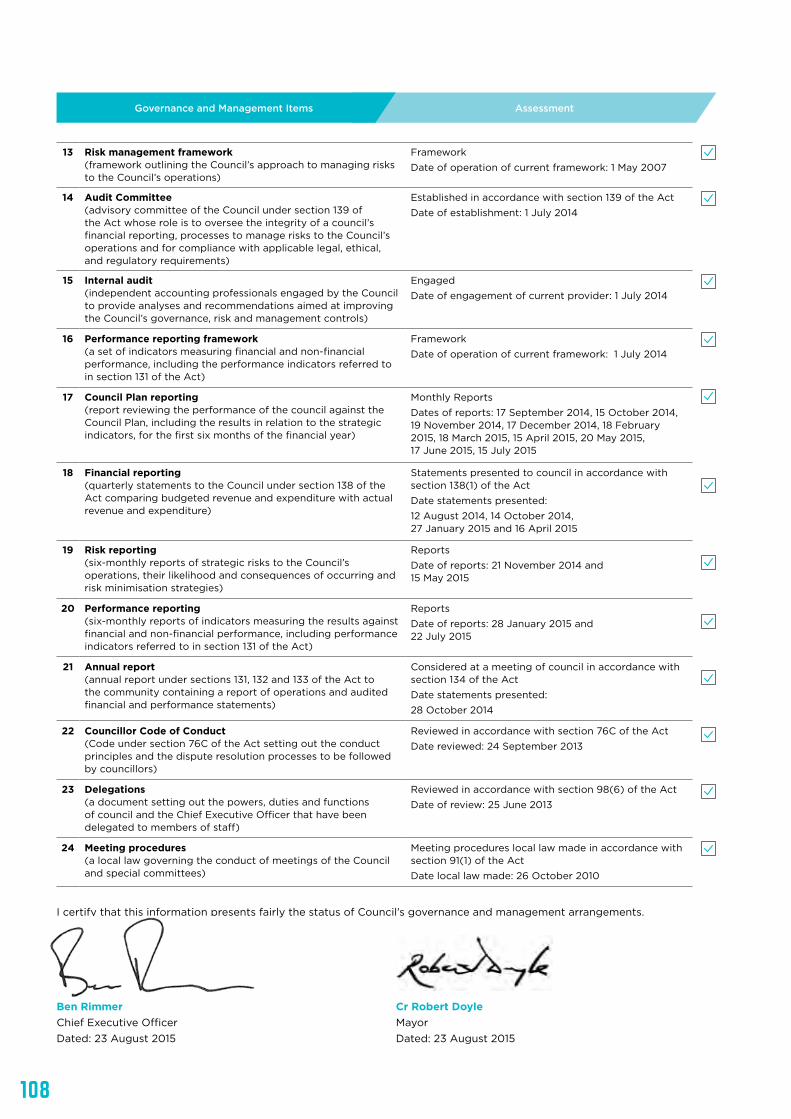
108
13 Risk management framework (framework outlining the Council’s approach to managing risks to the Council’s operations)
FrameworkDate of operation of current framework: 1 May 2007
14 Audit Committee (advisory committee of the Council under section 139 of the Act whose role is to oversee the integrity of a council’s financial reporting, processes to manage risks to the Council’s operations and for compliance with applicable legal, ethical, and regulatory requirements)
Established in accordance with section 139 of the Act Date of establishment: 1 July 2014
15 Internal audit (independent accounting professionals engaged by the Council to provide analyses and recommendations aimed at improving the Council’s governance, risk and management controls)
Engaged Date of engagement of current provider: 1 July 2014
16 Performance reporting framework (a set of indicators measuring financial and non-financial performance, including the performance indicators referred to in section 131 of the Act)
Framework Date of operation of current framework: 1 July 2014
17 Council Plan reporting (report reviewing the performance of the council against the Council Plan, including the results in relation to the strategic indicators, for the first six months of the financial year)
Monthly Reports Dates of reports: 17 September 2014, 15 October 2014, 19 November 2014, 17 December 2014, 18 February 2015, 18 March 2015, 15 April 2015, 20 May 2015, 17 June 2015, 15 July 2015
18 Financial reporting (quarterly statements to the Council under section 138 of the Act comparing budgeted revenue and expenditure with actual revenue and expenditure)
Statements presented to council in accordance with section 138(1) of the Act Date statements presented: 12 August 2014, 14 October 2014, 27 January 2015 and 16 April 2015
19 Risk reporting (six-monthly reports of strategic risks to the Council’s operations, their likelihood and consequences of occurring and risk minimisation strategies)
Reports Date of reports: 21 November 2014 and 15 May 2015
20 Performance reporting (six-monthly reports of indicators measuring the results against financial and non-financial performance, including performance indicators referred to in section 131 of the Act)
Reports Date of reports: 28 January 2015 and 22 July 2015
21 Annual report (annual report under sections 131, 132 and 133 of the Act to the community containing a report of operations and audited financial and performance statements)
Considered at a meeting of council in accordance with section 134 of the Act Date statements presented: 28 October 2014
22 Councillor Code of Conduct (Code under section 76C of the Act setting out the conduct principles and the dispute resolution processes to be followed by councillors)
Reviewed in accordance with section 76C of the ActDate reviewed: 24 September 2013
23 Delegations (a document setting out the powers, duties and functions of council and the Chief Executive Officer that have been delegated to members of staff)
Reviewed in accordance with section 98(6) of the ActDate of review: 25 June 2013
24 Meeting procedures (a local law governing the conduct of meetings of the Council and special committees)
Meeting procedures local law made in accordance with section 91(1) of the ActDate local law made: 26 October 2010
Governance and Management Items Assessment
I certify that this information presents fairly the status of Council’s governance and management arrangements.
Ben Rimmer Chief Executive Officer Dated: 23 August 2015
Cr Robert Doyle Mayor Dated: 23 August 2015

109
Service Performance Indicators Service/Indicator/measure Results 2015 Material Variations
Aquatic Facilities
AF1
28
Satisfaction User satisfaction with aquatic facilities (optional)[User satisfaction with how council has performed on provision of aquatic facilities]
0.00
This is an optional measure that we are not reporting in 2014-15.
AF2
29
Service standard Health inspections of aquatic facilities[Number of authorised officer inspections of Council aquatic facilities / Number of Council aquatic facilities]
0.75
One of our aquatic facilities was closed for maintenance during the last quarter of the year prior to scheduled inspection.
AF3
30
Health and Safety Reportable safety incidents at aquatic facilities [Number of WorkSafe reportable aquatic facility safety incidents]
4.00
All aquatic facilities have wet (pool) and dry (gym and other sports) areas. The four reportable incidents all occurred in the dry areas.
AF4
31
Service cost Cost of indoor aquatic facilities [Direct cost of indoor aquatic facilities less income received / Number of visits to indoor aquatic facilities]
$5.51
The City of Melbourne guidelines for lifeguard-to-customer ratio is double the minimum (Royal Lifesaving Society of Australia Guideline Ratio 1:100; City of Melbourne ratio 1:50). This is consistent at our in-house managed facilities and those managed under contract.
AF5
32
Service Cost Cost of outdoor aquatic facilities [Direct cost of outdoor aquatic facilities less income received / Number of visits to outdoor aquatic facilities]
$5.12
The City of Melbourne guidelines for lifeguard-to-customer ratio is double the minimum (Royal Lifesaving Society of Australia Guideline Ratio 1:100; City of Melbourne ratio 1:50). This is consistent at our in-house managed facilities and those managed under contract.
AF6
33
Utilisation Utilisation of aquatic facilities [Number of visits to aquatic facilities / Municipal population]
1.62
There were no factors that had a material impact on this measure this year.
Animal Management
AM1
34
Timeliness Time taken to action animal management requests [Number of days between receipt and first response action for all animal management requests / Number of animal management requests]
0.01
There were no factors that had a material impact on this measure this year.
AM2
35
Service standard Animals reclaimed [Number of animals reclaimed / Number of animals collected] x100
41.15%
Wild cats made up 34% of the animals collected. These unregistered cats continue to be a significant proportion of the animals not claimed.
AM3
36
Service cost Cost of animal management service [Direct cost of the animal management service / Number of registered animals]
$112.25
There were no factors that had a material impact on this measure this year.
AM4
37
Health and safety Animal management prosecutions [Number of successful animal management prosecutions]
1.00
The City of Melbourne increased its presence in public places and education at community events throughout the year to promote and enforce responsible pet ownership.
Local Government Performance Reporting Framework Performance Indicators
OUR ORGANISATION: REPORT OF OPERATIONS
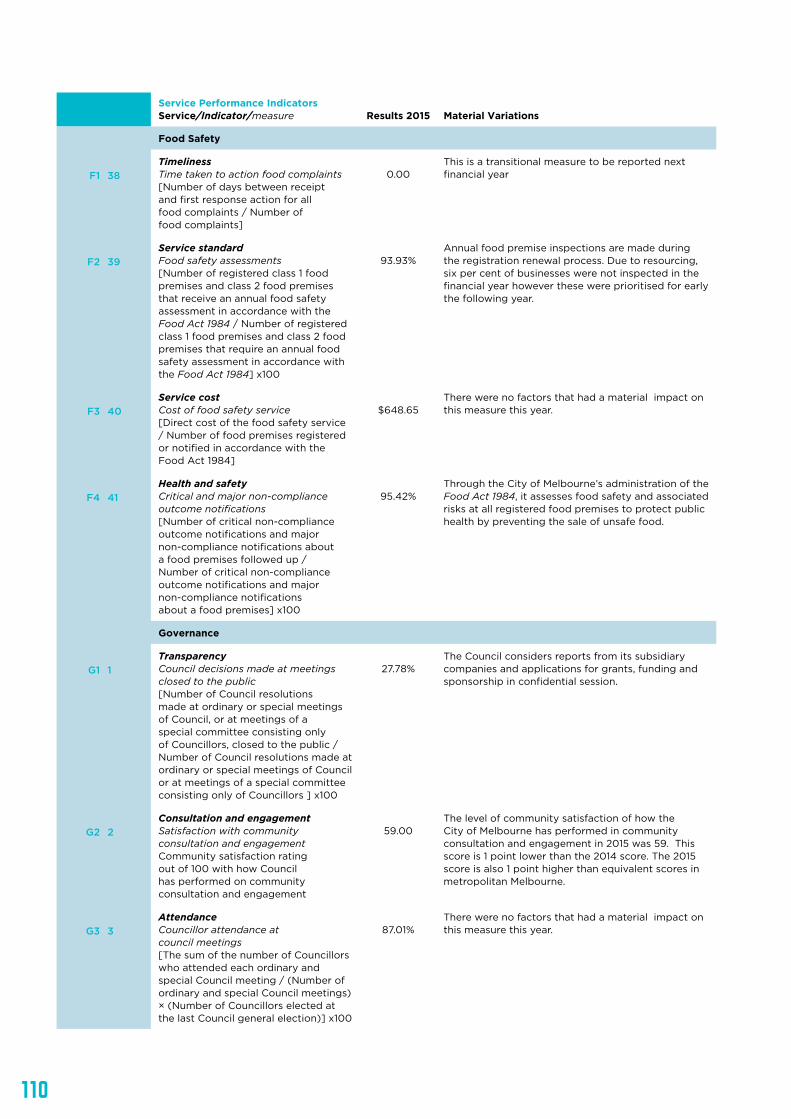
110
Service Performance Indicators Service/Indicator/measure Results 2015 Material Variations
Food Safety
F1
38
Timeliness Time taken to action food complaints [Number of days between receipt and first response action for all food complaints / Number of food complaints]
0.00
This is a transitional measure to be reported next financial year
F2
39
Service standard Food safety assessments [Number of registered class 1 food premises and class 2 food premises that receive an annual food safety assessment in accordance with the Food Act 1984 / Number of registered class 1 food premises and class 2 food premises that require an annual food safety assessment in accordance with the Food Act 1984] x100
93.93%
Annual food premise inspections are made during the registration renewal process. Due to resourcing, six per cent of businesses were not inspected in the financial year however these were prioritised for early the following year.
F3
40
Service cost Cost of food safety service [Direct cost of the food safety service / Number of food premises registered or notified in accordance with the Food Act 1984]
$648.65
There were no factors that had a material impact on this measure this year.
F4
41
Health and safety Critical and major non-compliance outcome notifications [Number of critical non-compliance outcome notifications and major non-compliance notifications about a food premises followed up / Number of critical non-compliance outcome notifications and major non-compliance notifications about a food premises] x100
95.42%
Through the City of Melbourne’s administration of the Food Act 1984, it assesses food safety and associated risks at all registered food premises to protect public health by preventing the sale of unsafe food.
Governance
G1
1
Transparency Council decisions made at meetings closed to the public [Number of Council resolutions made at ordinary or special meetings of Council, or at meetings of a special committee consisting only of Councillors, closed to the public / Number of Council resolutions made at ordinary or special meetings of Council or at meetings of a special committee consisting only of Councillors ] x100
27.78%
The Council considers reports from its subsidiary companies and applications for grants, funding and sponsorship in confidential session.
G2
2
Consultation and engagement Satisfaction with community consultation and engagement Community satisfaction rating out of 100 with how Council has performed on community consultation and engagement
59.00
The level of community satisfaction of how the City of Melbourne has performed in community consultation and engagement in 2015 was 59. This score is 1 point lower than the 2014 score. The 2015 score is also 1 point higher than equivalent scores in metropolitan Melbourne.
G3
3
Attendance Councillor attendance at council meetings [The sum of the number of Councillors who attended each ordinary and special Council meeting / (Number of ordinary and special Council meetings) × (Number of Councillors elected at the last Council general election)] x100
87.01%
There were no factors that had a material impact on this measure this year.
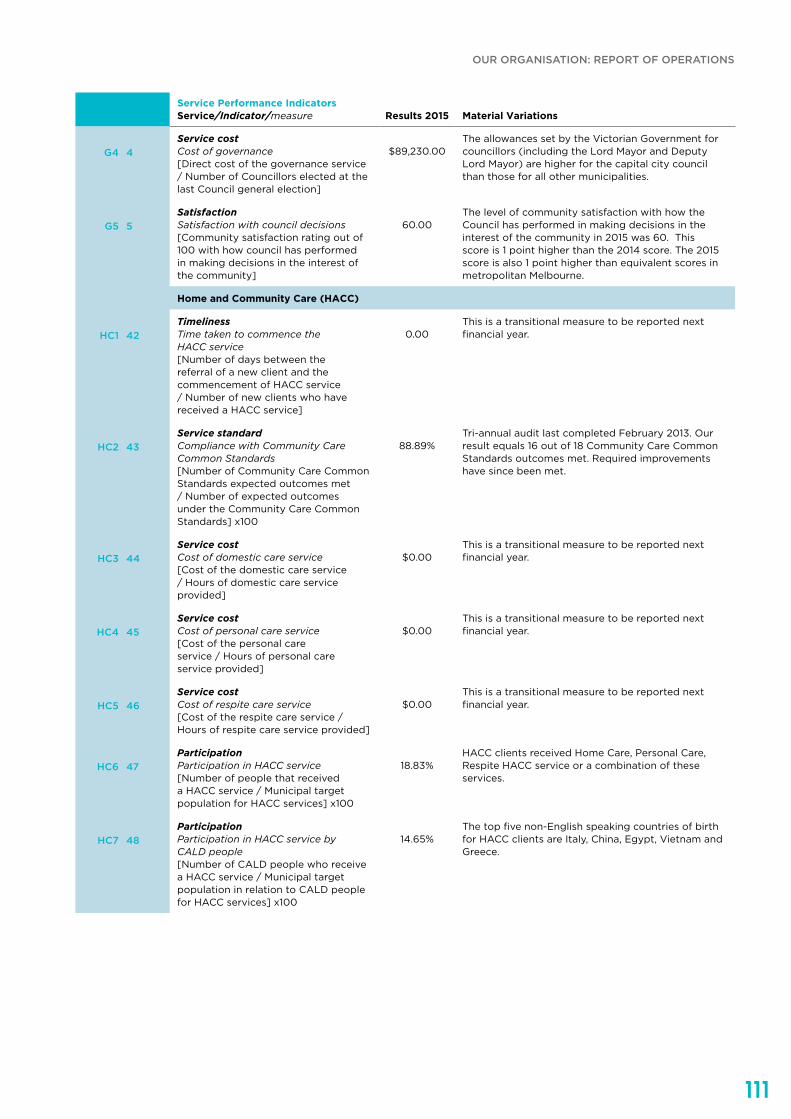
111
Service Performance Indicators Service/Indicator/measure Results 2015 Material Variations
G4
4
Service cost Cost of governance [Direct cost of the governance service / Number of Councillors elected at the last Council general election]
$89,230.00
The allowances set by the Victorian Government for councillors (including the Lord Mayor and Deputy Lord Mayor) are higher for the capital city council than those for all other municipalities.
G5
5
Satisfaction Satisfaction with council decisions [Community satisfaction rating out of 100 with how council has performed in making decisions in the interest of the community]
60.00
The level of community satisfaction with how the Council has performed in making decisions in the interest of the community in 2015 was 60. This score is 1 point higher than the 2014 score. The 2015 score is also 1 point higher than equivalent scores in metropolitan Melbourne.
Home and Community Care (HACC)
HC1
42
Timeliness Time taken to commence the HACC service [Number of days between the referral of a new client and the commencement of HACC service / Number of new clients who have received a HACC service]
0.00
This is a transitional measure to be reported next financial year.
HC2
43
Service standard Compliance with Community Care Common Standards [Number of Community Care Common Standards expected outcomes met / Number of expected outcomes under the Community Care Common Standards] x100
88.89%
Tri-annual audit last completed February 2013. Our result equals 16 out of 18 Community Care Common Standards outcomes met. Required improvements have since been met.
HC3
44
Service cost Cost of domestic care service [Cost of the domestic care service / Hours of domestic care service provided]
$0.00
This is a transitional measure to be reported next financial year.
HC4
45
Service cost Cost of personal care service [Cost of the personal care service / Hours of personal care service provided]
$0.00
This is a transitional measure to be reported next financial year.
HC5
46
Service cost Cost of respite care service [Cost of the respite care service / Hours of respite care service provided]
$0.00
This is a transitional measure to be reported next financial year.
HC6
47
Participation Participation in HACC service [Number of people that received a HACC service / Municipal target population for HACC services] x100
18.83%
HACC clients received Home Care, Personal Care, Respite HACC service or a combination of these services.
HC7
48
Participation Participation in HACC service by CALD people [Number of CALD people who receive a HACC service / Municipal target population in relation to CALD people for HACC services] x100
14.65%
The top five non-English speaking countries of birth for HACC clients are Italy, China, Egypt, Vietnam and Greece.
OUR ORGANISATION: REPORT OF OPERATIONS
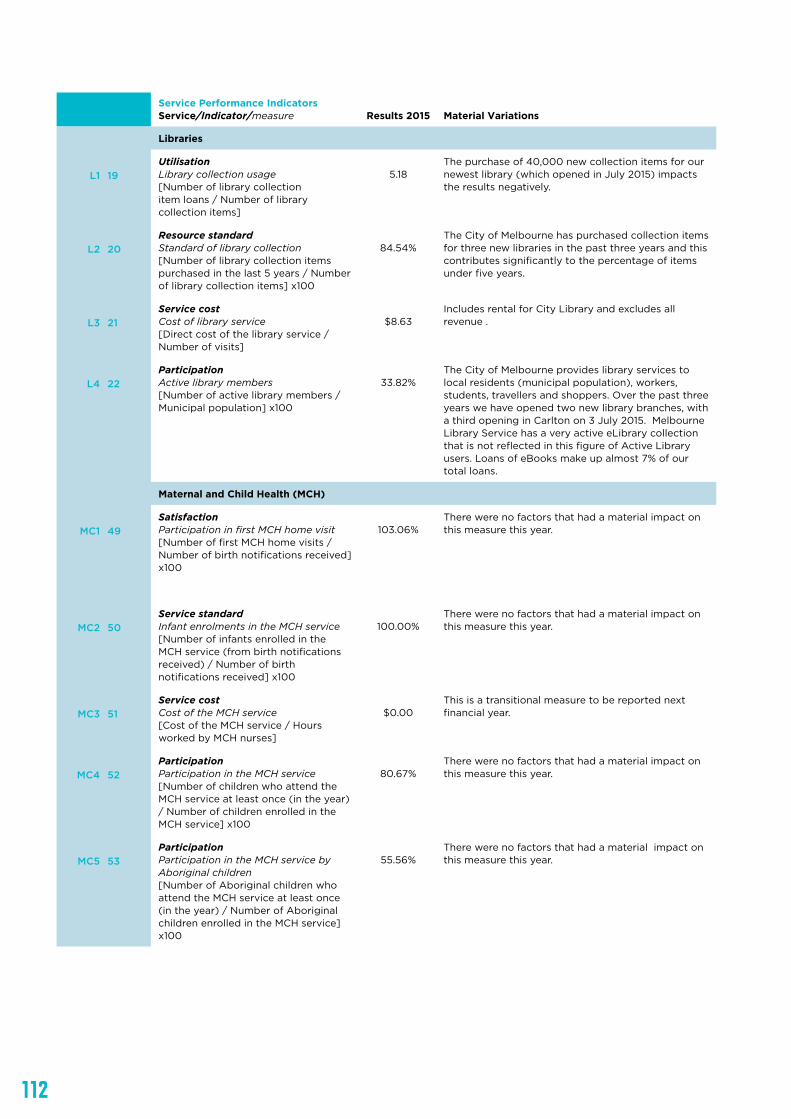
112
Service Performance Indicators Service/Indicator/measure Results 2015 Material Variations
Libraries
L1
19
Utilisation Library collection usage [Number of library collection item loans / Number of library collection items]
5.18
The purchase of 40,000 new collection items for our newest library (which opened in July 2015) impacts the results negatively.
L2
20
Resource standard Standard of library collection [Number of library collection items purchased in the last 5 years / Number of library collection items] x100
84.54%
The City of Melbourne has purchased collection items for three new libraries in the past three years and this contributes significantly to the percentage of items under five years.
L3
21
Service cost Cost of library service [Direct cost of the library service / Number of visits]
$8.63
Includes rental for City Library and excludes all revenue .
L4
22
Participation Active library members [Number of active library members / Municipal population] x100
33.82%
The City of Melbourne provides library services to local residents (municipal population), workers, students, travellers and shoppers. Over the past three years we have opened two new library branches, with a third opening in Carlton on 3 July 2015. Melbourne Library Service has a very active eLibrary collection that is not reflected in this figure of Active Library users. Loans of eBooks make up almost 7% of our total loans.
Maternal and Child Health (MCH)
MC1
49
Satisfaction Participation in first MCH home visit [Number of first MCH home visits / Number of birth notifications received] x100
103.06%
There were no factors that had a material impact on this measure this year.
MC2
50
Service standard Infant enrolments in the MCH service [Number of infants enrolled in the MCH service (from birth notifications received) / Number of birth notifications received] x100
100.00%
There were no factors that had a material impact on this measure this year.
MC3
51
Service cost Cost of the MCH service [Cost of the MCH service / Hours worked by MCH nurses]
$0.00
This is a transitional measure to be reported next financial year.
MC4
52
Participation Participation in the MCH service [Number of children who attend the MCH service at least once (in the year) / Number of children enrolled in the MCH service] x100
80.67%
There were no factors that had a material impact on this measure this year.
MC5
53
Participation Participation in the MCH service by Aboriginal children [Number of Aboriginal children who attend the MCH service at least once (in the year) / Number of Aboriginal children enrolled in the MCH service] x100
55.56%
There were no factors that had a material impact on this measure this year.
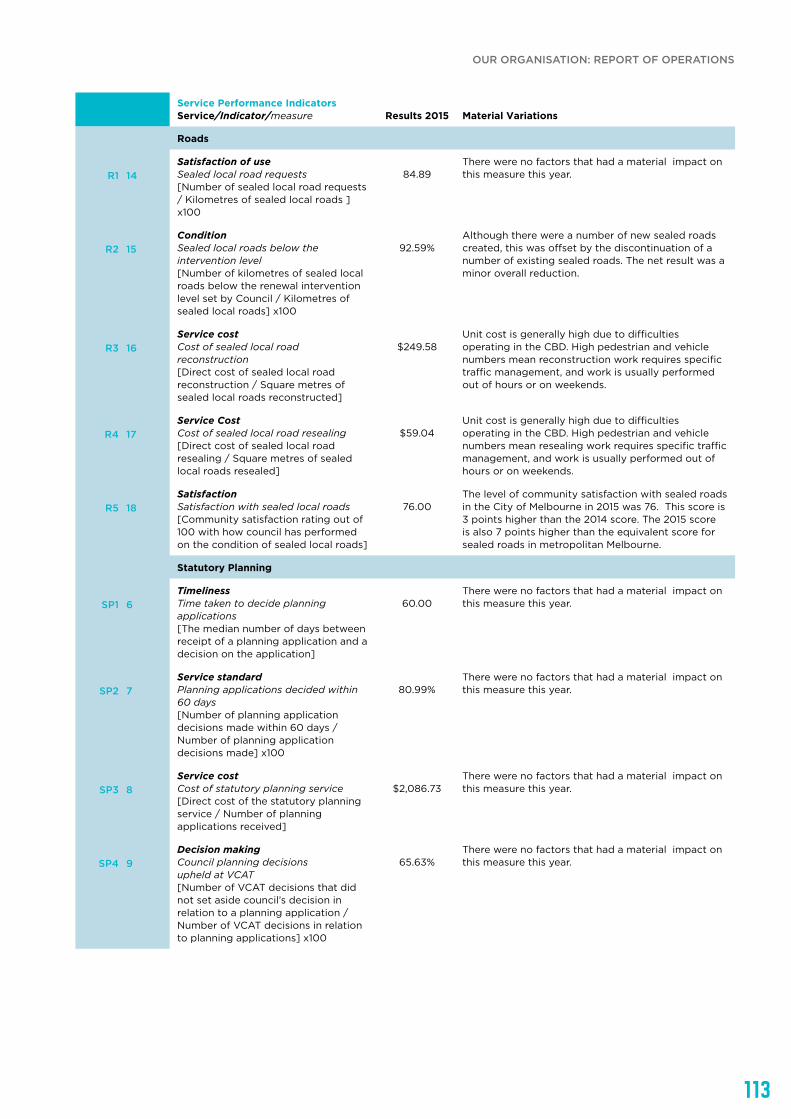
113
Service Performance Indicators Service/Indicator/measure Results 2015 Material Variations
Roads
R1
14
Satisfaction of use Sealed local road requests [Number of sealed local road requests / Kilometres of sealed local roads ] x100
84.89
There were no factors that had a material impact on this measure this year.
R2
15
Condition Sealed local roads below the intervention level [Number of kilometres of sealed local roads below the renewal intervention level set by Council / Kilometres of sealed local roads] x100
92.59%
Although there were a number of new sealed roads created, this was offset by the discontinuation of a number of existing sealed roads. The net result was a minor overall reduction.
R3
16
Service cost Cost of sealed local road reconstruction [Direct cost of sealed local road reconstruction / Square metres of sealed local roads reconstructed]
$249.58
Unit cost is generally high due to difficulties operating in the CBD. High pedestrian and vehicle numbers mean reconstruction work requires specific traffic management, and work is usually performed out of hours or on weekends.
R4
17
Service Cost Cost of sealed local road resealing [Direct cost of sealed local road resealing / Square metres of sealed local roads resealed]
$59.04
Unit cost is generally high due to difficulties operating in the CBD. High pedestrian and vehicle numbers mean resealing work requires specific traffic management, and work is usually performed out of hours or on weekends.
R5
18
Satisfaction Satisfaction with sealed local roads [Community satisfaction rating out of 100 with how council has performed on the condition of sealed local roads]
76.00
The level of community satisfaction with sealed roads in the City of Melbourne in 2015 was 76. This score is 3 points higher than the 2014 score. The 2015 score is also 7 points higher than the equivalent score for sealed roads in metropolitan Melbourne.
Statutory Planning
SP1
6
Timeliness Time taken to decide planning applications [The median number of days between receipt of a planning application and a decision on the application]
60.00
There were no factors that had a material impact on this measure this year.
SP2
7
Service standard Planning applications decided within 60 days [Number of planning application decisions made within 60 days / Number of planning application decisions made] x100
80.99%
There were no factors that had a material impact on this measure this year.
SP3
8
Service cost Cost of statutory planning service [Direct cost of the statutory planning service / Number of planning applications received]
$2,086.73
There were no factors that had a material impact on this measure this year.
SP4
9
Decision making Council planning decisions upheld at VCAT [Number of VCAT decisions that did not set aside council’s decision in relation to a planning application / Number of VCAT decisions in relation to planning applications] x100
65.63%
There were no factors that had a material impact on this measure this year.
OUR ORGANISATION: REPORT OF OPERATIONS
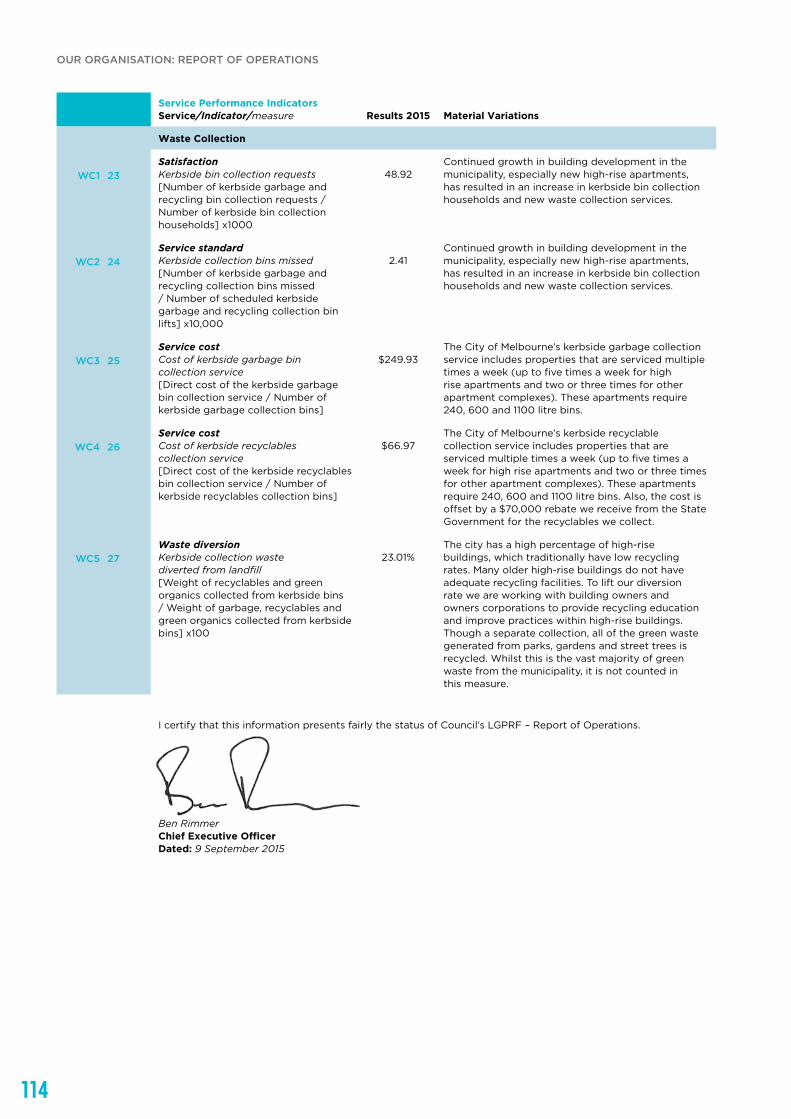
114
Service Performance Indicators Service/Indicator/measure Results 2015 Material Variations
Waste Collection
WC1
23
Satisfaction Kerbside bin collection requests [Number of kerbside garbage and recycling bin collection requests / Number of kerbside bin collection households] x1000
48.92
Continued growth in building development in the municipality, especially new high-rise apartments, has resulted in an increase in kerbside bin collection households and new waste collection services.
WC2
24
Service standard Kerbside collection bins missed [Number of kerbside garbage and recycling collection bins missed / Number of scheduled kerbside garbage and recycling collection bin lifts] x10,000
2.41
Continued growth in building development in the municipality, especially new high-rise apartments, has resulted in an increase in kerbside bin collection households and new waste collection services.
WC3
25
Service cost Cost of kerbside garbage bin collection service [Direct cost of the kerbside garbage bin collection service / Number of kerbside garbage collection bins]
$249.93
The City of Melbourne’s kerbside garbage collection service includes properties that are serviced multiple times a week (up to five times a week for high rise apartments and two or three times for other apartment complexes). These apartments require 240, 600 and 1100 litre bins.
WC4
26
Service cost Cost of kerbside recyclables collection service [Direct cost of the kerbside recyclables bin collection service / Number of kerbside recyclables collection bins]
$66.97
The City of Melbourne’s kerbside recyclable collection service includes properties that are serviced multiple times a week (up to five times a week for high rise apartments and two or three times for other apartment complexes). These apartments require 240, 600 and 1100 litre bins. Also, the cost is offset by a $70,000 rebate we receive from the State Government for the recyclables we collect.
WC5
27
Waste diversion Kerbside collection waste diverted from landfill [Weight of recyclables and green organics collected from kerbside bins / Weight of garbage, recyclables and green organics collected from kerbside bins] x100
23.01%
The city has a high percentage of high-rise buildings, which traditionally have low recycling rates. Many older high-rise buildings do not have adequate recycling facilities. To lift our diversion rate we are working with building owners and owners corporations to provide recycling education and improve practices within high-rise buildings. Though a separate collection, all of the green waste generated from parks, gardens and street trees is recycled. Whilst this is the vast majority of green waste from the municipality, it is not counted in this measure.
I certify that this information presents fairly the status of Council’s LGPRF – Report of Operations.
____________________________
Ben Rimmer Chief Executive Officer Dated: 9 September 2015
OUR ORGANISATION: REPORT OF OPERATIONS
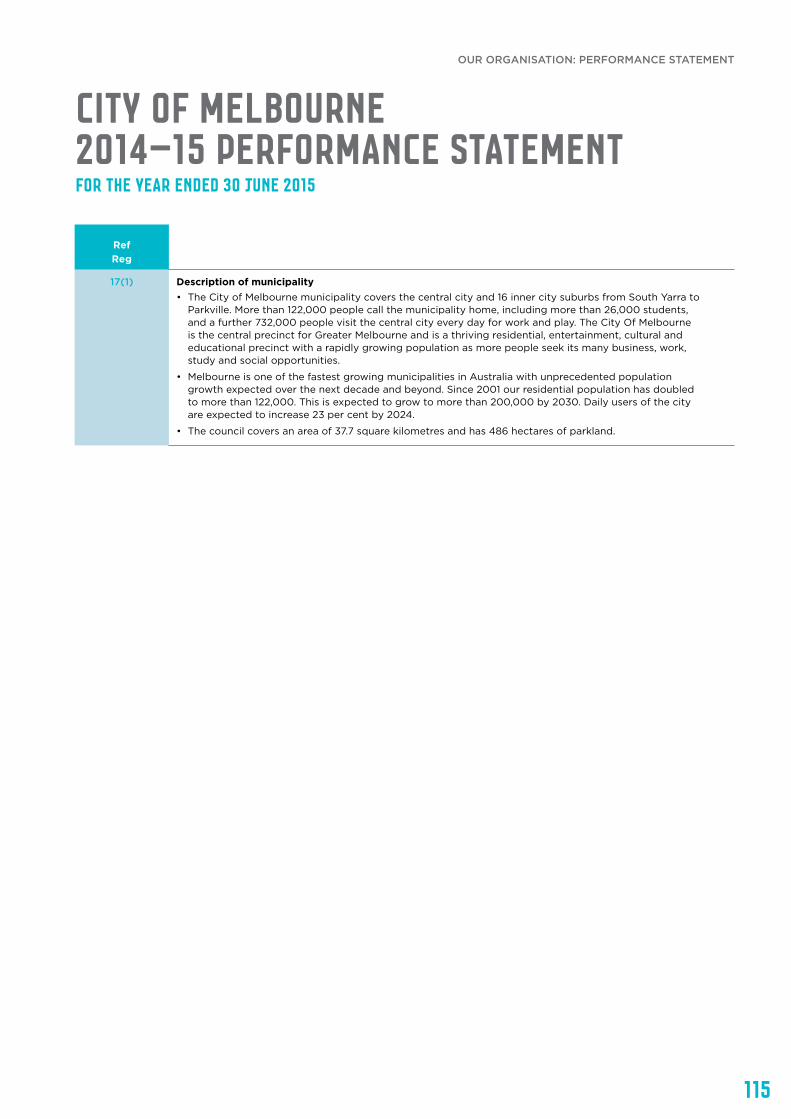
115
Ref Reg
17(1) Description of municipality• The City of Melbourne municipality covers the central city and 16 inner city suburbs from South Yarra to
Parkville. More than 122,000 people call the municipality home, including more than 26,000 students, and a further 732,000 people visit the central city every day for work and play. The City Of Melbourne is the central precinct for Greater Melbourne and is a thriving residential, entertainment, cultural and educational precinct with a rapidly growing population as more people seek its many business, work, study and social opportunities.
• Melbourne is one of the fastest growing municipalities in Australia with unprecedented population growth expected over the next decade and beyond. Since 2001 our residential population has doubled to more than 122,000. This is expected to grow to more than 200,000 by 2030. Daily users of the city are expected to increase 23 per cent by 2024.
• The council covers an area of 37.7 square kilometres and has 486 hectares of parkland.
City of Melbourne 2014–15 Performance StatementFor the year ended 30 June 2015
OUR ORGANISATION: PERFORMANCE STATEMENT
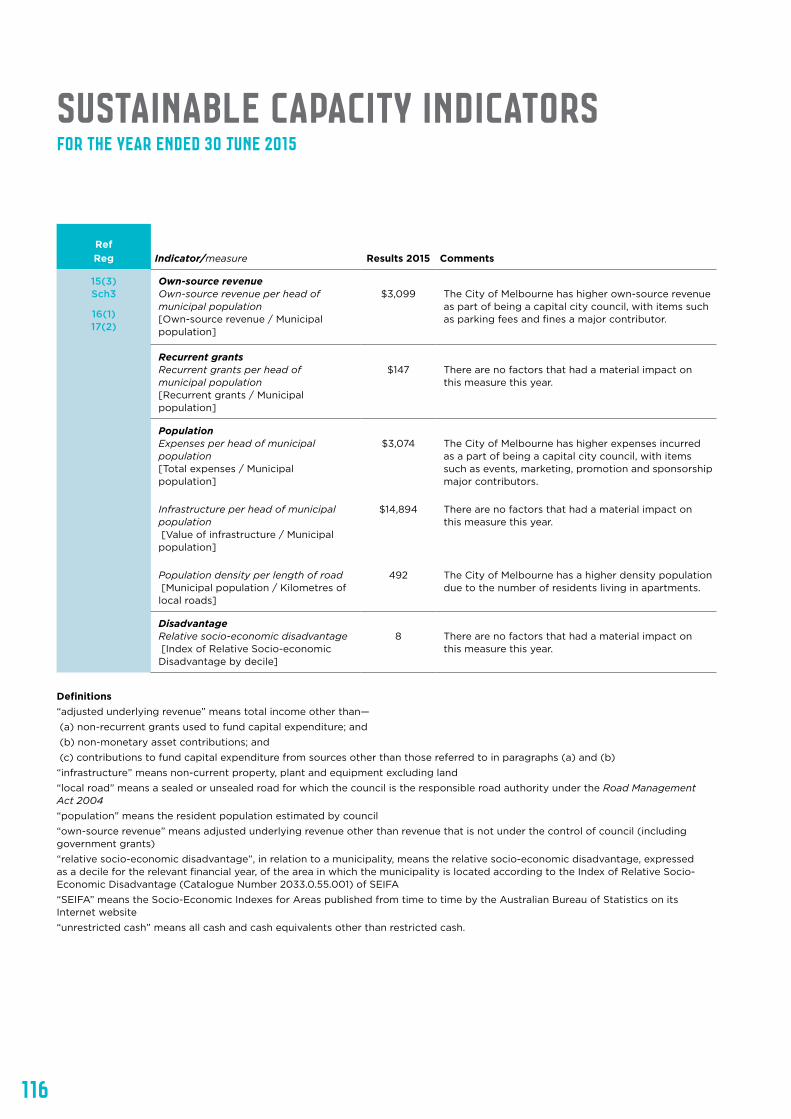
116
Ref Reg Indicator/measure Results 2015 Comments
15(3) Sch3
16(1) 17(2)
Own-source revenue Own-source revenue per head of municipal population [Own-source revenue / Municipal population]
$3,099
The City of Melbourne has higher own-source revenue as part of being a capital city council, with items such as parking fees and fines a major contributor.
Recurrent grants Recurrent grants per head of municipal population [Recurrent grants / Municipal population]
$147
There are no factors that had a material impact on this measure this year.
Population Expenses per head of municipal population [Total expenses / Municipal population]
Infrastructure per head of municipal population [Value of infrastructure / Municipal population]
Population density per length of road [Municipal population / Kilometres of local roads]
$3,074
$14,894
492
The City of Melbourne has higher expenses incurred as a part of being a capital city council, with items such as events, marketing, promotion and sponsorship major contributors. There are no factors that had a material impact on this measure this year. The City of Melbourne has a higher density population due to the number of residents living in apartments.
Disadvantage Relative socio-economic disadvantage [Index of Relative Socio-economic Disadvantage by decile]
8
There are no factors that had a material impact on this measure this year.
Sustainable Capacity IndicatorsFor the year ended 30 June 2015
Definitions“adjusted underlying revenue” means total income other than— (a) non-recurrent grants used to fund capital expenditure; and (b) non-monetary asset contributions; and (c) contributions to fund capital expenditure from sources other than those referred to in paragraphs (a) and (b)“infrastructure” means non-current property, plant and equipment excluding land“local road” means a sealed or unsealed road for which the council is the responsible road authority under the Road Management Act 2004“population” means the resident population estimated by council“own-source revenue” means adjusted underlying revenue other than revenue that is not under the control of council (including government grants)“relative socio-economic disadvantage”, in relation to a municipality, means the relative socio-economic disadvantage, expressed as a decile for the relevant financial year, of the area in which the municipality is located according to the Index of Relative Socio-Economic Disadvantage (Catalogue Number 2033.0.55.001) of SEIFA“SEIFA” means the Socio-Economic Indexes for Areas published from time to time by the Australian Bureau of Statistics on its Internet website“unrestricted cash” means all cash and cash equivalents other than restricted cash.
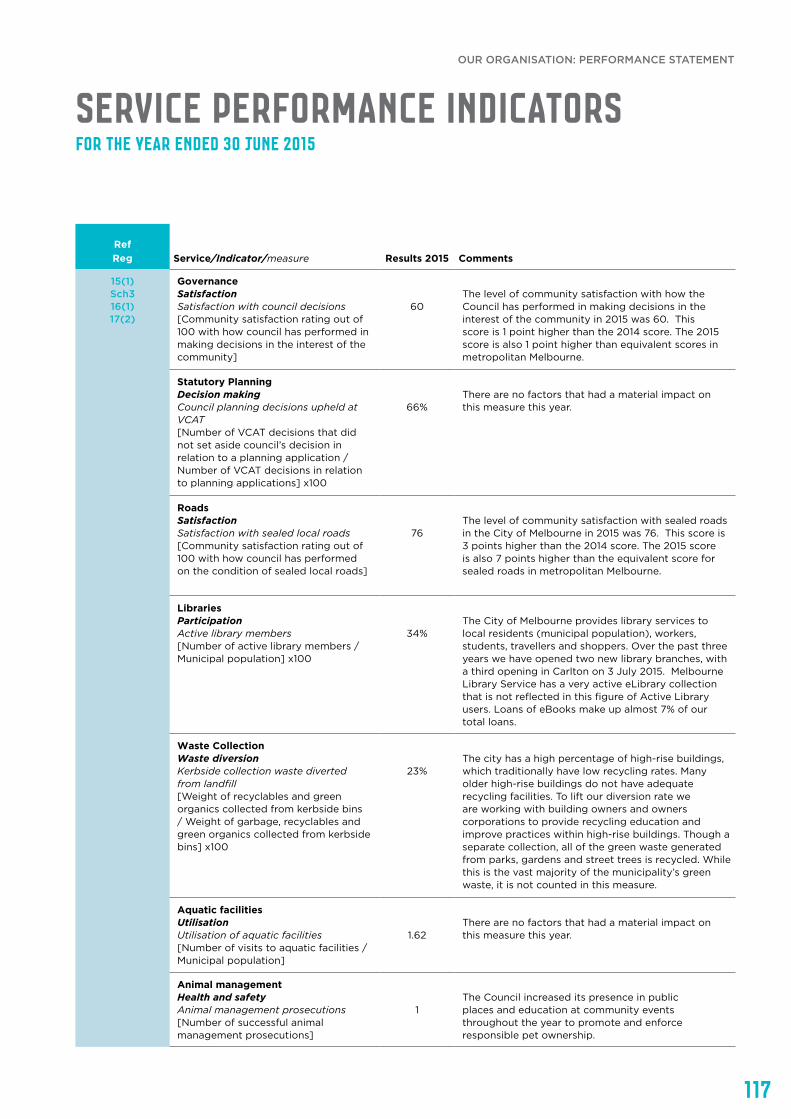
117
Ref Reg Service/Indicator/measure Results 2015 Comments
15(1) Sch3 16(1) 17(2)
Governance Satisfaction Satisfaction with council decisions [Community satisfaction rating out of 100 with how council has performed in making decisions in the interest of the community]
60
The level of community satisfaction with how the Council has performed in making decisions in the interest of the community in 2015 was 60. This score is 1 point higher than the 2014 score. The 2015 score is also 1 point higher than equivalent scores in metropolitan Melbourne.
Statutory Planning Decision making Council planning decisions upheld at VCAT [Number of VCAT decisions that did not set aside council’s decision in relation to a planning application / Number of VCAT decisions in relation to planning applications] x100
66%
There are no factors that had a material impact on this measure this year.
Roads Satisfaction Satisfaction with sealed local roads [Community satisfaction rating out of 100 with how council has performed on the condition of sealed local roads]
76
The level of community satisfaction with sealed roads in the City of Melbourne in 2015 was 76. This score is 3 points higher than the 2014 score. The 2015 score is also 7 points higher than the equivalent score for sealed roads in metropolitan Melbourne.
Libraries Participation Active library members [Number of active library members / Municipal population] x100
34%
The City of Melbourne provides library services to local residents (municipal population), workers, students, travellers and shoppers. Over the past three years we have opened two new library branches, with a third opening in Carlton on 3 July 2015. Melbourne Library Service has a very active eLibrary collection that is not reflected in this figure of Active Library users. Loans of eBooks make up almost 7% of our total loans.
Waste Collection Waste diversion Kerbside collection waste diverted from landfill [Weight of recyclables and green organics collected from kerbside bins / Weight of garbage, recyclables and green organics collected from kerbside bins] x100
23%
The city has a high percentage of high-rise buildings, which traditionally have low recycling rates. Many older high-rise buildings do not have adequate recycling facilities. To lift our diversion rate we are working with building owners and owners corporations to provide recycling education and improve practices within high-rise buildings. Though a separate collection, all of the green waste generated from parks, gardens and street trees is recycled. While this is the vast majority of the municipality’s green waste, it is not counted in this measure.
Aquatic facilities Utilisation Utilisation of aquatic facilities [Number of visits to aquatic facilities / Municipal population]
1.62
There are no factors that had a material impact on this measure this year.
Animal management Health and safety Animal management prosecutions [Number of successful animal management prosecutions]
1
The Council increased its presence in public places and education at community events throughout the year to promote and enforce responsible pet ownership.
Service Performance IndicatorsFor the year ended 30 June 2015
OUR ORGANISATION: PERFORMANCE STATEMENT
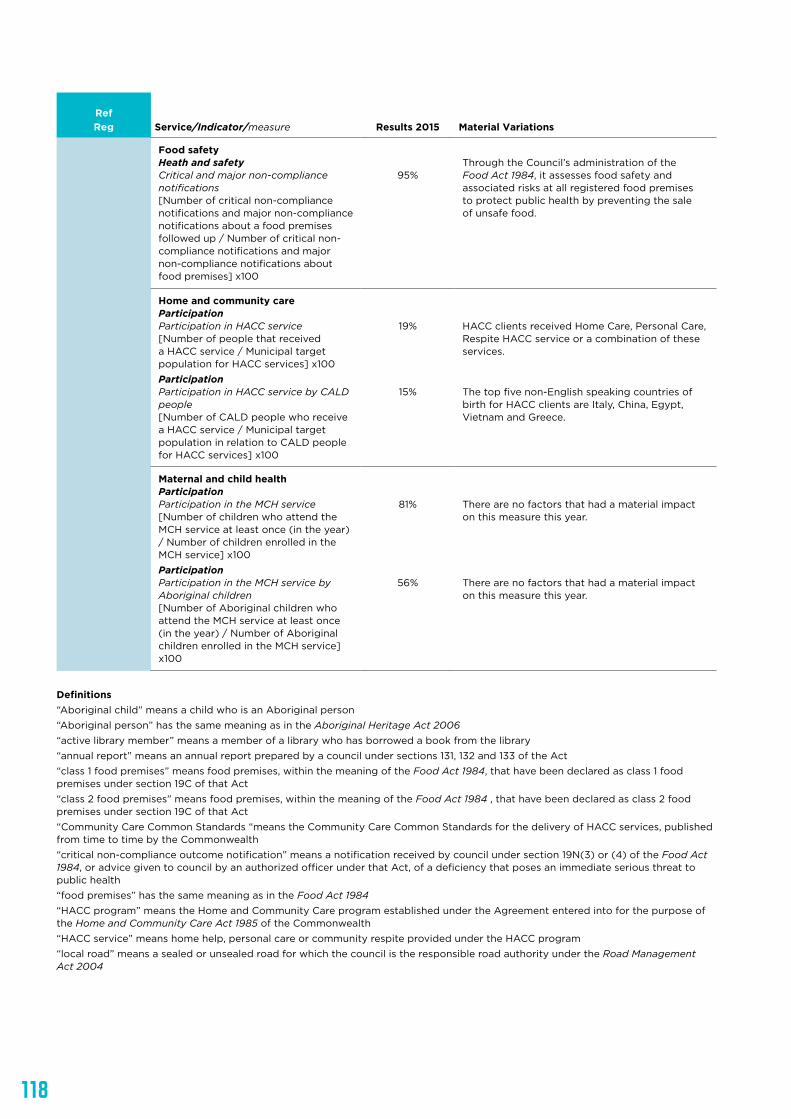
118
Ref Reg Service/Indicator/measure Results 2015 Material Variations
Food safety Heath and safety Critical and major non-compliance notifications [Number of critical non-compliance notifications and major non-compliance notifications about a food premises followed up / Number of critical non-compliance notifications and major non-compliance notifications about food premises] x100
95%
Through the Council’s administration of the Food Act 1984, it assesses food safety and associated risks at all registered food premises to protect public health by preventing the sale of unsafe food.
Home and community care Participation Participation in HACC service [Number of people that received a HACC service / Municipal target population for HACC services] x100Participation Participation in HACC service by CALD people [Number of CALD people who receive a HACC service / Municipal target population in relation to CALD people for HACC services] x100
19%
15%
HACC clients received Home Care, Personal Care, Respite HACC service or a combination of these services.
The top five non-English speaking countries of birth for HACC clients are Italy, China, Egypt, Vietnam and Greece.
Maternal and child health Participation Participation in the MCH service [Number of children who attend the MCH service at least once (in the year) / Number of children enrolled in the MCH service] x100Participation Participation in the MCH service by Aboriginal children [Number of Aboriginal children who attend the MCH service at least once (in the year) / Number of Aboriginal children enrolled in the MCH service] x100
81%
56%
There are no factors that had a material impact on this measure this year.
There are no factors that had a material impact on this measure this year.
Definitions“Aboriginal child” means a child who is an Aboriginal person “Aboriginal person” has the same meaning as in the Aboriginal Heritage Act 2006 “active library member” means a member of a library who has borrowed a book from the library “annual report” means an annual report prepared by a council under sections 131, 132 and 133 of the Act “class 1 food premises” means food premises, within the meaning of the Food Act 1984, that have been declared as class 1 food premises under section 19C of that Act “class 2 food premises” means food premises, within the meaning of the Food Act 1984 , that have been declared as class 2 food premises under section 19C of that Act “Community Care Common Standards “means the Community Care Common Standards for the delivery of HACC services, published from time to time by the Commonwealth“critical non-compliance outcome notification” means a notification received by council under section 19N(3) or (4) of the Food Act 1984, or advice given to council by an authorized officer under that Act, of a deficiency that poses an immediate serious threat to public health “food premises” has the same meaning as in the Food Act 1984 “HACC program” means the Home and Community Care program established under the Agreement entered into for the purpose of the Home and Community Care Act 1985 of the Commonwealth “HACC service” means home help, personal care or community respite provided under the HACC program “local road” means a sealed or unsealed road for which the council is the responsible road authority under the Road Management Act 2004

119
“major non-compliance outcome notification” means a notification received by a council under section 19N(3) or (4) of the Food Act 1984, or advice given to council by an authorized officer under that Act, of a deficiency that does not pose an immediate serious threat to public health but may do so if no remedial action is taken “MCH” means the Maternal and Child Health Service provided by a council to support the health and development of children within the municipality from birth until school age“population” means the resident population estimated by council “target population” has the same meaning as in the Agreement entered into for the purposes of the Home and Community Care Act 1985 of the Commonwealth “WorkSafe reportable aquatic facility safety incident” means an incident relating to a council aquatic facility that is required to be notified to the Victorian WorkCover Authority under Part 5 of the Occupational Health and Safety Act 2004.
OUR ORGANISATION: PERFORMANCE STATEMENT
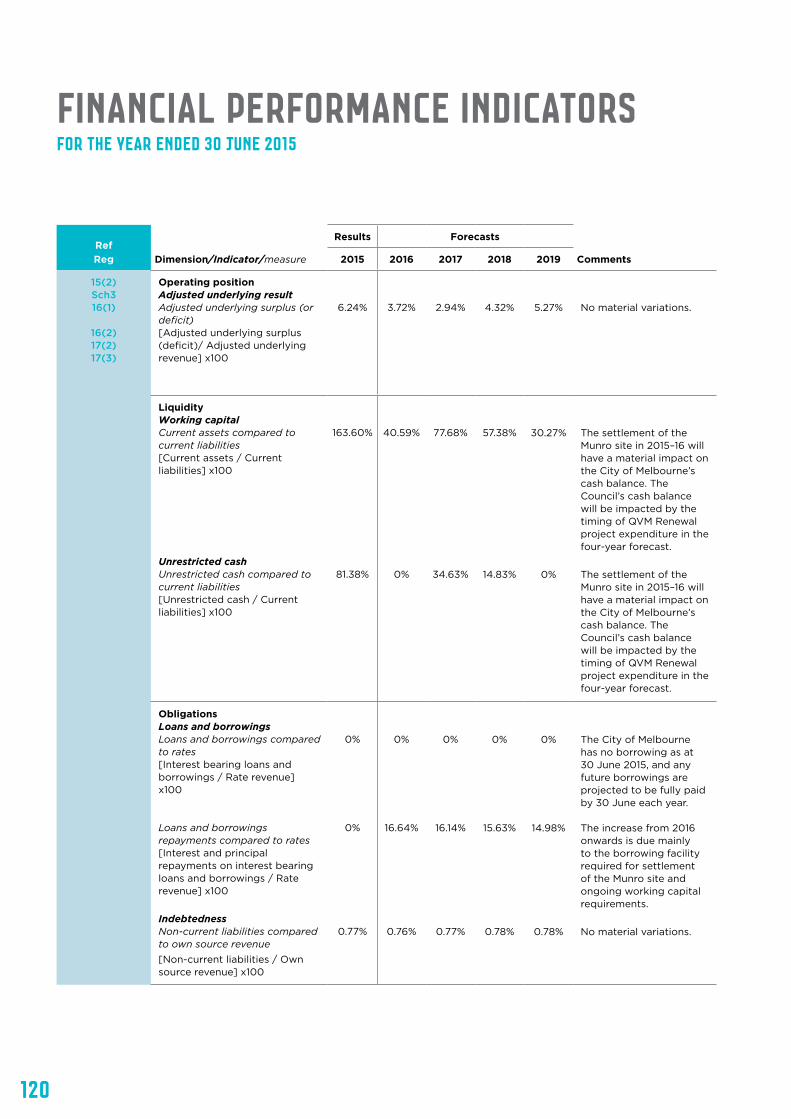
120
Ref Reg
Results Forecasts
Dimension/Indicator/measure 2015 2016 2017 2018 2019 Comments
15(2) Sch3 16(1)
16(2) 17(2) 17(3)
Operating position Adjusted underlying result Adjusted underlying surplus (or deficit) [Adjusted underlying surplus (deficit)/ Adjusted underlying revenue] x100
6.24%
3.72%
2.94%
4.32%
5.27%
No material variations.
Liquidity Working capital Current assets compared to current liabilities [Current assets / Current liabilities] x100
Unrestricted cash Unrestricted cash compared to current liabilities [Unrestricted cash / Current liabilities] x100
163.60%
81.38%
40.59%
0%
77.68%
34.63%
57.38%
14.83%
30.27%
0%
The settlement of the Munro site in 2015–16 will have a material impact on the City of Melbourne’s cash balance. The Council’s cash balance will be impacted by the timing of QVM Renewal project expenditure in the four-year forecast.
The settlement of the Munro site in 2015–16 will have a material impact on the City of Melbourne’s cash balance. The Council’s cash balance will be impacted by the timing of QVM Renewal project expenditure in the four-year forecast.
Obligations Loans and borrowings Loans and borrowings compared to rates [Interest bearing loans and borrowings / Rate revenue] x100 Loans and borrowings repayments compared to rates [Interest and principal repayments on interest bearing loans and borrowings / Rate revenue] x100
Indebtedness Non-current liabilities compared to own source revenue[Non-current liabilities / Own source revenue] x100
0%
0%
0.77%
0%
16.64%
0.76%
0%
16.14%
0.77%
0%
15.63%
0.78%
0%
14.98%
0.78%
The City of Melbourne has no borrowing as at 30 June 2015, and any future borrowings are projected to be fully paid by 30 June each year. The increase from 2016 onwards is due mainly to the borrowing facility required for settlement of the Munro site and ongoing working capital requirements.
No material variations.
financial Performance IndicatorsFor the year ended 30 June 2015
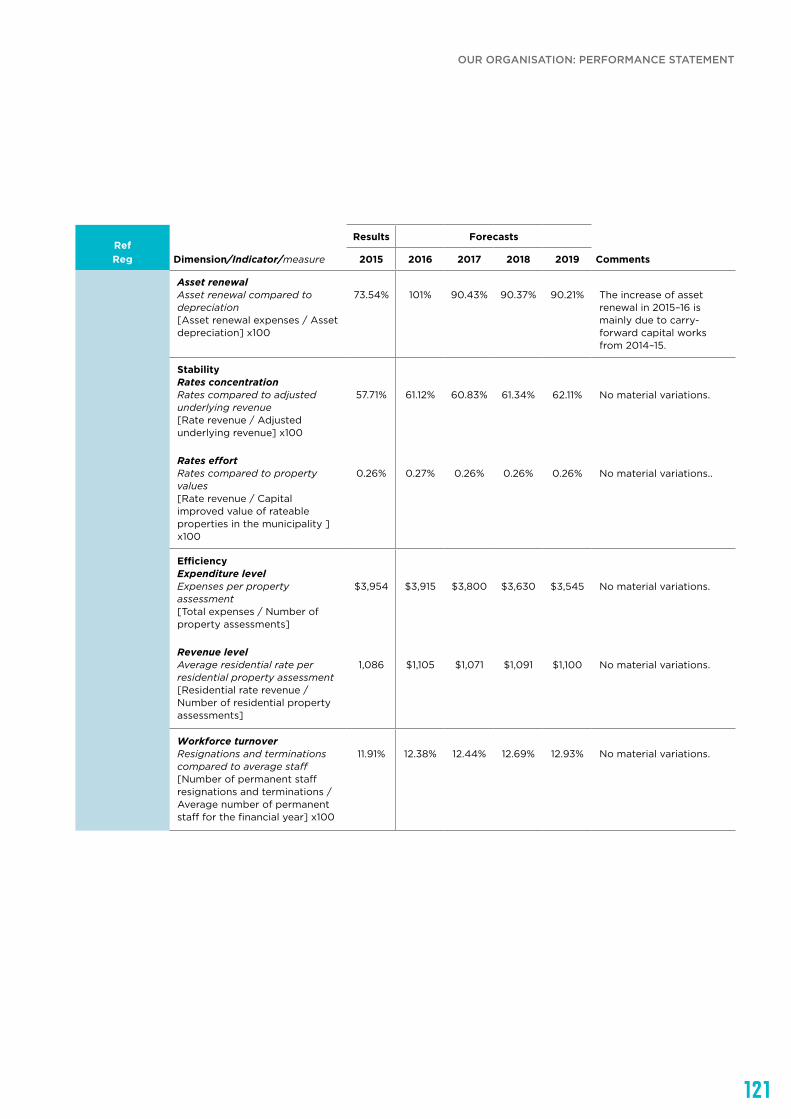
121
Ref Reg
Results Forecasts
Dimension/Indicator/measure 2015 2016 2017 2018 2019 Comments
Asset renewal Asset renewal compared to depreciation [Asset renewal expenses / Asset depreciation] x100
73.54%
101%
90.43%
90.37%
90.21%
The increase of asset renewal in 2015–16 is mainly due to carry-forward capital works from 2014–15.
Stability Rates concentration Rates compared to adjusted underlying revenue [Rate revenue / Adjusted underlying revenue] x100
Rates effort Rates compared to property values [Rate revenue / Capital improved value of rateable properties in the municipality ] x100
57.71%
0.26%
61.12%
0.27%
60.83%
0.26%
61.34%
0.26%
62.11%
0.26%
No material variations.
No material variations..
Efficiency Expenditure level Expenses per property assessment [Total expenses / Number of property assessments]
Revenue level Average residential rate per residential property assessment [Residential rate revenue / Number of residential property assessments]
$3,954
1,086
$3,915
$1,105
$3,800
$1,071
$3,630
$1,091
$3,545
$1,100
No material variations.
No material variations.
Workforce turnover Resignations and terminations compared to average staff [Number of permanent staff resignations and terminations / Average number of permanent staff for the financial year] x100
11.91%
12.38%
12.44%
12.69%
12.93%
No material variations.
OUR ORGANISATION: PERFORMANCE STATEMENT

122
Definitions“adjusted underlying revenue” means total income other than— (a) non-recurrent grants used to fund capital expenditure; and (b) non-monetary asset contributions; and (c) contributions to fund capital expenditure from sources other than those referred to in paragraphs (a) and (b)“adjusted underlying surplus (or deficit)” means adjusted underlying revenue less total expenditure“asset renewal expenditure” means expenditure on an existing asset or on replacing an existing asset that returns the service capability of the asset to its original capability“current assets” has the same meaning as in the AAS“current liabilities” has the same meaning as in the AAS“non-current assets” means all assets other than current assets“non-current liabilities” means all liabilities other than current liabilities“non-recurrent grant” means a grant obtained on the condition that it be expended in a specified manner and is not expected to be received again during the period covered by a council’s Strategic Resource Plan“own-source revenue” means adjusted underlying revenue other than revenue that is not under the control of council (including government grants“population “means the resident population estimated by council“rate revenue” means revenue from general rates, municipal charges, service rates and service charges“recurrent grant “means a grant other than a non-recurrent grant“residential rates” means revenue from general rates, municipal charges, service rates and service charges levied on residential properties“restricted cash” means cash and cash equivalents, within the meaning of the AAS, that are not available for use other than for a purpose for which it is restricted, and includes cash to be used to fund capital works expenditure from the previous financial year“unrestricted cash” means all cash and cash equivalents other than restricted cash.
123
Ref Reg
1. Basis of preparation
The Council is required to prepare and include a performance statement within its annual report. The Performance Statement includes the results of the prescribed sustainable capacity, service performance and financial performance indicators and measures together with a description of the municipal district and an explanation of material variations in the results. This statement has been prepared to meet the requirements of the Local Government Act 1989 and Local Government (Planning and Reporting) Regulations 2014.
Where applicable the results in the Performance Statement have been prepared on accounting bases consistent with those reported in the Financial Statements. The other results are based on information drawn from Council information systems or from third parties (e.g. Australian Bureau of Statistics).
The Performance Statement presents the actual results for the current year and for the prescribed financial performance indicators and measures, the results forecast by the Council’s Strategic Resource Plan. The Local Government (Planning and Reporting) Regulations 2014 requires explanation of any material variations in the results contained in the Performance Statement. The Council has adopted materiality thresholds relevant to each indicator and measure and explanations have not been provided for variations below the materiality thresholds unless the variance is considered to be material because of its nature.
The forecast figures included in the Performance Statement are those adopted by the Council in its Strategic Resource Plan on 30 June 2015 and that forms part of the Council Plan. The Strategic Resource Plan includes estimates based on key assumptions about the future that were relevant at the time of adoption and aimed at achieving sustainability over the long term. Detailed information on the actual financial results is contained in the General Purpose Financial Statements. The Strategic Resource Plan can be obtained by contacting the Council.
other informationFor the year ended 30 June 2015
OUR ORGANISATION: PERFORMANCE STATEMENT

124

125
OUR ORGANISATION: PERFORMANCE STATEMENT
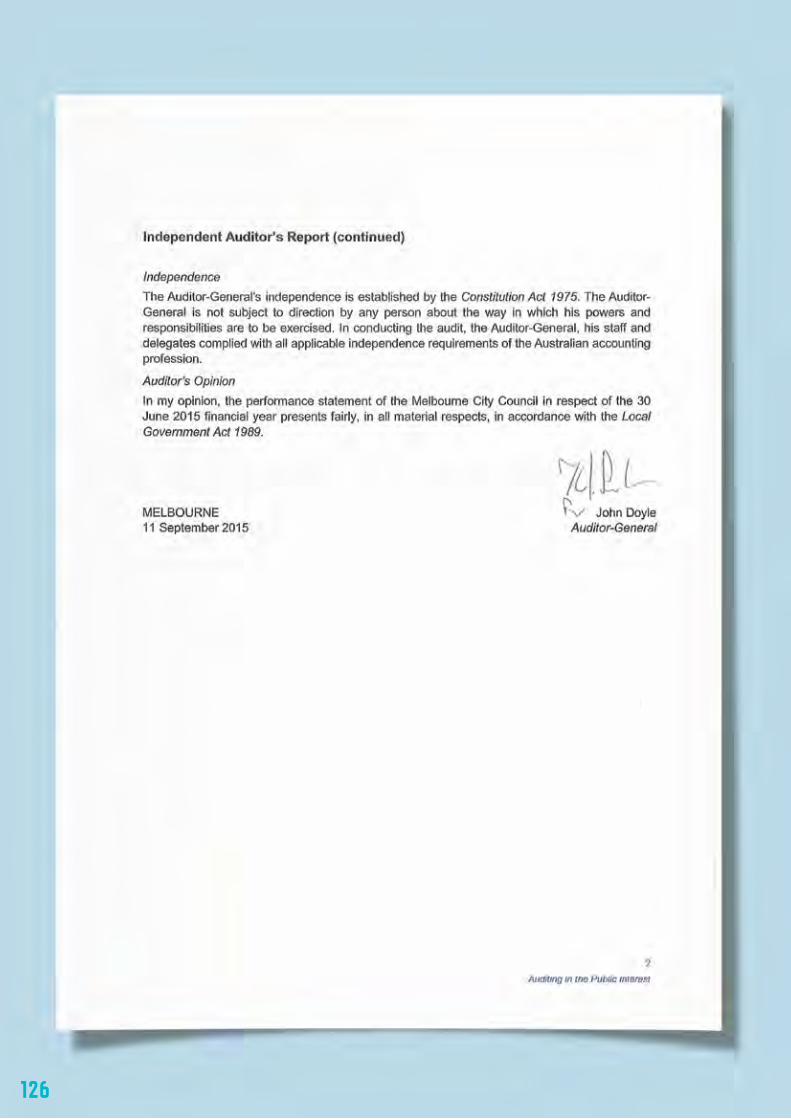
126
127
ANNUAL FINANCIAL REPORT 2014-2015
128
CONTENTS
Financial Statements 129
Comprehensive Income Statement 129
Balance Sheet 130
Statement of Changes in Equity 131
Statement of Cash Flows 132
Statement of Capital Works 133
Notes to financial statements 134
Introduction 134
Statement of compliance 134
Note 1. Significant accounting policies 134
Note 2. Budget comparison 142
Revenue 147
Note 3. Rates and charges 147
Note 4. Statutory fees and fines 147
Note 5. User fees 148
Note 6. Grants 148
Note 7. Contributions 150
Note 8. Net gain on disposal of property, infrastructure, plant and equipment 150
Note 9. Other income 150
Expense 151
Note 10. Employee benefit expenses 151
Note 11. Materials and services 151
Note 12. Bad and doubtful debts 151
Note 13. Depreciation and amortisation 151
Note 14. Borrowing costs 152
Note 15. Other items of expenses 152
Assets 153
Note 16. Cash and cash equivalents 153
Note 17. Trade and other receivables 153
Note 18. Other financial assets 154
Note 19. Inventories 155
Note 20. Other assets 155
Note 21. Investments 155
Note 22. Property, infrastructure, plant and equipment 161
Note 23. Investment property 170
Note 24. Intangible assets 170
Liabilities 173
Note 25. Trade and other payables 173
Note 26. Trust funds and deposits 173
Note 27. Provisions 174
Note 28. Interest-bearing loans and borrowing 175
Equity 175
Note 29. Reserves 175
Other disclosures 178
Note 30. Reconciliation from net cash provided by operating activities to surplus 178
Note 31. Reconciliation of cash and cash equivalents 178
Note 32. Financing arrangements 178
Note 33. Commitments 179
Note 34. Operating leases 180
Note 35. Contingent liabilities and contingent assets 180
Note 36. Superannuation funds 181
Note 37. Financial instruments 186
Note 38. Related party transactions 190
Note 39. Events occurring after balance date 193
Certification of the financial statements 194
Independent Auditor’s Report 195

129
FINANCIAL REPORT FOR THE YEAR ENDED 30 JUNE 2015FINANCIAL REPORT FOR THE YEAR ENDED 30 JUNE 2015
130 of 69
FINANCIAL STATEMENTS Comprehensive Income Statement For the Year Ended 30 June 2015
The Comprehensive Income Statement should be read in conjunction with the accompanying notes
2015 2014 2015 2014$'000 $'000 Note $'000 $'000
IncomeRates and charges 230,919 213,631 3 231,184 213,837Statutory fees and fines
Parking fines 42,316 38,495 4 42,316 38,495Other statutory fees and fines 7,960 7,871 4 7,960 7,871
User feesParking fees 53,648 50,828 5 49,269 46,796Other user fees 16,165 16,365 5 15,477 15,681
Grants - operating 10,489 9,102 6 10,489 9,102Grants - capital 19,516 14,433 6 19,516 14,433Contributions - monetary 15,795 9,652 7 15,497 9,506Contributions - non monetary 11,562 7,895 7 11,562 7,895Net gain on disposal of property, infrastructure, plant and equipment 2,033 1,097 8 1,381 954Fair value adjustments for investment properties 364 5,640 364 5,640Other income 218,414 223,537 9 30,762 29,484Total Income 629,181 598,546 435,777 399,694
ExpensesEmployee benefit expense 225,346 221,828 10 132,798 129,481Materials and services 239,409 241,009 11 160,621 157,230Bad and doubtful debts 6,754 3,567 12 6,630 3,562Depreciation and amortisation 74,092 69,467 13 57,685 55,281Borrowing cost 164 353 14 - -Other expenses 9,345 8,739 15 4,669 5,250Grants and contributions 13,217 13,347 13,217 13,347Contributions of assets to external parties - 4,200 - 4,200Total Expenses 568,327 562,510 375,620 368,351
Surplus For The Year 60,854 36,036 60,157 31,343
Other Comprehensive IncomeNet asset revaluation increment 61,519 76,569 29 61,519 76,569Gain/(loss) on defined benefits plans 863 4,024 36 - -
Total Other Comprehensive Income 62,382 80,593 61,519 76,569
Total Comprehensive Result 123,236 116,629 121,676 107,912
Consolidated Council

130
FINANCIAL REPORT FOR THE YEAR ENDED 30 JUNE 2015
131 of 69
Balance Sheet For the Year Ended 30 June 2015
The Balance Sheet should be read in conjunction with the accompanying notes.
2015 2014 2015 2014$'000 $'000 Note $'000 $'000
AssetsCurrent AssetsCash and cash equivalents 118,972 89,024 16 106,519 81,339Trade and other receivables 48,997 57,695 17 25,550 26,626Other financial assets 5,300 21,700 18 2,000 18,000Inventories 816 656 19 - -Other assets 15,660 6,623 20 12,664 3,920Total Current Assets 189,745 175,698 146,733 129,885
Non-Current AssetsInvestment in subsidiaries and trust 7,250 7,675 21 31,659 32,316Property, infrastructure, plant and equipment 3,501,754 3,407,643 22 3,438,198 3,340,611Investment property 114,069 113,789 23 114,069 113,789Intangible assets 34,597 38,207 24 10,853 11,004Net assets of City of Melbourne's Defined Benefits Superannuation Fund 1,195 423 36 - -Total Non-Current Assets 3,658,865 3,567,737 3,594,779 3,497,720
Total Assets 3,848,610 3,743,435 3,741,512 3,627,605
LiabilitiesCurrent LiabilitiesTrade and other payables 77,175 89,840 25 53,308 61,065Trust funds and deposits 8,526 7,057 26 6,111 4,901Provisions 44,350 44,513 27 30,269 31,349Total Current Liabilities 130,051 141,410 89,688 97,315
Non-Current LiabilitiesProvisions 4,849 5,551 27 2,900 3,042Interest bearing loans and borrowings - 6,000 28 - -Total Non-Current Liabilities 4,849 11,551 2,900 3,042
Total Liabilities 134,900 152,961 92,588 100,357
Net Assets 3,713,710 3,590,474 3,648,924 3,527,248
EquityAccumulated surplus 1,953,664 1,897,574 1,892,915 1,838,385Reserves 1,760,046 1,692,900 29 1,756,009 1,688,863Total Equity 3,713,710 3,590,474 3,648,924 3,527,248
Consolidated Council
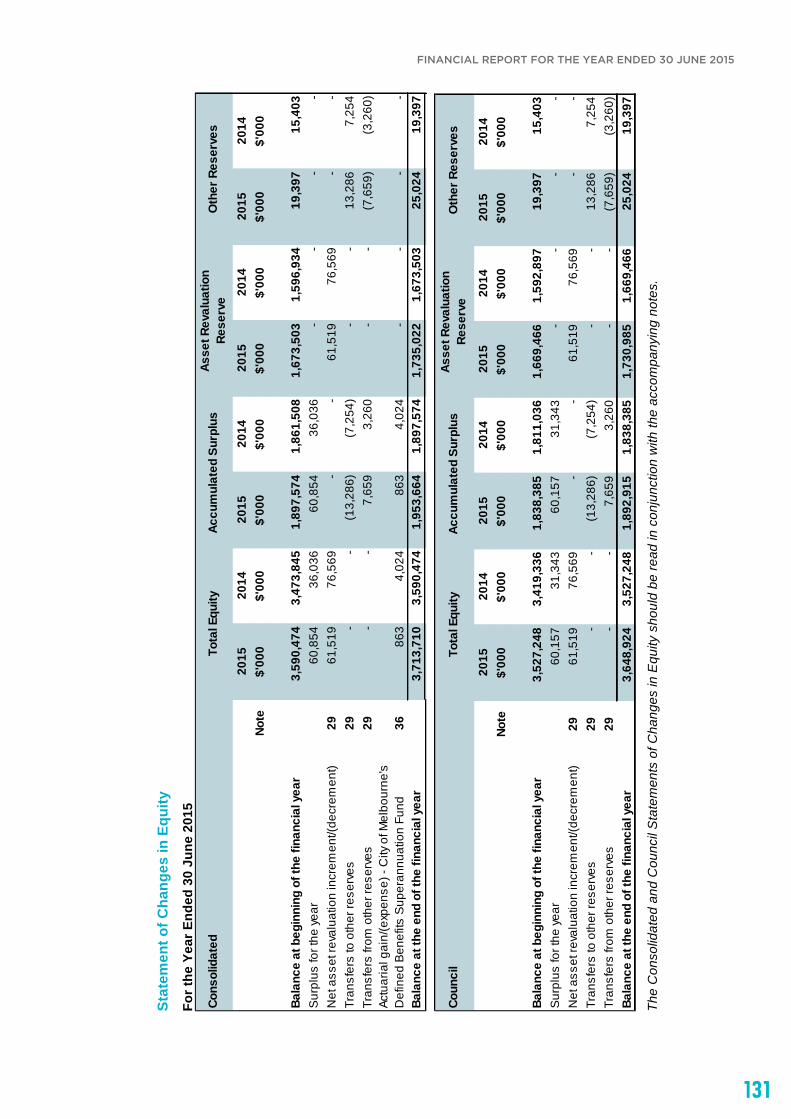
131
FINANCIAL REPORT FOR THE YEAR ENDED 30 JUNE 2015
FIN
AN
CIA
L R
EPO
RT
FOR
TH
E YE
AR
EN
DED
30
JUN
E 20
15
132
of 6
9
Stat
emen
t of C
hang
es in
Equ
ity
For t
he Y
ear E
nded
30
June
201
5
Th
e C
onso
lidat
ed a
nd C
ounc
il S
tate
men
ts o
f Cha
nges
in E
quity
sho
uld
be re
ad in
con
junc
tion
with
the
acco
mpa
nyin
g no
tes.
Cons
olid
ated
2015
2014
2015
2014
2015
2014
2015
2014
Note
$'00
0$'
000
$'00
0$'
000
$'00
0$'
000
$'00
0$'
000
Bala
nce
at b
egin
ning
of t
he fi
nanc
ial y
ear
3,59
0,47
43,
473,
845
1,89
7,57
41,
861,
508
1,67
3,50
31,
596,
934
19,3
9715
,403
Surp
lus
for t
he ye
ar60
,854
36,0
3660
,854
36,0
36-
--
-N
et a
sset
reva
luat
ion
incr
emen
t/(de
crem
ent)
2961
,519
76,5
69-
-61
,519
76,5
69-
-Tr
ansf
ers
to o
ther
rese
rves
29-
-(1
3,28
6)(7
,254
)-
-13
,286
7,25
4Tr
ansf
ers
from
oth
er re
serv
es29
--
7,65
93,
260
--
(7,6
59)
(3,2
60)
Actu
aria
l gai
n/(e
xpen
se) -
City
of M
elbo
urne
's
Def
ined
Ben
efits
Sup
eran
nuat
ion
Fund
3686
34,
024
863
4,02
4-
--
-Ba
lanc
e at
the
end
of th
e fin
anci
al y
ear
3,71
3,71
03,
590,
474
1,95
3,66
41,
897,
574
1,73
5,02
21,
673,
503
25,0
2419
,397
Oth
er R
eser
ves
Tota
l Equ
ityAc
cum
ulat
ed S
urpl
usAs
set R
eval
uatio
n Re
serv
e
Coun
cil
2015
2014
2015
2014
2015
2014
2015
2014
Note
$'00
0$'
000
$'00
0$'
000
$'00
0$'
000
$'00
0$'
000
Bala
nce
at b
egin
ning
of t
he fi
nanc
ial y
ear
3,52
7,24
83,
419,
336
1,83
8,38
51,
811,
036
1,66
9,46
61,
592,
897
19,3
9715
,403
Sur
plus
for t
he y
ear
60,1
5731
,343
60,1
5731
,343
--
--
Net
ass
et re
valu
atio
n in
crem
ent/(
decr
emen
t)29
61,5
1976
,569
--
61,5
1976
,569
--
Tran
sfer
s to
oth
er re
serv
es29
--
(13,
286)
(7,2
54)
--
13,2
867,
254
Tran
sfer
s fro
m o
ther
rese
rves
29-
-7,
659
3,26
0-
-(7
,659
)(3
,260
)Ba
lanc
e at
the
end
of th
e fin
anci
al y
ear
3,64
8,92
43,
527,
248
1,89
2,91
51,
838,
385
1,73
0,98
51,
669,
466
25,0
2419
,397
Tota
l Equ
ityAc
cum
ulat
ed S
urpl
usAs
set R
eval
uatio
n Re
serv
eO
ther
Res
erve
s
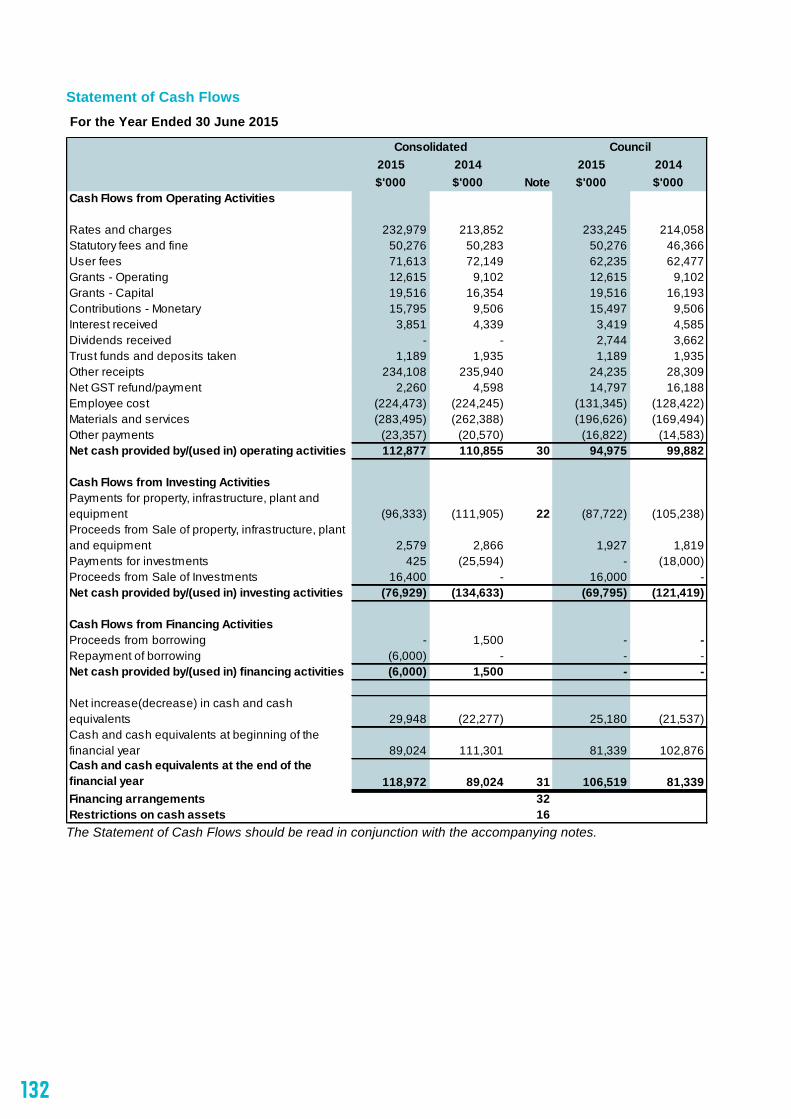
132
FINANCIAL REPORT FOR THE YEAR ENDED 30 JUNE 2015
133 of 69
Statement of Cash Flows For the Year Ended 30 June 2015
The Statement of Cash Flows should be read in conjunction with the accompanying notes.
2015 2014 2015 2014$'000 $'000 Note $'000 $'000
Cash Flows from Operating Activities
Rates and charges 232,979 213,852 233,245 214,058Statutory fees and fine 50,276 50,283 50,276 46,366User fees 71,613 72,149 62,235 62,477Grants - Operating 12,615 9,102 12,615 9,102Grants - Capital 19,516 16,354 19,516 16,193Contributions - Monetary 15,795 9,506 15,497 9,506Interest received 3,851 4,339 3,419 4,585Dividends received - - 2,744 3,662Trust funds and deposits taken 1,189 1,935 1,189 1,935Other receipts 234,108 235,940 24,235 28,309Net GST refund/payment 2,260 4,598 14,797 16,188Employee cost (224,473) (224,245) (131,345) (128,422)Materials and services (283,495) (262,388) (196,626) (169,494)Other payments (23,357) (20,570) (16,822) (14,583)Net cash provided by/(used in) operating activities 112,877 110,855 30 94,975 99,882
Cash Flows from Investing ActivitiesPayments for property, infrastructure, plant and equipment (96,333) (111,905) 22 (87,722) (105,238)Proceeds from Sale of property, infrastructure, plant and equipment 2,579 2,866 1,927 1,819Payments for investments 425 (25,594) - (18,000)Proceeds from Sale of Investments 16,400 - 16,000 -Net cash provided by/(used in) investing activities (76,929) (134,633) (69,795) (121,419)
Cash Flows from Financing ActivitiesProceeds from borrowing - 1,500 - -Repayment of borrowing (6,000) - - -Net cash provided by/(used in) financing activities (6,000) 1,500 - -
Net increase(decrease) in cash and cash equivalents 29,948 (22,277) 25,180 (21,537)Cash and cash equivalents at beginning of the financial year 89,024 111,301 81,339 102,876Cash and cash equivalents at the end of the financial year 118,972 89,024 31 106,519 81,339Financing arrangements 32Restrictions on cash assets 16
Consolidated Council
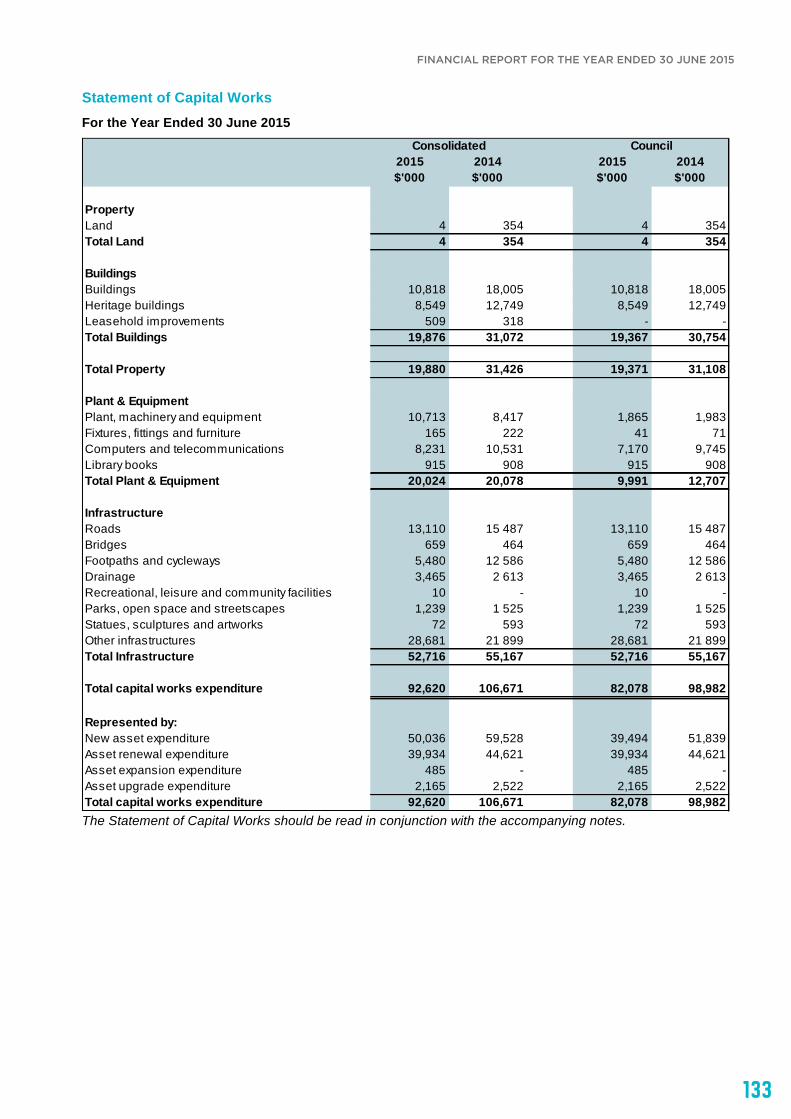
133
FINANCIAL REPORT FOR THE YEAR ENDED 30 JUNE 2015FINANCIAL REPORT FOR THE YEAR ENDED 30 JUNE 2015
134 of 69
Statement of Capital Works For the Year Ended 30 June 2015
The Statement of Capital Works should be read in conjunction with the accompanying notes.
2015 2014 2015 2014$'000 $'000 $'000 $'000
PropertyLand 4 354 4 354Total Land 4 354 4 354
BuildingsBuildings 10,818 18,005 10,818 18,005Heritage buildings 8,549 12,749 8,549 12,749Leasehold improvements 509 318 - -Total Buildings 19,876 31,072 19,367 30,754
Total Property 19,880 31,426 19,371 31,108
Plant & EquipmentPlant, machinery and equipment 10,713 8,417 1,865 1,983Fixtures, fittings and furniture 165 222 41 71Computers and telecommunications 8,231 10,531 7,170 9,745Library books 915 908 915 908Total Plant & Equipment 20,024 20,078 9,991 12,707
InfrastructureRoads 13,110 15 487 13,110 15 487Bridges 659 464 659 464Footpaths and cycleways 5,480 12 586 5,480 12 586Drainage 3,465 2 613 3,465 2 613Recreational, leisure and community facilities 10 - 10 -Parks, open space and streetscapes 1,239 1 525 1,239 1 525Statues, sculptures and artworks 72 593 72 593Other infrastructures 28,681 21 899 28,681 21 899Total Infrastructure 52,716 55,167 52,716 55,167
Total capital works expenditure 92,620 106,671 82,078 98,982
Represented by:New asset expenditure 50,036 59,528 39,494 51,839Asset renewal expenditure 39,934 44,621 39,934 44,621Asset expansion expenditure 485 - 485 -Asset upgrade expenditure 2,165 2,522 2,165 2,522Total capital works expenditure 92,620 106,671 82,078 98,982
Consolidated Council
134
FINANCIAL REPORT FOR THE YEAR ENDED 30 JUNE 2015
135 of 69
NOTES TO FINANCIAL STATEMENTS Introduction
These Financial Statements are for the entity the Melbourne City Council (the "Council") and controlled entities. The Council is the ultimate successor at law to the Mayor Aldermen Councillors and Burgesses of the Town of Melbourne which was incorporated on 12 August 1842 by An Act to Incorporate the Inhabitants of the Town of Melbourne 6 Victoria No. 7. The name ‘Melbourne City Council’ replaced the former ‘Council of the City of Melbourne’ via the City of Melbourne Act 1993. The Town Hall is located at 90-120 Swanston Street, Melbourne VIC 3000.
The purpose of the Council is to:
• Promote the social, economic and environmental viability and sustainability of the municipality • Ensure that resources are used efficiently and effectively.
The Council's external auditors, advisers and bankers as at 30 June 2015:
• External Auditor – The Victorian Auditor-General's Office • Internal Auditor – Oakton Services Pty Ltd • Solicitors - Hunt & Hunt, Ashurst, Maddocks • Bankers - Westpac Banking Corporation.
The Council's website is www.melbourne.vic.gov.au.
The Consolidated Financial Statements of the Council as at and for the year ended 30 June 2015 comprise the Council, controlled entities and interest in associated entities.
Statement of compliance
These financial statements are a general purpose financial report that consists of a Comprehensive Income Statement, Balance Sheet, Statement of Changes in Equity, Statement of Cash Flows, Statement of Capital Works and notes accompanying these financial statements. The general purpose financial report complies with Australian Accounting Standards (AAS), other authoritative pronouncements of the Australian Accounting Standards Board, the Local Government Act 1989, and the Local Government (Planning and Reporting) Regulations 2014.
Note 1. Significant accounting policies
The significant policies, which have been adopted in the preparation of this Financial Report, are:
a) Basis of preparation
The accrual basis of accounting has been used in the preparation of these financial statements, whereby assets, liabilities, equity, income and expenses are recognised in the reporting period to which they relate, regardless of when cash is received or paid.
Judgements, estimates and assumptions are required to be made about the carrying values of assets and liabilities that are not readily apparent from other sources. The estimates and associated judgements are based on professional judgement derived from historical experience and various other factors that are believed to be reasonable under the circumstances. Actual results may differ from these estimates.
Revisions to accounting estimates are recognised in the period in which the estimate is revised and also in future periods that are affected by the revision. Judgements and assumptions made by management in the application of AAS's that have significant effects on the financial statements and estimates relate to:
• the fair value of land, buildings, infrastructure, plant and equipment (refer to note 1 (l)) • the determination of depreciation for buildings, infrastructure, plant and equipment (refer to
note 1(m)) • the determination of employee provisions (refer to note 1(s))
Unless otherwise stated, all accounting policies are consistent with those applied in the prior year. Where appropriate, comparative figures have been amended to accord with current presentation, and disclosure has been made of any material changes to comparatives.
135
FINANCIAL REPORT FOR THE YEAR ENDED 30 JUNE 2015FINANCIAL REPORT FOR THE YEAR ENDED 30 JUNE 2015
136 of 69
b) Change in accounting policies
There have been no changes in accounting policies from the previous period.
c) Principles of consolidation
The consolidated financial statements of Council incorporate all entities controlled by Council as at 30 June 2015, and their income and expenses for that part of the reporting period in which control existed.
Subsidiaries are all entities over which Council has control. Council controls an entity when it is exposed to, or has rights to, variable returns from its involvement with the entity and has the ability to affect those returns through its power to direct the activities of the entity. Subsidiaries are fully consolidated from the date on which control is transferred to the Council.
Where dissimilar accounting policies are adopted by entities and their effect is considered material, adjustments are made to ensure consistent policies are adopted in these financial statements.
In the process of preparing consolidated financial statements all material transactions and balances between consolidated entities are eliminated.
Entities consolidated into Council include:
• Citywide Service Solutions Pty Ltd and its subsidiaries • The Queen Victoria Market Pty Ltd • The Sustainable Melbourne Fund Trust • Enterprise Melbourne Pty Ltd.
d) Accounting for investments in associates and joint arrangements
Associates
Associates are all entities over which Council has significant influence but not control or joint control. Investments in associates are accounted for using the equity method of accounting, after initially being recognised at cost.
Joint arrangements
Investments in joint arrangements are classified as either joint operations or joint ventures depending on the contractual rights and obligations each investor has, rather than the legal structure of the joint arrangement.
MAP’s Group Pty Ltd (trading as Procurement Australia) and Regent Management Company Pty Ltd are accounted for using the equity method of accounting.
e) Revenue recognition
Income is recognised when the Council obtains control of the contribution or the right to receive the contribution, it is probable that the economic benefits comprising the contribution will flow to the Council and the amount of the contribution can be measured reliably.
Rates and Charges
Annual rates and charges are recognised as revenues when Council issues annual rates notices. Supplementary rates are recognised when a valuation and reassessment is completed and a supplementary rates notice issued.
Statutory fees and fines
Statutory fees and fines are recognised as revenue when the service has been provided, the payment is received, or when the penalty has been applied, whichever first occurs.
User fees
User fees are recognised as revenue when the service has been provided or the payment is received, whichever first occurs.
136
FINANCIAL REPORT FOR THE YEAR ENDED 30 JUNE 2015
137 of 69
Grants
Grant income is recognised when Council obtains control of the contribution. This is normally obtained upon their receipt (or acquittal) or upon earlier notification that a grant has been secured, and are valued at their fair value at the date of transfer.
Where grants or contributions recognised as revenues during the financial year were obtained on condition that they be expended in a particular manner or used over a particular period and those conditions were undischarged at balance date, the unused grant or contribution is disclosed in note 6. The note also discloses the amount of unused grant or contribution from prior years that was expended on Council’s operations during the current year.
Contributions
Monetary and non-monetary contributions are recognised as revenue when Council obtains control over the contributed asset.
Sale of property, infrastructure, plant and equipment
The profit or loss on sale of an asset is determined when control of the asset has irrevocably passed to the buyer.
Interest
Interest is recognised as it is earned.
Dividends
Dividend revenue is recognised when the Council's right to receive payment is established.
Other Income
Other income is measured at the fair value of the consideration received or receivable and is recognised when Council gains control over the right to receive the income. Fines are recognised as revenue when the penalty is imposed.
f) Fair value measurement
Council measures certain assets and liabilities at fair value where required or permitted by AAS. AASB 13 Fair value measurement, aims to improve consistency and reduce complexity by providing a definition of fair value and a single source of fair value measurement and disclosure requirements for use across AAS.
AASB 13 defines fair value as the price that would be received to sell an asset or paid to transfer a liability in an orderly transaction between market participants at the measurement date. Fair value under AASB 13 is an exit price regardless of whether that price is directly observable or estimated using another valuation technique.
All assets and liabilities for which fair value is measured or disclosed in the financial statements are categorised within a fair value hierarchy, described as follows, based on the lowest level input that is significant to the fair value measurement as a whole:
Level 1 — Quoted (unadjusted) market prices in active markets for identical assets or liabilities
Level 2 — Valuation techniques for which the lowest level input that is significant to the fair value measurement is directly or indirectly observable
Level 3 — Valuation techniques for which the lowest level input that is significant to the fair value measurement is unobservable.
For the purpose of fair value disclosures, Council has determined classes of assets and liabilities on the basis of the nature, characteristics and risks of the asset or liability and the level of the fair value hierarchy as explained above.
In addition, Council determines whether transfers have occurred between levels in the hierarchy by re-assessing categorisation (based on the lowest level input that is significant to the fair value measurement as a whole) at the end of each reporting period.
137
FINANCIAL REPORT FOR THE YEAR ENDED 30 JUNE 2015FINANCIAL REPORT FOR THE YEAR ENDED 30 JUNE 2015
138 of 69
g) Cash and cash equivalents
Cash and cash equivalents include cash on hand, deposits at call, and other highly liquid investments with original maturities of 90 days or less, net of outstanding bank overdrafts.
h) Trade and other receivables
Receivables are carried at amortised cost using the effective interest rate method. A provision for doubtful debts is recognised when there is objective evidence that an impairment has occurred.
i) Other financial assets
Other financial assets are valued at fair value, being market value, at balance date. Term deposits are measured at amortised cost. Any unrealised gains and losses on holdings at balance date are recognised as either a revenue or expense.
j) Inventories
Inventories held for distribution are measured at cost adjusted when applicable for any loss of service potential. Inventories are measured at the lower of cost and net realisable value.
All other inventories, including land held for sale, are measured at the lower of cost and net realisable value. Where inventories are acquired for no cost or nominal consideration, they are measured at current replacement cost at the date of acquisition.
k) Non-current asset classified as held for sale
A non-current asset classified as held for sale (including disposal groups) is measured at the lower of its carrying amount and fair value less costs to sell, and are not subject to depreciation. Non-current assets, disposal groups and related liabilities and assets are treated as current and classified as held for sale if their carrying amount will be recovered through a sale transaction rather than through continuing use. This condition is regarded as met only when the sale is highly probable and the asset's sale (or disposal group sale) is expected to be completed within 12 months from the date of classification.
l) Recognition and measurement of property, plant, equipment and infrastructure
Acquisition
The purchase method of accounting is used for all acquisitions of assets, being the fair value of assets provided as consideration at the date of acquisition plus any incidental costs attributable to the acquisition. Fair value is the amount for which the asset could be exchanged between knowledgeable willing parties in an arm's length transaction.
Where assets are constructed by Council, cost includes all materials used in construction, direct labour, borrowing costs incurred during construction, and an appropriate share of directly attributable variable and fixed overheads.
In accordance with Council's policy, the threshold limits of $2000 have applied when recognising assets within an applicable asset class and unless otherwise stated are consistent with the prior year.
Revaluation
Subsequent to the initial recognition of assets, non-current physical assets, other than plant and equipment, are measured at their fair value, being the amount for which the assets could be exchanged subsequent to the initial recognition of assets, non-current physical assets, other than plant and equipment, are measured at their fair value, being the price that would be received to sell an asset or paid to transfer a liability in an orderly transaction between market participants at the measurement date. At balance date, the Council reviewed the carrying value of the individual classes of assets measured at fair value to ensure that each asset materially approximated its fair value. Where the carrying value materially differed from the fair value at balance date, the class of asset was revalued.
Fair value valuations are determined in accordance with a valuation hierarchy. Changes to the valuation hierarchy will only occur if an external change in the restrictions or limitations of use on an asset result in changes to the permissible or practical highest and best use of the asset. Further details regarding the fair value hierarchy are disclosed at Note 22. Property, infrastructure, plant and equipment, and infrastructure.
138
FINANCIAL REPORT FOR THE YEAR ENDED 30 JUNE 2015
139 of 69
In addition, Council undertakes a formal revaluation of land, buildings, and infrastructure assets on a regular basis every year. The valuation is performed either by experienced Council officers or independent experts.
Where the assets are revalued, the revaluation increments are credited directly to the asset revaluation reserve except to the extent that an increment reverses a prior year decrement for that class of asset that had been recognised as an expense in which case the increment is recognised as revenue up to the amount of the expense. Revaluation decrements are recognised as an expense except where prior increments are included in the asset revaluation reserve for that class of asset in which case the decrement is taken to the reserve to the extent of the remaining increments. Within the same class of assets, revaluation increments and decrements within the year are offset.
Land under roads
Council recognises land under roads it controls at deemed cost.
Capital and recurrent expenditure
As a general rule, expenditure incurred in the purchase or development of assets is capital expenditure. Expenditure necessarily incurred in either maintaining the operational capacity of the non-current asset or ensuring that the original life estimate of the asset is achieved, is considered maintenance expenditure and is treated as an expense as incurred. Items of a capital nature with a total value of less than $2,000 are treated as an expense.
Leases
The Council does not currently use any finance lease arrangements. In respect of operating leases, where the lessor effectively retains substantially the entire risks and benefits incidental to ownership of the leased property, the payments are charged to expense over the lease term.
Impairment
At each reporting date, the Council reviews the carrying value of its assets to determine whether there is any indication that these assets have been impaired. If such an indication exists, the recoverable amount of the asset, being the higher of the asset’s fair value less costs to sell and depreciated replacement cost, is compared to the assets carrying value. Any shortfall of the assets carrying value over its recoverable amount is expensed to the Comprehensive Income Statement.
m) Depreciation and amortisation of property, infrastructure plant and equipment and intangibles
Buildings, land improvements, plant and equipment, infrastructure, and other assets having limited useful lives are systematically depreciated over their useful lives to the Council in a manner which reflects consumption of the service potential embodied in those assets. Estimates of remaining useful lives and residual values are made on a regular basis with major asset classes reassessed annually. Depreciation rates and methods are reviewed annually.
Where assets have separate identifiable components that are subject to regular replacement, these components are assigned distinct useful lives and residual values and a separate depreciation rate is determined for each component.
Trees, land and artworks are not depreciated as they are considered to have either unlimited useful lives or to be self-generating assets.
Straight line depreciation is charged based on the residual useful life as determined each year.
Depreciation periods used are listed below and are consistent with the prior year unless otherwise stated.
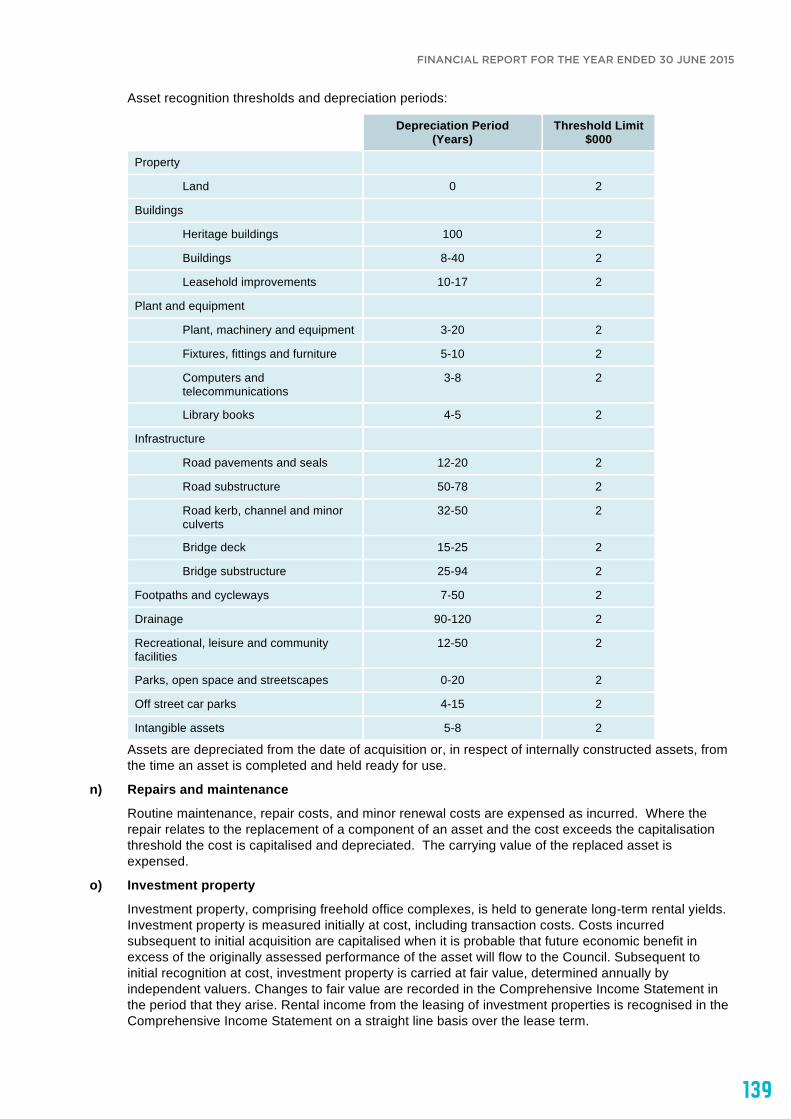
139
FINANCIAL REPORT FOR THE YEAR ENDED 30 JUNE 2015FINANCIAL REPORT FOR THE YEAR ENDED 30 JUNE 2015
140 of 69
Asset recognition thresholds and depreciation periods:
Depreciation Period (Years)
Threshold Limit $000
Property
Land 0 2
Buildings
Heritage buildings 100 2
Buildings 8-40 2
Leasehold improvements 10-17 2
Plant and equipment
Plant, machinery and equipment 3-20 2
Fixtures, fittings and furniture 5-10 2
Computers and telecommunications
3-8 2
Library books 4-5 2
Infrastructure
Road pavements and seals 12-20 2
Road substructure 50-78 2
Road kerb, channel and minor culverts
32-50 2
Bridge deck 15-25 2
Bridge substructure 25-94 2
Footpaths and cycleways 7-50 2
Drainage 90-120 2
Recreational, leisure and community facilities
12-50 2
Parks, open space and streetscapes 0-20 2
Off street car parks 4-15 2
Intangible assets 5-8 2
Assets are depreciated from the date of acquisition or, in respect of internally constructed assets, from the time an asset is completed and held ready for use.
n) Repairs and maintenance
Routine maintenance, repair costs, and minor renewal costs are expensed as incurred. Where the repair relates to the replacement of a component of an asset and the cost exceeds the capitalisation threshold the cost is capitalised and depreciated. The carrying value of the replaced asset is expensed.
o) Investment property
Investment property, comprising freehold office complexes, is held to generate long-term rental yields. Investment property is measured initially at cost, including transaction costs. Costs incurred subsequent to initial acquisition are capitalised when it is probable that future economic benefit in excess of the originally assessed performance of the asset will flow to the Council. Subsequent to initial recognition at cost, investment property is carried at fair value, determined annually by independent valuers. Changes to fair value are recorded in the Comprehensive Income Statement in the period that they arise. Rental income from the leasing of investment properties is recognised in the Comprehensive Income Statement on a straight line basis over the lease term.
140
FINANCIAL REPORT FOR THE YEAR ENDED 30 JUNE 2015
141 of 69
p) Impairment of assets
At each reporting date, the Council reviews the carrying value of its assets to determine whether there is any indication that these assets have been impaired. If such an indication exists, the recoverable amount of the asset, being the higher of the asset's fair value less costs to sell and value in use, is compared to the assets carrying value. Any excess of the assets carrying value over its recoverable amount is expensed to the comprehensive income statement, unless the asset is carried at the revalued amount in which case, the impairment loss is recognised directly against the revaluation surplus in respect of the same class of asset to the extent that the impairment loss does not exceed the amount in the revaluation surplus for that same class of asset.
q) Trust funds and deposits
Amounts received as deposits and retention amounts controlled by Council are recognised as trust funds until they are returned, transferred in accordance with the purpose of the receipt, or forfeited (refer to Note 26).
r) Borrowings
Borrowings are initially measured at fair value, being the cost of the interest bearing liabilities, net of transaction costs. The measurement basis subsequent to initial recognition depends on whether the Council has categorised its interest-bearing liabilities as either financial liabilities designated at fair value through the profit and loss, or financial liabilities at amortised cost. Any difference between the initial recognised amount and the redemption value is recognised in net result over the period of the borrowing using the effective interest method.
The classification depends on the nature and purpose of the interest bearing liabilities. The Council determines the classification of its interest bearing liabilities at initial recognition.
Borrowing costs
Borrowing costs are recognised as an expense in the period in which they are incurred, except where they are capitalised as part of a qualifying asset constructed by Council. Except where specific borrowings are obtained for the purpose of specific asset acquisition, the weighted average interest rate applicable to borrowings at balance date, excluding borrowings associated with superannuation, is used to determine the borrowing costs to be capitalised.
Borrowing costs include interest on bank overdrafts, interest on borrowings, and finance lease charges.
The Council does not have borrowings.
s) Employee costs and benefits
The calculation of employee costs and benefits includes all relevant on-costs and are calculated as follows at reporting date.
Wages and salaries and annual leave
Liabilities for wages and salaries, including non-monetary benefits, annual leave and accumulated sick leave expected to be wholly settled within 12 months of the reporting date are recognised in the provision for employee benefits in respect of employee services up to the reporting date, classified as current liabilities and measured at their nominal values.
Liabilities that are not expected to be wholly settled within 12 months of the reporting date are recognised in the provision for employee benefits as current liabilities, measured at present value of the amounts expected to be paid when the liabilities are settled using the remuneration rate expected to apply at the time of settlement.
Long service leave
Liability for long service leave (LSL) is recognised in the provision for employee benefits.
Current Liability - unconditional LSL is disclosed as a current liability even when the council does not expect to settle the liability within 12 months because it will not have the unconditional right to defer settlement of the entitlement should an employee take leave within 12 months.
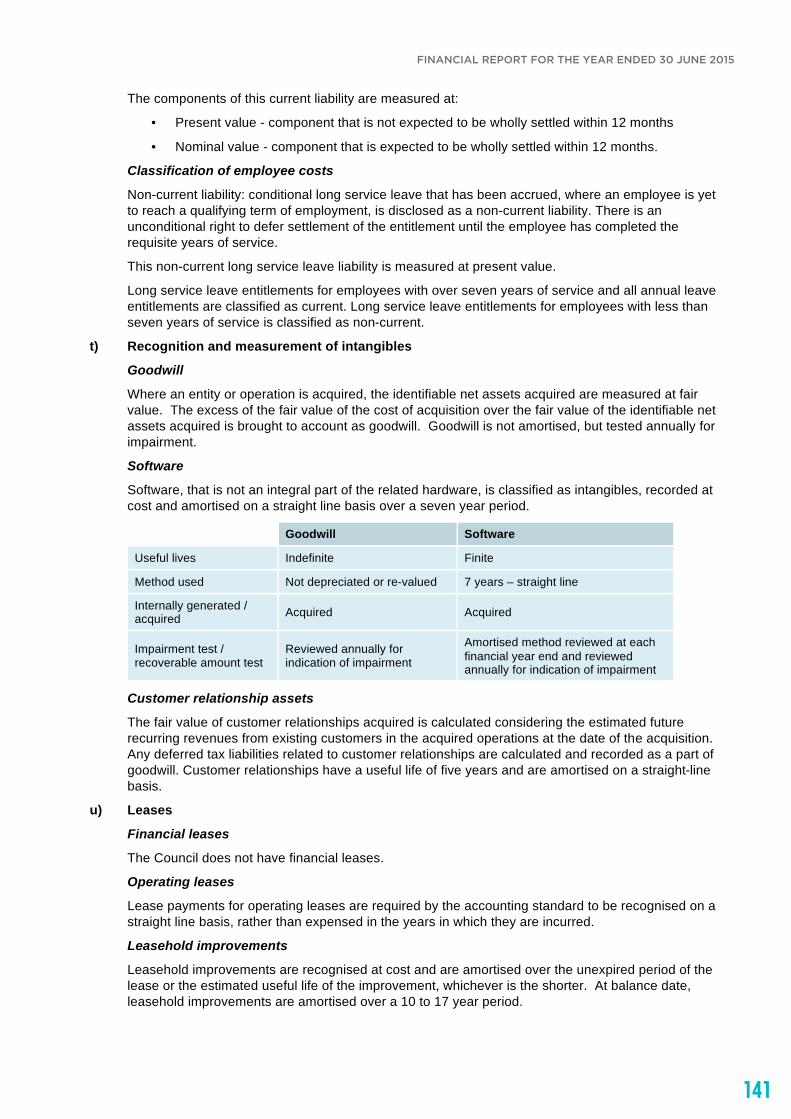
141
FINANCIAL REPORT FOR THE YEAR ENDED 30 JUNE 2015FINANCIAL REPORT FOR THE YEAR ENDED 30 JUNE 2015
142 of 69
The components of this current liability are measured at:
• Present value - component that is not expected to be wholly settled within 12 months
• Nominal value - component that is expected to be wholly settled within 12 months.
Classification of employee costs
Non-current liability: conditional long service leave that has been accrued, where an employee is yet to reach a qualifying term of employment, is disclosed as a non-current liability. There is an unconditional right to defer settlement of the entitlement until the employee has completed the requisite years of service.
This non-current long service leave liability is measured at present value.
Long service leave entitlements for employees with over seven years of service and all annual leave entitlements are classified as current. Long service leave entitlements for employees with less than seven years of service is classified as non-current.
t) Recognition and measurement of intangibles
Goodwill
Where an entity or operation is acquired, the identifiable net assets acquired are measured at fair value. The excess of the fair value of the cost of acquisition over the fair value of the identifiable net assets acquired is brought to account as goodwill. Goodwill is not amortised, but tested annually for impairment.
Software
Software, that is not an integral part of the related hardware, is classified as intangibles, recorded at cost and amortised on a straight line basis over a seven year period.
Goodwill Software
Useful lives Indefinite Finite
Method used Not depreciated or re-valued 7 years – straight line
Internally generated / acquired Acquired Acquired
Impairment test / recoverable amount test
Reviewed annually for indication of impairment
Amortised method reviewed at each financial year end and reviewed annually for indication of impairment
Customer relationship assets
The fair value of customer relationships acquired is calculated considering the estimated future recurring revenues from existing customers in the acquired operations at the date of the acquisition. Any deferred tax liabilities related to customer relationships are calculated and recorded as a part of goodwill. Customer relationships have a useful life of five years and are amortised on a straight-line basis.
u) Leases
Financial leases
The Council does not have financial leases.
Operating leases
Lease payments for operating leases are required by the accounting standard to be recognised on a straight line basis, rather than expensed in the years in which they are incurred.
Leasehold improvements
Leasehold improvements are recognised at cost and are amortised over the unexpired period of the lease or the estimated useful life of the improvement, whichever is the shorter. At balance date, leasehold improvements are amortised over a 10 to 17 year period.

142
FINANCIAL REPORT FOR THE YEAR ENDED 30 JUNE 2015
143 of 69
v) Goods and Services Tax (GST)
Revenues, expenses and assets are recognised net of the amount of GST, except where the amount of GST incurred is not recoverable from the Australian Tax Office. In these circumstances the GST is recognised as part of the cost of acquisition of the asset or as part of an item of the expense. Receivables and payables in the balance sheet are shown inclusive of GST.
Cash flows are presented in the Statement of Cash flows on a gross basis, except for the GST component of investing and financing activities, which are disclosed as operating cash flows.
w) Financial guarantees
Financial guarantee contracts are not recognised as a liability in the Balance Sheet unless the lender has exercised their right to call on the guarantee or Council has other reasons to believe that it is probably that that right will be exercised. Details of guarantees that Council has provided, that are not recognised in the balance sheet are disclosed at Note 35 Contingent Liabilities and Contingent Assets.
x) Allocation Contingent assets and contingent liabilities and commitments (TBC)
Contingent assets and contingent liabilities are not recognised in the Balance Sheet, but are disclosed by way of a note and, if quantifiable, are measured at nominal value. Contingent assets and liabilities are presented inclusive of GST receivable or payable respectively.
Commitments are not recognised in the Balance Sheet. Commitments are disclosed at their nominal value by way of note and presented inclusive of the GST payable.
y) Pending Accounting Standards
Certain new AAS's have been issued that are not mandatory for the 30 June 2015 reporting period. Council has assessed these pending standards and has identified that no material impact will flow from the application of these standards in future reporting periods.
z) Rounding
Unless otherwise stated, amounts in the Financial Statements are rounded to the nearest thousand dollars.
Note 2. Budget comparison
The budget comparison notes compare Council’s financial plan, expressed through its annual budget, with actual performance. The Local Government (Planning and Reporting) Regulations 2014 requires explanation of any material variances. Council has adopted a materiality threshold of the lower of 5 per cent or $1 million where further explanation is warranted. Explanations have not been provided for variations below the materiality threshold unless the variance is considered to be material because of its nature.
The budget figures detailed below are those adopted by Council on 30 June 2014. The Budget was based on assumptions that were relevant at the time of adoption of the Budget. Council sets guidelines and parameters for revenue and expense targets in this budget in order to meet Council’s planning and financial performance targets for both the short and long-term. The budget did not reflect any changes to equity resulting from asset revaluations, as their impacts were not considered predictable.
These notes are prepared to meet the requirements of the Local Government Act 1989 and the Local Government (Planning and Reporting) Regulations 2014.
The budget information provided only relates to the Council. No consolidated budget prepared.
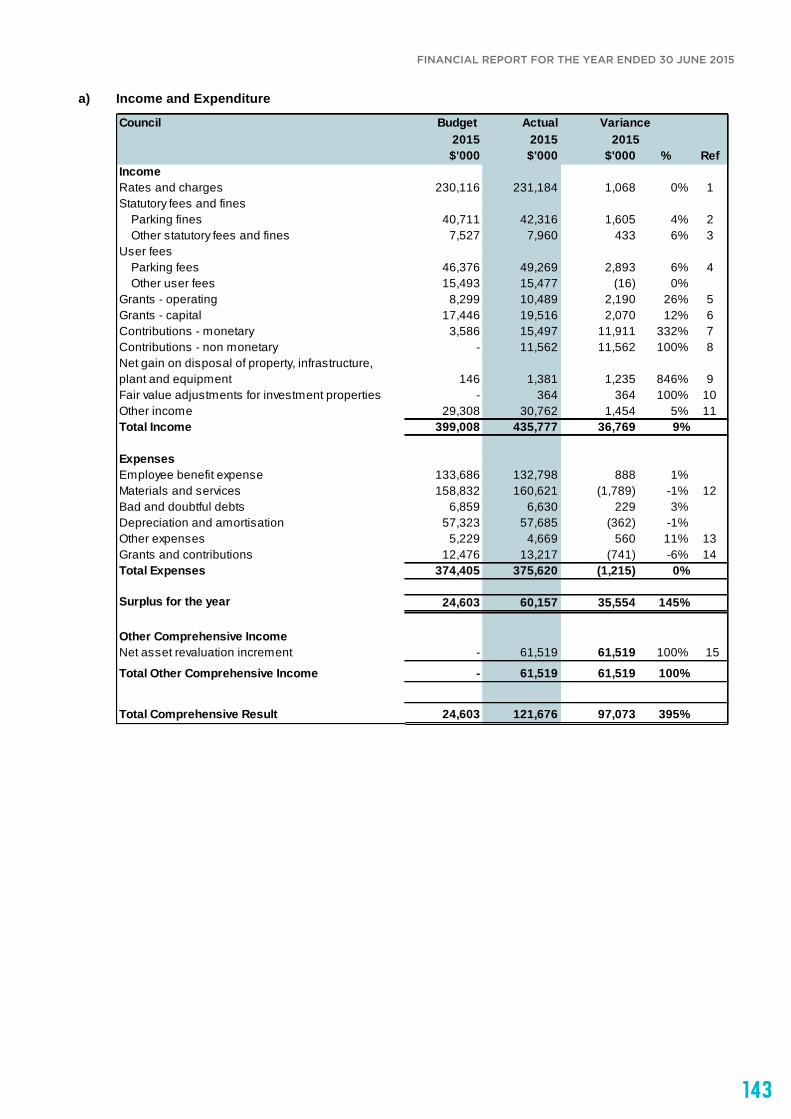
143
FINANCIAL REPORT FOR THE YEAR ENDED 30 JUNE 2015FINANCIAL REPORT FOR THE YEAR ENDED 30 JUNE 2015
144 of 69
a) Income and Expenditure
Council Budget Actual2015 2015$'000 $'000 $'000 % Ref
IncomeRates and charges 230,116 231,184 1,068 0% 1Statutory fees and fines
Parking fines 40,711 42,316 1,605 4% 2Other statutory fees and fines 7,527 7,960 433 6% 3
User feesParking fees 46,376 49,269 2,893 6% 4Other user fees 15,493 15,477 (16) 0%
Grants - operating 8,299 10,489 2,190 26% 5Grants - capital 17,446 19,516 2,070 12% 6Contributions - monetary 3,586 15,497 11,911 332% 7Contributions - non monetary - 11,562 11,562 100% 8Net gain on disposal of property, infrastructure, plant and equipment 146 1,381 1,235 846% 9Fair value adjustments for investment properties - 364 364 100% 10Other income 29,308 30,762 1,454 5% 11Total Income 399,008 435,777 36,769 9%
ExpensesEmployee benefit expense 133,686 132,798 888 1%Materials and services 158,832 160,621 (1,789) -1% 12Bad and doubtful debts 6,859 6,630 229 3%Depreciation and amortisation 57,323 57,685 (362) -1%Other expenses 5,229 4,669 560 11% 13Grants and contributions 12,476 13,217 (741) -6% 14Total Expenses 374,405 375,620 (1,215) 0%
Surplus for the year 24,603 60,157 35,554 145%
Other Comprehensive IncomeNet asset revaluation increment - 61,519 61,519 100% 15
Total Other Comprehensive Income - 61,519 61,519 100%
Total Comprehensive Result 24,603 121,676 97,073 395%
Variance2015

144
FINANCIAL REPORT FOR THE YEAR ENDED 30 JUNE 2015
145 of 69
i. Explanation of material variations
Ref. Item Explanation
1 Rates and charges Due to higher than expected supplementary rate income.
2 Parking fines Due to higher parking infringements being issued.
3 Other statutory fees and fines
Due to higher planning fees ($0.29 million) and building fines ($0.12 million).
4 Parking fees Due to higher construction zone parking meter fees and towing vehicles fees.
5 Grants - operating Due to 2015-16 Victorian Grants Commission grants receipt earlier than expected and Creative Victoria grants for management of Meat Market.
6 Grants - capital Due to 2015-16 Victorian Grants Commission grants ($0.84 million) receipt earlier than expected, higher grants for Royal and Princes Parks Recreation Infrastructure Improvement ($0.94 million) and Kathleen Syme Library and Community Centre redevelopment ($0.28 million).
7 Contributions - monetary Due to higher public open spaces contributions ($12.11 million).
8 Contributions - non monetary
Due to external asset contributions on infrastructure ($9.81 million) and land under roads ($1.75 million).
9 Net gain on asset disposal
Due to gain on sale of land of 2 Riverside Quay and lane of rear of Collins Street.
10 Fair value adjustments for investment properties
Due to gain ($0.36 million) on investment asset valuation.
11 Other income Due mainly to grants-in-kind revenue ($1.15 million) which is fully offset by grants-in-kind expenditure.
12 Materials and services Mainly due to higher than expected contractor costs as a result of additional service requirements and costs.
13 Other expenses Due to lower Fire Service Levy expenditure ($0.56 million).
14 Grants and contributions Due to grants-in-kind expenditure ($1.15 million) which is fully offset by grants-in-kind revenue.
15 Net asset revaluation increment
Due to gain on fixed asset valuation including $56.63 million on roads & lanes.

145
FINANCIAL REPORT FOR THE YEAR ENDED 30 JUNE 2015FINANCIAL REPORT FOR THE YEAR ENDED 30 JUNE 2015
146 of 69
b) Capital Works
Council Budget Actual2015 2015$'000 $'000 $'000 % Ref
PropertyLand - 4 (4) 0%Total Land - 4 (4) 0%
BuildingsBuildings 17,273 10,818 6,455 37% 1Heritage buildings 8,873 8,549 324 4%Total Buildings 26,146 19,367 6,779 26%
Total Property 26,146 19,371 6,775 26%
Plant & EquipmentPlant, machinery and equipment 2,911 1,865 1,046 36% 2Fixtures, fittings and furniture 135 41 94 70%Computers and telecommunications 9,244 7,170 2,074 22% 3Library books 919 915 4 0%Total Plant & Equipment 13,209 9,991 3,218 24%
InfrastructureRoads 14,926 13,110 1,816 12% 4Bridges 1,038 659 379 37% 5Footpaths and cycleways 4,900 5,480 (580) -12% 6Drainage 5,926 3,465 2,461 42% 7Recreational, leisure and community facilities 100 10 90 90%Parks, open space and streetscapes 1,700 1,239 461 27% 8Statues, sculptures and artworks 680 72 608 89% 9Other infrastructure 39,960 28,681 11,279 28% 10Total Infrastructure 69,230 52,716 16,514 24%
Total capital works expenditure 108,585 82,078 26,507 24%
Represented by:New asset expenditure 54,252 39,494 14,758 27%Asset renewal expenditure 49,699 39,934 9,765 20%Asset expansion expenditure 1,050 485 565 54%Asset upgrade expenditure 3,584 2,165 1,419 40%Total capital works expenditure 108,585 82,078 26,507 24%
Variance2015
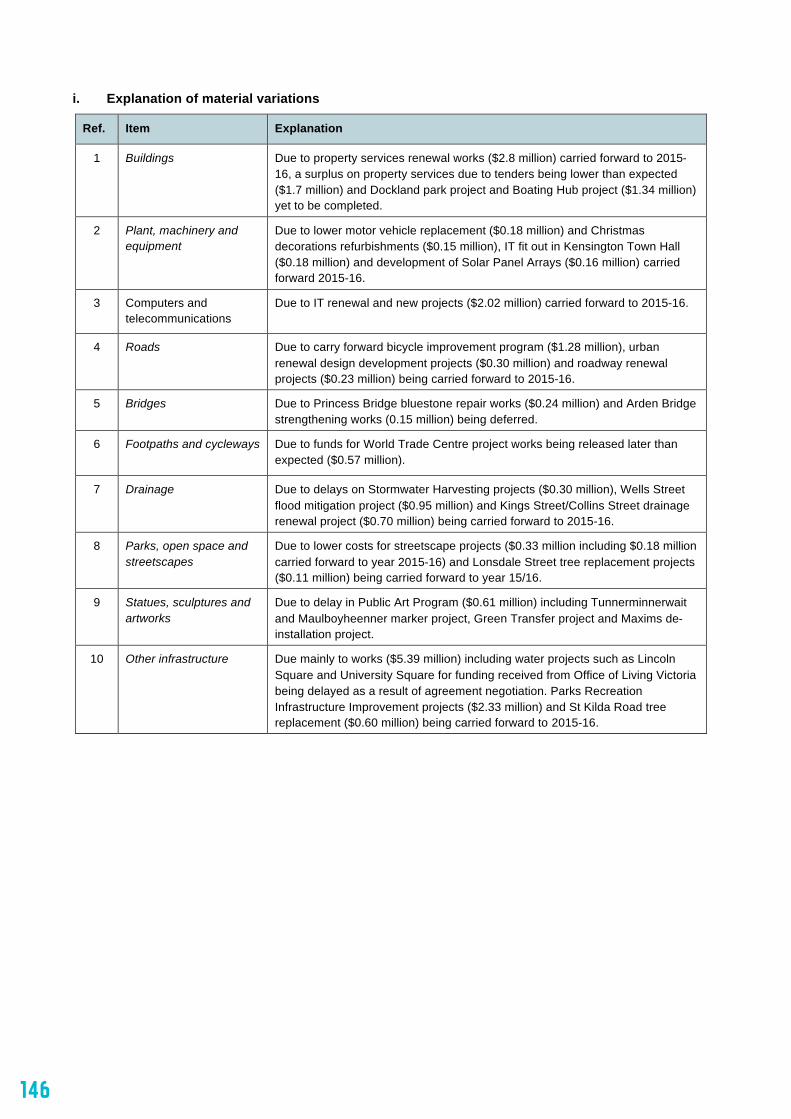
146
FINANCIAL REPORT FOR THE YEAR ENDED 30 JUNE 2015
147 of 69
i. Explanation of material variations
Ref. Item Explanation
1 Buildings Due to property services renewal works ($2.8 million) carried forward to 2015-16, a surplus on property services due to tenders being lower than expected ($1.7 million) and Dockland park project and Boating Hub project ($1.34 million) yet to be completed.
2 Plant, machinery and equipment
Due to lower motor vehicle replacement ($0.18 million) and Christmas decorations refurbishments ($0.15 million), IT fit out in Kensington Town Hall ($0.18 million) and development of Solar Panel Arrays ($0.16 million) carried forward 2015-16.
3 Computers and telecommunications
Due to IT renewal and new projects ($2.02 million) carried forward to 2015-16.
4 Roads Due to carry forward bicycle improvement program ($1.28 million), urban renewal design development projects ($0.30 million) and roadway renewal projects ($0.23 million) being carried forward to 2015-16.
5 Bridges Due to Princess Bridge bluestone repair works ($0.24 million) and Arden Bridge strengthening works (0.15 million) being deferred.
6 Footpaths and cycleways Due to funds for World Trade Centre project works being released later than expected ($0.57 million).
7 Drainage Due to delays on Stormwater Harvesting projects ($0.30 million), Wells Street flood mitigation project ($0.95 million) and Kings Street/Collins Street drainage renewal project ($0.70 million) being carried forward to 2015-16.
8 Parks, open space and streetscapes
Due to lower costs for streetscape projects ($0.33 million including $0.18 million carried forward to year 2015-16) and Lonsdale Street tree replacement projects ($0.11 million) being carried forward to year 15/16.
9 Statues, sculptures and artworks
Due to delay in Public Art Program ($0.61 million) including Tunnerminnerwait and Maulboyheenner marker project, Green Transfer project and Maxims de-installation project.
10 Other infrastructure Due mainly to works ($5.39 million) including water projects such as Lincoln Square and University Square for funding received from Office of Living Victoria being delayed as a result of agreement negotiation. Parks Recreation Infrastructure Improvement projects ($2.33 million) and St Kilda Road tree replacement ($0.60 million) being carried forward to 2015-16.

147
FINANCIAL REPORT FOR THE YEAR ENDED 30 JUNE 2015FINANCIAL REPORT FOR THE YEAR ENDED 30 JUNE 2015
148 of 69
REVENUE Note 3. Rates and charges
Council uses ‘net annual value’ as the basis of valuation of all properties within the municipal district. The net annual value of a property approximates the annual net rental for a commercial property and five per cent of the capital improved value for a residential property.
The valuation base used to calculate general rates for 2014-15 was $5,206 million (2013-14 $4,773 million).
The date of the latest general valuation of land for rating purposes within the municipal district was 1 January 2014 and the valuation first applied to the rating period commencing 1 July 2014. The valuation for rating purposes is performed on a two year cycle.
Note 4. Statutory fees and fines
2015 2014 2015 2014$'000 $'000
Residential 1,827,534 1,667,954 4.04690 4.05905Non-Residential 3,324,224 3,053,230 4.59010 4.77439Cultural & recreational 54,656 52,257
5,206,414 4,773,441
Valuation base Rate in $
2015 2014 2015 2014$'000 $'000 $'000 $'000
General rates - Residential 73,521 67,703 73,521 67,703 - Non-Residential 152,737 145,567 153,002 145,773Cultural & recreational 397 383 397 383Supplementary rates and rate adjustments 4,264 (22) 4,264 (22)
230,919 213,631 231,184 213,837
Consolidated Council
2015 2014 2015 2014$'000 $'000 $'000 $'000
Infringements and costsParking fines 42,316 38,495 42,316 38,495General fines 1,498 1,763 1,498 1,763
Court recoveries 1 3 1 3Town planning fees 2,060 1,998 2,060 1,998Land Information Certificates 182 192 182 192Permits 1,310 1,267 1,310 1,267Food and Health Act registration 2,909 2,648 2,909 2,648
50,276 46,366 50,276 46,366
Consolidated Council
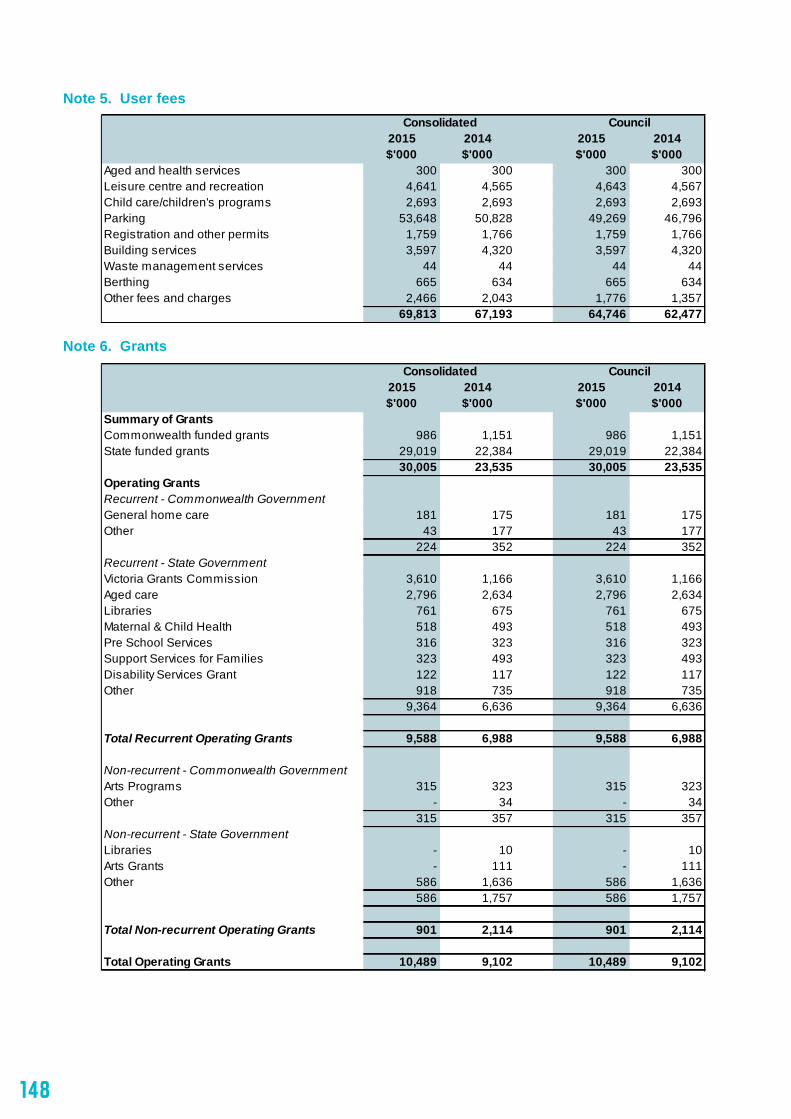
148
FINANCIAL REPORT FOR THE YEAR ENDED 30 JUNE 2015
149 of 69
Note 5. User fees
Note 6. Grants
2015 2014 2015 2014$'000 $'000 $'000 $'000
Aged and health services 300 300 300 300Leisure centre and recreation 4,641 4,565 4,643 4,567Child care/children's programs 2,693 2,693 2,693 2,693Parking 53,648 50,828 49,269 46,796Registration and other permits 1,759 1,766 1,759 1,766Building services 3,597 4,320 3,597 4,320Waste management services 44 44 44 44Berthing 665 634 665 634Other fees and charges 2,466 2,043 1,776 1,357
69,813 67,193 64,746 62,477
Consolidated Council
2015 2014 2015 2014$'000 $'000 $'000 $'000
Summary of GrantsCommonwealth funded grants 986 1,151 986 1,151State funded grants 29,019 22,384 29,019 22,384
30,005 23,535 30,005 23,535Operating GrantsRecurrent - Commonwealth GovernmentGeneral home care 181 175 181 175Other 43 177 43 177
224 352 224 352Recurrent - State GovernmentVictoria Grants Commission 3,610 1,166 3,610 1,166Aged care 2,796 2,634 2,796 2,634Libraries 761 675 761 675Maternal & Child Health 518 493 518 493Pre School Services 316 323 316 323Support Services for Families 323 493 323 493Disability Services Grant 122 117 122 117Other 918 735 918 735
9,364 6,636 9,364 6,636
Total Recurrent Operating Grants 9,588 6,988 9,588 6,988
Non-recurrent - Commonwealth GovernmentArts Programs 315 323 315 323Other - 34 - 34
315 357 315 357Non-recurrent - State GovernmentLibraries - 10 - 10Arts Grants - 111 - 111Other 586 1,636 586 1,636
586 1,757 586 1,757
Total Non-recurrent Operating Grants 901 2,114 901 2,114
Total Operating Grants 10,489 9,102 10,489 9,102
CouncilConsolidated
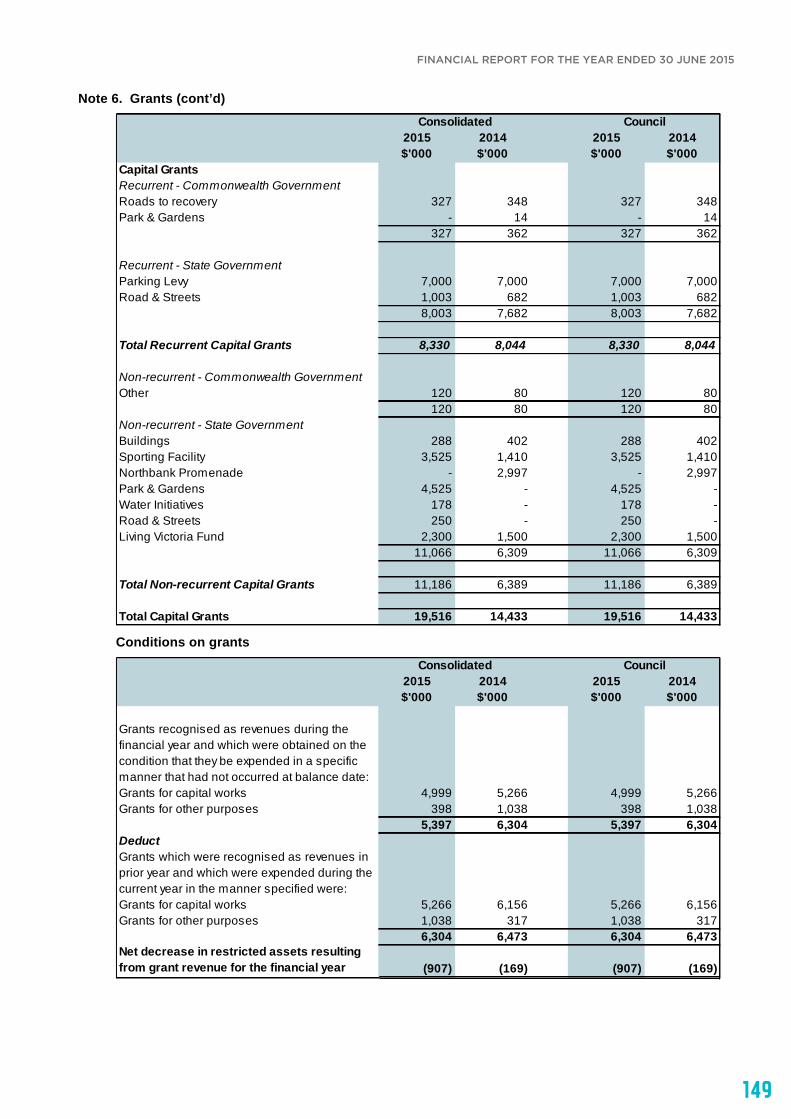
149
FINANCIAL REPORT FOR THE YEAR ENDED 30 JUNE 2015FINANCIAL REPORT FOR THE YEAR ENDED 30 JUNE 2015
150 of 69
Note 6. Grants (cont’d)
Conditions on grants
2015 2014 2015 2014$'000 $'000 $'000 $'000
Capital GrantsRecurrent - Commonwealth GovernmentRoads to recovery 327 348 327 348Park & Gardens - 14 - 14
327 362 327 362
Recurrent - State GovernmentParking Levy 7,000 7,000 7,000 7,000Road & Streets 1,003 682 1,003 682
8,003 7,682 8,003 7,682
Total Recurrent Capital Grants 8,330 8,044 8,330 8,044
Non-recurrent - Commonwealth GovernmentOther 120 80 120 80
120 80 120 80Non-recurrent - State GovernmentBuildings 288 402 288 402Sporting Facility 3,525 1,410 3,525 1,410Northbank Promenade - 2,997 - 2,997Park & Gardens 4,525 - 4,525 -Water Initiatives 178 - 178 -Road & Streets 250 - 250 -Living Victoria Fund 2,300 1,500 2,300 1,500
11,066 6,309 11,066 6,309
Total Non-recurrent Capital Grants 11,186 6,389 11,186 6,389
Total Capital Grants 19,516 14,433 19,516 14,433
Consolidated Council
2015 2014 2015 2014$'000 $'000 $'000 $'000
Grants recognised as revenues during the financial year and which were obtained on the condition that they be expended in a specific manner that had not occurred at balance date:Grants for capital works 4,999 5,266 4,999 5,266Grants for other purposes 398 1,038 398 1,038
5,397 6,304 5,397 6,304DeductGrants which were recognised as revenues in prior year and which were expended during the current year in the manner specified were:Grants for capital works 5,266 6,156 5,266 6,156Grants for other purposes 1,038 317 1,038 317
6,304 6,473 6,304 6,473Net decrease in restricted assets resulting from grant revenue for the financial year (907) (169) (907) (169)
Consolidated Council
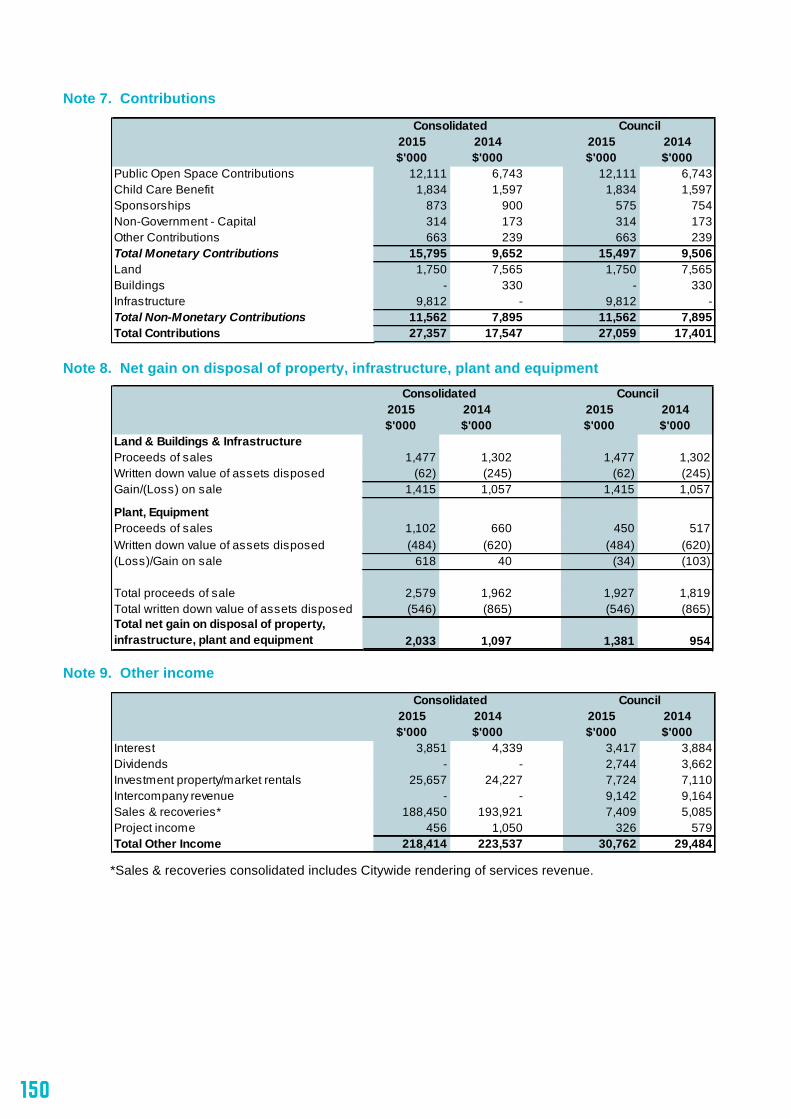
150
FINANCIAL REPORT FOR THE YEAR ENDED 30 JUNE 2015
151 of 69
Note 7. Contributions
Note 8. Net gain on disposal of property, infrastructure, plant and equipment
Note 9. Other income
*Sales & recoveries consolidated includes Citywide rendering of services revenue.
2015 2014 2015 2014$'000 $'000 $'000 $'000
Public Open Space Contributions 12,111 6,743 12,111 6,743Child Care Benefit 1,834 1,597 1,834 1,597Sponsorships 873 900 575 754Non-Government - Capital 314 173 314 173Other Contributions 663 239 663 239Total Monetary Contributions 15,795 9,652 15,497 9,506Land 1,750 7,565 1,750 7,565Buildings - 330 - 330Infrastructure 9,812 - 9,812 -Total Non-Monetary Contributions 11,562 7,895 11,562 7,895Total Contributions 27,357 17,547 27,059 17,401
Consolidated Council
2015 2014 2015 2014$'000 $'000 $'000 $'000
Land & Buildings & InfrastructureProceeds of sales 1,477 1,302 1,477 1,302Written down value of assets disposed (62) (245) (62) (245)Gain/(Loss) on sale 1,415 1,057 1,415 1,057
Plant, Equipment Proceeds of sales 1,102 660 450 517Written down value of assets disposed (484) (620) (484) (620)(Loss)/Gain on sale 618 40 (34) (103)
Total proceeds of sale 2,579 1,962 1,927 1,819Total written down value of assets disposed (546) (865) (546) (865)Total net gain on disposal of property, infrastructure, plant and equipment 2,033 1,097 1,381 954
Consolidated Council
2015 2014 2015 2014$'000 $'000 $'000 $'000
Interest 3,851 4,339 3,417 3,884Dividends - - 2,744 3,662Investment property/market rentals 25,657 24,227 7,724 7,110Intercompany revenue - - 9,142 9,164Sales & recoveries* 188,450 193,921 7,409 5,085Project income 456 1,050 326 579Total Other Income 218,414 223,537 30,762 29,484
Consolidated Council
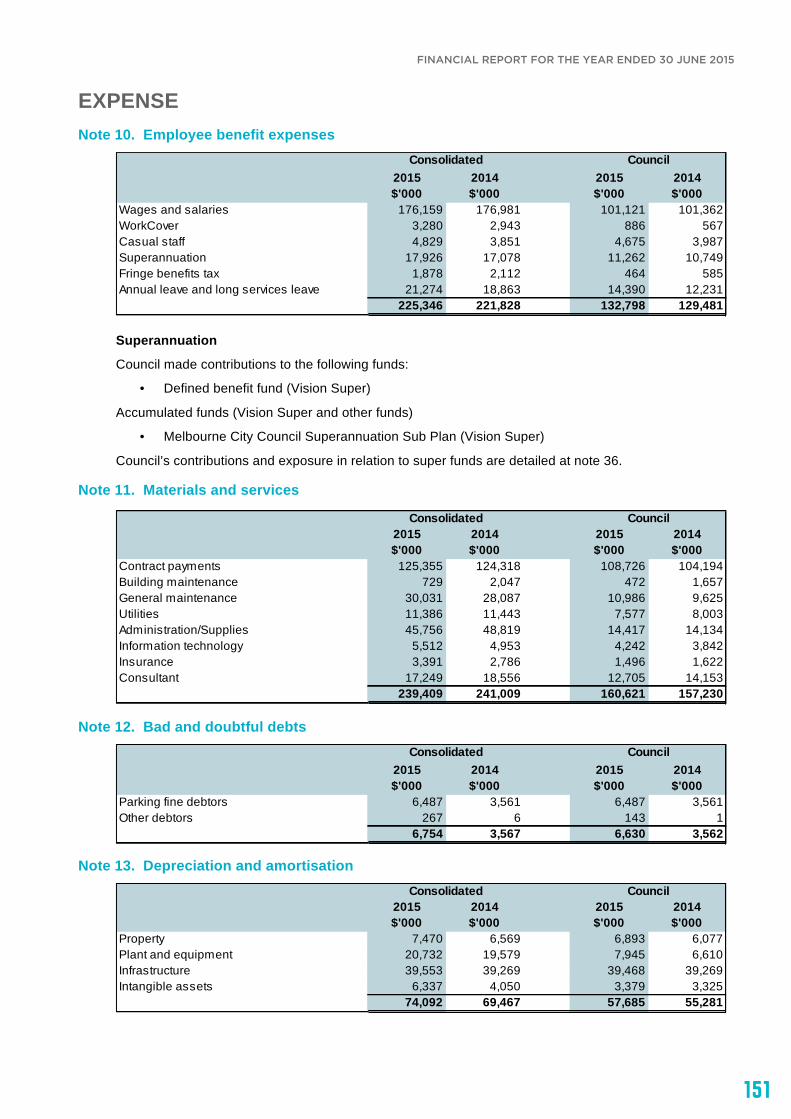
151
FINANCIAL REPORT FOR THE YEAR ENDED 30 JUNE 2015FINANCIAL REPORT FOR THE YEAR ENDED 30 JUNE 2015
152 of 69
EXPENSE Note 10. Employee benefit expenses
Superannuation
Council made contributions to the following funds:
• Defined benefit fund (Vision Super)
Accumulated funds (Vision Super and other funds)
• Melbourne City Council Superannuation Sub Plan (Vision Super)
Council’s contributions and exposure in relation to super funds are detailed at note 36.
Note 11. Materials and services
Note 12. Bad and doubtful debts
Note 13. Depreciation and amortisation
2015 2014 2015 2014$'000 $'000 $'000 $'000
Wages and salaries 176,159 176,981 101,121 101,362WorkCover 3,280 2,943 886 567Casual staff 4,829 3,851 4,675 3,987Superannuation 17,926 17,078 11,262 10,749Fringe benefits tax 1,878 2,112 464 585Annual leave and long services leave 21,274 18,863 14,390 12,231
225,346 221,828 132,798 129,481
Consolidated Council
2015 2014 2015 2014$'000 $'000 $'000 $'000
Contract payments 125,355 124,318 108,726 104,194Building maintenance 729 2,047 472 1,657General maintenance 30,031 28,087 10,986 9,625Utilities 11,386 11,443 7,577 8,003Administration/Supplies 45,756 48,819 14,417 14,134Information technology 5,512 4,953 4,242 3,842Insurance 3,391 2,786 1,496 1,622Consultant 17,249 18,556 12,705 14,153
239,409 241,009 160,621 157,230
Consolidated Council
2015 2014 2015 2014$'000 $'000 $'000 $'000
Parking fine debtors 6,487 3,561 6,487 3,561Other debtors 267 6 143 1
6,754 3,567 6,630 3,562
Consolidated Council
2015 2014 2015 2014$'000 $'000 $'000 $'000
Property 7,470 6,569 6,893 6,077Plant and equipment 20,732 19,579 7,945 6,610Infrastructure 39,553 39,269 39,468 39,269Intangible assets 6,337 4,050 3,379 3,325
74,092 69,467 57,685 55,281
Consolidated Council
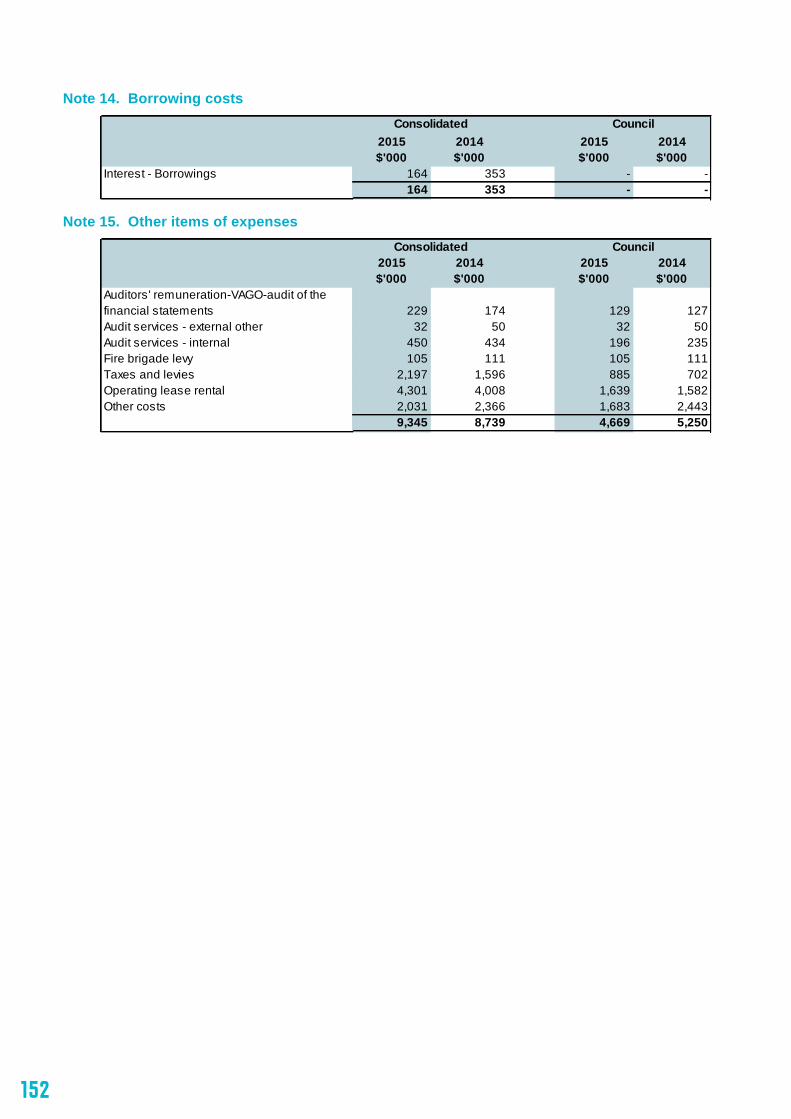
152
FINANCIAL REPORT FOR THE YEAR ENDED 30 JUNE 2015
153 of 69
Note 14. Borrowing costs
Note 15. Other items of expenses
2015 2014 2015 2014$'000 $'000 $'000 $'000
Interest - Borrowings 164 353 - -164 353 - -
Consolidated Council
2015 2014 2015 2014$'000 $'000 $'000 $'000
Auditors' remuneration-VAGO-audit of the financial statements 229 174 129 127Audit services - external other 32 50 32 50Audit services - internal 450 434 196 235Fire brigade levy 105 111 105 111Taxes and levies 2,197 1,596 885 702Operating lease rental 4,301 4,008 1,639 1,582Other costs 2,031 2,366 1,683 2,443
9,345 8,739 4,669 5,250
Consolidated Council

153
FINANCIAL REPORT FOR THE YEAR ENDED 30 JUNE 2015FINANCIAL REPORT FOR THE YEAR ENDED 30 JUNE 2015
154 of 69
ASSETS Note 16. Cash and cash equivalents
Council has cash and cash equivalents that are subject to external restrictions that limit amounts available for discretionary use. These include:
Intended allocations
Although not externally restricted the following amounts have been allocated for specific future purposes by Council:
Note 17. Trade and other receivables
2015 2014 2015 2014$'000 $'000 $'000 $'000
Cash on hand 76 80 37 41Cash at bank 88,378 8,509 81,783 6,875Term deposits 30,518 80,435 24,699 74,423Cash and Cash Equivalents 118,972 89,024 106,519 81,339
CouncilConsolidated
2015 2014 2015 2014$'000 $'000 Note $'000 $'000
Trust funds and deposits 8,526 7,057 26 6,111 4,901Reserve funds (Public Open Space) 18,671 13,906 29 18,671 13,906Total restricted funds 27,197 20,963 24,782 18,807Total unrestricted cash and cash equivalents 91,775 68,061 81,737 62,532
CouncilConsolidated
2015 2014 2015 2014$'000 $'000 $'000 $'000
Cash held to fund carried forward capital works 27,417 21,452 27,417 21,452
Total funds subject to intended allocations 27,417 21,452 27,417 21,452
Consolidated Council
2015 2014 2015 2014$'000 $'000 $'000 $'000
Rate debtors 818 2,878 818 2,879Parking infringement debtors 31,265 27,814 31,265 27,814Provision for doubtful debts - Parking infringements
(16,633) (14,732) (16,633) (14,732)
Other debtors 31,445 33,502 5,185 5,044Provision for doubtful debts - other debtors (794) (556) (371) (246)Net GST receivable 2,896 8,789 5,286 5,867Total current trade and other receivables 48,997 57,695 25,550 26,626
Consolidated CouncilCurrent
2015 2014 2015 2014$'000 $'000 $'000 $'000
Current (not yet due) 25,465 26,582 3,012 3,017Past due by up to 30 days 3,277 4,625 1,093 1,462Past due between 31 and 180 days 2,339 2,063 880 371Past due between 181 and 365 days 280 132 116 94Past due by more than 1 year 84 100 84 100Total 31,445 33,502 5,185 5,044
Ageing of receivables - other debtorsConsolidated Council

154
FINANCIAL REPORT FOR THE YEAR ENDED 30 JUNE 2015
155 of 69
Ageing of impaired receivables
At balance date, trade debtors representing financial assets with a nominal value of $0.794 million (2014: $0.556 million) were impaired. The amount of the new provision raised against these debtors was $0.279 million (2014: $0.003 million). They individually have been impaired as a result of their doubtful collection. Many of the long outstanding past due amounts have been lodged with Council's debt collectors or are on payment arrangements.
The ageing of trade receivables that have been individually determined as impaired at reporting date was:
Note 18. Other financial assets
*Term deposits with an original maturity date of greater than three months from the balance date of the financial statements.
2015 2014 2015 2014$'000 $'000 $'000 $'000
Provision for doubtful debts - Parking infringement 16,633 14,732 16,633 14,732Provision for doubtful debts - Trade debtors 794 556 371 246Total 17,427 15,288 17,004 14,978
Consolidated CouncilProvision for doubtful debts
2015 2014 2015 2014$'000 $'000 $'000 $'000
Balance at the beginning of the year 14,732 16,189 14,732 16,189New provisions recognised 6,487 3,561 6,487 3,561Amounts written off as uncollectible (6,984) (7,528) (6,984) (7,528)Amounts recovered during the year 2,398 2,510 2,398 2,510Balance at the end of the year 16,633 14,732 16,633 14,732
Movement in doubtful debts - parking infringement
Consolidated Council
2015 2014 2015 2014$'000 $'000 $'000 $'000
Balance at the beginning of the year 556 610 246 286New provisions recognised 279 3 126 (41)Amounts written off as uncollectible (124) (57) (84) (16)Amounts recovered during the year 83 - 83 17Balance at the end of the year 794 556 371 246
Movement in doubtful debts - trade debtorsConsolidated Council
2015 2014 2015 2014$'000 $'000 $'000 $'000
Current (not yet due) 169 183 - -Past due by up to 30 days 67 74 - -Past due between 31 and 180 days 143 65 129 50Past due between 181 and 365 days 332 120 159 82Past due by more than 1 year 83 114 83 114Total 794 556 371 246
Ageing of receivables (impaired)Consolidated Council
2015 2014 2015 2014$'000 $'000 $'000 $'000
Term deposits* 5,300 21,700 2,000 18,0005,300 21,700 2,000 18,000
Consolidated Council

155
FINANCIAL REPORT FOR THE YEAR ENDED 30 JUNE 2015FINANCIAL REPORT FOR THE YEAR ENDED 30 JUNE 2015
156 of 69
Note 19. Inventories
Note 20. Other assets
* Deposit of property purchase - $7.6 million deposit paid for Munro site purchase (total cost is $76 million, balance to be paid in 2015-16). The Council believes the Munro site to be of unprecedented strategic importance to the people of Melbourne and for the future of the Queen Victoria Market precinct.
Note 21. Investments
* Investment in Enterprise Melbourne is $2.
2015 2014 2015 2014$'000 $'000 $'000 $'000
Inventory held for distribution 816 656 - -816 656 - -
Consolidated Council
2015 2014 2015 2014$'000 $'000 $'000 $'000
Prepayments 2,027 1,307 2,430 156Deposit of property purchase* 7,600 - 7,600 -Accrued income 6,033 5,316 1,927 1,109Other - - 707 2,655
15,660 6,623 12,664 3,920
CouncilConsolidated
2015 2014 2015 2014$'000 $'000 $'000 $'000
a) SubsidiariesCityWide Service Solutions Pty Ltd - - 18,406 18,406Queen Victoria Market Pty Ltd - - 200 200Investment in Sustainable Melbourne Fund - - 5,803 6,035Enterprise Melbourne* - - - -
- - 24,409 24,641b) AssociatesRegent Management Company Pty Ltd 7,000 7,425 7,000 7,425MAPS Group Ltd (Procurement Australia) 250 250 250 250
7,250 7,675 7,250 7,6757,250 7,675 31,659 32,316
Consolidated CouncilNon-Current
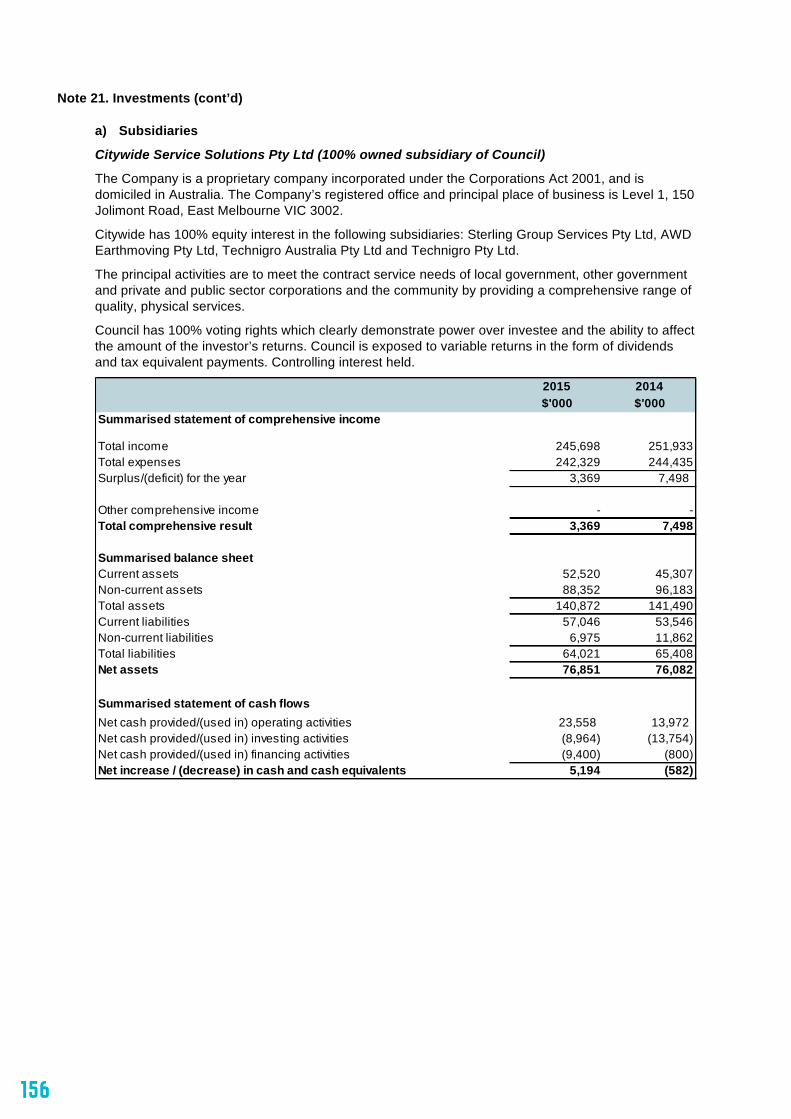
156
FINANCIAL REPORT FOR THE YEAR ENDED 30 JUNE 2015
157 of 69
Note 21. Investments (cont’d)
a) Subsidiaries
Citywide Service Solutions Pty Ltd (100% owned subsidiary of Council)
The Company is a proprietary company incorporated under the Corporations Act 2001, and is domiciled in Australia. The Company’s registered office and principal place of business is Level 1, 150 Jolimont Road, East Melbourne VIC 3002.
Citywide has 100% equity interest in the following subsidiaries: Sterling Group Services Pty Ltd, AWD Earthmoving Pty Ltd, Technigro Australia Pty Ltd and Technigro Pty Ltd.
The principal activities are to meet the contract service needs of local government, other government and private and public sector corporations and the community by providing a comprehensive range of quality, physical services.
Council has 100% voting rights which clearly demonstrate power over investee and the ability to affect the amount of the investor’s returns. Council is exposed to variable returns in the form of dividends and tax equivalent payments. Controlling interest held.
2015 2014$'000 $'000
Summarised statement of comprehensive income
Total income 245,698 251,933Total expenses 242,329 244,435Surplus/(deficit) for the year 3,369 7,498
Other comprehensive income - -Total comprehensive result 3,369 7,498
Summarised balance sheetCurrent assets 52,520 45,307Non-current assets 88,352 96,183Total assets 140,872 141,490Current liabilities 57,046 53,546Non-current liabilities 6,975 11,862Total liabilities 64,021 65,408Net assets 76,851 76,082
Summarised statement of cash flowsNet cash provided/(used in) operating activities 23,558 13,972 Net cash provided/(used in) investing activities (8,964) (13,754)Net cash provided/(used in) financing activities (9,400) (800)Net increase / (decrease) in cash and cash equivalents 5,194 (582)
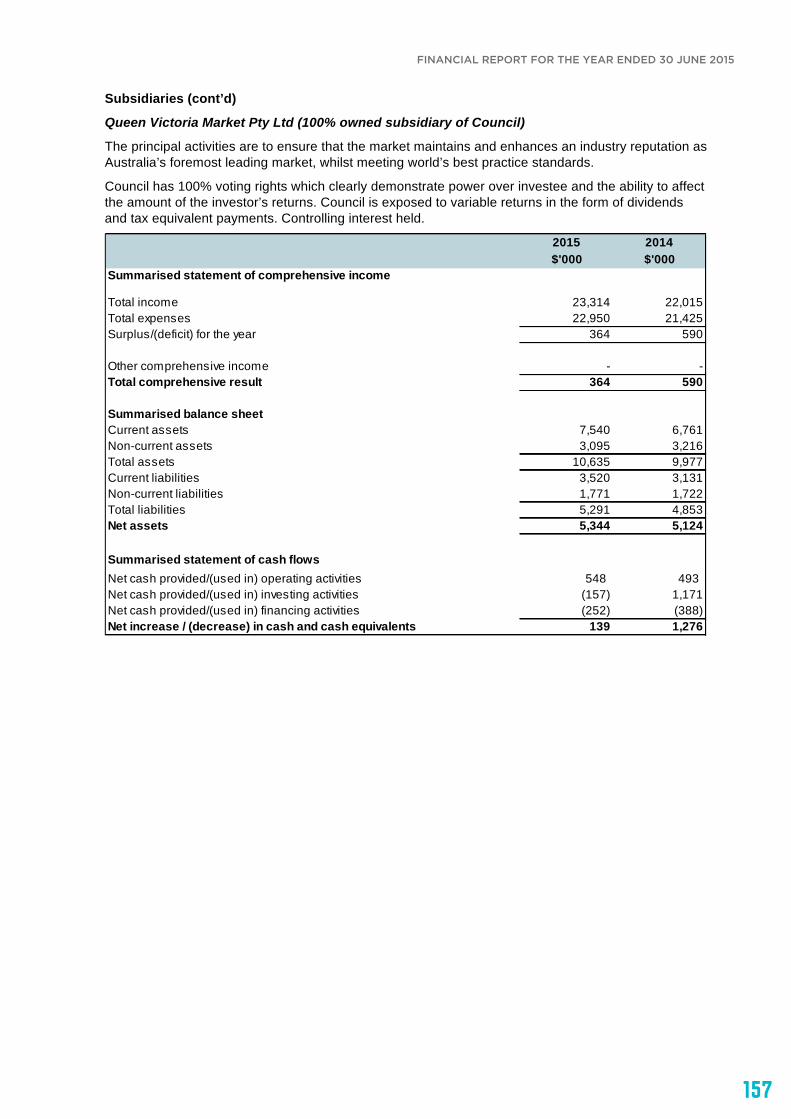
157
FINANCIAL REPORT FOR THE YEAR ENDED 30 JUNE 2015FINANCIAL REPORT FOR THE YEAR ENDED 30 JUNE 2015
158 of 69
Subsidiaries (cont’d)
Queen Victoria Market Pty Ltd (100% owned subsidiary of Council)
The principal activities are to ensure that the market maintains and enhances an industry reputation as Australia’s foremost leading market, whilst meeting world’s best practice standards.
Council has 100% voting rights which clearly demonstrate power over investee and the ability to affect the amount of the investor’s returns. Council is exposed to variable returns in the form of dividends and tax equivalent payments. Controlling interest held.
2015 2014$'000 $'000
Summarised statement of comprehensive income
Total income 23,314 22,015Total expenses 22,950 21,425Surplus/(deficit) for the year 364 590
Other comprehensive income - -Total comprehensive result 364 590
Summarised balance sheetCurrent assets 7,540 6,761Non-current assets 3,095 3,216Total assets 10,635 9,977Current liabilities 3,520 3,131Non-current liabilities 1,771 1,722Total liabilities 5,291 4,853Net assets 5,344 5,124
Summarised statement of cash flowsNet cash provided/(used in) operating activities 548 493 Net cash provided/(used in) investing activities (157) 1,171Net cash provided/(used in) financing activities (252) (388)Net increase / (decrease) in cash and cash equivalents 139 1,276
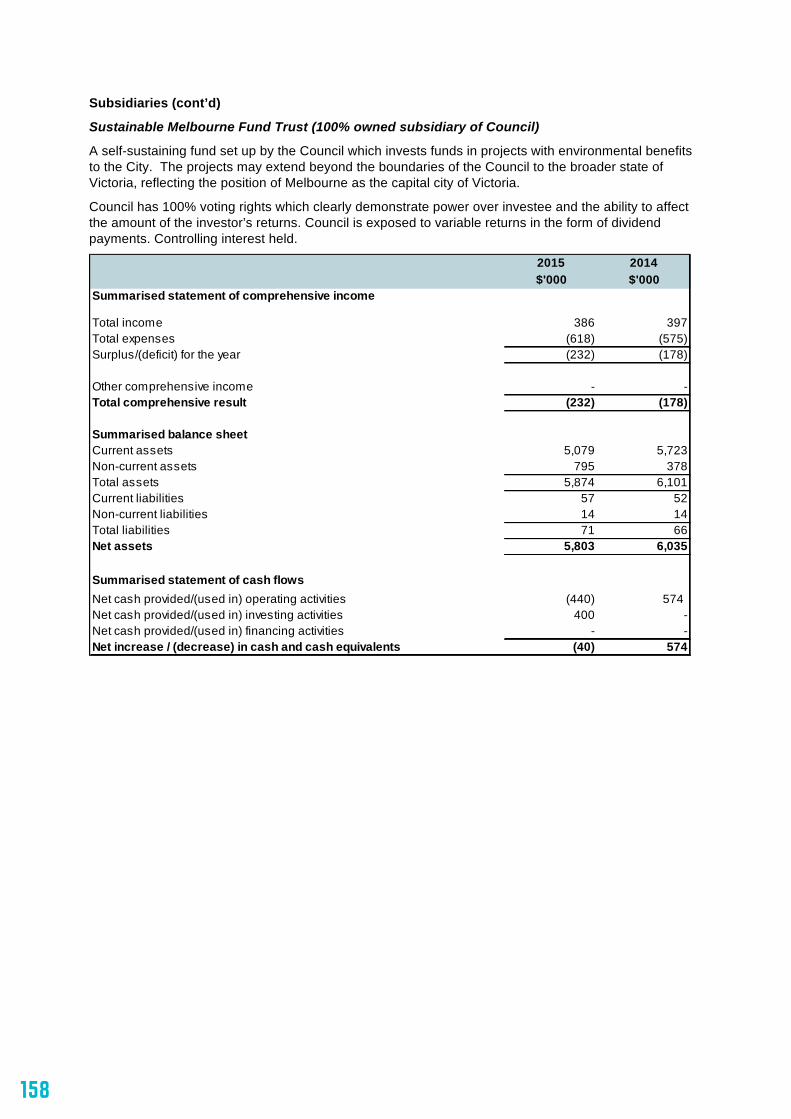
158
FINANCIAL REPORT FOR THE YEAR ENDED 30 JUNE 2015
159 of 69
Subsidiaries (cont’d)
Sustainable Melbourne Fund Trust (100% owned subsidiary of Council)
A self-sustaining fund set up by the Council which invests funds in projects with environmental benefits to the City. The projects may extend beyond the boundaries of the Council to the broader state of Victoria, reflecting the position of Melbourne as the capital city of Victoria.
Council has 100% voting rights which clearly demonstrate power over investee and the ability to affect the amount of the investor’s returns. Council is exposed to variable returns in the form of dividend payments. Controlling interest held.
2015 2014$'000 $'000
Summarised statement of comprehensive income
Total income 386 397Total expenses (618) (575)Surplus/(deficit) for the year (232) (178)
Other comprehensive income - -Total comprehensive result (232) (178)
Summarised balance sheetCurrent assets 5,079 5,723Non-current assets 795 378Total assets 5,874 6,101Current liabilities 57 52Non-current liabilities 14 14Total liabilities 71 66Net assets 5,803 6,035
Summarised statement of cash flowsNet cash provided/(used in) operating activities (440) 574 Net cash provided/(used in) investing activities 400 -Net cash provided/(used in) financing activities - -Net increase / (decrease) in cash and cash equivalents (40) 574
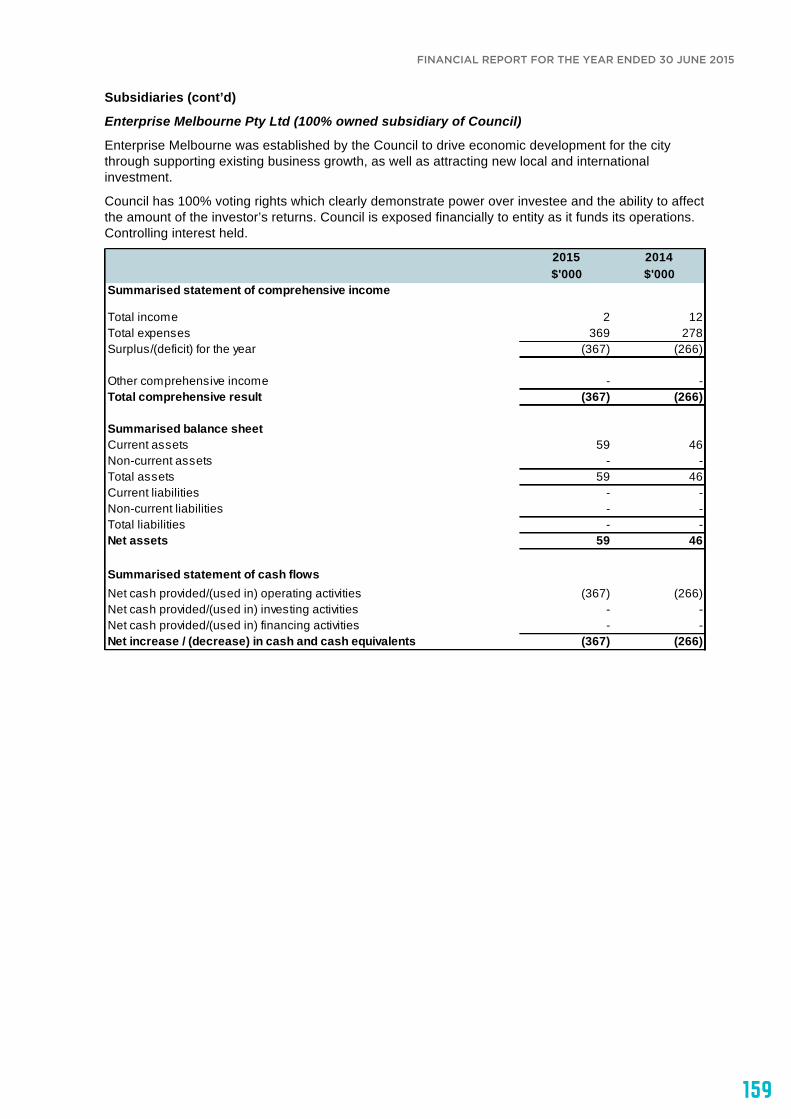
159
FINANCIAL REPORT FOR THE YEAR ENDED 30 JUNE 2015FINANCIAL REPORT FOR THE YEAR ENDED 30 JUNE 2015
160 of 69
Subsidiaries (cont’d)
Enterprise Melbourne Pty Ltd (100% owned subsidiary of Council)
Enterprise Melbourne was established by the Council to drive economic development for the city through supporting existing business growth, as well as attracting new local and international investment.
Council has 100% voting rights which clearly demonstrate power over investee and the ability to affect the amount of the investor’s returns. Council is exposed financially to entity as it funds its operations. Controlling interest held.
2015 2014$'000 $'000
Summarised statement of comprehensive income
Total income 2 12Total expenses 369 278Surplus/(deficit) for the year (367) (266)
Other comprehensive income - -Total comprehensive result (367) (266)
Summarised balance sheetCurrent assets 59 46Non-current assets - -Total assets 59 46Current liabilities - -Non-current liabilities - -Total liabilities - -Net assets 59 46
Summarised statement of cash flowsNet cash provided/(used in) operating activities (367) (266) Net cash provided/(used in) investing activities - -Net cash provided/(used in) financing activities - -Net increase / (decrease) in cash and cash equivalents (367) (266)
160
FINANCIAL REPORT FOR THE YEAR ENDED 30 JUNE 2015
161 of 69
b) Associates
Regent Management Company (50% owned by Council)
• Council and the State Government of Victoria hold an equal 50% share in this entity. Council has 50% voting rights. Both parties collectively control the entity but neither party can direct activities without co-operation of the other. Therefore a significant interest is held but not a controlling interest.
• Regent Management Pty Ltd reported an operating profit of $408,063 for year ended 30 June 2015 and an operating loss of $393,471 for the previous year.
• The latest valuation of the Regent Management Company Pty Ltd's assets was undertaken on 29 June 2015 on the basis of fair value by a qualified valuer Beau Jarvis, Certified Practising Valuer, member of Australian Property Institute, member number 77334. Land and building values are $14.000 million as at 30 June 2015.
MAPS Group Ltd (63% owned by Council)
• MAPS Group Ltd (MAPS) has issued a total of 396,862 fully paid ordinary shares. Council holds 250,000 shares in the Company, being 63 per cent of the issued capital of the Company. However due to the company constitution the Council has 9% of voting rights (does not have the ability to direct activities of the entity without the co-operation of the other Councils). Therefore a significant interest is held but not a controlling interest.
• MAPS reported an operating profit for the year ending 30 September 2014 of $910,536 compared to a loss of $928,782 for the previous year. The Company paid a dividend for the 2014 financial year of 21.5 cents per share. Dividend payment of $53,750 was received on 12 December 2014. Net assets are $3.20 million as at 30 September 2014.
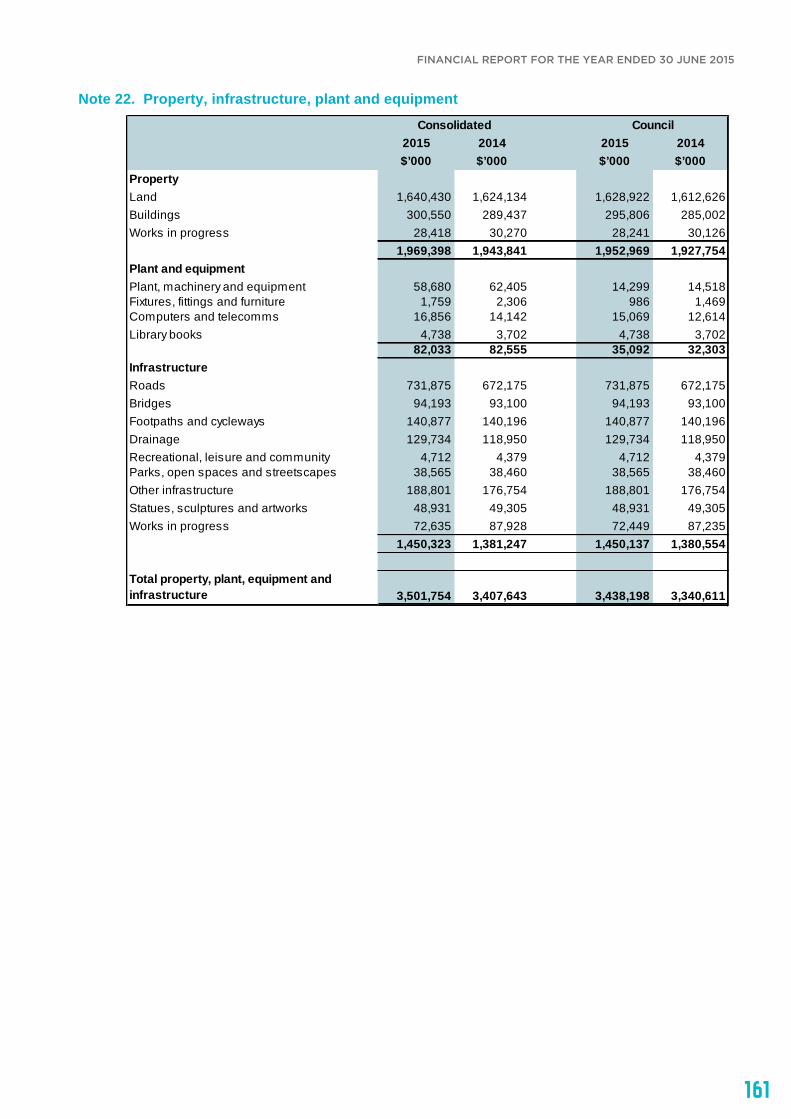
161
FINANCIAL REPORT FOR THE YEAR ENDED 30 JUNE 2015FINANCIAL REPORT FOR THE YEAR ENDED 30 JUNE 2015
162 of 69
Note 22. Property, infrastructure, plant and equipment
2015 2014 2015 2014$’000 $’000 $’000 $’000
PropertyLand 1,640,430 1,624,134 1,628,922 1,612,626Buildings 300,550 289,437 295,806 285,002Works in progress 28,418 30,270 28,241 30,126
1,969,398 1,943,841 1,952,969 1,927,754Plant and equipmentPlant, machinery and equipment 58,680 62,405 14,299 14,518Fixtures, fittings and furniture 1,759 2,306 986 1,469Computers and telecomms 16,856 14,142 15,069 12,614Library books 4,738 3,702 4,738 3,702
82,033 82,555 35,092 32,303InfrastructureRoads 731,875 672,175 731,875 672,175Bridges 94,193 93,100 94,193 93,100Footpaths and cycleways 140,877 140,196 140,877 140,196Drainage 129,734 118,950 129,734 118,950Recreational, leisure and community 4,712 4,379 4,712 4,379Parks, open spaces and streetscapes 38,565 38,460 38,565 38,460Other infrastructure 188,801 176,754 188,801 176,754Statues, sculptures and artworks 48,931 49,305 48,931 49,305Works in progress 72,635 87,928 72,449 87,235
1,450,323 1,381,247 1,450,137 1,380,554
Total property, plant, equipment and infrastructure 3,501,754 3,407,643 3,438,198 3,340,611
Consolidated Council
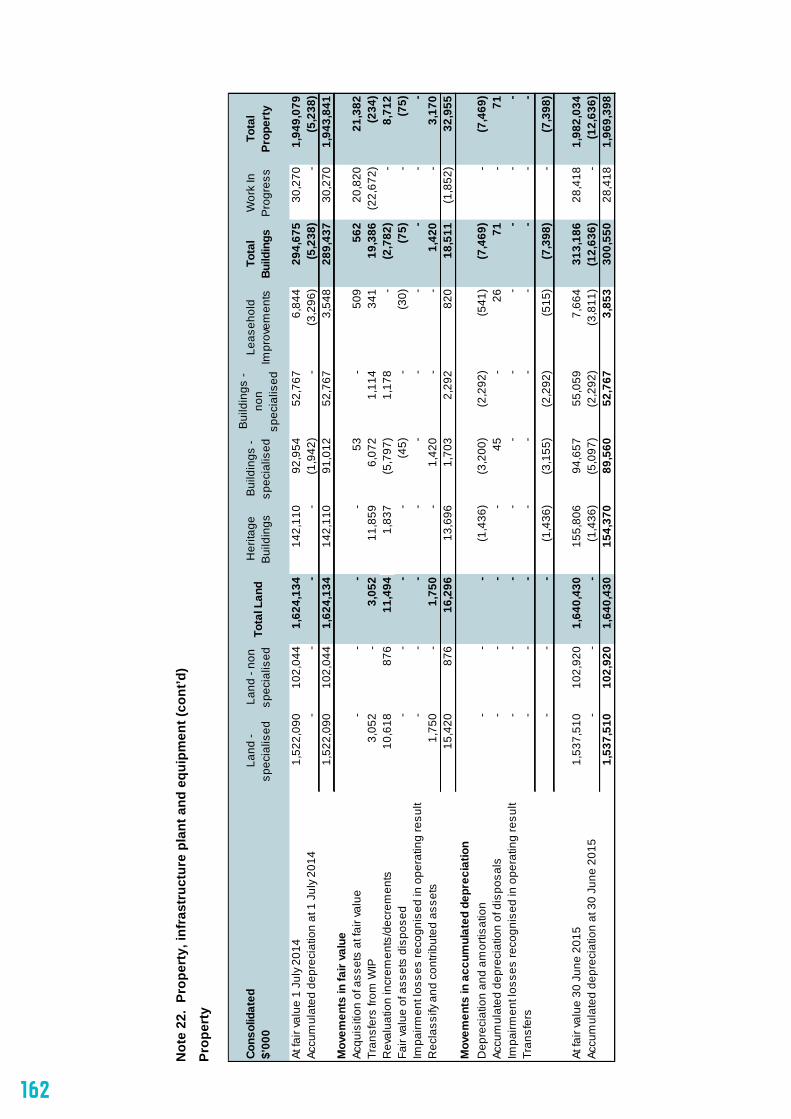
162
FIN
AN
CIA
L R
EPO
RT
FOR
TH
E YE
AR
EN
DED
30
JUN
E 20
15
163
of 6
9
Not
e 22
. Pr
oper
ty, i
nfra
stru
ctur
e pl
ant a
nd e
quip
men
t (co
nt’d
)
Prop
erty
Cons
olid
ated
$'00
0La
nd -
spec
ialis
edLa
nd -
non
spec
ialis
edTo
tal L
and
Her
itage
B
uild
ings
Bui
ldin
gs -
spec
ialis
ed
Bui
ldin
gs -
non
spec
ialis
ed
Leas
ehol
d Im
prov
emen
tsTo
tal
Build
ings
Wor
k In
P
rogr
ess
Tota
l Pr
oper
ty
At fa
ir va
lue
1 Ju
ly 20
141,
522,
090
102,
044
1,62
4,13
414
2,11
092
,954
52,7
676,
844
294,
675
30,2
701,
949,
079
Accu
mul
ated
dep
reci
atio
n at
1 J
uly
2014
--
--
(1,9
42)
-(3
,296
)(5
,238
)-
(5,2
38)
1,52
2,09
010
2,04
41,
624,
134
142,
110
91,0
1252
,767
3,54
828
9,43
730
,270
1,94
3,84
1M
ovem
ents
in fa
ir va
lue
Acqu
isiti
on o
f ass
ets
at fa
ir va
lue
--
--
53-
509
562
20,8
2021
,382
Tran
sfer
s fro
m W
IP3,
052
-3,
052
11,8
596,
072
1,11
434
119
,386
(22,
672)
(234
)R
eval
uatio
n in
crem
ents
/dec
rem
ents
10,6
1887
611
,494
1,83
7(5
,797
)1,
178
-(2
,782
)-
8,71
2Fa
ir va
lue
of a
sset
s di
spos
ed-
--
-(4
5)-
(30)
(75)
-(7
5)Im
pairm
ent l
osse
s re
cogn
ised
in o
pera
ting
resu
lt-
--
--
--
--
-R
ecla
ssify
and
con
tribu
ted
asse
ts1,
750
-1,
750
-1,
420
--
1,42
0-
3,17
015
,420
876
16,2
9613
,696
1,70
32,
292
820
18,5
11(1
,852
)32
,955
Mov
emen
ts in
acc
umul
ated
dep
reci
atio
nD
epre
ciat
ion
and
amor
tisat
ion
--
-(1
,436
)(3
,200
)(2
,292
)(5
41)
(7,4
69)
-(7
,469
)Ac
cum
ulat
ed d
epre
ciat
ion
of d
ispo
sals
--
--
45-
2671
-71
Impa
irmen
t los
ses
reco
gnis
ed in
ope
ratin
g re
sult
--
--
--
--
--
Tran
sfer
s-
--
--
--
--
--
--
(1,4
36)
(3,1
55)
(2,2
92)
(515
)(7
,398
)-
(7,3
98)
At fa
ir va
lue
30 J
une
2015
1,53
7,51
010
2,92
01,
640,
430
155,
806
94,6
5755
,059
7,66
431
3,18
628
,418
1,98
2,03
4Ac
cum
ulat
ed d
epre
ciat
ion
at 3
0 Ju
ne 2
015
--
-(1
,436
)(5
,097
)(2
,292
)(3
,811
)(1
2,63
6)-
(12,
636)
1,53
7,51
010
2,92
01,
640,
430
154,
370
89,5
6052
,767
3,85
330
0,55
028
,418
1,96
9,39
8

163
FINANCIAL REPORT FOR THE YEAR ENDED 30 JUNE 2015
FIN
AN
CIA
L R
EPO
RT
FOR
TH
E YE
AR
EN
DED
30
JUN
E 20
15
164
of 6
9
Not
e 22
. Pr
oper
ty, i
nfra
stru
ctur
e pl
ant a
nd e
quip
men
t (co
nt’d
)
Prop
erty
Coun
cil
$'00
0La
nd -
spec
ialis
edLa
nd -
non
spec
ialis
edTo
tal L
and
Her
itage
B
uild
ings
Bui
ldin
gs -
spec
ialis
ed
Bui
ldin
gs -
non
spec
ialis
ed
Leas
ehol
d Im
prov
emen
tsTo
tal
Build
ings
Wor
k In
P
rogr
ess
Tota
l Pr
oper
ty
At fa
ir va
lue
1 Ju
ly 20
141,
510,
582
102,
044
1,61
2,62
614
2,11
088
,357
52,7
672,
776
286,
010
30,1
261,
928,
762
Accu
mul
ated
dep
reci
atio
n at
1 J
uly
2014
--
--
--
(1,0
08)
(1,0
08)
-(1
,008
)1,
510,
582
102,
044
1,61
2,62
614
2,11
088
,357
52,7
671,
768
285,
002
30,1
261,
927,
754
Mov
emen
ts in
fair
valu
eAc
quis
ition
of a
sset
s at
fair
valu
e-
--
--
--
-20
,460
20,4
60Tr
ansf
ers
from
WIP
3,05
23,
052
11,8
596,
072
1,11
414
19,0
59(2
2,34
5)(2
34)
Rev
alua
tion
incr
emen
ts/d
ecre
men
ts10
,618
876
11,4
941,
837
(5,7
97)
1,17
8-
(2,7
82)
-8,
712
Fair
valu
e of
ass
ets
disp
osed
--
--
--
--
--
Impa
irmen
t los
ses
reco
gnis
ed in
ope
ratin
g re
sult
--
--
--
--
--
Rec
lass
ify a
nd c
ontri
bute
d as
sets
1,75
0-
1,75
0-
1,42
0-
-1,
420
-3,
170
15,4
2087
616
,296
13,6
961,
695
2,29
214
17,6
97(1
,885
)32
,108
Mov
emen
ts in
acc
umul
ated
dep
reci
atio
nD
epre
ciat
ion
and
amor
tisat
ion
--
-(1
,436
)(3
,002
)(2
,292
)(1
63)
(6,8
93)
-(6
,893
)Ac
cum
ulat
ed d
epre
ciat
ion
of d
ispo
sals
--
--
--
--
--
Impa
irmen
t los
ses
reco
gnis
ed in
ope
ratin
g re
sult
--
--
--
--
--
Tran
sfer
s-
--
--
--
--
--
--
(1,4
36)
(3,0
02)
(2,2
92)
(163
)(6
,893
)-
(6,8
93)
At fa
ir va
lue
30 J
une
2015
1,52
6,00
210
2,92
01,
628,
922
155,
806
90,0
5255
,059
2,79
030
3,70
728
,241
1,96
0,87
0Ac
cum
ulat
ed d
epre
ciat
ion
at 3
0 Ju
ne 2
015
--
-(1
,436
)(3
,002
)(2
,292
)(1
,171
)(7
,901
)-
(7,9
01)
1,52
6,00
210
2,92
01,
628,
922
154,
370
87,0
5052
,767
1,61
929
5,80
628
,241
1,95
2,96
9
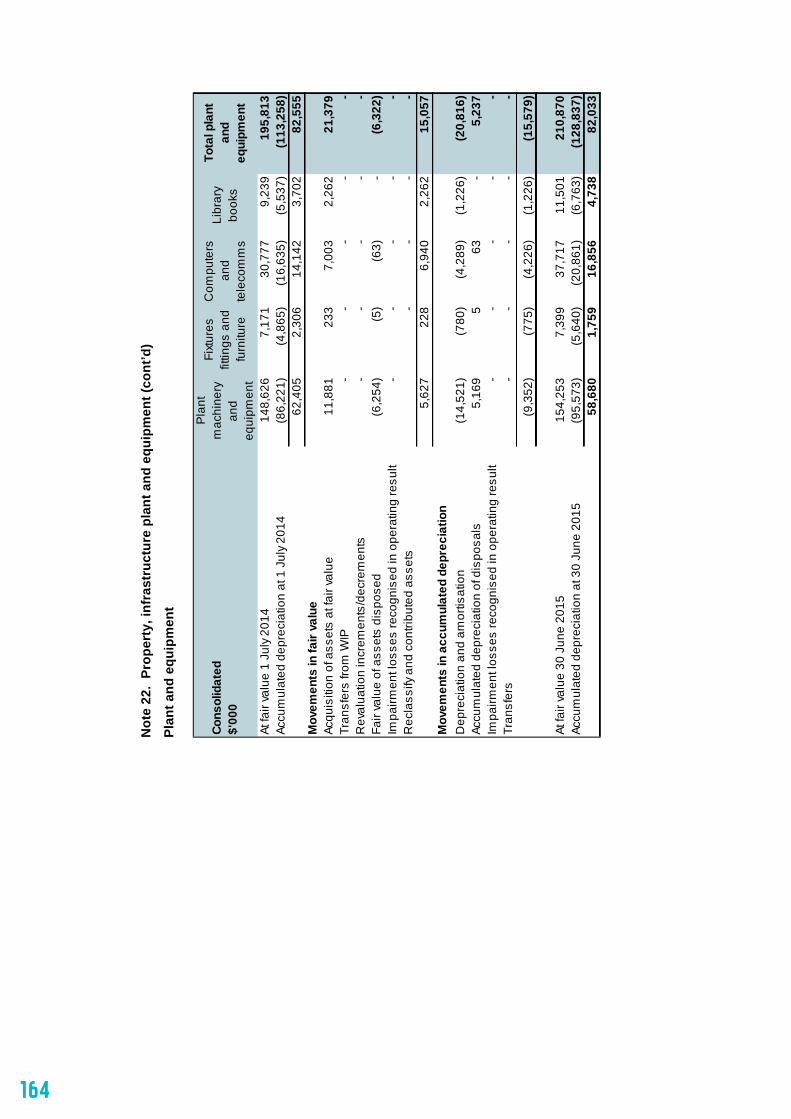
164
FIN
AN
CIA
L R
EPO
RT
FOR
TH
E YE
AR
EN
DED
30
JUN
E 20
15
165
of 6
9
Not
e 22
. Pr
oper
ty, i
nfra
stru
ctur
e pl
ant a
nd e
quip
men
t (co
nt’d
)
Plan
t and
equ
ipm
ent
Cons
olid
ated
$'00
0
Pla
nt
mac
hine
ry
and
equi
pmen
t
Fixt
ures
fit
tings
and
fu
rnitu
re
Com
pute
rs
and
tele
com
ms
Libr
ary
book
s
Tota
l pla
nt
and
equi
pmen
t
At fa
ir va
lue
1 Ju
ly 20
1414
8,62
67,
171
30,7
779,
239
195,
813
Accu
mul
ated
dep
reci
atio
n at
1 J
uly
2014
(86,
221)
(4,8
65)
(16,
635)
(5,5
37)
(113
,258
)62
,405
2,30
614
,142
3,70
282
,555
Mov
emen
ts in
fair
valu
eAc
quis
ition
of a
sset
s at
fair
valu
e11
,881
233
7,00
32,
262
21,3
79Tr
ansf
ers
from
WIP
--
--
-R
eval
uatio
n in
crem
ents
/dec
rem
ents
--
--
-Fa
ir va
lue
of a
sset
s di
spos
ed(6
,254
)(5
)(6
3)-
(6,3
22)
Impa
irmen
t los
ses
reco
gnis
ed in
ope
ratin
g re
sult
--
--
-R
ecla
ssify
and
con
tribu
ted
asse
ts-
--
-5,
627
228
6,94
02,
262
15,0
57M
ovem
ents
in a
ccum
ulat
ed d
epre
ciat
ion
Dep
reci
atio
n an
d am
ortis
atio
n(1
4,52
1)(7
80)
(4,2
89)
(1,2
26)
(20,
816)
Accu
mul
ated
dep
reci
atio
n of
dis
posa
ls5,
169
563
-5,
237
Impa
irmen
t los
ses
reco
gnis
ed in
ope
ratin
g re
sult
--
--
-Tr
ansf
ers
--
--
-(9
,352
)(7
75)
(4,2
26)
(1,2
26)
(15,
579)
At fa
ir va
lue
30 J
une
2015
154,
253
7,39
937
,717
11,5
0121
0,87
0Ac
cum
ulat
ed d
epre
ciat
ion
at 3
0 Ju
ne 2
015
(95,
573)
(5,6
40)
(20,
861)
(6,7
63)
(128
,837
)58
,680
1,75
916
,856
4,73
882
,033
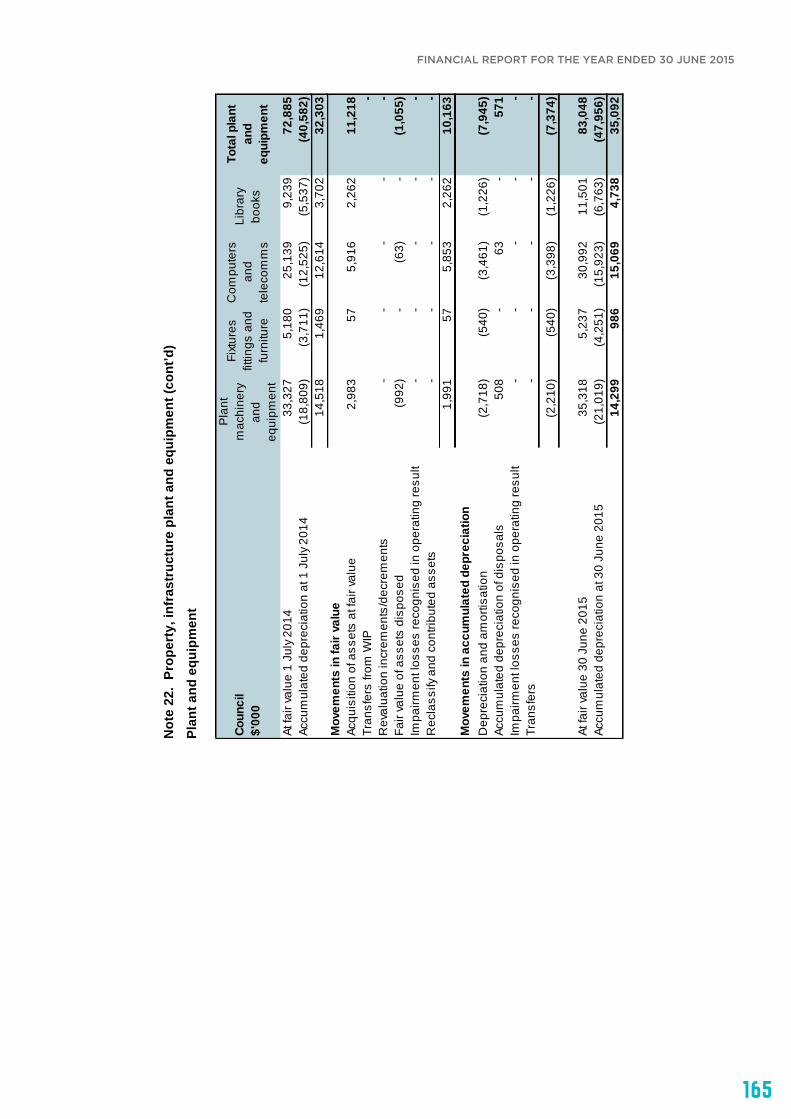
165
FINANCIAL REPORT FOR THE YEAR ENDED 30 JUNE 2015
FIN
AN
CIA
L R
EPO
RT
FOR
TH
E YE
AR
EN
DED
30
JUN
E 20
15
166
of 6
9
Not
e 22
. Pr
oper
ty, i
nfra
stru
ctur
e pl
ant a
nd e
quip
men
t (co
nt’d
)
Plan
t and
equ
ipm
ent
Coun
cil
$'00
0
Pla
nt
mac
hine
ry
and
equi
pmen
t
Fixt
ures
fit
tings
and
fu
rnitu
re
Com
pute
rs
and
tele
com
ms
Libr
ary
book
s
Tota
l pla
nt
and
equi
pmen
t
At fa
ir va
lue
1 Ju
ly 20
1433
,327
5,18
025
,139
9,23
972
,885
Accu
mul
ated
dep
reci
atio
n at
1 J
uly
2014
(18,
809)
(3,7
11)
(12,
525)
(5,5
37)
(40,
582)
14,5
181,
469
12,6
143,
702
32,3
03M
ovem
ents
in fa
ir va
lue
Acqu
isiti
on o
f ass
ets
at fa
ir va
lue
2,98
357
5,91
62,
262
11,2
18Tr
ansf
ers
from
WIP
-R
eval
uatio
n in
crem
ents
/dec
rem
ents
--
--
-Fa
ir va
lue
of a
sset
s di
spos
ed(9
92)
-(6
3)-
(1,0
55)
Impa
irmen
t los
ses
reco
gnis
ed in
ope
ratin
g re
sult
--
--
-R
ecla
ssify
and
con
tribu
ted
asse
ts-
--
--
1,99
157
5,85
32,
262
10,1
63M
ovem
ents
in a
ccum
ulat
ed d
epre
ciat
ion
Dep
reci
atio
n an
d am
ortis
atio
n(2
,718
)(5
40)
(3,4
61)
(1,2
26)
(7,9
45)
Accu
mul
ated
dep
reci
atio
n of
dis
posa
ls50
8-
63-
571
Impa
irmen
t los
ses
reco
gnis
ed in
ope
ratin
g re
sult
--
--
-Tr
ansf
ers
--
--
-(2
,210
)(5
40)
(3,3
98)
(1,2
26)
(7,3
74)
At fa
ir va
lue
30 J
une
2015
35,3
185,
237
30,9
9211
,501
83,0
48Ac
cum
ulat
ed d
epre
ciat
ion
at 3
0 Ju
ne 2
015
(21,
019)
(4,2
51)
(15,
923)
(6,7
63)
(47,
956)
14,2
9998
615
,069
4,73
835
,092

166
FIN
AN
CIA
L R
EPO
RT
FOR
TH
E YE
AR
EN
DED
30
JUN
E 20
15
167
of 6
9
Not
e 22
. Pr
oper
ty, i
nfra
stru
ctur
e pl
ant a
nd e
quip
men
t (co
nt’d
)
Infr
astr
uctu
re
Cons
olid
ated
$'00
0R
oads
Brid
ges
Foot
path
s an
d cy
clew
ays
Dra
inag
eR
ecre
atio
nal,
leis
ure
and
Com
mun
ity
Par
ks o
pen
spac
es a
nd
stre
etsc
apes
Oth
er
infra
stru
ctur
e
Sta
tues
, sc
ulpt
ures
an
d ar
twor
ks
Wor
k In
P
rogr
ess
Tota
l In
fras
truc
ture
At fa
ir va
lue
1 Ju
ly 20
1467
2,17
593
,100
140,
196
118,
950
4,87
638
,460
176,
754
55,8
1587
,928
1,38
8,25
4Ac
cum
ulat
ed d
epre
ciat
ion
at 1
Jul
y 20
14-
--
-(4
97)
--
(6,5
10)
-(7
,007
)67
2,17
593
,100
140,
196
118,
950
4,37
938
,460
176,
754
49,3
0587
,928
1,38
1,24
7M
ovem
ents
in fa
ir va
lue
Acqu
isiti
on o
f ass
ets
at fa
ir va
lue
--
--
--
--
45,5
0845
,508
Tran
sfer
s fro
m W
IP15
,159
318
13,1
3514
,014
638
1,61
415
,615
308
(60,
801)
-R
eval
uatio
n in
crem
ents
/dec
rem
ents
55,7
182,
142
(9,3
72)
(2,2
26)
39(1
,509
)8,
446
--
53,2
38Fa
ir va
lue
of a
sset
s di
spos
ed(1
2)-
--
--
--
-(1
2)Im
pairm
ent l
osse
s re
cogn
ised
in o
pera
ting
resu
lt-
--
--
--
--
-R
ecla
ssify
and
con
tribu
ted
asse
ts4,
588
-4,
519
705
--
--
-9,
812
75,4
532,
460
8,28
212
,493
677
105
24,0
6130
8(1
5,29
3)10
8,54
6M
ovem
ents
in a
ccum
ulat
ed d
epre
ciat
ion
Dep
reci
atio
n an
d am
ortis
atio
n(1
5,75
3)(1
,367
)(7
,601
)(1
,709
)(3
44)
-(1
2,01
4)(6
82)
-(3
9,47
0)Ac
cum
ulat
ed d
epre
ciat
ion
of d
ispo
sals
--
--
--
--
--
Impa
irmen
t los
ses
reco
gnis
ed in
ope
ratin
g re
sult
--
--
--
--
--
Tran
sfer
s-
--
--
--
--
-(1
5,75
3)(1
,367
)(7
,601
)(1
,709
)(3
44)
-(1
2,01
4)(6
82)
-(3
9,47
0)
At fa
ir va
lue
30 J
une
2015
747,
628
95,5
6014
8,47
813
1,44
35,
553
38,5
6520
0,81
556
,123
72,6
351,
496,
800
Accu
mul
ated
dep
reci
atio
n at
30
June
201
5(1
5,75
3)(1
,367
)(7
,601
)(1
,709
)(8
41)
-(1
2,01
4)(7
,192
)-
(46,
477)
731,
875
94,1
9314
0,87
712
9,73
44,
712
38,5
6518
8,80
148
,931
72,6
351,
450,
323
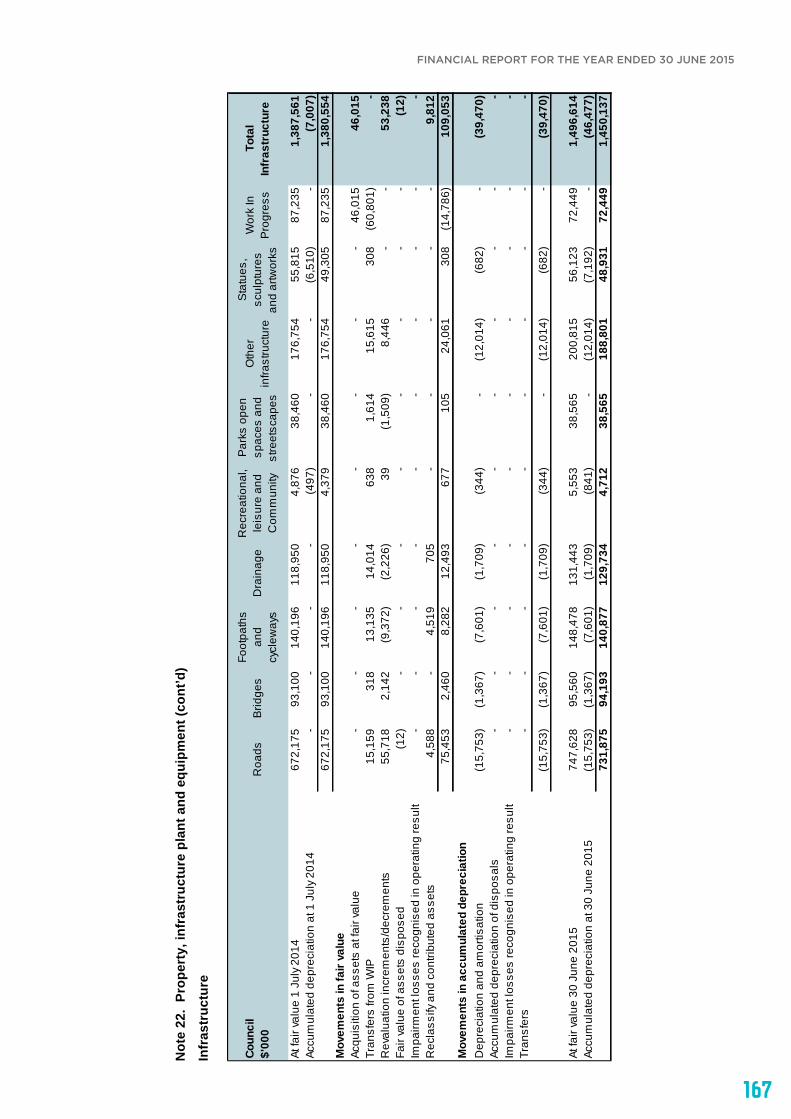
167
FINANCIAL REPORT FOR THE YEAR ENDED 30 JUNE 2015
FIN
AN
CIA
L R
EPO
RT
FOR
TH
E YE
AR
EN
DED
30
JUN
E 20
15
168
of 6
9
Not
e 22
. Pr
oper
ty, i
nfra
stru
ctur
e pl
ant a
nd e
quip
men
t (co
nt’d
)
Infr
astr
uctu
re
Coun
cil
$'00
0R
oads
Brid
ges
Foot
path
s an
d cy
clew
ays
Dra
inag
eR
ecre
atio
nal,
leis
ure
and
Com
mun
ity
Par
ks o
pen
spac
es a
nd
stre
etsc
apes
Oth
er
infra
stru
ctur
e
Sta
tues
, sc
ulpt
ures
an
d ar
twor
ks
Wor
k In
P
rogr
ess
Tota
l In
fras
truc
ture
At fa
ir va
lue
1 Ju
ly 20
1467
2,17
593
,100
140,
196
118,
950
4,87
638
,460
176,
754
55,8
1587
,235
1,38
7,56
1Ac
cum
ulat
ed d
epre
ciat
ion
at 1
Jul
y 20
14-
--
-(4
97)
--
(6,5
10)
-(7
,007
)67
2,17
593
,100
140,
196
118,
950
4,37
938
,460
176,
754
49,3
0587
,235
1,38
0,55
4M
ovem
ents
in fa
ir va
lue
Acqu
isiti
on o
f ass
ets
at fa
ir va
lue
--
--
--
--
46,0
1546
,015
Tran
sfer
s fro
m W
IP15
,159
318
13,1
3514
,014
638
1,61
415
,615
308
(60,
801)
-R
eval
uatio
n in
crem
ents
/dec
rem
ents
55,7
182,
142
(9,3
72)
(2,2
26)
39(1
,509
)8,
446
--
53,2
38Fa
ir va
lue
of a
sset
s di
spos
ed(1
2)-
--
--
--
-(1
2)Im
pairm
ent l
osse
s re
cogn
ised
in o
pera
ting
resu
lt-
--
--
--
--
-R
ecla
ssify
and
con
tribu
ted
asse
ts4,
588
-4,
519
705
--
--
-9,
812
75,4
532,
460
8,28
212
,493
677
105
24,0
6130
8(1
4,78
6)10
9,05
3M
ovem
ents
in a
ccum
ulat
ed d
epre
ciat
ion
Dep
reci
atio
n an
d am
ortis
atio
n(1
5,75
3)(1
,367
)(7
,601
)(1
,709
)(3
44)
-(1
2,01
4)(6
82)
-(3
9,47
0)Ac
cum
ulat
ed d
epre
ciat
ion
of d
ispo
sals
--
--
--
--
--
Impa
irmen
t los
ses
reco
gnis
ed in
ope
ratin
g re
sult
--
--
--
--
--
Tran
sfer
s-
--
--
--
--
-(1
5,75
3)(1
,367
)(7
,601
)(1
,709
)(3
44)
-(1
2,01
4)(6
82)
-(3
9,47
0)
At fa
ir va
lue
30 J
une
2015
747,
628
95,5
6014
8,47
813
1,44
35,
553
38,5
6520
0,81
556
,123
72,4
491,
496,
614
Accu
mul
ated
dep
reci
atio
n at
30
June
201
5(1
5,75
3)(1
,367
)(7
,601
)(1
,709
)(8
41)
-(1
2,01
4)(7
,192
)-
(46,
477)
731,
875
94,1
9314
0,87
712
9,73
44,
712
38,5
6518
8,80
148
,931
72,4
491,
450,
137
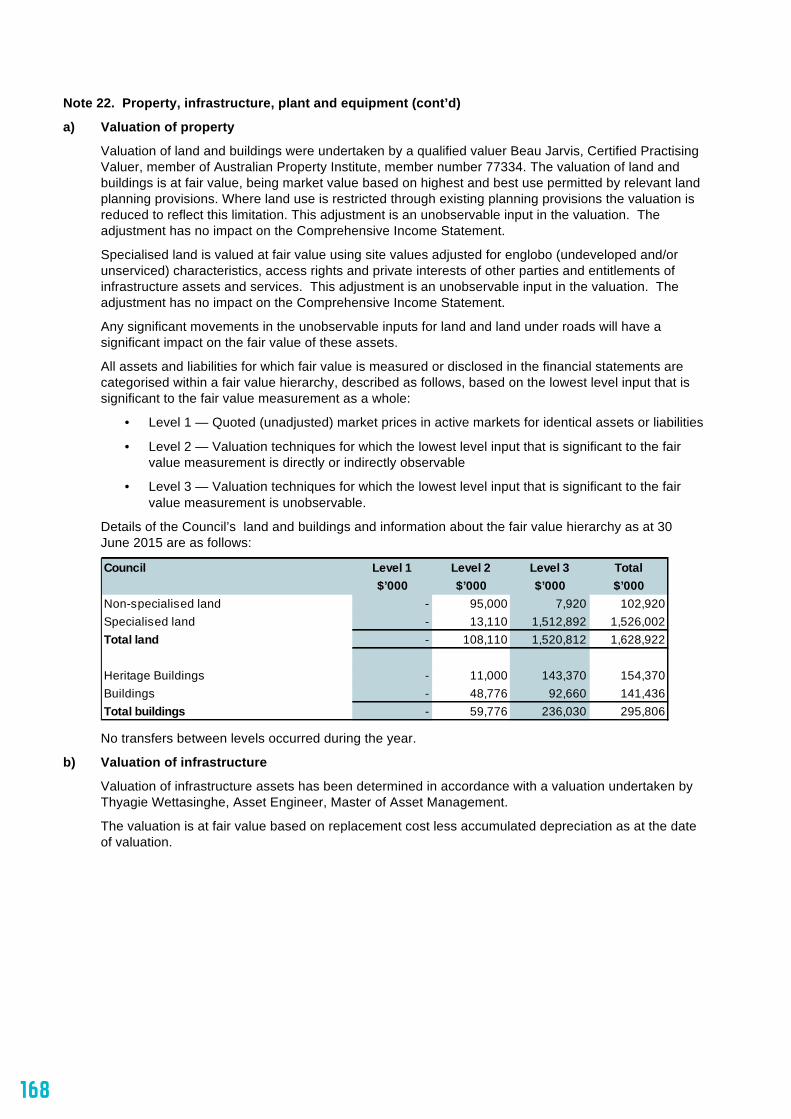
168
FINANCIAL REPORT FOR THE YEAR ENDED 30 JUNE 2015
169 of 69
Note 22. Property, infrastructure, plant and equipment (cont’d)
a) Valuation of property
Valuation of land and buildings were undertaken by a qualified valuer Beau Jarvis, Certified Practising Valuer, member of Australian Property Institute, member number 77334. The valuation of land and buildings is at fair value, being market value based on highest and best use permitted by relevant land planning provisions. Where land use is restricted through existing planning provisions the valuation is reduced to reflect this limitation. This adjustment is an unobservable input in the valuation. The adjustment has no impact on the Comprehensive Income Statement.
Specialised land is valued at fair value using site values adjusted for englobo (undeveloped and/or unserviced) characteristics, access rights and private interests of other parties and entitlements of infrastructure assets and services. This adjustment is an unobservable input in the valuation. The adjustment has no impact on the Comprehensive Income Statement.
Any significant movements in the unobservable inputs for land and land under roads will have a significant impact on the fair value of these assets.
All assets and liabilities for which fair value is measured or disclosed in the financial statements are categorised within a fair value hierarchy, described as follows, based on the lowest level input that is significant to the fair value measurement as a whole:
• Level 1 — Quoted (unadjusted) market prices in active markets for identical assets or liabilities
• Level 2 — Valuation techniques for which the lowest level input that is significant to the fair value measurement is directly or indirectly observable
• Level 3 — Valuation techniques for which the lowest level input that is significant to the fair value measurement is unobservable.
Details of the Council’s land and buildings and information about the fair value hierarchy as at 30 June 2015 are as follows:
No transfers between levels occurred during the year.
b) Valuation of infrastructure
Valuation of infrastructure assets has been determined in accordance with a valuation undertaken by Thyagie Wettasinghe, Asset Engineer, Master of Asset Management.
The valuation is at fair value based on replacement cost less accumulated depreciation as at the date of valuation.
Council Level 1 Level 2 Level 3 Total$’000 $’000 $’000 $’000
Non-specialised land - 95,000 7,920 102,920Specialised land - 13,110 1,512,892 1,526,002Total land - 108,110 1,520,812 1,628,922
Heritage Buildings - 11,000 143,370 154,370Buildings - 48,776 92,660 141,436Total buildings - 59,776 236,030 295,806
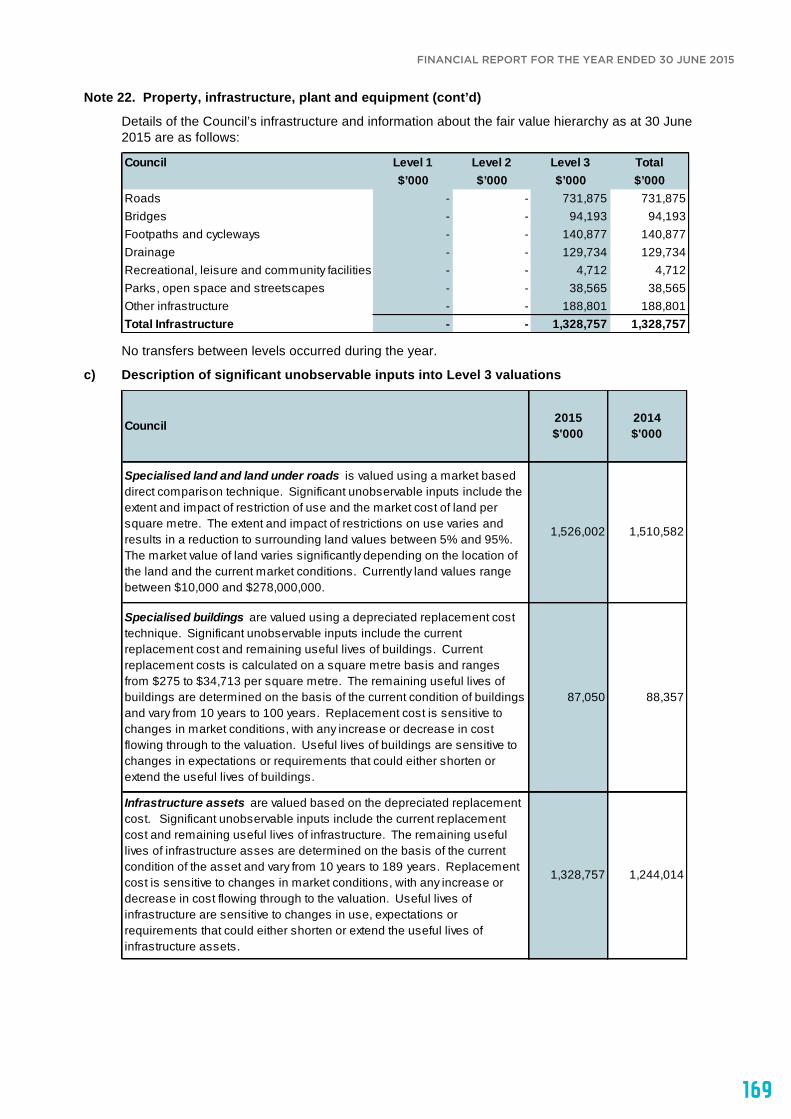
169
FINANCIAL REPORT FOR THE YEAR ENDED 30 JUNE 2015FINANCIAL REPORT FOR THE YEAR ENDED 30 JUNE 2015
170 of 69
Note 22. Property, infrastructure, plant and equipment (cont’d)
Details of the Council’s infrastructure and information about the fair value hierarchy as at 30 June 2015 are as follows:
No transfers between levels occurred during the year.
c) Description of significant unobservable inputs into Level 3 valuations
Council Level 1 Level 2 Level 3 Total$’000 $’000 $’000 $’000
Roads - - 731,875 731,875Bridges - - 94,193 94,193Footpaths and cycleways - - 140,877 140,877Drainage - - 129,734 129,734Recreational, leisure and community facilities - - 4,712 4,712Parks, open space and streetscapes - - 38,565 38,565Other infrastructure - - 188,801 188,801Total Infrastructure - - 1,328,757 1,328,757
Council 2015$'000
2014$'000
Specialised land and land under roads is valued using a market based direct comparison technique. Significant unobservable inputs include the extent and impact of restriction of use and the market cost of land per square metre. The extent and impact of restrictions on use varies and results in a reduction to surrounding land values between 5% and 95%. The market value of land varies significantly depending on the location of the land and the current market conditions. Currently land values range between $10,000 and $278,000,000.
1,526,002 1,510,582
Specialised buildings are valued using a depreciated replacement cost technique. Significant unobservable inputs include the current replacement cost and remaining useful lives of buildings. Current replacement costs is calculated on a square metre basis and ranges from $275 to $34,713 per square metre. The remaining useful lives of buildings are determined on the basis of the current condition of buildings and vary from 10 years to 100 years. Replacement cost is sensitive to changes in market conditions, with any increase or decrease in cost flowing through to the valuation. Useful lives of buildings are sensitive to changes in expectations or requirements that could either shorten or extend the useful lives of buildings.
87,050 88,357
Infrastructure assets are valued based on the depreciated replacement cost. Significant unobservable inputs include the current replacement cost and remaining useful lives of infrastructure. The remaining useful lives of infrastructure asses are determined on the basis of the current condition of the asset and vary from 10 years to 189 years. Replacement cost is sensitive to changes in market conditions, with any increase or decrease in cost flowing through to the valuation. Useful lives of infrastructure are sensitive to changes in use, expectations or requirements that could either shorten or extend the useful lives of infrastructure assets.
1,328,757 1,244,014
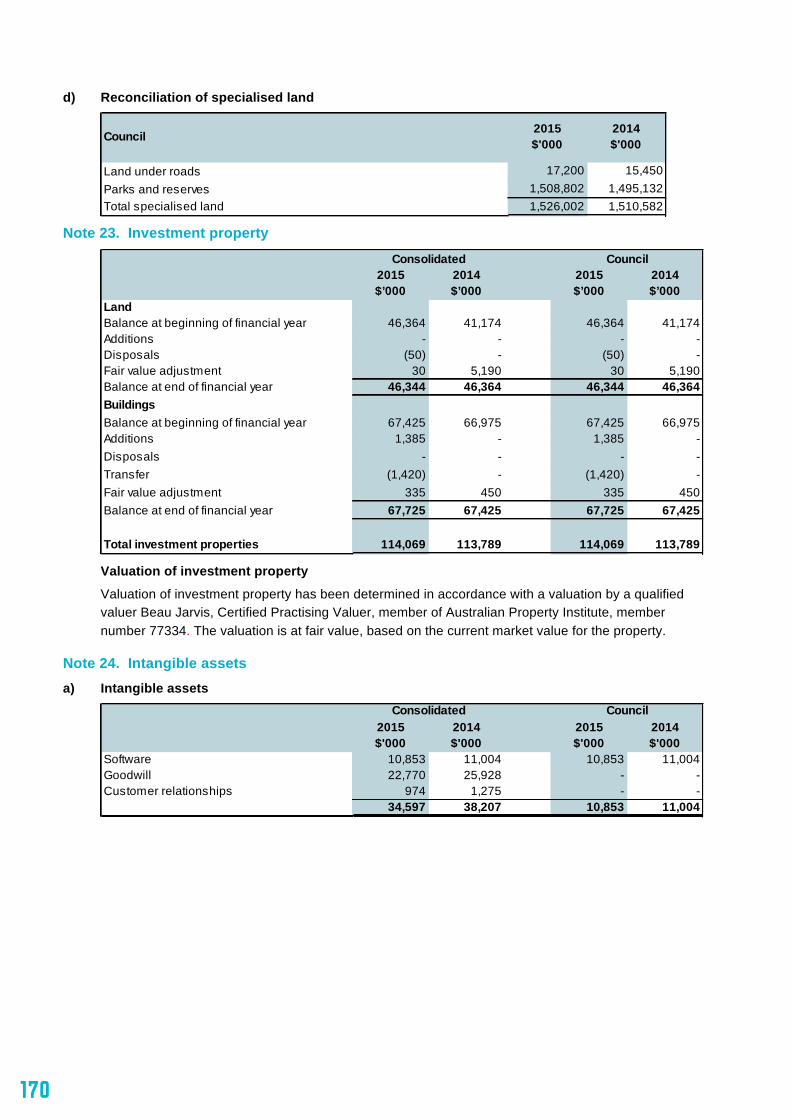
170
FINANCIAL REPORT FOR THE YEAR ENDED 30 JUNE 2015
171 of 69
d) Reconciliation of specialised land
Note 23. Investment property
Valuation of investment property
Valuation of investment property has been determined in accordance with a valuation by a qualified valuer Beau Jarvis, Certified Practising Valuer, member of Australian Property Institute, member number 77334. The valuation is at fair value, based on the current market value for the property.
Note 24. Intangible assets a) Intangible assets
Council 2015$'000
2014$'000
Land under roads 17,200 15,450Parks and reserves 1,508,802 1,495,132Total specialised land 1,526,002 1,510,582
2015 2014 2015 2014$’000 $’000 $’000 $’000
LandBalance at beginning of financial year 46,364 41,174 46,364 41,174Additions - - - -Disposals (50) - (50) -Fair value adjustment 30 5,190 30 5,190Balance at end of financial year 46,344 46,364 46,344 46,364BuildingsBalance at beginning of financial year 67,425 66,975 67,425 66,975Additions 1,385 - 1,385 -Disposals - - - -Transfer (1,420) - (1,420) -Fair value adjustment 335 450 335 450Balance at end of financial year 67,725 67,425 67,725 67,425
Total investment properties 114,069 113,789 114,069 113,789
Consolidated Council
2015 2014 2015 2014$'000 $'000 $'000 $'000
Software 10,853 11,004 10,853 11,004Goodwill 22,770 25,928 - -Customer relationships 974 1,275 - -
34,597 38,207 10,853 11,004
Consolidated Council
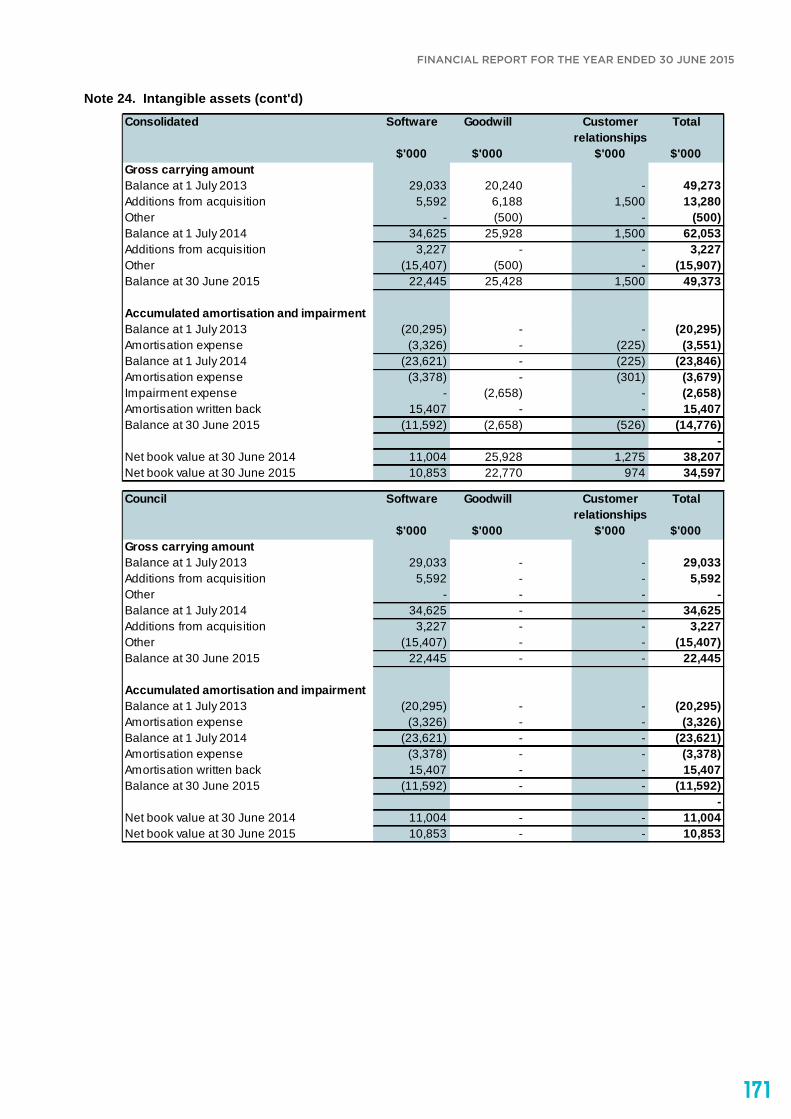
171
FINANCIAL REPORT FOR THE YEAR ENDED 30 JUNE 2015FINANCIAL REPORT FOR THE YEAR ENDED 30 JUNE 2015
172 of 69
Note 24. Intangible assets (cont'd)
Consolidated Software Goodwill Customer Totalrelationships
$'000 $'000 $'000 $'000Gross carrying amountBalance at 1 July 2013 29,033 20,240 - 49,273Additions from acquisition 5,592 6,188 1,500 13,280Other - (500) - (500)Balance at 1 July 2014 34,625 25,928 1,500 62,053Additions from acquisition 3,227 - - 3,227Other (15,407) (500) - (15,907)Balance at 30 June 2015 22,445 25,428 1,500 49,373
Accumulated amortisation and impairmentBalance at 1 July 2013 (20,295) - - (20,295)Amortisation expense (3,326) - (225) (3,551)Balance at 1 July 2014 (23,621) - (225) (23,846)Amortisation expense (3,378) - (301) (3,679)Impairment expense - (2,658) - (2,658)Amortisation written back 15,407 - - 15,407Balance at 30 June 2015 (11,592) (2,658) (526) (14,776)
-Net book value at 30 June 2014 11,004 25,928 1,275 38,207Net book value at 30 June 2015 10,853 22,770 974 34,597
Council Software Goodwill Customer Totalrelationships
$'000 $'000 $'000 $'000Gross carrying amountBalance at 1 July 2013 29,033 - - 29,033Additions from acquisition 5,592 - - 5,592Other - - - -Balance at 1 July 2014 34,625 - - 34,625Additions from acquisition 3,227 - - 3,227Other (15,407) - - (15,407)Balance at 30 June 2015 22,445 - - 22,445
Accumulated amortisation and impairmentBalance at 1 July 2013 (20,295) - - (20,295)Amortisation expense (3,326) - - (3,326)Balance at 1 July 2014 (23,621) - - (23,621)Amortisation expense (3,378) - - (3,378)Amortisation written back 15,407 - - 15,407Balance at 30 June 2015 (11,592) - - (11,592)
-Net book value at 30 June 2014 11,004 - - 11,004Net book value at 30 June 2015 10,853 - - 10,853

172
FINANCIAL REPORT FOR THE YEAR ENDED 30 JUNE 2015
173 of 69
b) Impairment testing for cash generating units containing goodwill
Goodwill is related with Council’s subsidiary Citywide Service Solutions Pty Ltd. Goodwill has been reviewed for impairment for the year ending 30 June 2015.
For the purposes of impairment testing, goodwill is allocated to the consolidated entity's operating divisions. The aggregate carrying amounts allocated to each Cash Generating Unit (CGU) are as follows:
The recoverable amount of each CGU has been determined based on its value in use, determined by discounting the future cash flows to be generated from the continuing use of the CGU. The recoverable amount of each unit was determined to be in excess of the carrying value for each CGU, and therefore no impairments/adjustments have been recognised other than detailed below.
Deferred purchase consideration adjustment - goodwill in the current year and prior year
In the current year, the goodwill in AWD Earthmoving has been adjusted by $0.500 million as the earnings before income tax target for the current financial year was not met and the portion of the contingent consideration has not been paid as was structured in the purchase of the business.
Impairment losses recognised in the current year
In the current year, the marketplace where the Infrastructure Services CGU operates has continued to deteriorate. This has led to the recognition of an impairment loss of $2.658 million which has been recognised in the Statement of Profit or Loss and Other Comprehensive Income. Other areas of Infrastructure Services operations continue to perform.
c) Key assumptions used in the discounted cash flow projections
The key assumptions used in the calculation of recoverable amounts are discount rates and earnings before income tax, depreciation and amortisation growth (EBITDA). These assumptions are as follows:
The discount rate used is a post-tax measure based on the Citywide's weighted average cost of capital. Previously the discount rate used was based on the risk-free rate for 10-year bonds issued by the Australian government. Impairment testing in the prior year was completed using a discount rate of 10.0%.
Each CGU has five years of cash flows included in its discounted cash flow models. The long-term compound annual growth rate in EBITDA is estimated by management using past experience and expectations for the future.
Budgeted EBITDA growth is expressed as the compound annual growth rates in the initial five years of the plans used for impairment testing and has been based on past experience and expectations for the future.
d) Sensitivity to change in assumptions
Citywide has modelled a 10% reduction in base EBITDA in each CGU and a 1% increase in the discount rate. In each case, the value in use would not be lower than the carrying amount and therefore no impairment charge would arise.
2015$'000
2014$'000
Arboriculture VIC 194 194Horticulture VIC 5,224 5,224Street Cleaning VIC 3,296 3,296Open Space NSW 7,868 7868Infrastructure Services - 3158Open Space QLD 6,188 6188
22,770 25,928
2015 2014
Discount Rate 9.30% 3.54%EBITDA Growth Rate 1.00% 2.50%
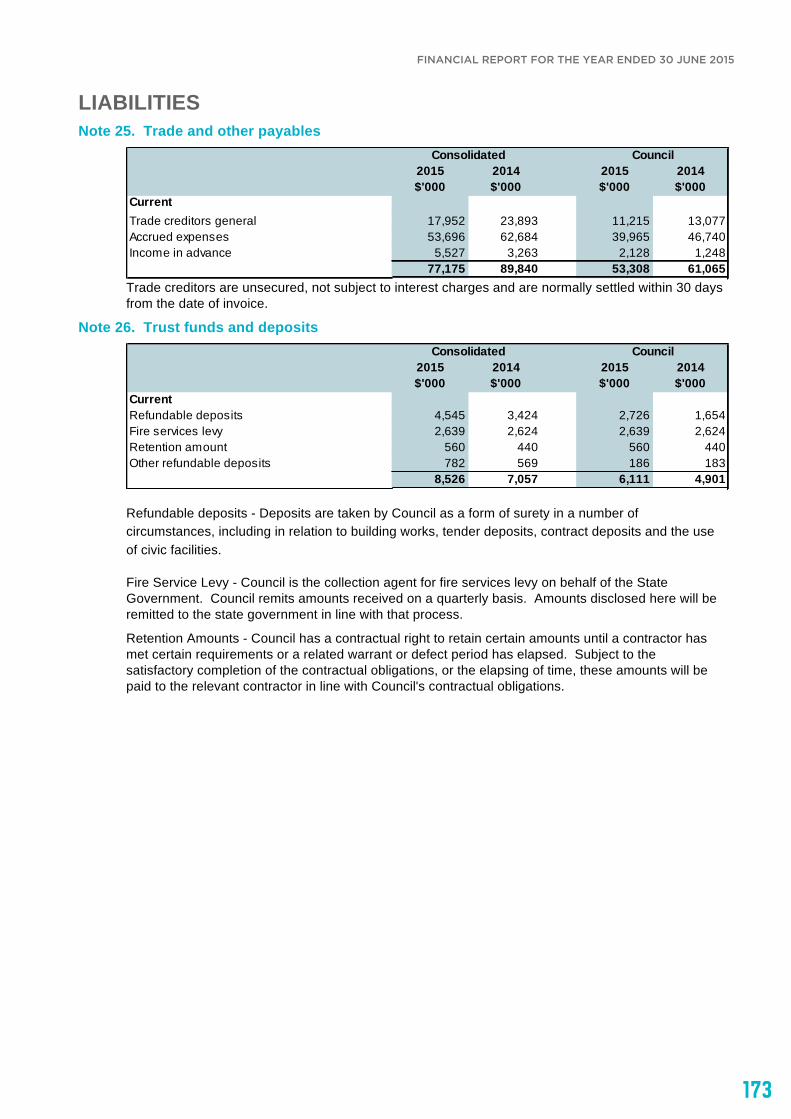
173
FINANCIAL REPORT FOR THE YEAR ENDED 30 JUNE 2015FINANCIAL REPORT FOR THE YEAR ENDED 30 JUNE 2015
174 of 69
LIABILITIES Note 25. Trade and other payables
Trade creditors are unsecured, not subject to interest charges and are normally settled within 30 days from the date of invoice.
Note 26. Trust funds and deposits
Refundable deposits - Deposits are taken by Council as a form of surety in a number of circumstances, including in relation to building works, tender deposits, contract deposits and the use of civic facilities.
Fire Service Levy - Council is the collection agent for fire services levy on behalf of the State Government. Council remits amounts received on a quarterly basis. Amounts disclosed here will be remitted to the state government in line with that process.
Retention Amounts - Council has a contractual right to retain certain amounts until a contractor has met certain requirements or a related warrant or defect period has elapsed. Subject to the satisfactory completion of the contractual obligations, or the elapsing of time, these amounts will be paid to the relevant contractor in line with Council's contractual obligations.
2015 2014 2015 2014$'000 $'000 $'000 $'000
CurrentTrade creditors general 17,952 23,893 11,215 13,077Accrued expenses 53,696 62,684 39,965 46,740Income in advance 5,527 3,263 2,128 1,248
77,175 89,840 53,308 61,065
Consolidated Council
2015 2014 2015 2014$'000 $'000 $'000 $'000
CurrentRefundable deposits 4,545 3,424 2,726 1,654Fire services levy 2,639 2,624 2,639 2,624Retention amount 560 440 560 440Other refundable deposits 782 569 186 183
8,526 7,057 6,111 4,901
Consolidated Council
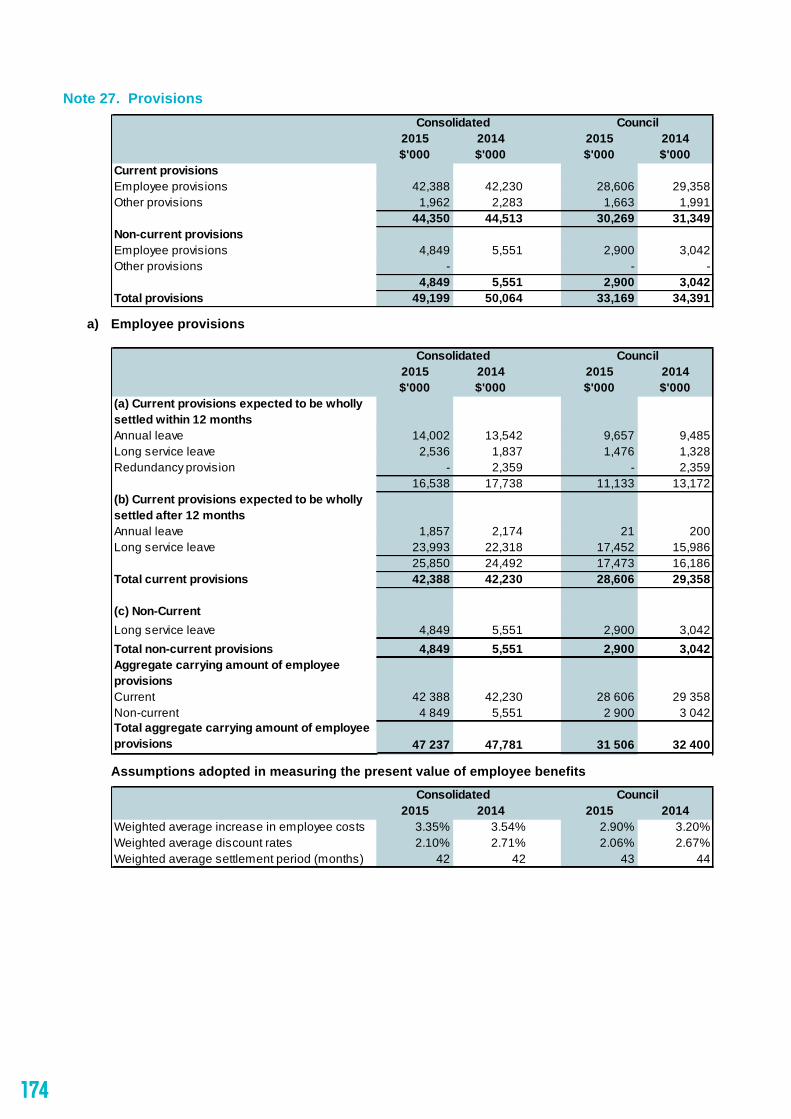
174
FINANCIAL REPORT FOR THE YEAR ENDED 30 JUNE 2015
175 of 69
Note 27. Provisions
a) Employee provisions
Assumptions adopted in measuring the present value of employee benefits
2015 2014 2015 2014$'000 $'000 $'000 $'000
Current provisionsEmployee provisions 42,388 42,230 28,606 29,358Other provisions 1,962 2,283 1,663 1,991
44,350 44,513 30,269 31,349Non-current provisionsEmployee provisions 4,849 5,551 2,900 3,042Other provisions - - -
4,849 5,551 2,900 3,042Total provisions 49,199 50,064 33,169 34,391
Consolidated Council
2015 2014 2015 2014$'000 $'000 $'000 $'000
(a) Current provisions expected to be wholly settled within 12 monthsAnnual leave 14,002 13,542 9,657 9,485Long service leave 2,536 1,837 1,476 1,328Redundancy provision - 2,359 - 2,359
16,538 17,738 11,133 13,172(b) Current provisions expected to be wholly settled after 12 monthsAnnual leave 1,857 2,174 21 200Long service leave 23,993 22,318 17,452 15,986
25,850 24,492 17,473 16,186Total current provisions 42,388 42,230 28,606 29,358
(c) Non-CurrentLong service leave 4,849 5,551 2,900 3,042Total non-current provisions 4,849 5,551 2,900 3,042Aggregate carrying amount of employee provisionsCurrent 42 388 42,230 28 606 29 358Non-current 4 849 5,551 2 900 3 042Total aggregate carrying amount of employee provisions 47 237 47,781 31 506 32 400
Consolidated Council
2015 2014 2015 2014Weighted average increase in employee costs 3.35% 3.54% 2.90% 3.20%Weighted average discount rates 2.10% 2.71% 2.06% 2.67%Weighted average settlement period (months) 42 42 43 44
Consolidated Council
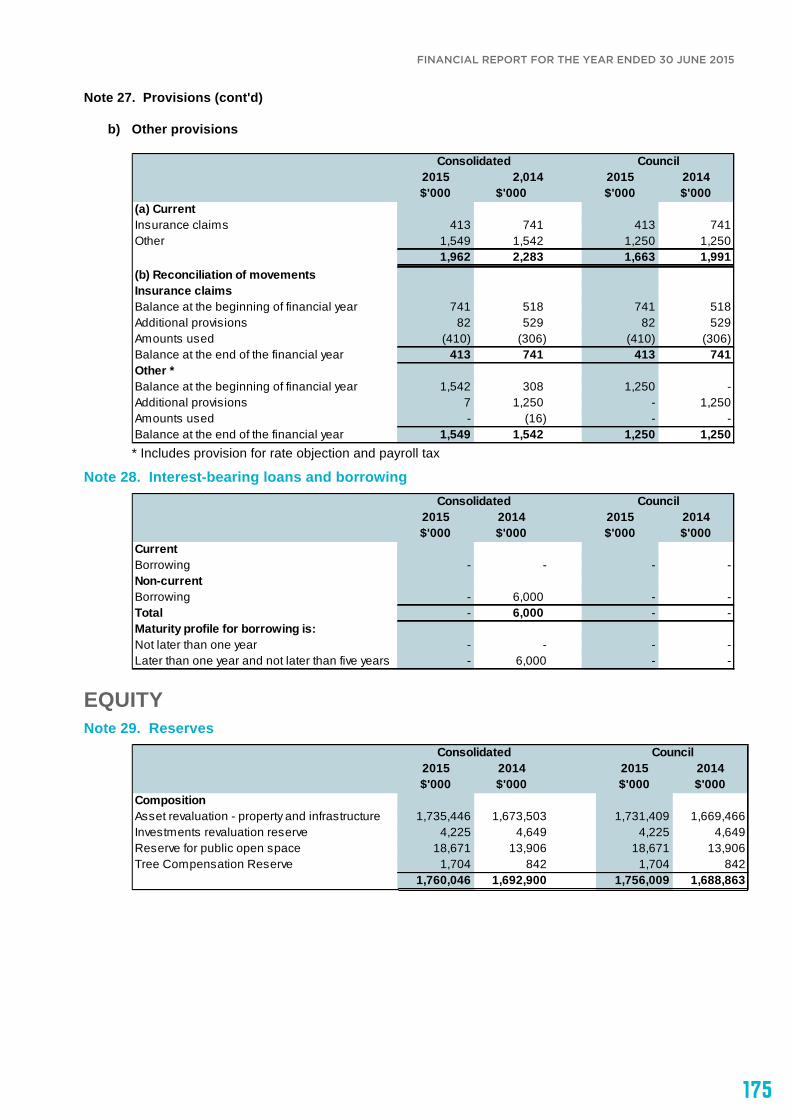
175
FINANCIAL REPORT FOR THE YEAR ENDED 30 JUNE 2015FINANCIAL REPORT FOR THE YEAR ENDED 30 JUNE 2015
176 of 69
Note 27. Provisions (cont'd)
b) Other provisions
* Includes provision for rate objection and payroll tax
Note 28. Interest-bearing loans and borrowing
EQUITY Note 29. Reserves
2015 2,014 2015 2014$'000 $'000 $'000 $'000
(a) CurrentInsurance claims 413 741 413 741Other 1,549 1,542 1,250 1,250
1,962 2,283 1,663 1,991(b) Reconciliation of movementsInsurance claimsBalance at the beginning of financial year 741 518 741 518Additional provisions 82 529 82 529Amounts used (410) (306) (410) (306)Balance at the end of the financial year 413 741 413 741Other *Balance at the beginning of financial year 1,542 308 1,250 -Additional provisions 7 1,250 - 1,250Amounts used - (16) - -Balance at the end of the financial year 1,549 1,542 1,250 1,250
CouncilConsolidated
2015 2014 2015 2014$'000 $'000 $'000 $'000
CurrentBorrowing - - - -Non-current Borrowing - 6,000 - -Total - 6,000 - -Maturity profile for borrowing is:Not later than one year - - - -Later than one year and not later than five years - 6,000 - -
Consolidated Council
2015 2014 2015 2014$'000 $'000 $'000 $'000
CompositionAsset revaluation - property and infrastructure 1,735,446 1,673,503 1,731,409 1,669,466Investments revaluation reserve 4,225 4,649 4,225 4,649Reserve for public open space 18,671 13,906 18,671 13,906Tree Compensation Reserve 1,704 842 1,704 842
1,760,046 1,692,900 1,756,009 1,688,863
Consolidated Council
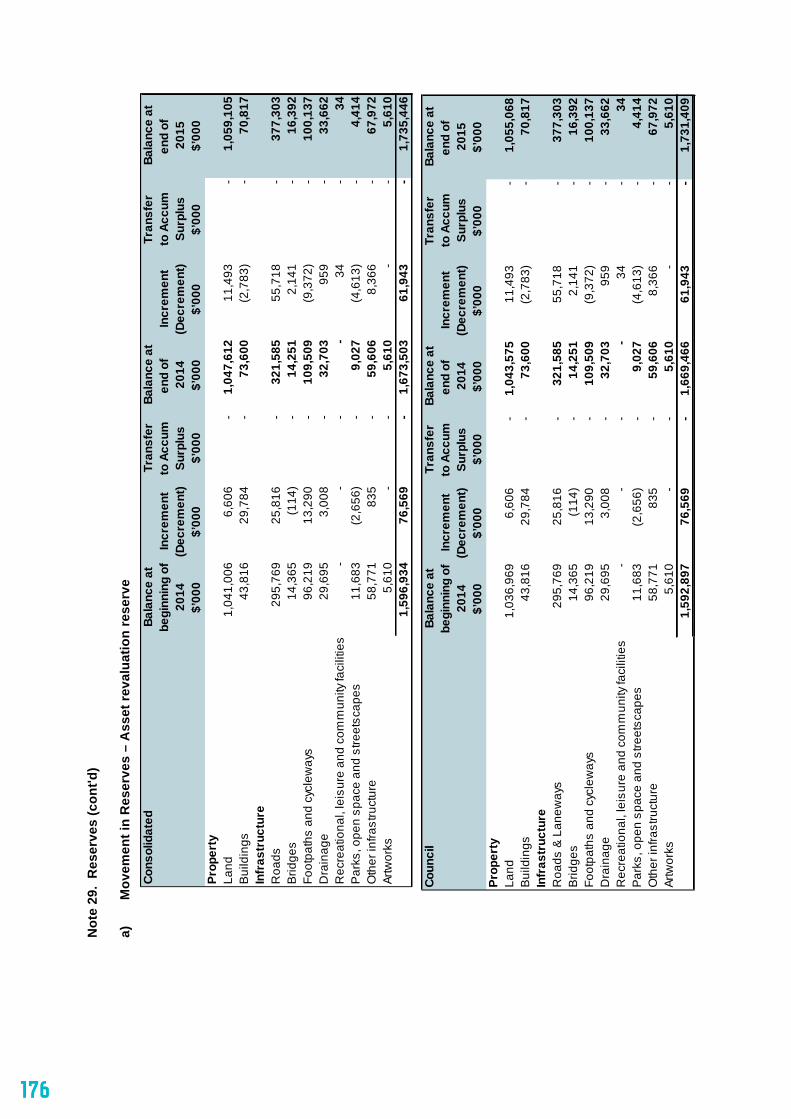
176
FIN
AN
CIA
L R
EPO
RT
FOR
TH
E YE
AR
EN
DED
30
JUN
E 20
15
183
of 5
8
Not
e 29
. R
eser
ves
(con
t'd)
a)
Mov
emen
t in
Res
erve
s –
Ass
et re
valu
atio
n re
serv
e
Bala
nce
atTr
ansf
erBa
lanc
e at
Tran
sfer
Bala
nce
atbe
ginn
ing
ofIn
crem
ent
to A
ccum
end
of
Incr
emen
tto
Acc
umen
d of
20
14(D
ecre
men
t)Su
rplu
s20
14(D
ecre
men
t)Su
rplu
s20
15$’
000
$’00
0$’
000
$’00
0$’
000
$’00
0$’
000
Prop
erty
Land
1,
041,
006
6,60
6-
1,04
7,61
211
,493
-1,
059,
105
Bui
ldin
gs43
,816
29,7
84-
73,6
00(2
,783
)-
70,8
17In
fras
truc
ture
Roa
ds
295,
769
25,8
16-
321,
585
55,7
18-
377,
303
Brid
ges
14,3
65(1
14)
-14
,251
2,14
1-
16,3
92Fo
otpa
ths
and
cycl
eway
s96
,219
13,2
90-
109,
509
(9,3
72)
-10
0,13
7D
rain
age
29,6
953,
008
-32
,703
959
-33
,662
Rec
reat
iona
l, le
isur
e an
d co
mm
unity
faci
litie
s-
--
-34
-34
Par
ks, o
pen
spac
e an
d st
reet
scap
es11
,683
(2,6
56)
-9,
027
(4,6
13)
-4,
414
Oth
er in
frast
ruct
ure
58,7
7183
5-
59,6
068,
366
-67
,972
Artw
orks
5,61
0-
-5,
610
--
5,61
0
1,59
6,93
476
,569
-1,
673,
503
61,9
43-
1,73
5,44
6
Cons
olid
ated
Bala
nce
atTr
ansf
erBa
lanc
e at
Tran
sfer
Bala
nce
atbe
ginn
ing
ofIn
crem
ent
to A
ccum
end
of
Incr
emen
tto
Acc
umen
d of
20
14(D
ecre
men
t)Su
rplu
s20
14(D
ecre
men
t)Su
rplu
s20
15$’
000
$’00
0$’
000
$’00
0$’
000
$’00
0$’
000
Prop
erty
Land
1,
036,
969
6,60
6-
1,04
3,57
511
,493
-1,
055,
068
Bui
ldin
gs43
,816
29,7
84-
73,6
00(2
,783
)-
70,8
17In
fras
truc
ture
Roa
ds &
Lan
eway
s29
5,76
925
,816
-32
1,58
555
,718
-37
7,30
3B
ridge
s14
,365
(114
)-
14,2
512,
141
-16
,392
Foot
path
s an
d cy
clew
ays
96,2
1913
,290
-10
9,50
9(9
,372
)-
100,
137
Dra
inag
e29
,695
3,00
8-
32,7
0395
9-
33,6
62R
ecre
atio
nal,
leis
ure
and
com
mun
ity fa
cilit
ies
--
--
34-
34P
arks
, ope
n sp
ace
and
stre
etsc
apes
11,6
83(2
,656
)-
9,02
7(4
,613
)-
4,41
4O
ther
infra
stru
ctur
e58
,771
835
-59
,606
8,36
6-
67,9
72Ar
twor
ks5,
610
--
5,61
0-
-5,
610
1,59
2,89
776
,569
-1,
669,
466
61,9
43-
1,73
1,40
9
Coun
cil

177
FINANCIAL REPORT FOR THE YEAR ENDED 30 JUNE 2015FINANCIAL REPORT FOR THE YEAR ENDED 30 JUNE 2015
178 of 69
Note 29. Reserves (cont'd)
b) Movement in Reserves – Investments Revaluation Reserve - Regent Management Pty Ltd
Net asset revaluation movement summary
c) Movement in Reserves – Reserve for Public Open Space
d) Movement in Reserves – Tree Compensation reserve
2015 2014 2015 2014$'000 $'000 $'000 $'000
Balance at the beginning of the year 4,649 4,649 4,649 4,649Transfers from investment-non current asset - - -Transfers to investment-non current asset (424) - (424) -Balance at the end of the financial year 4,225 4,649 4,225 4,649
Consolidated Council
2015 2014 2015 2014$'000 $'000 $'000 $'000
Asset revaluation - property and infrastructureBalance at the beginning of the year 1,673,503 1,596,934 1,669,466 1,592,897Increment/(decrement) 61,943 76,569 61,943 76,569Balance at the end of the financial year 1,735,446 1,673,503 1,731,409 1,669,466Investments Revaluation Reserve - Regent Management Pty LtdBalance at the beginning of the year 4,649 4,649 4,649 4,649Increment/(decrement) (424) - (424) -Balance at the end of the financial year 4,225 4,649 4,225 4,649
Total net asset revaluation movement 61,519 76,569 61,519 76,569
Consolidated Council
2015 2014 2015 2014$'000 $'000 $'000 $'000
Balance at the beginning of the year 13,906 10,754 13,906 10,754Transfers from accumulated surplus 12,424 6,412 12,424 6,412Transfers to accumulated surplus (7,659) (3,260) (7,659) (3,260)Balance at the end of the financial year 18,671 13,906 18,671 13,906
Consolidated Council
2015 2014 2015 2014$'000 $'000 $'000 $'000
Balance at the beginning of the year 842 - 842 -Transfers from accumulated surplus 862 842 862 842Transfers to accumulated surplus - - - -Balance at the end of the financial year 1,704 842 1,704 842
Consolidated Council

178
FINANCIAL REPORT FOR THE YEAR ENDED 30 JUNE 2015
179 of 69
OTHER DISCLOSURES Note 30. Reconciliation from net cash provided by operating activities to surplus
Note 31. Reconciliation of cash and cash equivalents
Note 32. Financing arrangements
2015 2014 2015 2014$'000 $'000 $'000 $'000
Surplus/(deficit) for the year 60,854 36,036 60,157 31,343
Depreciation/amortisation 74,092 69,467 57,685 55,281Profit/(Loss) on disposal of property, plant and equipment
(2,033) (1,097) (1,381) (954)
Fair value adjustments for investment property (364) (5,640) (364) (5,640)Contributions - Non-monetary assets (11,562) (7,895) (11,562) (7,895)Other 5,222 9,146 5,880 11,017Changes in assets and liabilities in relation to operating activities:(Increase)/Decrease in trade and other receivables 7,926 (132) 1,076 2,505(Increase)/Decrease in prepayment (8,320) 2,496 (9,877) 40(Increase)/Decrease in accrued income (717) (2,335) 1,130 3,650(Decrease)/Increase in trade and other payables (12,665) 6,663 (7,757) 3,155(Increase) in Inventories (160) (165) - -(Decrease)/Increase in provisions (321) 1,457 (470) 1,473(Decrease)/Increase in employee benefits 158 353 (752) 3,406(Decrease)/Increase in trust funds and deposits 767 2,501 1,210 2,501Net cash provided by operating activities 112,877 110,855 94,975 99,882
CouncilConsolidated
2015 2014 2015 2014$'000 $'000 Note $'000 $'000
Cash and cash equivalents 118,972 89,024 16 106,519 81,339Less bank overdraft - - - -
118,972 89,024 106,519 81,339
Consolidated Council
2015 2014 2015 2014$'000 $'000 $'000 $'000
Bank overdraft facility 600 600 - -Bank loan facility 29,000 29,000 - -Used facilities - (6,000) - -Unused facilities 29,600 23,600 - -
Consolidated Council
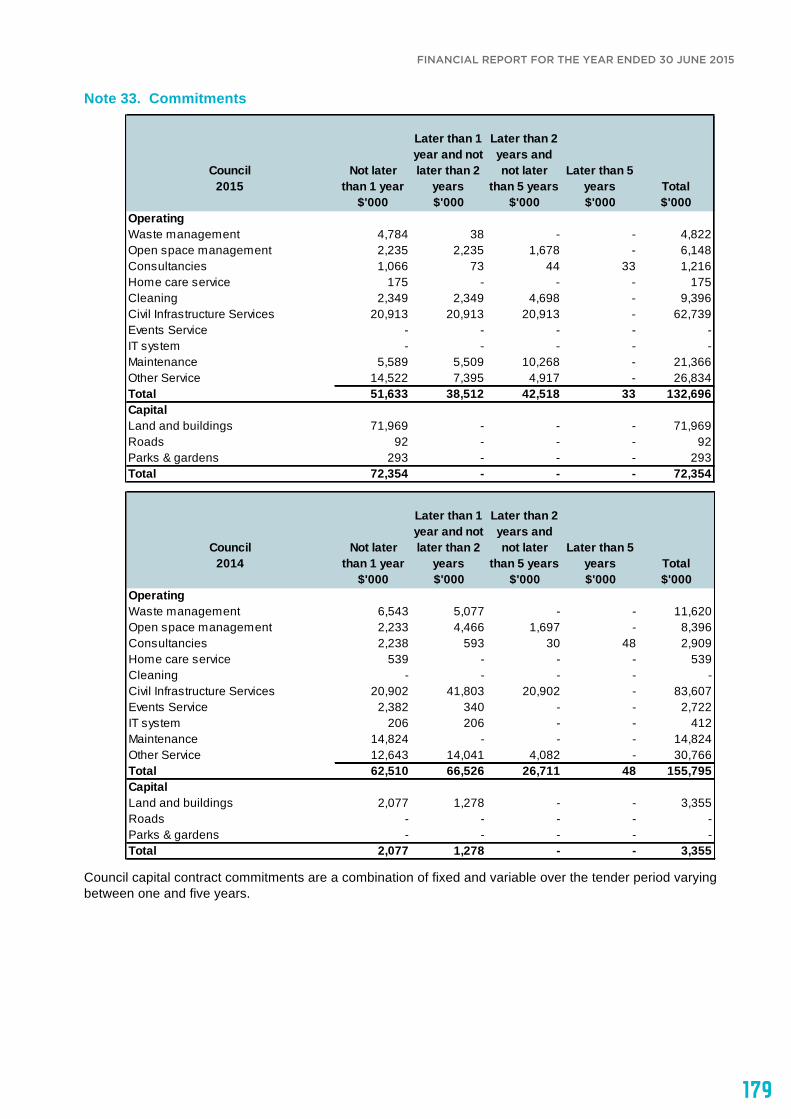
179
FINANCIAL REPORT FOR THE YEAR ENDED 30 JUNE 2015FINANCIAL REPORT FOR THE YEAR ENDED 30 JUNE 2015
180 of 69
Note 33. Commitments
Council capital contract commitments are a combination of fixed and variable over the tender period varying between one and five years.
Council 2015
Not later than 1 year
Later than 1 year and not later than 2
years
Later than 2 years and not later
than 5 yearsLater than 5
years Total$'000 $'000 $'000 $'000 $'000
OperatingWaste management 4,784 38 - - 4,822Open space management 2,235 2,235 1,678 - 6,148Consultancies 1,066 73 44 33 1,216Home care service 175 - - - 175Cleaning 2,349 2,349 4,698 - 9,396Civil Infrastructure Services 20,913 20,913 20,913 - 62,739Events Service - - - - -IT system - - - - -Maintenance 5,589 5,509 10,268 - 21,366Other Service 14,522 7,395 4,917 - 26,834Total 51,633 38,512 42,518 33 132,696CapitalLand and buildings 71,969 - - - 71,969Roads 92 - - - 92Parks & gardens 293 - - - 293Total 72,354 - - - 72,354
Council2014
Not later than 1 year
Later than 1 year and not later than 2
years
Later than 2 years and not later
than 5 yearsLater than 5
years Total$'000 $'000 $'000 $'000 $'000
OperatingWaste management 6,543 5,077 - - 11,620Open space management 2,233 4,466 1,697 - 8,396Consultancies 2,238 593 30 48 2,909Home care service 539 - - - 539Cleaning - - - - -Civil Infrastructure Services 20,902 41,803 20,902 - 83,607Events Service 2,382 340 - - 2,722IT system 206 206 - - 412Maintenance 14,824 - - - 14,824Other Service 12,643 14,041 4,082 - 30,766Total 62,510 66,526 26,711 48 155,795CapitalLand and buildings 2,077 1,278 - - 3,355Roads - - - - -Parks & gardens - - - - -Total 2,077 1,278 - - 3,355
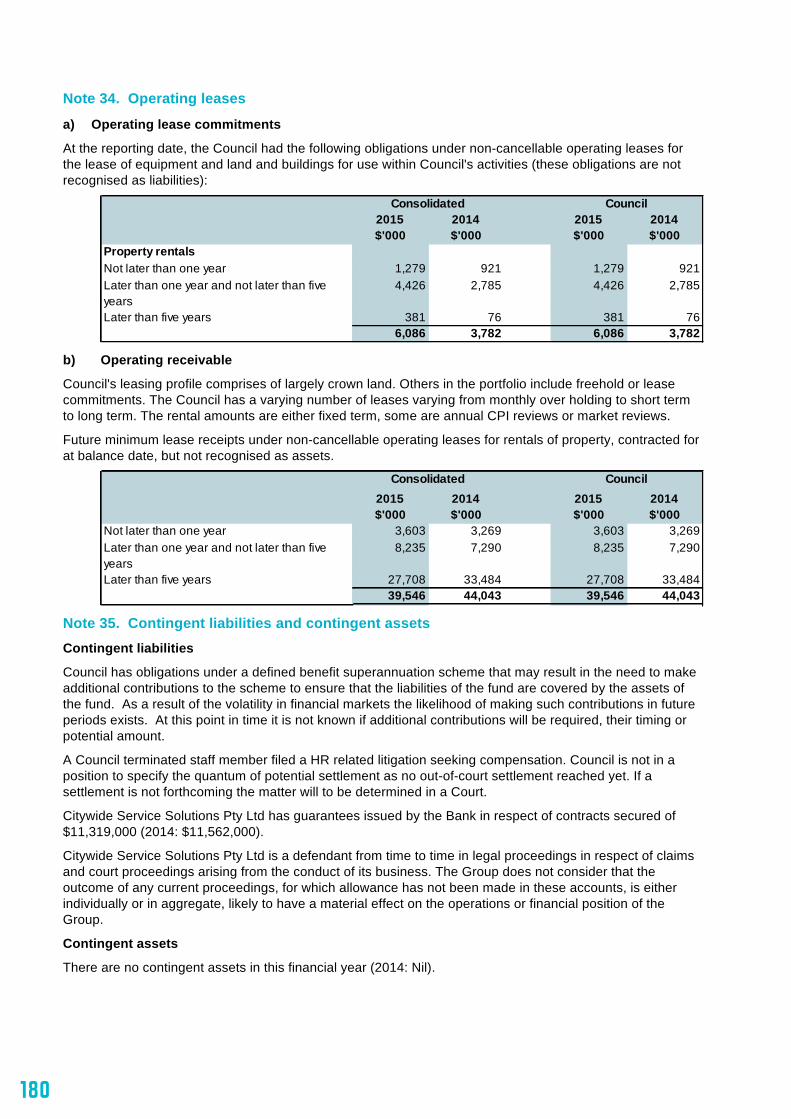
180
FINANCIAL REPORT FOR THE YEAR ENDED 30 JUNE 2015
181 of 69
Note 34. Operating leases
a) Operating lease commitments
At the reporting date, the Council had the following obligations under non-cancellable operating leases for the lease of equipment and land and buildings for use within Council's activities (these obligations are not recognised as liabilities):
b) Operating receivable
Council's leasing profile comprises of largely crown land. Others in the portfolio include freehold or lease commitments. The Council has a varying number of leases varying from monthly over holding to short term to long term. The rental amounts are either fixed term, some are annual CPI reviews or market reviews.
Future minimum lease receipts under non-cancellable operating leases for rentals of property, contracted for at balance date, but not recognised as assets.
Note 35. Contingent liabilities and contingent assets Contingent liabilities
Council has obligations under a defined benefit superannuation scheme that may result in the need to make additional contributions to the scheme to ensure that the liabilities of the fund are covered by the assets of the fund. As a result of the volatility in financial markets the likelihood of making such contributions in future periods exists. At this point in time it is not known if additional contributions will be required, their timing or potential amount.
A Council terminated staff member filed a HR related litigation seeking compensation. Council is not in a position to specify the quantum of potential settlement as no out-of-court settlement reached yet. If a settlement is not forthcoming the matter will to be determined in a Court.
Citywide Service Solutions Pty Ltd has guarantees issued by the Bank in respect of contracts secured of $11,319,000 (2014: $11,562,000).
Citywide Service Solutions Pty Ltd is a defendant from time to time in legal proceedings in respect of claims and court proceedings arising from the conduct of its business. The Group does not consider that the outcome of any current proceedings, for which allowance has not been made in these accounts, is either individually or in aggregate, likely to have a material effect on the operations or financial position of the Group.
Contingent assets
There are no contingent assets in this financial year (2014: Nil).
2015 2014 2015 2014$'000 $'000 $'000 $'000
Property rentalsNot later than one year 1,279 921 1,279 921Later than one year and not later than five years
4,426 2,785 4,426 2,785
Later than five years 381 76 381 766,086 3,782 6,086 3,782
CouncilConsolidated
2015 2014 2015 2014$'000 $'000 $'000 $'000
Not later than one year 3,603 3,269 3,603 3,269Later than one year and not later than five years
8,235 7,290 8,235 7,290
Later than five years 27,708 33,484 27,708 33,48439,546 44,043 39,546 44,043
CouncilConsolidated
181
FINANCIAL REPORT FOR THE YEAR ENDED 30 JUNE 2015FINANCIAL REPORT FOR THE YEAR ENDED 30 JUNE 2015
182 of 69
Note 36. Superannuation funds The Council makes the majority of its employer superannuation contributions in respect of its employees to the Local Authorities Superannuation Fund (the Fund). This Fund has two categories of membership, accumulation and defined benefit, each of which is funded differently. Obligations for contributions to the Fund are recognised as an expense in Comprehensive Income Statement when they are made or due.
Accumulation
The Fund’s accumulation categories, Vision MySuper/Vision Super Saver, receives both employer and employee contributions on a progressive basis. Employer contributions are normally based on a fixed percentage of employee earnings (for the year ended 30 June 2015, this was 9.5% required under Superannuation Guarantee legislation (2014: 9.25%).
Defined Benefit
The Council does not use defined benefit accounting for its defined benefit obligations under the Fund's Defined Benefit category. This is because the Fund's Defined Benefit category is a pooled multi-employer sponsored plan.
There is no proportional split of the defined benefit liabilities, assets or costs between the participating employers as the defined benefit obligation is a floating obligation between the participating employers and the only time that the aggregate obligation is allocated to specific employers is when a call is made. As a result, the level of participation of the Council in the Fund cannot be measured as a percentage compared with other participating employers. Therefore, the Actuary is unable to allocate benefit liabilities, assets and costs between employers for the purposes of AASB 119.
Funding arrangements
The Council makes employer contributions to the defined benefit category of the Fund at rates determined by the Trustee on the advice of the Fund's Actuary.
The Fund’s latest actuarial investigation was held as at 30 June 2014 and it was determined that the vested benefit index (VBI) of the defined benefit category of which the Council is a contributing employer was 103.4%. To determine the VBI, the fund Actuary used the following long-term assumptions:
• Net investment returns 7.5% pa
• Salary inflation 4.25% pa
• Price inflation (CPI) 2.75% pa.
Vision Super has advised that the estimated VBI at 31 March 2015 was 108.5%.
The VBI is to be used as the primary funding indicator. Because the VBI was above 100%, the actuarial investigation determined the defined benefit category was in a satisfactory financial position and that no change was necessary to the defined benefit category’s funding arrangements from prior years.
Employer contributions
Regular contributions
On the basis of the results of the most recent full actuarial investigation conducted by the Fund’s Actuary as at 30 June 2014, the Council makes employer contributions to the Fund’s Defined Benefit category at rates determined by the Fund’s Trustee. For the year ended 30 June 2015, this rate was 9.5% of members' salaries. This rate will increase in line with any increase to the Superannuation Guarantee (SG) contribution rate
In addition, the Council reimburses the Fund to cover the excess of the benefits paid as a consequence of retrenchment above the funded resignation or retirement benefit.
Funding calls
If the defined benefit category is in an unsatisfactory financial position at actuarial investigation or the defined benefit category‘s VBI is below its shortfall limit at any time other than the date of the actuarial investigation, the defined benefit category has a shortfall for the purposes of SPS 160 and the Fund is required to put a plan in place so that the shortfall is fully funded within three years of the shortfall occurring. The Fund monitors its VBI on a quarterly basis and the Fund has set its shortfall limit at 97%.
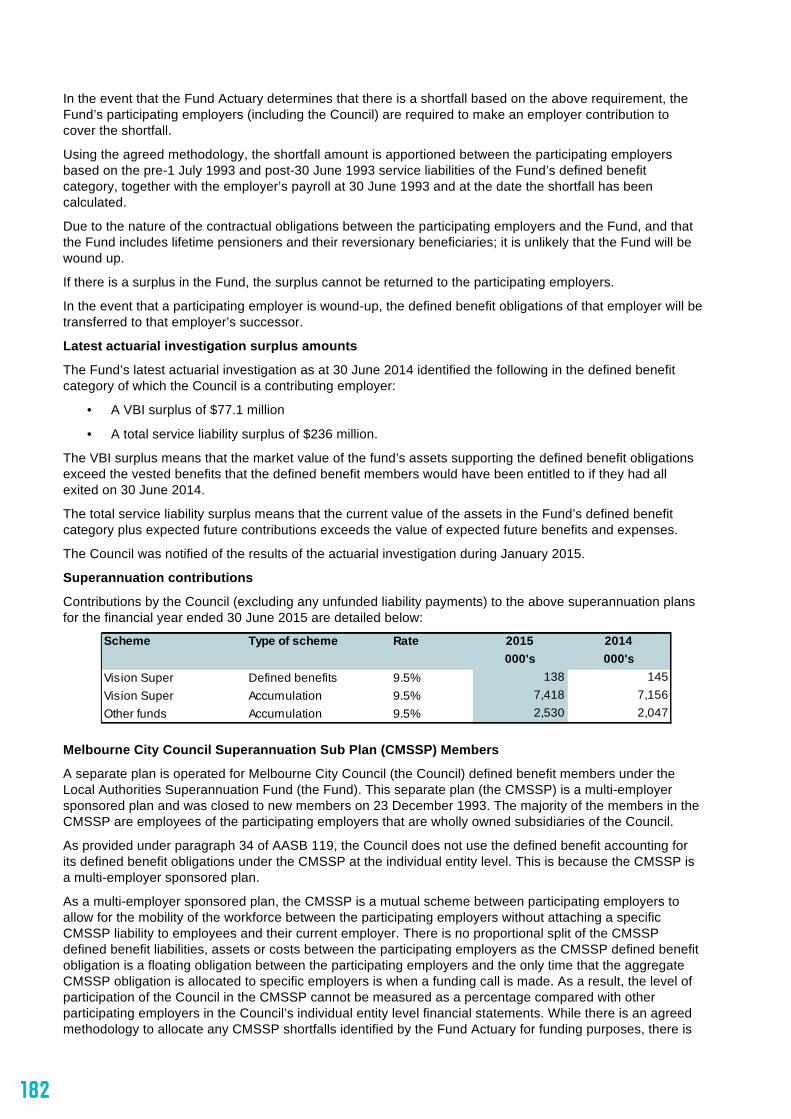
182
FINANCIAL REPORT FOR THE YEAR ENDED 30 JUNE 2015
183 of 69
In the event that the Fund Actuary determines that there is a shortfall based on the above requirement, the Fund’s participating employers (including the Council) are required to make an employer contribution to cover the shortfall.
Using the agreed methodology, the shortfall amount is apportioned between the participating employers based on the pre-1 July 1993 and post-30 June 1993 service liabilities of the Fund’s defined benefit category, together with the employer’s payroll at 30 June 1993 and at the date the shortfall has been calculated.
Due to the nature of the contractual obligations between the participating employers and the Fund, and that the Fund includes lifetime pensioners and their reversionary beneficiaries; it is unlikely that the Fund will be wound up.
If there is a surplus in the Fund, the surplus cannot be returned to the participating employers.
In the event that a participating employer is wound-up, the defined benefit obligations of that employer will be transferred to that employer’s successor.
Latest actuarial investigation surplus amounts
The Fund’s latest actuarial investigation as at 30 June 2014 identified the following in the defined benefit category of which the Council is a contributing employer:
• A VBI surplus of $77.1 million
• A total service liability surplus of $236 million.
The VBI surplus means that the market value of the fund’s assets supporting the defined benefit obligations exceed the vested benefits that the defined benefit members would have been entitled to if they had all exited on 30 June 2014.
The total service liability surplus means that the current value of the assets in the Fund’s defined benefit category plus expected future contributions exceeds the value of expected future benefits and expenses.
The Council was notified of the results of the actuarial investigation during January 2015.
Superannuation contributions
Contributions by the Council (excluding any unfunded liability payments) to the above superannuation plans for the financial year ended 30 June 2015 are detailed below:
Melbourne City Council Superannuation Sub Plan (CMSSP) Members
A separate plan is operated for Melbourne City Council (the Council) defined benefit members under the Local Authorities Superannuation Fund (the Fund). This separate plan (the CMSSP) is a multi-employer sponsored plan and was closed to new members on 23 December 1993. The majority of the members in the CMSSP are employees of the participating employers that are wholly owned subsidiaries of the Council.
As provided under paragraph 34 of AASB 119, the Council does not use the defined benefit accounting for its defined benefit obligations under the CMSSP at the individual entity level. This is because the CMSSP is a multi-employer sponsored plan.
As a multi-employer sponsored plan, the CMSSP is a mutual scheme between participating employers to allow for the mobility of the workforce between the participating employers without attaching a specific CMSSP liability to employees and their current employer. There is no proportional split of the CMSSP defined benefit liabilities, assets or costs between the participating employers as the CMSSP defined benefit obligation is a floating obligation between the participating employers and the only time that the aggregate CMSSP obligation is allocated to specific employers is when a funding call is made. As a result, the level of participation of the Council in the CMSSP cannot be measured as a percentage compared with other participating employers in the Council’s individual entity level financial statements. While there is an agreed methodology to allocate any CMSSP shortfalls identified by the Fund Actuary for funding purposes, there is
Scheme Type of scheme Rate 2015 2014000's 000's
Vision Super Defined benefits 9.5% 138 145Vision Super Accumulation 9.5% 7,418 7,156Other funds Accumulation 9.5% 2,530 2,047
183
FINANCIAL REPORT FOR THE YEAR ENDED 30 JUNE 2015FINANCIAL REPORT FOR THE YEAR ENDED 30 JUNE 2015
184 of 69
no agreed methodology to allocate CMSSP benefit liabilities, assets and costs between participating employers for accounting purposes. Therefore, the Fund Actuary is unable to allocate CMSSP benefit liabilities, assets and costs between employers on an individual entity basis for purposes of AASB 119 because of the pooled nature of the CMSSP’s defined benefit category.
However, as the majority of the members of the CMSSP are employees of the Council group, the surplus or deficit of the CMSSP is recorded in accordance to AASB119 at the consolidated level for reporting purposes.
CMSSP member profiles are reviewed periodically to determine if and when reporting at the individual entity level is appropriate.
Funding arrangements
The Council makes employer contributions to the CMSSP at rates determined by the Fund’s Trustee on advice of the Fund’s Actuary. The CMSSP’s employer funding arrangements comprise of three components as follows:
1) Regular contributions – which are ongoing contributions needed to fund the balance of benefits for current members and pensioners
2) Funding calls – which are contributions in respect of each participating employer’s share of any funding shortfalls that arose
3) Retrenchment increments – which are additional contributions to cover the increase in liability arising from retrenchments.
The Council is also required to make additional contributions to cover the contribution tax payable on the components 2 and 3 referred to above.
Employees are also required to make member contributions to the CMSSP. As such, assets accumulate in the CMSSF to meet member benefits, as defined in the Trust Deed, as they accrue.
Employer contributions
Regular contributions
On the basis of the results of the most recent full actuarial investigation conducted by the Fund’s Actuary as at 30 June 2014, the Council makes employer contributions to the CMSSP at rates determined by the Fund’s Trustee. For the year ended 30 June 2015, this rate was 13 per cent of salary for active defined benefit members.
In addition, the Council makes top-up payments to the CMSSP for exiting members equal to the exiting member’s benefit payment less the existing member’s vested benefit adjusted for the CMSSP’s vested benefit index (VBI) where the VBI is less than 100%.
Funding calls
The Fund’s Trustee is required to comply with the superannuation prudential standards. Under the superannuation prudential standard SPS 160, the Fund’s Trustee is required to target full funding of its vested benefits for each of its sub-plans (including the CMSSP). There may be circumstances where:
• a sub-plan is in an unsatisfactory financial position at an actuarial investigation (i.e. its vested benefit index (VBI) is less than 100% at the date of the actuarial investigation); or
• a sub-plan VBI is below its shortfall limit at any time other than at the date of the actuarial investigations.
If either of the above occur, the sub-plan has a shortfall for the purposes of SPS 160 and the Fund Trustee is required to put a plan in place for the sub-plan so that the shortfall is fully funded within three years of the shortfall occurring. There may be circumstances where the Australian Prudential Regulation Authority (APRA) may approve a period longer than three years.
The Fund’s Trustee monitors the CMSSP’s VBI on a quarterly basis and the shortfall limit for the CMSSP is set at 97%.
In the event that the Fund Actuary determines that the CMSSP has a shortfall based on the above requirement, the CMSSP’s participating employers (including the Council) are required to make an employer contribution to cover the shortfall. The methodology used to allocate a shortfall should result in a fair and reasonable apportionment of the shortfall between the participating employers. A number of factors are
184
FINANCIAL REPORT FOR THE YEAR ENDED 30 JUNE 2015
185 of 69
taken into consideration when determining the fairness/reasonableness of the apportionment including:
• the salary of the CMSSP members in participating CMSSP employer
• the vested benefit of each CMSSP members.
Due to the nature of the contractual obligations between the participating CMSSP employers and the CMSSP, it is unlikely that the CMSSP will be wound up. In the unlikely event the CMSSP is wound up and there is a surplus in the CMSSP, the surplus cannot be applied for the benefit of the CMSSP employers where there are on-going defined benefit obligations. The surplus would be transferred to the fund accepting the defined benefit obligations of the CMSSP.
In the event that a participating CMSSP employer is wound up, the CMSSP defined benefit obligations of that CMSSP employer will be transferred to that employer’s successor.
Difference between calculations
The CMSSP surplus or deficit (i.e. the difference between the CMSSP’s assets and liabilities) is calculated differently for funding purposes (i.e. calculating the required contributions), for the calculation of accrued benefits as required in AAS 25 and for the values needed for the AASB 119 disclosures in the Council’s financial statements. AAS 25 requires that the present value of the defined benefit liability be calculated based on benefits that have accrued in respect of membership of the CMSSP up to the measurement date, with no allowance for future benefits that may accrue.
Retrenchment increments
During 2014-15, the Council was not required to make payments to the CMSSP in respect of retrenchment increments (no payments required in 2013-14). The Council’s liability to the CMSSP as at 30 June 2015 for retrenchment increments, accrued interest and tax is $0 ($0 in 2013-14).
Latest actuarial investigation surplus amounts
The CMSSP’s latest actuarial investigation was as at 30 June 2014. This investigation identified the following in the defined benefit category:
• A VBI surplus of $6.5 million
• A total service liability surplus of $11.4 million.
The VBI surplus means that the market value of the CMSSP’s assets as at 30 June 2014 supporting its defined benefit obligations exceeded the vested benefits that the defined benefit members would have been entitled to if they had all exited on 30 June 2014.
The total service liability surplus means that the current value of the assets in the CMSSP’s defined benefit category plus expected future contributions exceeded the value of expected future benefits and expenses as at 30 June 2014.
The Council was notified of the results of the actuarial investigation during January 2015.
Prior actuarial shortfall amounts
The CMSSP’s prior actuarial investigation was as at 31 December 2011. This investigation identified an unfunded liability of $6.02 million (including contributions tax) in the CMSSP. An amount of $6.02million was paid on 4 January 2013 as the Council’s share of the CMSSP’s unfunded liabilities, being the difference between the present value of employees’ accrued defined benefits and the net market value of the CMSSP’s assets at 31 December 2011.
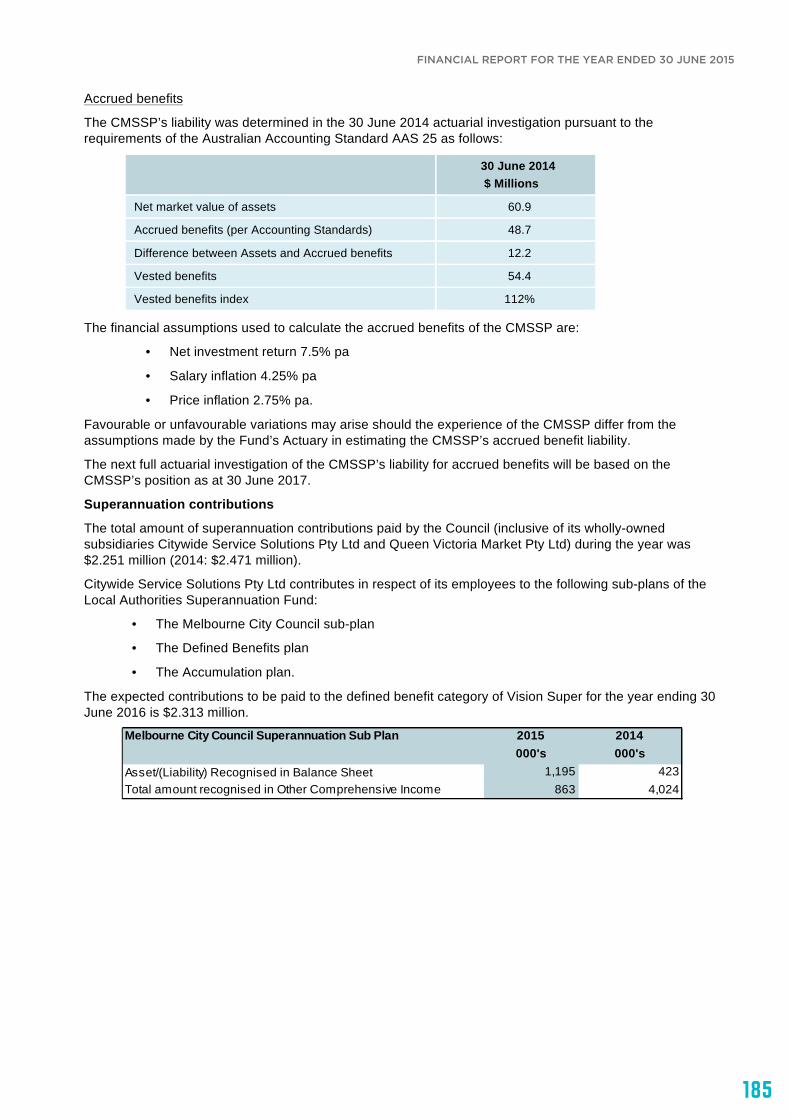
185
FINANCIAL REPORT FOR THE YEAR ENDED 30 JUNE 2015FINANCIAL REPORT FOR THE YEAR ENDED 30 JUNE 2015
186 of 69
Accrued benefits
The CMSSP’s liability was determined in the 30 June 2014 actuarial investigation pursuant to the requirements of the Australian Accounting Standard AAS 25 as follows:
30 June 2014 $ Millions
Net market value of assets 60.9
Accrued benefits (per Accounting Standards) 48.7
Difference between Assets and Accrued benefits 12.2
Vested benefits 54.4
Vested benefits index 112%
The financial assumptions used to calculate the accrued benefits of the CMSSP are:
• Net investment return 7.5% pa
• Salary inflation 4.25% pa
• Price inflation 2.75% pa.
Favourable or unfavourable variations may arise should the experience of the CMSSP differ from the assumptions made by the Fund’s Actuary in estimating the CMSSP’s accrued benefit liability.
The next full actuarial investigation of the CMSSP’s liability for accrued benefits will be based on the CMSSP’s position as at 30 June 2017.
Superannuation contributions
The total amount of superannuation contributions paid by the Council (inclusive of its wholly-owned subsidiaries Citywide Service Solutions Pty Ltd and Queen Victoria Market Pty Ltd) during the year was $2.251 million (2014: $2.471 million).
Citywide Service Solutions Pty Ltd contributes in respect of its employees to the following sub-plans of the Local Authorities Superannuation Fund:
• The Melbourne City Council sub-plan
• The Defined Benefits plan
• The Accumulation plan.
The expected contributions to be paid to the defined benefit category of Vision Super for the year ending 30 June 2016 is $2.313 million.
Melbourne City Council Superannuation Sub Plan 2015 2014000's 000's
Asset/(Liability) Recognised in Balance Sheet 1,195 423Total amount recognised in Other Comprehensive Income 863 4,024
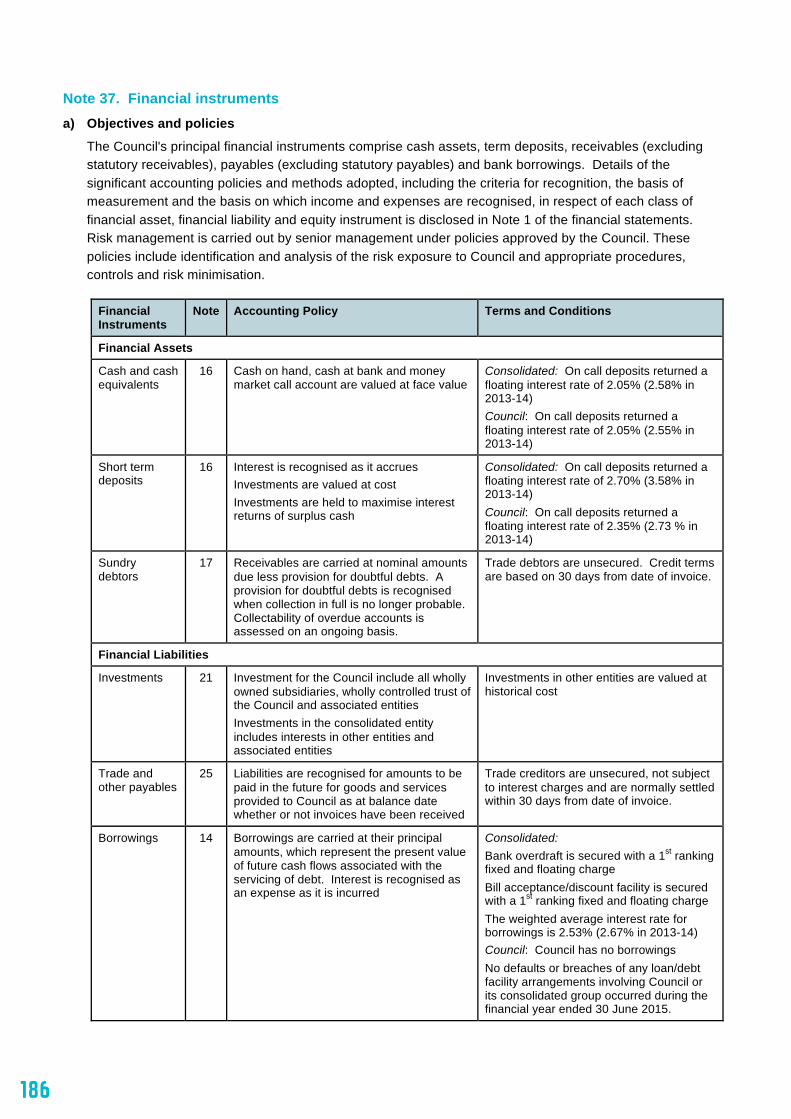
186
FINANCIAL REPORT FOR THE YEAR ENDED 30 JUNE 2015
187 of 69
Note 37. Financial instruments a) Objectives and policies
The Council's principal financial instruments comprise cash assets, term deposits, receivables (excluding statutory receivables), payables (excluding statutory payables) and bank borrowings. Details of the significant accounting policies and methods adopted, including the criteria for recognition, the basis of measurement and the basis on which income and expenses are recognised, in respect of each class of financial asset, financial liability and equity instrument is disclosed in Note 1 of the financial statements. Risk management is carried out by senior management under policies approved by the Council. These policies include identification and analysis of the risk exposure to Council and appropriate procedures, controls and risk minimisation.
Financial Instruments
Note Accounting Policy Terms and Conditions
Financial Assets
Cash and cash equivalents
16 Cash on hand, cash at bank and money market call account are valued at face value
Consolidated: On call deposits returned a floating interest rate of 2.05% (2.58% in 2013-14) Council: On call deposits returned a floating interest rate of 2.05% (2.55% in 2013-14)
Short term deposits
16 Interest is recognised as it accrues Investments are valued at cost Investments are held to maximise interest returns of surplus cash
Consolidated: On call deposits returned a floating interest rate of 2.70% (3.58% in 2013-14) Council: On call deposits returned a floating interest rate of 2.35% (2.73 % in 2013-14)
Sundry debtors
17 Receivables are carried at nominal amounts due less provision for doubtful debts. A provision for doubtful debts is recognised when collection in full is no longer probable. Collectability of overdue accounts is assessed on an ongoing basis.
Trade debtors are unsecured. Credit terms are based on 30 days from date of invoice.
Financial Liabilities
Investments 21 Investment for the Council include all wholly owned subsidiaries, wholly controlled trust of the Council and associated entities Investments in the consolidated entity includes interests in other entities and associated entities
Investments in other entities are valued at historical cost
Trade and other payables
25 Liabilities are recognised for amounts to be paid in the future for goods and services provided to Council as at balance date whether or not invoices have been received
Trade creditors are unsecured, not subject to interest charges and are normally settled within 30 days from date of invoice.
Borrowings 14 Borrowings are carried at their principal amounts, which represent the present value of future cash flows associated with the servicing of debt. Interest is recognised as an expense as it is incurred
Consolidated: Bank overdraft is secured with a 1st ranking fixed and floating charge Bill acceptance/discount facility is secured with a 1st ranking fixed and floating charge The weighted average interest rate for borrowings is 2.53% (2.67% in 2013-14) Council: Council has no borrowings No defaults or breaches of any loan/debt facility arrangements involving Council or its consolidated group occurred during the financial year ended 30 June 2015.
187
FINANCIAL REPORT FOR THE YEAR ENDED 30 JUNE 2015FINANCIAL REPORT FOR THE YEAR ENDED 30 JUNE 2015
188 of 69
b) Market risk
Market risk is the risk that the fair value or future cash flows of our financial instruments will fluctuate because of changes in market prices. The Council's exposures to market risk is primarily through interest rate risk with only insignificant exposure to other price risks and no exposure to foreign currency risk.
Interest rate risk
Interest rate risk refers to the risk that the value of a financial instrument or cash flows associated with the instrument will fluctuate due to changes in market interest rates. Council does not hold any interest bearing financial instruments that are measured at fair value, and therefore has no exposure to fair value interest rate risk. Cash flow interest rate risk is the risk that the future cash flows of a financial instrument will fluctuate because of changes in market interest rates. Council has minimal exposure to cash flow interest rate risk through its cash and deposits that are at floating rate.
Investment of surplus funds is made with approved financial institutions under the Local Government Act 1989. Council manages interest rate risk by adopting an investment policy that ensures:
• diversification of investment product
• monitoring of return on investment
• benchmarking of returns and comparison with budget.
There has been no significant change in the Council's exposure, or its objectives, policies and processes for managing interest rate risk or the methods used to measure this risk from the previous reporting period.
Interest rate movements have not been sufficiently significant during the year to have an impact on the Council's year end result.
Council's interest rate liability risk is limited to our subsidiary company’s Citywide Service Solutions Pty Ltd borrowings. Council has no direct borrowings.
Council's subsidiary company Citywide Service Solutions Pty Ltd has a borrowing and overdraft facility which has been arranged with a major Australian bank. Council's subsidiary company manages the interest rate risk by:
• an ongoing review or borrowing levels
• having a limit imposed on the maximum borrowing amount allowed by Council.
c) Credit risk
Credit risk is the risk that a contracting entity will not complete its obligations under a financial instrument and cause us to make a financial loss. Council has exposure to credit risk on some financial assets included in our balance sheet. To help manage this risk:
• Council has a policy for establishing credit limits for the entities we deal with
• Council may require collateral, where appropriate
• Council only invests surplus funds with financial institutions which have a recognised credit rating specified in our investment policy.
Receivables consist of a large number of customers, spread across the ratepayer, business and government sectors. Credit risk associated with the Council's financial assets is minimal because the main debtor is secured by a charge over the rateable property.
There are no material financial assets which are individually determined to be impaired.
Council may also be subject to credit risk for transactions which are not included in the balance sheet, such as when Council provides a guarantee for another party. Details of Council’s contingent liabilities are disclosed in note 35.
The maximum exposure to credit risk at the reporting date to recognised financial assets is the carrying amount, net of any provisions for impairment of those assets, as disclosed in the balance sheet and notes to the financial statements. Council does not hold any collateral.
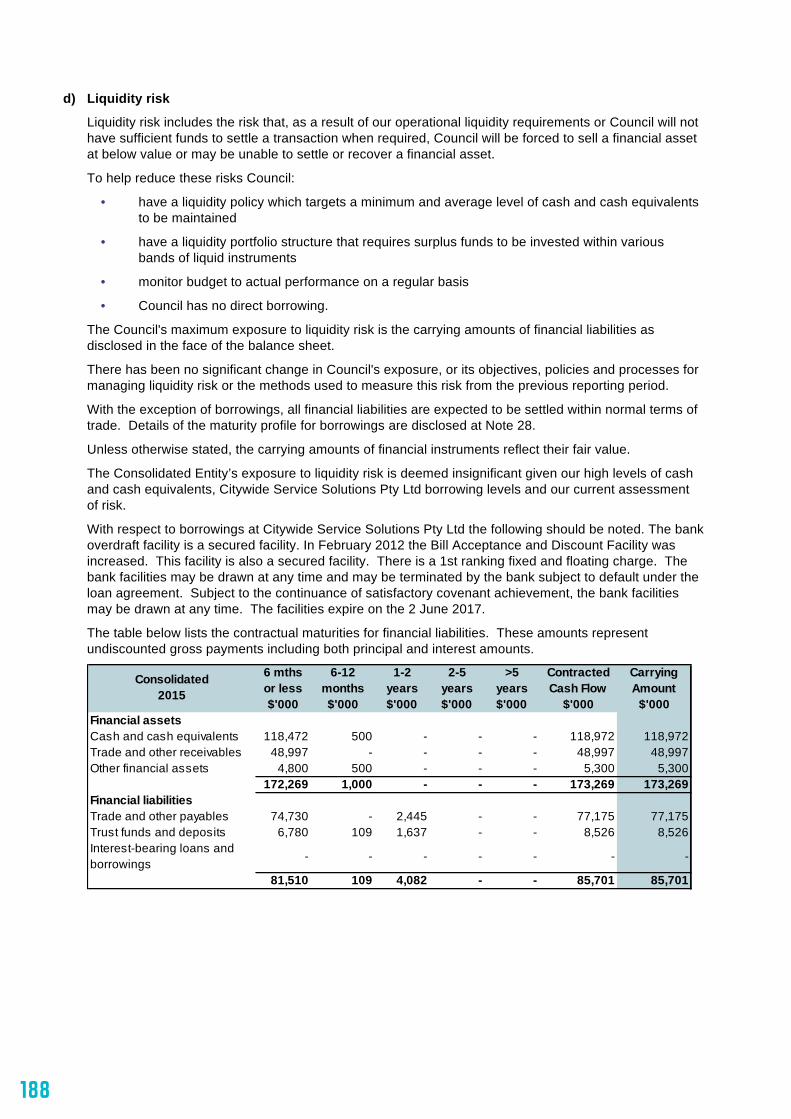
188
FINANCIAL REPORT FOR THE YEAR ENDED 30 JUNE 2015
189 of 69
d) Liquidity risk
Liquidity risk includes the risk that, as a result of our operational liquidity requirements or Council will not have sufficient funds to settle a transaction when required, Council will be forced to sell a financial asset at below value or may be unable to settle or recover a financial asset.
To help reduce these risks Council:
• have a liquidity policy which targets a minimum and average level of cash and cash equivalents to be maintained
• have a liquidity portfolio structure that requires surplus funds to be invested within various bands of liquid instruments
• monitor budget to actual performance on a regular basis
• Council has no direct borrowing.
The Council's maximum exposure to liquidity risk is the carrying amounts of financial liabilities as disclosed in the face of the balance sheet.
There has been no significant change in Council's exposure, or its objectives, policies and processes for managing liquidity risk or the methods used to measure this risk from the previous reporting period.
With the exception of borrowings, all financial liabilities are expected to be settled within normal terms of trade. Details of the maturity profile for borrowings are disclosed at Note 28.
Unless otherwise stated, the carrying amounts of financial instruments reflect their fair value.
The Consolidated Entity’s exposure to liquidity risk is deemed insignificant given our high levels of cash and cash equivalents, Citywide Service Solutions Pty Ltd borrowing levels and our current assessment of risk.
With respect to borrowings at Citywide Service Solutions Pty Ltd the following should be noted. The bank overdraft facility is a secured facility. In February 2012 the Bill Acceptance and Discount Facility was increased. This facility is also a secured facility. There is a 1st ranking fixed and floating charge. The bank facilities may be drawn at any time and may be terminated by the bank subject to default under the loan agreement. Subject to the continuance of satisfactory covenant achievement, the bank facilities may be drawn at any time. The facilities expire on the 2 June 2017.
The table below lists the contractual maturities for financial liabilities. These amounts represent undiscounted gross payments including both principal and interest amounts.
6 mths 6-12 1-2 2-5 >5 Contracted Carryingor less months years years years Cash Flow Amount$'000 $'000 $'000 $'000 $'000 $'000 $'000
Financial assetsCash and cash equivalents 118,472 500 - - - 118,972 118,972Trade and other receivables 48,997 - - - - 48,997 48,997Other financial assets 4,800 500 - - - 5,300 5,300
172,269 1,000 - - - 173,269 173,269Financial liabilitiesTrade and other payables 74,730 - 2,445 - - 77,175 77,175Trust funds and deposits 6,780 109 1,637 - - 8,526 8,526Interest-bearing loans and borrowings - - - - - - -
81,510 109 4,082 - - 85,701 85,701
Consolidated2015

189
FINANCIAL REPORT FOR THE YEAR ENDED 30 JUNE 2015FINANCIAL REPORT FOR THE YEAR ENDED 30 JUNE 2015
190 of 69
e) Fair value
Unless otherwise stated, the carrying amount of financial instruments reflect their fair value.
Council's financial assets and liabilities are not valued in accordance with the fair value hierarchy, Council's financial assets and liabilities are measured at amortised cost.
f) Sensitivity disclosure analysis
Taking into account past performance, future expectations, economic forecasts, and management's knowledge and experience of the financial markets, Council believes the movements 'reasonably possible' over the next 12 months are a parallel shift of + 1.0% and -0.5% in market interest rates (AUD) from year-end rates of 2.05%.
These movements will not have a material impact on the valuation of Council's financial assets and liabilities, nor will they have a material impact on the results of Council's operations.
6 mths 6-12 1-2 2-5 >5 Contracted Carryingor less months years years years Cash Flow Amount$'000 $'000 $'000 $'000 $'000 $'000 $'000
Financial assetsCash and cash equivalents 106,519 - - - - 106,519 106,519Trade and other receivables 25,550 - - - - 25,550 25,550Other financial assets - 2,000 - - - 2,000 2,000
132,069 2,000 - - - 134,069 134,069Financial liabilitiesTrade and other payables 53,308 - - - - 53,308 53,308Trust funds and deposits 6,111 - - - - 6,111 6,111Interest-bearing loans and borrowings - - - - - - -
59,419 - - - - 59,419 59,419
Council 2015
6 mths 6-12 1-2 2-5 >5 Contracted Carryingor less months years years years Cash Flow Amount$'000 $'000 $'000 $'000 $'000 $'000 $'000
Financial assetsCash and cash equivalents 88,524 500 - - - 89,024 89,024Trade and other receivables 57,695 - - - - 57,695 57,695Other financial assets 21,200 500 - - - 21,700 21,700
167,419 1,000 - - - 168,419 168,419Financial liabilitiesTrade and other payables 89,840 - - - - 89,840 89,840Trust funds and deposits 5,351 97 1,609 - - 7,057 7,057Interest-bearing loans and borrowings - - - 6,000 - 6,000 6,000
95,191 97 1,609 6,000 - 102,897 102,897
Consolidated2014
6 mths 6-12 1-2 2-5 >5 Contracted Carryingor less months years years years Cash Flow Amount$'000 $'000 $'000 $'000 $'000 $'000 $'000
Financial assetsCash and cash equivalents 81,339 - - - - 81,339 81,339Trade and other receivables 26,626 - - - - 26,626 26,626Other financial assets 8,000 10,000 - - - 18,000 18,000
115,965 10,000 - - - 125,965 125,965Financial liabilitiesTrade and other payables 61,065 - - - - 61,065 61,065Trust funds and deposits 4,901 - - - - 4,901 4,901Interest-bearing loans and borrowings - - - - - - -
65,966 - - - - 65,966 65,966
Council 2014
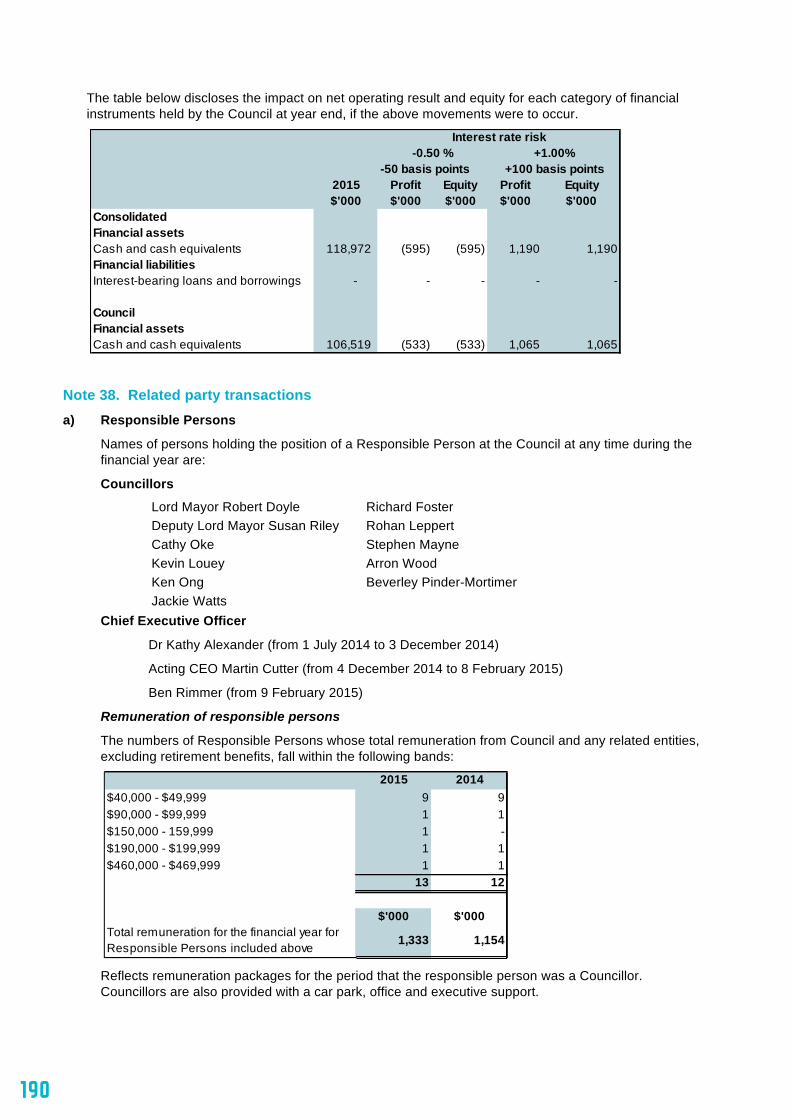
190
FINANCIAL REPORT FOR THE YEAR ENDED 30 JUNE 2015
191 of 69
The table below discloses the impact on net operating result and equity for each category of financial instruments held by the Council at year end, if the above movements were to occur.
Note 38. Related party transactions a) Responsible Persons
Names of persons holding the position of a Responsible Person at the Council at any time during the financial year are:
Councillors
Lord Mayor Robert Doyle Richard Foster Deputy Lord Mayor Susan Riley Rohan Leppert Cathy Oke Stephen Mayne Kevin Louey Arron Wood Ken Ong Beverley Pinder-Mortimer Jackie Watts
Chief Executive Officer
Dr Kathy Alexander (from 1 July 2014 to 3 December 2014)
Acting CEO Martin Cutter (from 4 December 2014 to 8 February 2015)
Ben Rimmer (from 9 February 2015)
Remuneration of responsible persons
The numbers of Responsible Persons whose total remuneration from Council and any related entities, excluding retirement benefits, fall within the following bands:
Reflects remuneration packages for the period that the responsible person was a Councillor. Councillors are also provided with a car park, office and executive support.
-50 basis points +100 basis points2015 Profit Equity Profit Equity$'000 $'000 $'000 $'000 $'000
ConsolidatedFinancial assets
118,972 (595) (595) 1,190 1,190Financial liabilities
- - - - -
CouncilFinancial assets
106,519 (533) (533) 1,065 1,065
Cash and cash equivalents
Interest-bearing loans and borrowings
+1.00%Interest rate risk
-0.50 %
Cash and cash equivalents
2015 2014$40,000 - $49,999 9 9$90,000 - $99,999 1 1$150,000 - 159,999 1 -$190,000 - $199,999 1 1$460,000 - $469,999 1 1
13 12
$'000 $'000Total remuneration for the financial year for Responsible Persons included above
1,333 1,154

191
FINANCIAL REPORT FOR THE YEAR ENDED 30 JUNE 2015FINANCIAL REPORT FOR THE YEAR ENDED 30 JUNE 2015
192 of 69
Responsible persons retirement benefits
There are no retirement benefits have been made to responsible persons. There were no matters to report in the previous financial year.
Loans to responsible persons
There are no loans have been made to responsible persons. There were no matters to report in the previous financial year.
Transactions with responsible persons
During the period Council entered into the following transactions with responsible persons or related parties of responsible persons.
b) Senior Officers' Remuneration
A Senior Officer other than a Responsible Person, is
a) For Council, an officer who has management responsibilities and reports directly to the Chief Executive; or whose total annual remuneration exceeds $136,000; or
b) For subsidiaries, the Managing Director, Chief Executive Officers and executives, or whose total annual remuneration exceeds $136,000.
Responsible Officer
Position held (including related
parties of responsible officer)
SupplierNatural of transactions (on normal commercial
terms)
Transaction
Amount ($'000)
Funding support by Council 65 Products/services 3
TrusteeThe Shrine of Remembrance Funding support by Council 325
Funding support by Council 6 Products/services 5
Partner - employee Australian Centre for the Moving Image
Funding support by Council 29
Director Melbourne Media Pty Ltd
Products/services 2
Director Procurement Australia Products/services 124 Son - Owner of company The Delivery Boy Products/services 17
Funding support by Council 330 Products/services 21 Office space provided by Council for ICLEI Oceania
-
Products/services 2
Councillor Stephen Mayne
Partner - board member for part of the period and ongoing committee roles
RACV Products/services 2
Total 931
Councillor Cathy Oke
International Council for local Environmental Initiatives
President/Chair/Executive Committee member
Lord Mayor Robert Doyle
Deputy Lord Mayor Susan Riley
Councillor Rohan Leppert
Melbourne Symphony Orchestra
Board member
The Load Mayor's Charitable Foundation
President
Cancer Council of Australia
Ex-Officio member
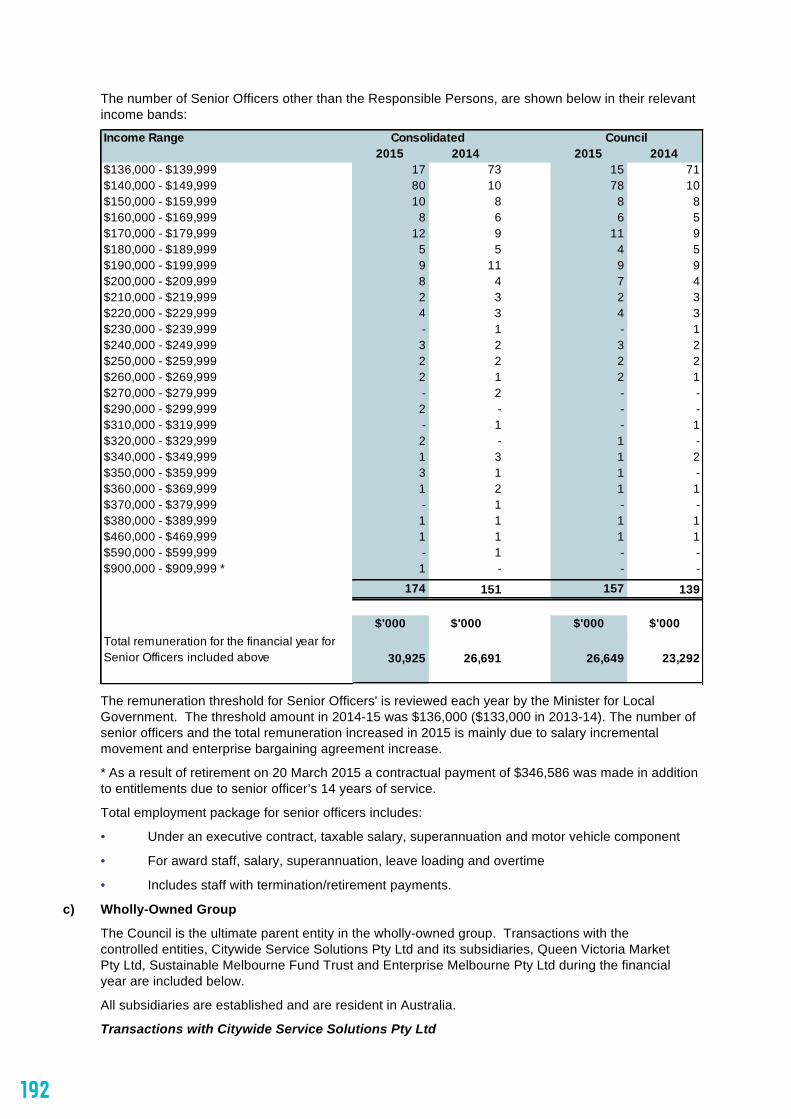
192
FINANCIAL REPORT FOR THE YEAR ENDED 30 JUNE 2015
193 of 69
The number of Senior Officers other than the Responsible Persons, are shown below in their relevant income bands:
The remuneration threshold for Senior Officers' is reviewed each year by the Minister for Local Government. The threshold amount in 2014-15 was $136,000 ($133,000 in 2013-14). The number of senior officers and the total remuneration increased in 2015 is mainly due to salary incremental movement and enterprise bargaining agreement increase.
* As a result of retirement on 20 March 2015 a contractual payment of $346,586 was made in addition to entitlements due to senior officer’s 14 years of service.
Total employment package for senior officers includes:
• Under an executive contract, taxable salary, superannuation and motor vehicle component
• For award staff, salary, superannuation, leave loading and overtime
• Includes staff with termination/retirement payments.
c) Wholly-Owned Group
The Council is the ultimate parent entity in the wholly-owned group. Transactions with the controlled entities, Citywide Service Solutions Pty Ltd and its subsidiaries, Queen Victoria Market Pty Ltd, Sustainable Melbourne Fund Trust and Enterprise Melbourne Pty Ltd during the financial year are included below.
All subsidiaries are established and are resident in Australia.
Transactions with Citywide Service Solutions Pty Ltd
Income Range2015 2014 2015 2014
$136,000 - $139,999 17 73 15 71$140,000 - $149,999 80 10 78 10$150,000 - $159,999 10 8 8 8$160,000 - $169,999 8 6 6 5$170,000 - $179,999 12 9 11 9$180,000 - $189,999 5 5 4 5$190,000 - $199,999 9 11 9 9$200,000 - $209,999 8 4 7 4$210,000 - $219,999 2 3 2 3$220,000 - $229,999 4 3 4 3$230,000 - $239,999 - 1 - 1$240,000 - $249,999 3 2 3 2$250,000 - $259,999 2 2 2 2$260,000 - $269,999 2 1 2 1$270,000 - $279,999 - 2 - -$290,000 - $299,999 2 - - -$310,000 - $319,999 - 1 - 1$320,000 - $329,999 2 - 1 -$340,000 - $349,999 1 3 1 2$350,000 - $359,999 3 1 1 -$360,000 - $369,999 1 2 1 1$370,000 - $379,999 - 1 - -$380,000 - $389,999 1 1 1 1$460,000 - $469,999 1 1 1 1$590,000 - $599,999 - 1 - -$900,000 - $909,999 * 1 - - -
174 151 157 139
$'000 $'000 $'000 $'000Total remuneration for the financial year for Senior Officers included above 30,925 26,691 26,649 23,292
Consolidated Council

193
FINANCIAL REPORT FOR THE YEAR ENDED 30 JUNE 2015FINANCIAL REPORT FOR THE YEAR ENDED 30 JUNE 2015
194 of 69
Transactions with the Citywide Service Solutions Pty Ltd during the financial year were based on a contract for the provision of services comprising property rental, contract sales and the payment of charges (tax equivalents) which includes income tax and payroll tax.
Revenue received from Citywide is $426,000 (2013-14 $414,000).
Expenditure to Citywide is $54,902,000 (2013-14 $56,713,000).
Income Tax and Payroll Tax Equivalent, and Dividend are $6,355,000 (2013-14 $7,170,000).
Debtor account balance to Citywide is $78,000 (2013-14 $38,000).
Creditor account balance to Citywide is $14,325,000 (2013-14 $11,263,000).
Transactions with Queen Victoria Market Pty Ltd
Transactions with the Queen Victoria Market Pty Ltd during the financial year were based on a contract for the provision of services comprising a Licence fee, IT charges and in accordance with the Tax Equivalent Policy, the payment of charges (tax equivalents) which includes income tax.
Revenue received from Queen Victoria Market is $4,725,000 (2013-14 $4,740,000).
Income Tax Equivalent and Dividend are $374,000 (2013-14 $680,000).
Debtor account balance to QVM is $436,000 (2013-14 $960,000).
Creditor account balance to QVM is $612,000 (2013-14 $219,000).
QVM spent $2,661,000 on the market renewal program in the financial year. This sum was reimbursed by the Council. $2,056,000 was set up as a QVM renewal capital project and $605,000 was expensed.
Transactions with Sustainable Melbourne Fund Trust
Revenue received from Sustainable Melbourne Fund is $39,150 (2013-14 $34,000).
Expenditure to Sustainable Melbourne Fund for services provided is $12,904 (2013-14 $10,000).
Debtor account balance to SMF is $528 (2013-14 $1,056).
Creditor account balance to SMF is $0 (2013-14 $0).
Transactions with Enterprise Melbourne Pty Ltd
Funding to Enterprise Melbourne is $369,000 (2013-14 $278,000).
Note 39. Events occurring after balance date There are no events that have occurred after balance date that need to be reflected in the Financial Statements.
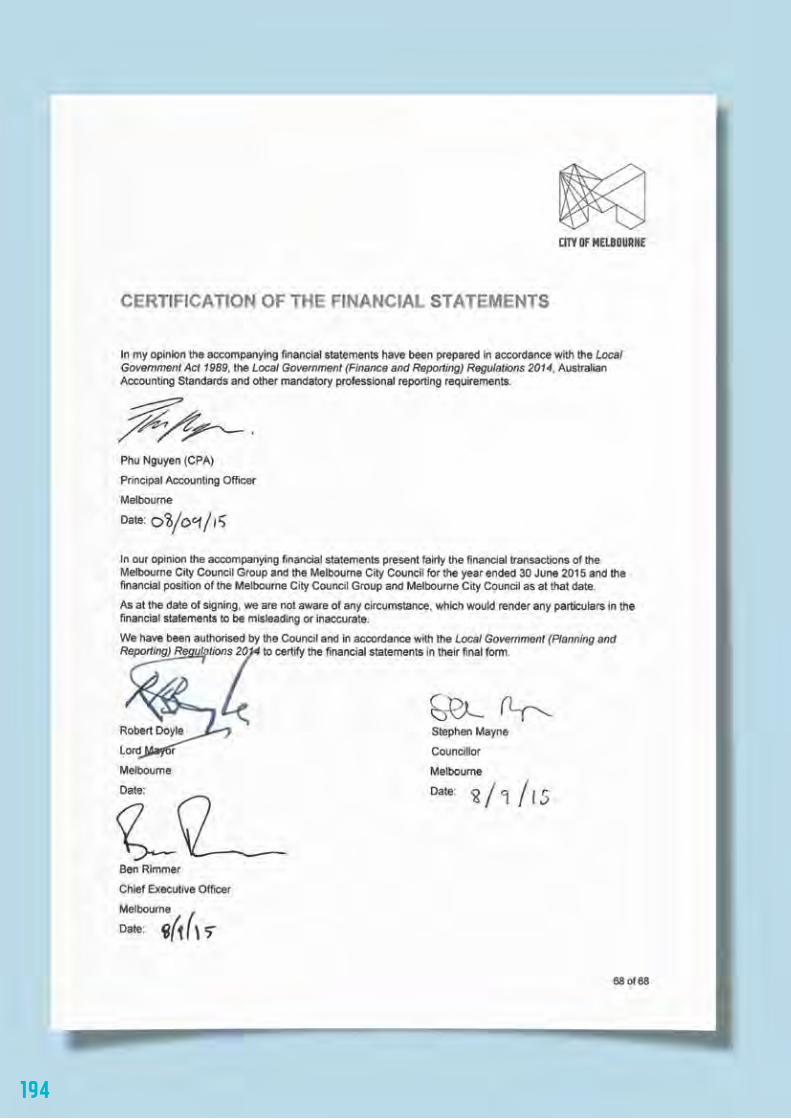
194
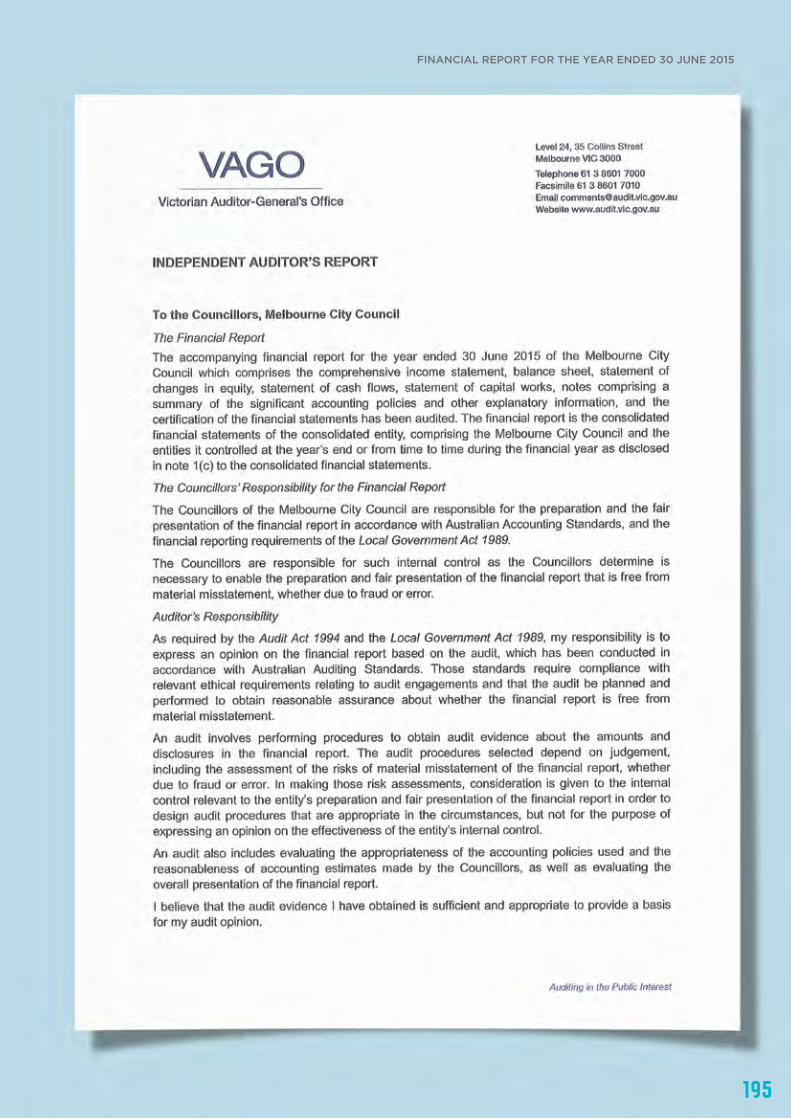
195
FINANCIAL REPORT FOR THE YEAR ENDED 30 JUNE 2015
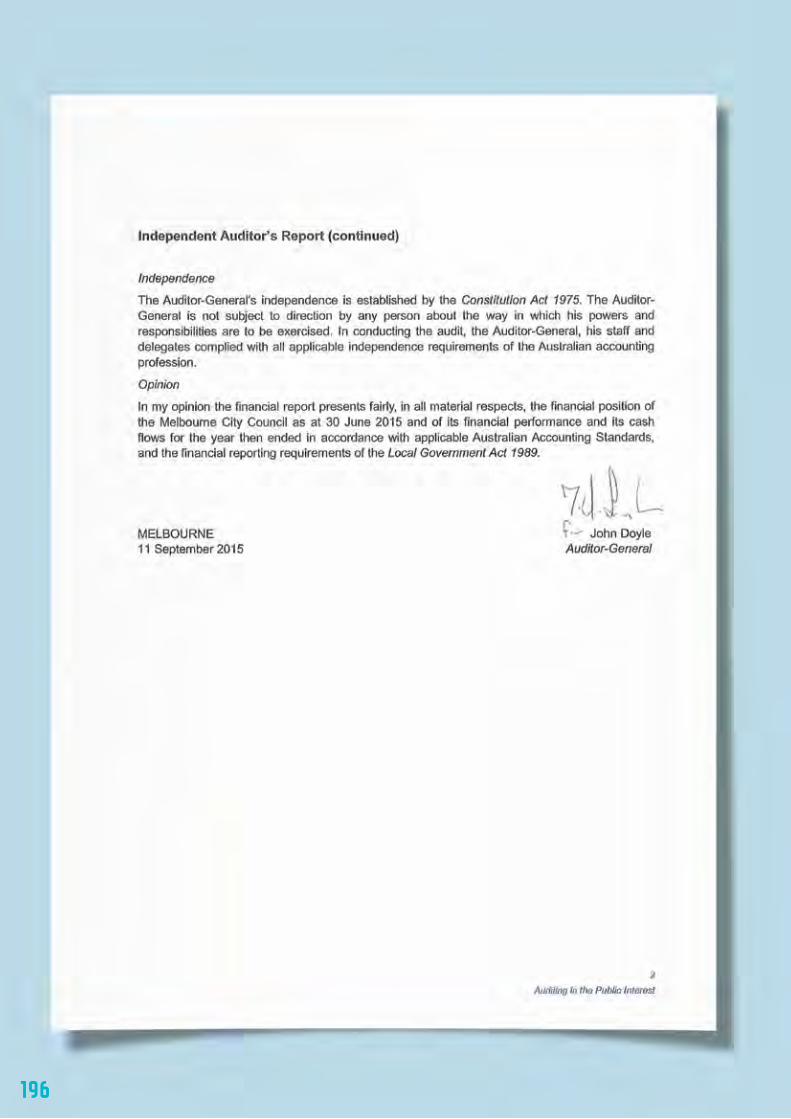
196