Embed Size (px)
Citation preview

City of Douglas Downtown Revitalization Plan
Community Meeting
June 22, 2010

Agenda
1. Introductions 2. Project Information
1. Scope 2. Schedule
3. Work Accomplished To Date 1. Economic Study 2. Phelps Dodge Building Update 3. Community Research
4. Downtown Planning Collaboration 5. Pin Up
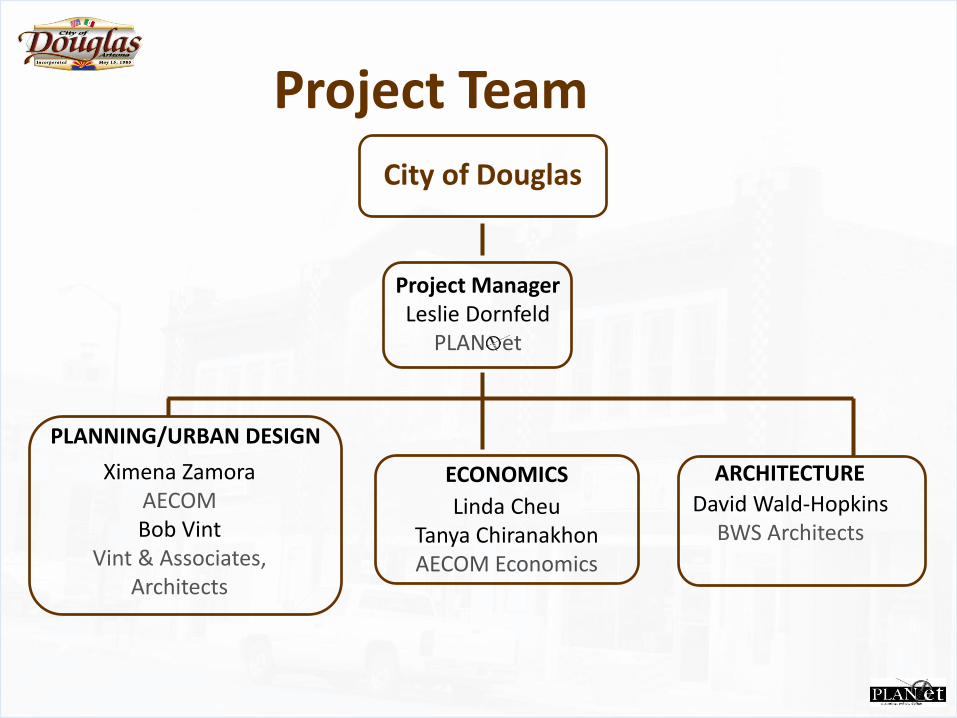
Project Team
City of Douglas
Ximena Zamora AECOM Bob Vint
Vint & Associates, Architects
Linda Cheu Tanya Chiranakhon AECOM Economics
ECONOMICS
PLANNING/URBAN DESIGN
Project Manager Leslie Dornfeld
PLAN et
David Wald-Hopkins BWS Architects
ARCHITECTURE

PROJECT SCOPE
Reconnaissance Economic Study Focus Groups (May 13, 2010) Research
Develop Concepts Public Workshop (June 22, 2010) Concept Development Meet with City Staff (Late Summer)
Refine Concept Community Meeting (Early Fall)
Finalize Concept City Council Meeting (Late 2010/Early 2011)
City of Douglas Downtown Redevelopment Plan Economic Study
Community Meeting June 22, 2010

I. Economic and Retail Trends
II. Relevant Findings from Stakeholder Interviews
III. SWOT Analysis
1. Strengths
2. Weaknesses
3. Opportunities
4. Threats
IV. Economic Development Strategies

I. Economic Trends

Cochise County Employment Growth, 2001-2010
1,475
600
6,250 5,625
4,425 3,800
2,450
12,475
0
2,000
4,000
6,000
8,000
10,000
12,000
14,000
2001 2002 2003 2004 2005 2006 2007 2008 2009 2010
Mining and Construction Manufacturing
Trade, Transportation, and Utilities Professional and Business Services
Educational and Health Services Leisure and Hospitality
Services2 Government
I. Economic Trends
Em
plo
ym
en
t
Source: State of Arizona, Department of Commerce, Research Administration

Cochise County Employment, 2010
Mining and Construction
4%
Manufacturing 2% Trade,
Transportation, and Utilities
17%
Professional and Business
Services 15%
Educational and Health Services
12%
Leisure and Hospitality
10%
Services2 6%
Government 34%
I. Economic Trends
Source: State of Arizona, Department of Commerce, Research Administration

Cochise County Population Growth, 2001-2009
The City of Douglas’ share of Cochise County’s population has ranged from 13.7% in
2001 to 12.7% in 2009.
I. Economic Trends
Po
pu
lati
on
38
,70
0
40
,40
0
40
,40
0
42
,70
0
43
,70
0
44
,90
0
44
,70
0
45
,90
0
46
,60
0
16,600 17,000 17,100 17,100 17,200 17,700 18,200 18,200 17,800
65
,50
0
66
,40
0
68
,10
0
69
,90
0
70
,90
0
72
,70
0
74
,30
0
75
,30
0
75
,90
0
0
20,000
40,000
60,000
80,000
100,000
120,000
140,000
160,000
2001 2002 2003 2004 2005 2006 2007 2008 2009
Sierra Vista Douglas Remainder of Cochise County
120,800 123,800 125,600
129,700 131,800 135,300 137,200 139,400 140,300
Source: Arizona Department of Economic Security, Population Statistics Unit; Arizona Department of Commerce, 2009 Population
Estimates

City of Douglas Population Growth, 2001-2009
16
,60
0 1
6,9
90
17
,07
5
17
,08
0
17
,19
5 1
7,6
60
18
,15
2
18
,20
7
17
,75
8
15,500
16,000
16,500
17,000
17,500
18,000
18,500
2001 2002 2003 2004 2005 2006 2007 2008 2009
According to The Arizona Department of Corrections, these population figure includes
approximately 2,000 inmates at the Arizona State Prison Complex in Douglas. The
household population in 2009 is estimated to be approximately 15,760.
I. Economic Trends
Po
pu
lati
on

Douglas and Agua Prieta Population Comparison, 2001 and 2005
16,600 17,195
60,269
68,402
0
10,000
20,000
30,000
40,000
50,000
60,000
70,000
80,000
2001 2005
Douglas Agua Prieta City
I. Economic Trends
The population figures shown above for Agua Prieta are sourced from INEGI, the Mexican
government’s National Institute of Statistics and Geography. Unofficial sources have cited
the population anywhere from 60,000 to 200,000. In either case, the population of Agua
Prieta is at least 4 times greater than that of Douglas.
Po
pu
lati
on

$501,000 $528,000 $513,400 $504,400
$150,800 $155,800 $156,900
$139,500
$132,700 $112,900 $104,800
$103,500
$0
$100,000
$200,000
$300,000
$400,000
$500,000
$600,000
$700,000
$800,000
$900,000
2006 2007 2008 2009
Sierra Vista Douglas Remainder of Cochise County
Cochise County, Douglas and Sierra Vista Retail Sales, 2006-2009 G
ros
s T
axa
ble
Re
tail
Sa
les
(Th
ou
sa
nd
s)
$784,500 $796,700
$775,100 $747,400
Gross taxable retail sales in Douglas roughly mirrored those of Cochise County from 2006 through
2009. Sales in Douglas consistently accounted for approximately 19% to 20% of the county’s.
I. Economic Trends

$5
,79
9
$5
,80
7
$5
,56
0
$5
,32
8
$1
1,1
59
$1
1,8
12
$1
1,1
85
$1
0,8
25
$9
,60
7
$9
,61
8
$9
,68
5
$8
,83
1
$0
$2,000
$4,000
$6,000
$8,000
$10,000
$12,000
$14,000
2006 2007 2008 2009
Cochise County Sierra Vista Douglas
Cochise County, Douglas, Sierra Vista Per Capita Retail Sales P
er
Ca
pit
a R
eta
il S
ale
s
Per capita retail in Douglas are significantly higher than those of Cochise County and lower that than of
Sierra Vista. Because Douglas’ median household income is below the countywide median, these
figures indicate considerable retail sales to non-residents, including cross-border shoppers.
Per capita retail
sales in Douglas
that exceed the
countywide
average indicate
sales to Mexican
shoppers.
* In 2007 the median household income for Douglas was $25,597 compared to $40,656 for Cochise County.
Indicate possible
retail leakage to
Sierra Vista
I. Economic Trends
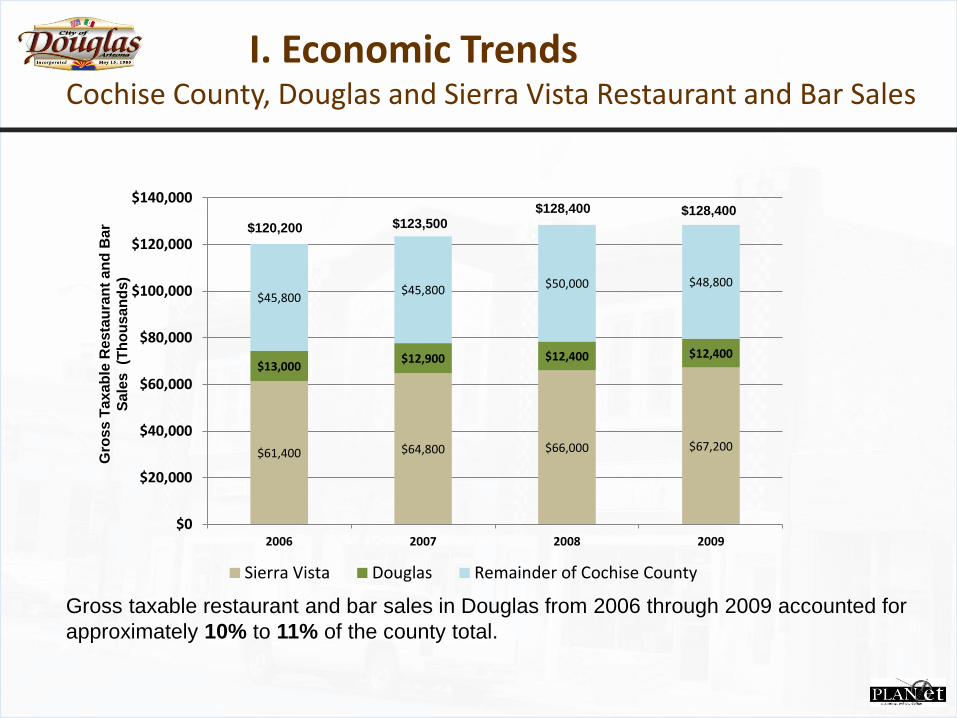
$61,400 $64,800 $66,000 $67,200
$13,000 $12,900 $12,400 $12,400
$45,800 $45,800 $50,000 $48,800
$0
$20,000
$40,000
$60,000
$80,000
$100,000
$120,000
$140,000
2006 2007 2008 2009
Sierra Vista Douglas Remainder of Cochise County
Cochise County, Douglas and Sierra Vista Restaurant and Bar Sales G
ros
s T
axa
ble
Re
sta
ura
nt
an
d B
ar
Sa
les
(T
ho
usa
nd
s)
$120,200 $123,500 $128,400 $128,400
Gross taxable restaurant and bar sales in Douglas from 2006 through 2009 accounted for
approximately 10% to 11% of the county total.
I. Economic Trends

$8
88
$9
00
$9
22
$9
15
$1
,36
7
$1
,45
0
$1
,43
9
$1
,44
1
$8
25
$7
98
$7
68
$7
88
$0
$200
$400
$600
$800
$1,000
$1,200
$1,400
$1,600
2006 2007 2008 2009
Cochise County Sierra Vista
Cochise County, Douglas, Sierra Vista Per Capita Restaurant Sales P
er
Ca
pit
a R
esta
ura
nt
an
d B
ar
Sa
les
Per capita restaurant and bar sales calculated using the household population in Douglas
are only half of Sierra Vista’s and lower than those of Cochise County. These figures
indicate considerable restaurant and bar sales leakage.
* In 2007 the median household income for Douglas was $25,597 compared to $40,656 for Cochise County.
Lower per capita
restaurant and bar
sales in Douglas
indicate
considerable
leakage.
I. Economic Trends

Douglas Resident Retail Out-Shopping
• Highest percentage of retail out-shopping by Douglas
residents:
1. 30.1% Computer hardware / software
2. 29.4% Books
3. 29.3% Furniture
• Weaknesses of Douglas retail stores:
1. Too few stores and lack of variety of retail goods
2. Prices in Douglas are too high
3. Poor customer service (language barrier?)
Source: 2006 survey conducted by Cochise College Center for Economic Research
I. Economic Trends

Douglas POE Cross Border Traffic from Mexico, 2009
Source: US Department of Transportation, Research and Innovative Technology Administration
1,190 999 1,391 1,432 1,019 972 1,561 1,338 962 1,155 525 1,028
385,590
344,964
367,920 366,441
389,196
366,650 388,155
261,387 248,864 250,339 249,847
273,977
112,294 110,984 113,719 112,332 112,346
86,160 103,612
114,402 104,837 101,391
111,531 131,137
0
50,000
100,000
150,000
200,000
250,000
300,000
350,000
400,000
450,000
Jan Feb Mar Apr May Jun Jul Aug Sep Oct Nov Dec
Bus Passengers Personal Vehicle Passengers Pedestrians
Pe
rso
n C
ros
sin
gs
I. Economic Trends

Economic Impact of Mexican Shoppers in Cochise County
• Direct Economic Impacts of Mexican visitor spending in
Cochise County from 2007-2008:
1. 1,498 jobs
2. Over $28 million in income from these jobs
3. $186 million in sales
Source: Mexican Visitors to Arizona: Visitor Characteristics and Economic Impacts 2007-2008
Reason for Visit % of Parties # of Parties
Leisure 89.9% 1,616,066
Health 0.4% 6,471
Vacation 0.7% 12,943
Friends / Relatives 8.2% 147,585
Shopping 79.2% 1,423,361
Other 1.4% 25,706
Business 10.1% 181,560
Health0.4%
Vacation0.7%
Friends / Relatives8.2%
Shopping79.2%
Other1.4%
Business10.1%
I. Economic Trends

Characteristics of Mexican Shoppers in Douglas
• Monthly HH income distribution of Mexican Shoppers in
Douglas
• Top 10 stores where Mexican visitors to Douglas shop
Shopping Centers / Stores % of Parties
Wal-Mart 54.3%
Safeway 33.2%
Factory 2-U 24.9%
Family Dollar 18.3%
Food City 16.8%
JC Penney 13.3%
Gas Station 12.6%
Dollar Tree 9.3%
Radio Shack 4.8%
Payless Shoes 3.0%
Under $929 $929-$1,393 $1,394-$1,859 $1,860-$2,787 $2,788-$3,716 $3,717-$4,646 $4,647-$7,434 $7,435 or Over
Douglas 45.7% 36.2% 13.0% 3.3% 0.9% 0.3% 0.3% 0.3%
Port of Entry
Income Range (US Dollars)
Source: Mexican Visitors to Arizona: Visitor Characteristics and Economic Impacts 2007-2008
* Average monthly household income for Mexico as a whole was $952 in 2005.
I. Economic Trends
II. Findings from Stakeholder Interviews

Key Findings II. Findings from Stakeholder Interviews
• Cross border traffic accounts for between 25% to 75% of client
base for Downtown businesses
• Downtown Douglas lacks variety in dining options – need nicer
restaurants, bars, cafes, ice cream shops
• Ideas for Downtown stores? Hobby shops, a sporting goods
store, card store, bookstore, and hair and nail salon
• Parking is a problem – inconveniently located and not enough
• Downtown should be more of a social hub - music events,
parades and street festivals would be big draws
• Need to improve the aesthetic of downtown storefronts and
streetscape with signage, coordinated color scheme, etc.
• Grand Theatre and YMCA are key buildings to renovate.
Gadsden Hotel could be further improved.

III. Strengths, Weaknesses, Opportunities and Threats

Strengths
III. SWOT Analysis
• Location across border from significant population
center in Agua Prieta
• Cross border visitors come specifically for shopping
• Historic downtown buildings with authentic character
• Long standing small, local businesses provide
unique commercial core
• Call center, hospital and expanded border patrol
provide stable employment opportunities

III. SWOT Analysis
• Relatively small local population, low income, and
low growth
• Large, spread out downtown area is not very
cohesive and lacks intimacy
• Existing vacancies contribute to lack of cohesion
• Douglas lacks marquee event, brand, or icon to
attract tourism
• Current tourism limited to cross border shoppers
• Downtown buildings in need of renovation and repair
• Restaurant and dining options are limited
• Parking challenges
Weaknesses

III. SWOT Analysis
• Three target market segments to capitalize on
• New PD building and government center could focus
spending downtown
• Key projects centered around one node – PD
building, Grand Theatre, Gadsden Hotel
• Gadsden Hotel and Grand Theatre should be
centerpieces of the tourism strategy
• Active community college with potential for
partnership
• Douglas history – there are authentic stories from
which to build tourism sector
• New, reenergized Chamber of Commerce with
downtown events, promotion activities, etc.
• Preliminary planning for development of economic
development corporation
Opportunities

III. SWOT Analysis
• Local competition from Walmart and surrounding
businesses
• Regional competition from Sierra Vista and retail
leakage
• Proposed bypass could further divert traffic
• Conservatism towards change by long standing
business owners
• Frustration with past planning efforts that were not
economics driven, “study fatigue”
• Perception of border safety issues
• Perception about new immigration law
Threats

IV. Economic Development Strategy

Three Target Market Segments IV. Economic Development Strategy
1. Douglas resident market
2. Cross-border visitor market
3. Tourism market
15
,90
0
16
,00
0
16
,20
0
16
,40
0
16
,60
0
16
,80
0
17
,10
0
17
,40
0
17
,70
0
18
,00
0
18
,30
0
10,000
11,000
12,000
13,000
14,000
15,000
16,000
17,000
18,000
19,000
20,000
2010 2011 2012 2013 2014 2015 2016 2017 2018 2019 2020
Douglas Household Population
Douglas Household Population
Douglas Household Population Projection, 2010-2020
Ho
us
eh
old
Po
pu
lati
on

Three Target Market Segments IV. Economic Development Strategy
3,2
00
3,2
00
3,3
00
3,3
00
3,4
00
3,5
00
3,5
00
3,6
00
3,7
00
3,7
00
3,8
00
1,000
1,500
2,000
2,500
3,000
3,500
4,000
2010 2011 2012 2013 2014 2015 2016 2017 2018 2019 2020
Non-US Citizen Person Crossings
Non-US Citizen Person Crossings
Non-US Citizen Border Crossings Projection, 2010-
2020
1. Douglas resident market
2. Cross-border visitor market
3. Tourism market N
on
-US
Cit
ize
n B
ord
er
Cro
ss
ing
s
(Th
ou
sa
nd
s)

Supportable Retail Space Based on Projected Growth
IV. Economic Development Strategy
Sources of Retail Demand:
1. Additional capture of existing cross-border spending
2. Growth of cross-border spending
3. Growth of Douglas residents and spending
4. Attract tourism already visiting Tombstone and Bisbee

IV. Economic Development Strategy 10 Year Retail and Restaurant Demand
• Demand for nearly 100,000 additional SF of restaurant and retail space
in downtown Douglas over the next 10 years.
• Approximately 40% to 50% of this space should be restaurants, bars
and food-related retail.
• 50% to 60% should be other types of retail, with 50% serving the cross
border market and 50% serving the local and tourist market.
• Should target one or two nationally known restaurant chains – may have
to provide incentives.
Current 2010-2015 2015-2020 TOTAL SF % of Total SF
10,000 3,500 4,600 18,100 20%
7,800 5,000 5,900 18,700 21%
29,800 10,500 13,900 54,200 60%
47,600 19,000 24,400 91,000 100%
Estimated Supportable Square Feet in Downtown Douglas

Supportable Downtown Retail Space Based on Projected Growth
IV. Economic Development Strategy
Additional Capture of Existing
Spending
2010 - 2015 2015 - 2020
Food Related Retail SF
10,000 21%
Restaurant and Bar SF7,800 16%
Other Retail SF29,800 63%
Food Related Retail SF
3,500 19%
Restaurant and Bar SF
5,000 26%
Other Retail SF10,500 55%
Food Related Retail SF
4,600 19%
Restaurant and Bar SF
5,900 24%
Other Retail SF13,900 57%

Tourism Strategy (mid- to long-term)
“Southwest Trail”
• Over 400,000 tourists
go to Tombstone
annually
• The Kartchner
Caverns in Benson
and Bisbee also
attract tourists
• Strategic positioning
for Douglas
Tombstone
Bisbee Douglas
IV. Economic Development Strategy
Tucson
Benson
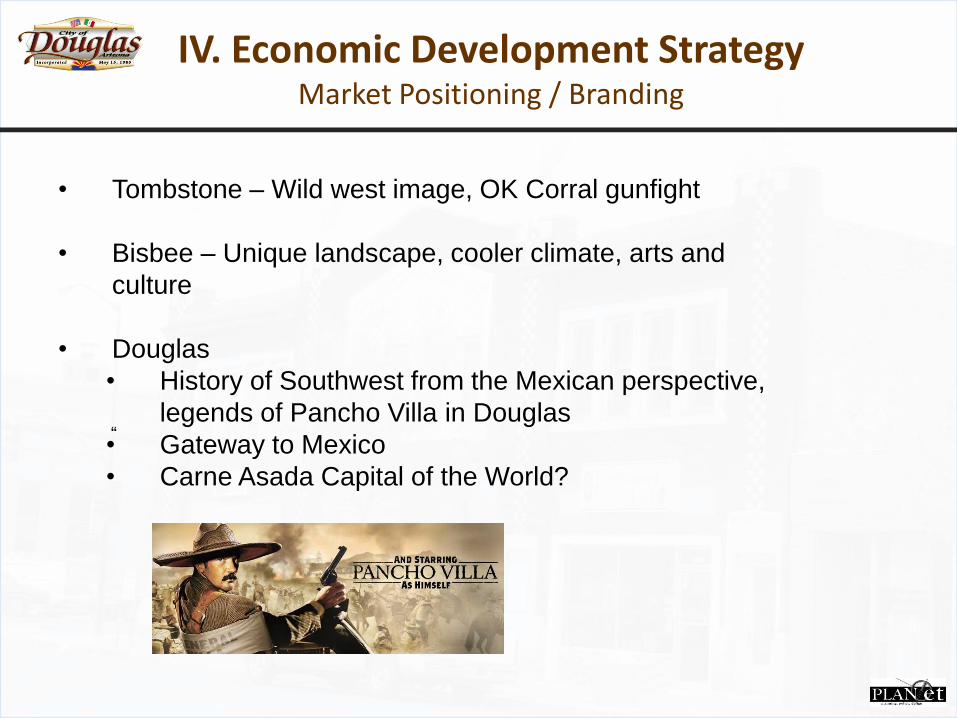
Market Positioning / Branding
• Tombstone – Wild west image, OK Corral gunfight
• Bisbee – Unique landscape, cooler climate, arts and
culture
• Douglas
• History of Southwest from the Mexican perspective,
legends of Pancho Villa in Douglas
• Gateway to Mexico
• Carne Asada Capital of the World?
“
IV. Economic Development Strategy
Strategic Partnerships / Key Catalyst Projects
• PD Building
• Partnership with Cochise College - culinary, nursing,
computers and language programs
• Gadsden Hotel
• Grand Theatre
IV. Economic Development Strategy
Marketing and Events
• Regular events that bring people downtown
• Mexican music festival at the Grand Theatre
• Promote the cross border shuttle bus Parking
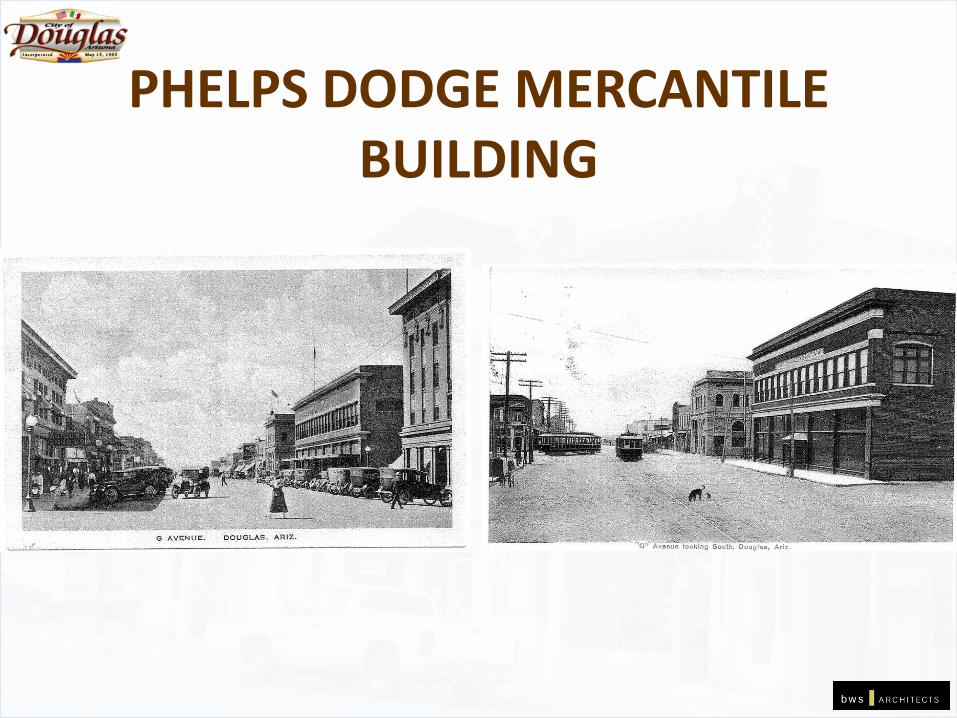
PHELPS DODGE MERCANTILE BUILDING

PHELPS DODGE MERCANTILE BUILDING

ENTRANCE

STAIRWAY

INTERIORS

NEW FLOOR PLAN
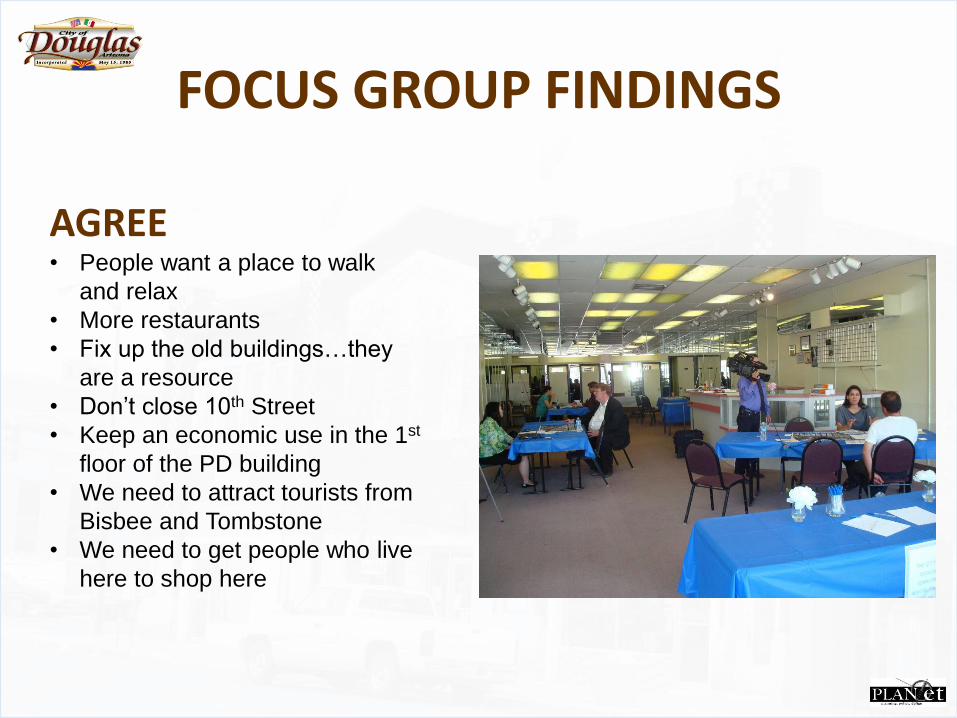
FOCUS GROUP FINDINGS
AGREE • People want a place to walk
and relax
• More restaurants
• Fix up the old buildings…they
are a resource
• Don’t close 10th Street
• Keep an economic use in the 1st
floor of the PD building
• We need to attract tourists from
Bisbee and Tombstone
• We need to get people who live
here to shop here

FOCUS GROUP FINDINGS
VARIETY OF IDEAS • Activities for youth in the
Downtown (renovate the YMCA
for them?)
• The role of the City in
Downtown redevelopment
(extent of code enforcement,
extent of regulations)
• Parking (not enough?)
• Role of Mexican Market
(depend on it more or less?)

1.Zones/Zone Elements 2.Circulation 3.Access/Gateways 4.Streetscape 5.Architecture
WHAT DO YOU THINK?

ZONE IDEA: Education
Main Mall, Poughkeepsie NY Douglas, Arizona

ZONE IDEA: Ramblas
Santa Monica Pier Ramblas, Spain Winslow, Arizona
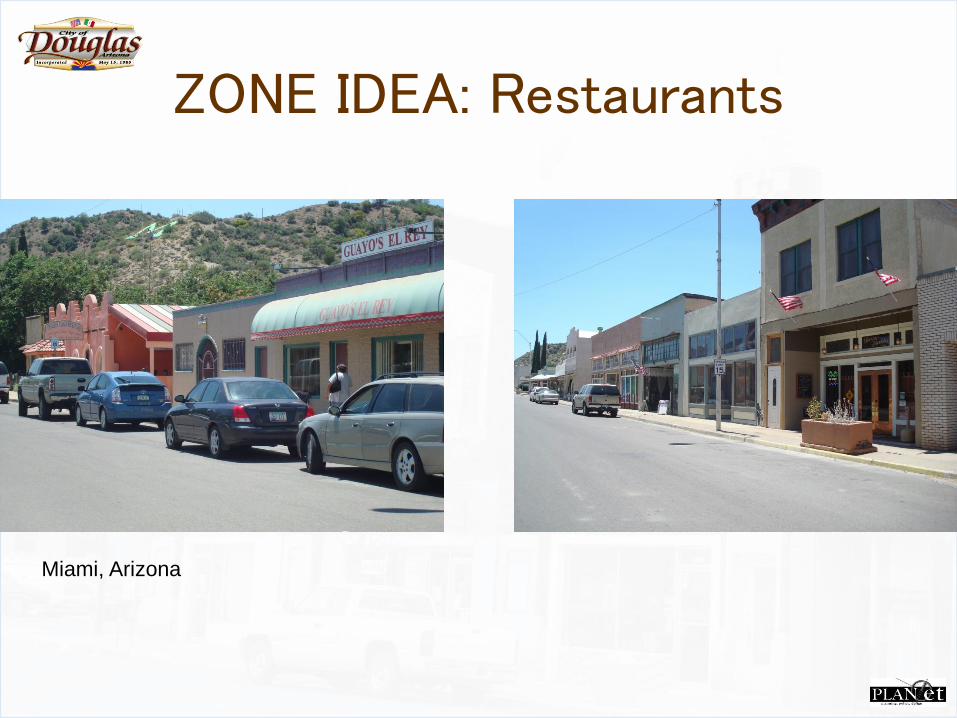
ZONE IDEA: Restaurants
Miami, Arizona

ZONE IDEA: Old West History
Slaughter Ranch, Arizona Pancho Villa George Washington Taverns
Pancho Villa

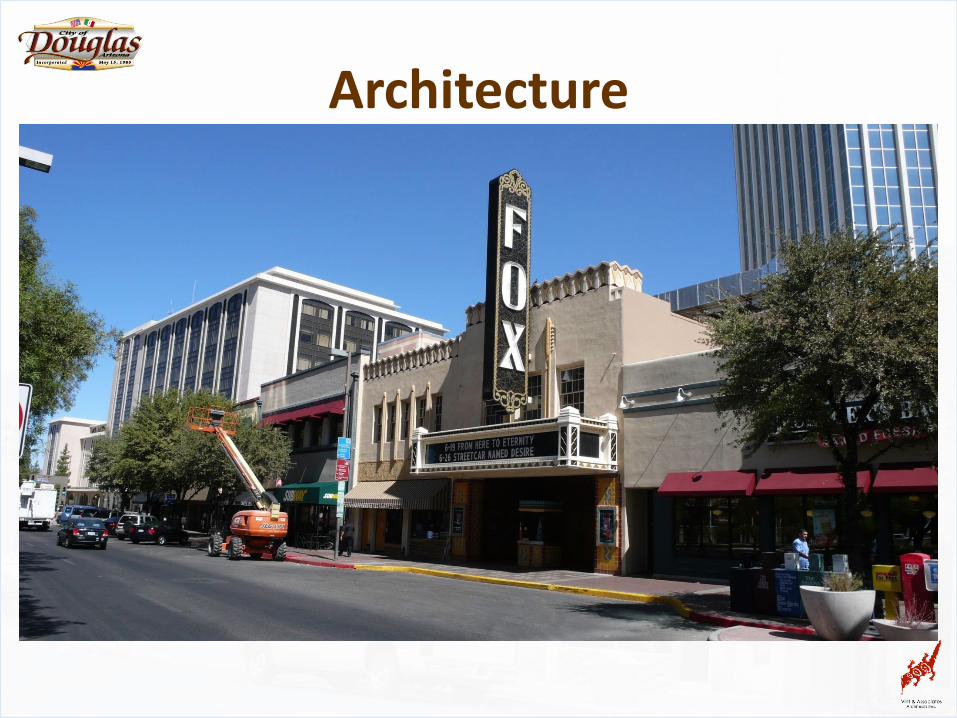
ZONE IDEA: Architecture
Globe, Arizona Tombstone, Arizona

ZONE IDEA: Arts/Culture
Tucson, Arizona Globe, Arizona
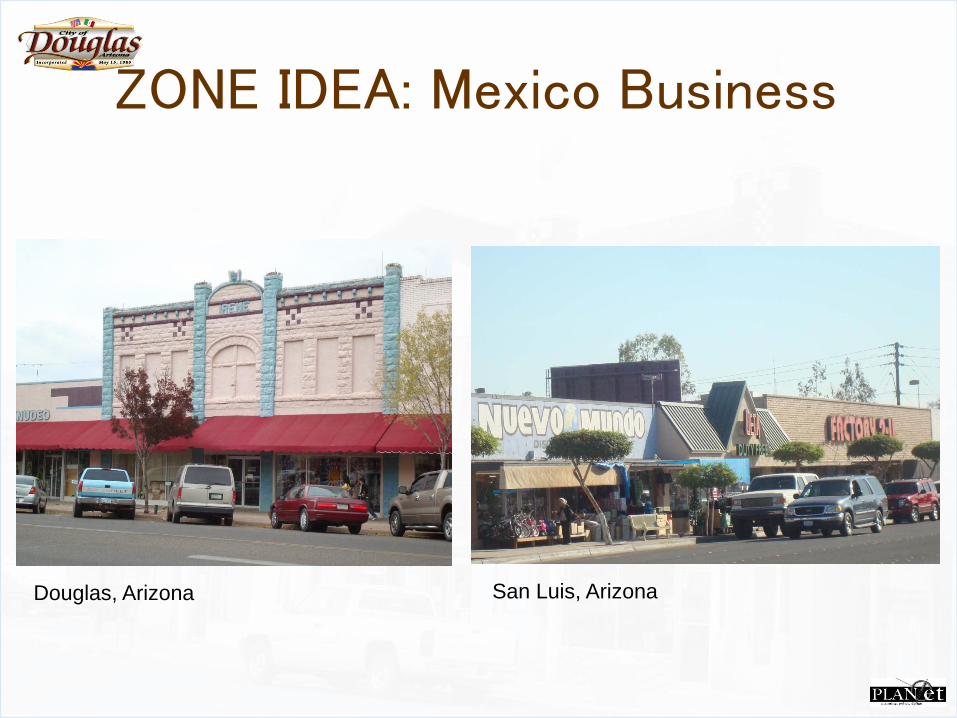
ZONE IDEA: Mexico Business
Douglas, Arizona San Luis, Arizona
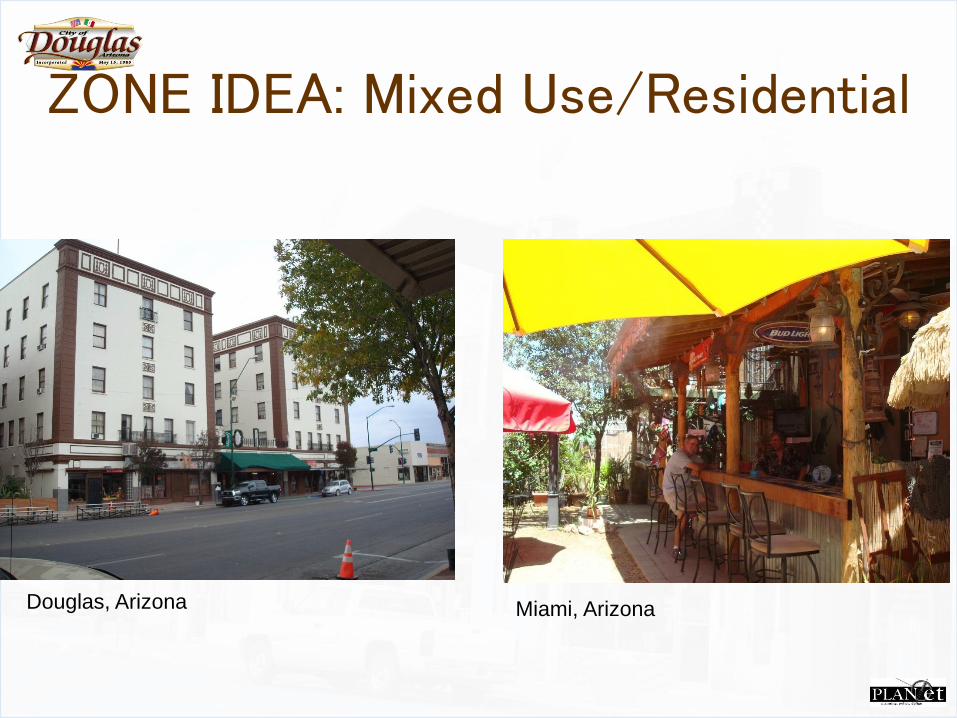
ZONE IDEA: Mixed Use/Residential
Douglas, Arizona Miami, Arizona

ZONE: Government Center
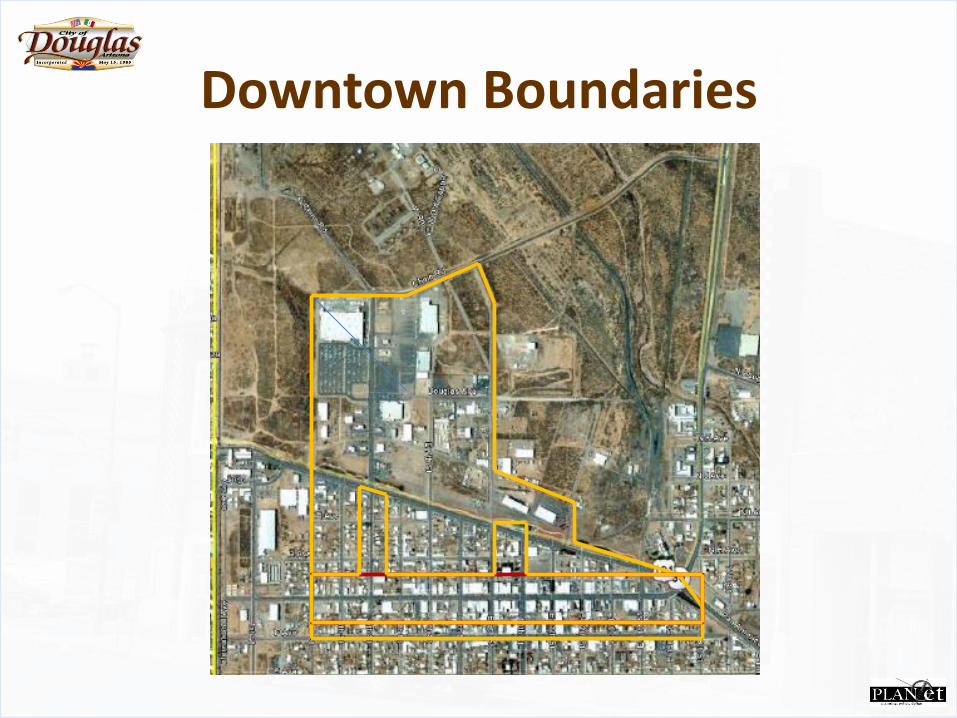
Downtown Boundaries
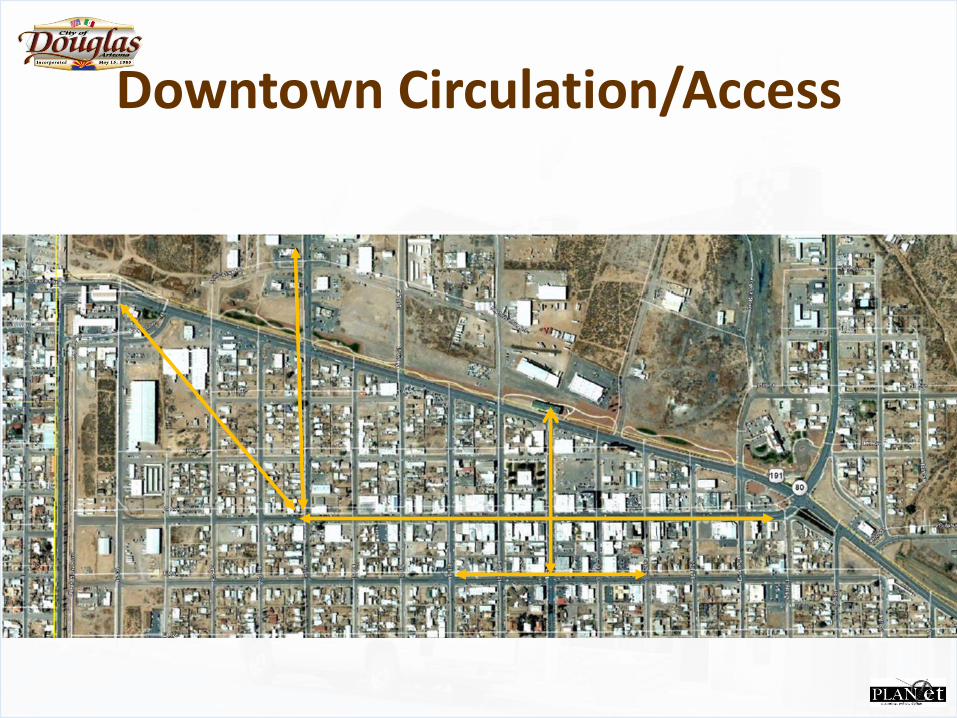
Downtown Circulation/Access
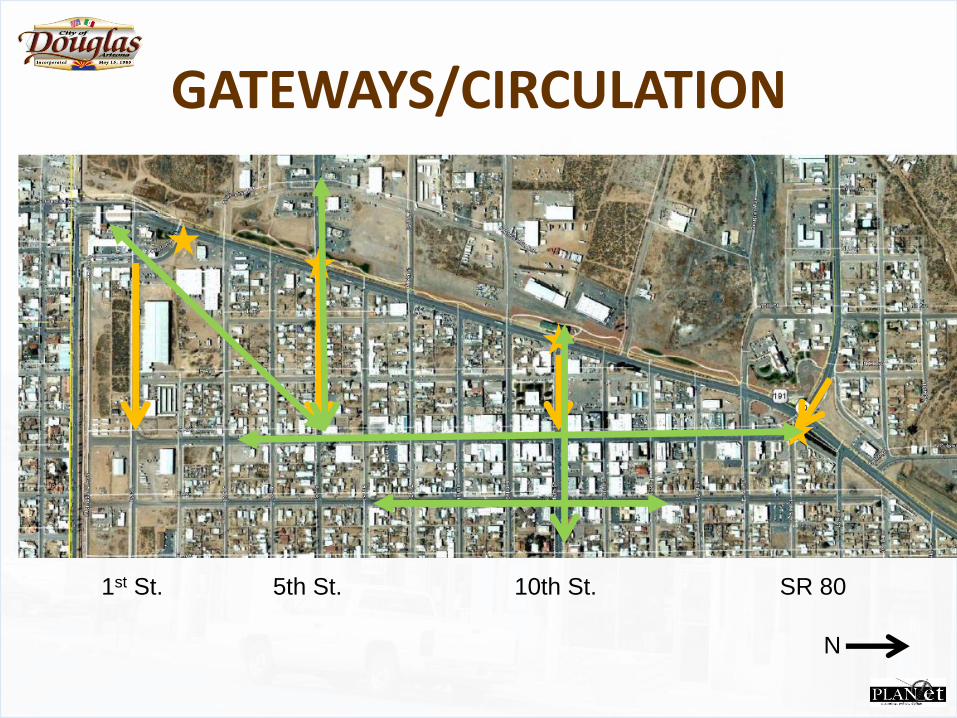
Downtown Gateways
1st St. 5th St. 10th St. SR 80
N
GATEWAYS/CIRCULATION

Downtown Gateways
McDowell Road, Phoenix Arizona Downtown Scottsdale, Arizona Globe, Arizona

Downtown Streetscape…
….establishes
a unique
identity & visual
character,
strengthens
community
sense of place,
is catalyst for
economic
development
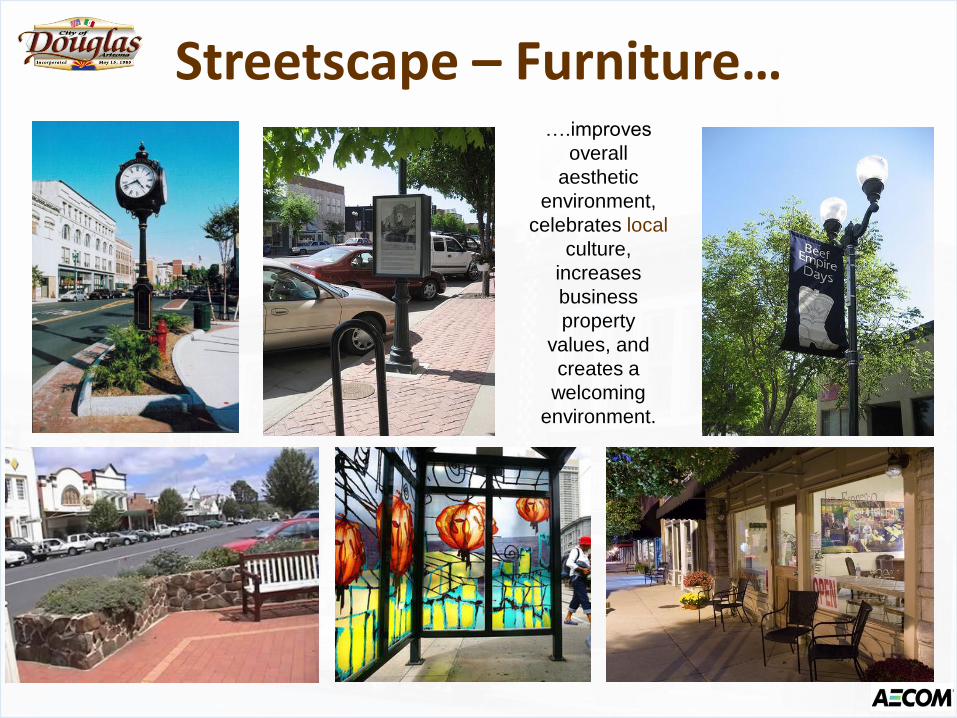
Streetscape – Furniture… ….improves
overall
aesthetic
environment,
celebrates local
culture,
increases
business
property
values, and
creates a
welcoming
environment.

Streetscape – Landscaping…
….adds value to the shopping and visiting
experience. Shrubs, trees, planters and parks are
essential to the downtown.

Streetscape - Colors
Mexican
inspired or
vibrant colors
for facades and
awnings


![Populärversion [100622]](https://img.dokumen.tips/doc/110x75/5486206fb4af9f586c8b45ff/populaerversion-100622.jpg)