Embed Size (px)
Citation preview

City of Concord Citywide Climate Action Plan
Public Review Draft | March 2013

This report takes into account the particular instructions and requirements of our client.
It is not intended for and should not be relied upon by any third party and no responsibility is undertaken to any third party. Job number 217805-00
Arup 560 Mission Street, Suite 700 San Francisco, CA 94105 USA www.arup.com

Report Ref | PUBLIC REVIEW DRAFT | MARCH 2013| Arup North America Ltd L:\PL\PLANNING\CLIMATE ACTION PLAN\CITYWIDE CAP PUBLICREVIEW DRAFT 2013 4 8.DOCX

City of Concord Citywide Climate Action Plan
PUBLIC REVIEW DRAFT | MARCH 2013| Arup North America Ltd
Contents Page
Acknowledgement i
Executive Summary ii
1. Introduction 1
1.1 Purpose 2 1.2 Background and Context 3 1.3 Concord Development Segments 4 1.4 Community Benefits from Greenhouse Gas Reductions 4
2 Climate Change and Concord 6
2.1 Projected Climate Change Impacts in California 6 2.2 Projected Climate Change Impacts in Concord 7
3 Greenhouse Gas Emissions: Existing and Future Conditions 9
3.1 2005 Baseline Emissions Inventory Approach 9 3.2 2020, 2030, and 2035 Business as Usual Forecast Emissions
Approach 11
4 Greenhouse Gas Emissions Reduction Targets 13
4.1 Targets Development 13 4.2 Regulatory Guidance 13 4.3 Forecasts Compared to Targets 14
5 Greenhouse Gas Reduction Program and Climate Change Adaptation 15
5.1 Implementation and Monitoring 16 5.2 Summary of Strategies 19
6 Buildings Performance Strategies — Energy, Water and Waste 21
6.1 Energy 22 6.2 Water 38 6.3 Waste 44
7 Transportation Systems and Land Use Strategies 46
8 Municipal Operations Strategies 75
8.1 Municipal Buildings and Other Facilities 77
City of Concord Citywide Climate Action Plan
PUBLIC REVIEW DRAFT | MARCH 2013| Arup North America Ltd
8.2 Municipal Vehicle Fleet 78 8.3 Employee Commute 78 8.4 Public Lighting 79 8.5 Water 79 8.6 Waste 80
9 Climate Change Adaptation Strategies 80
9.1 Adaptation Strategies 81 9.2 Climate Action Strategies Assisting Adaptation 86
10 Participation Strategies 87
10.1 How Community Members Can Help 87 10.2 Making Participation Easier 89
11 References 91
Appendices Appendix A Baseline Emissions Inventory Development Methodology.................................. A1
Appendix B Forecast Emissions Inventory Development Methodology .................................. B1
Appendix C Data Sources, Tools, and Models ......................................................................... C1
Appendix D Quantification Methods and Assumptions for Emissions Reductions ................. D1
Appendix E Implementation and Monitoring Program ............................................................ E1
Appendix F Supporting Files .................................................................................................... F1
Appendix G Regulatory Landscape........................................................................................... G1
Appendix H Qualified Greenhouse Gas Reduction Program .................................................... H1
City of Concord Citywide Climate Action Plan
PUBLIC REVIEW DRAFT | MARCH 2013| Arup North America Ltd
Tables Table 1: Co-Benefits from GHG Reduction and Adaptation Policies ..................... 5 Table 2: Citywide CAP GHG Emissions Targets .................................................. 13 Table 3: Regulatory Guidance ............................................................................... 13 Table 4: Summary of Quantified GHG Reductions by Sector .............................. 16 Table 5: Summary of All Citywide Climate Action Plan Strategies ..................... 20 Table 6: Transportation and Land Use Strategies: Summary of Emissions Reductions ............................................................................................................................... 47 Table 7: Municipal Operations Summary Forecast ............................................... 76 Table 8: Summary of Adaptation Strategies .......................................................... 82 Table 9: Summary of Adaptive Climate Action Strategies ................................... 86 Table 10: Ways to Participate in Climate Action .................................................. 87 Table B-1: Growth Factors by Emissions Source ................................................. B2 Table B-2: Concord Population and Growth Factors ........................................... B4 Table B-3: 10% Reduction in 2010 Fuel Carbon Intensity by 2020 .................... B5 Table B-4: Pavley Emissions Reduction to Light and Medium Duty Vehicles ... B6 Table B-5: California Vehicle Fleet by Model Year as counted in 2005 ............. B7 Table B-6: Forecasting Municipal Operations Emissions due to State MandatesB9 Table C-1: Emissions Factors and References by Sector ..................................... C4 Table D-1: Methods and Assumptions for Quantifying GHG Reductions ........... D1 Figures Figure 1: Citywide GHG Emissions by Source .......................................................... 10 Figure 2: Annual per Capita in MTCO2e Emissions by Source Type for Baseline and CAP Business as Usual Implementation Forecasts .................................................... 12 Figure 3: Targets and Forecasts Relating to the Concord Citywide CAP .................. 14 Figure 4: Components of Municipal Operations Baseline Emissions ........................ 75 Figure 5: Actions that Complement and Conflict with Adaptation to Climate Change .................................................................................................................................... 81 Figure G-1 Executive Order S-3-05 GHG Emissions Trajectory toward 2050 .... …..G2
City of Concord Citywide Climate Action Plan
Public Review Draft | March 2013 | Arup North America Ltd Page i
Acknowledgement The work which this publication is based on was funded in whole or in part by a grant awarded by the California Strategic Growth Council.
The statements and conclusions of this report are those of the City of Concord and Arup and not necessarily those of the Strategic Growth Council, the Department of Conservation or its employees. The Strategic Growth Council and the Department make no warrants, express or implied and assume no liability for the information in the succeeding text.
City of Concord Citywide Climate Action Plan
Public Review Draft | March 2013 | Arup North America Ltd Page ii
Executive Summary What is a Climate Action Plan? A Climate Action Plan serves as a community document that measures and monitors the trend of locally-generated greenhouse gas emissions. A Climate Action Plan uses this information about emissions to gauge the need for—and optimize effectiveness of—policies aimed at reducing such emissions. It sets local policy for how emissions will be reduced. These emissions reductions serve to reduce the community’s contribution to global climate change.
Why Prepare a Climate Action Plan? Concord is preparing this Citywide Climate Action Plan (CAP) in response to State mandates and regional guidance on reducing greenhouse gas emissions. The plan supports local economic development by providing streamlined environmental review for development projects consistent with the CAP.
What are the Key Features of the CAP? Integration of Concord Reuse Project
Much of the growth in Concord over the coming decades will be in the Concord Reuse Project area, site of the former Concord Naval Weapons Station. The Reuse Project features new, sustainable development and includes its own climate action plan. Because the CAP’s targets are measured on a per-capita basis, growth in the Reuse Project area will help the City meet its targets in the short term. The Reuse Project Area Plan, adopted in January 2012, includes a volume specifically focused on reducing greenhouse gas emissions.
Quality of Life and Long-Term Implementation
With the Reuse Project contributing significantly to meeting the City’s targets for climate action, the City is focusing the rest of its CAP strategies on improving quality of life for Concord residents and businesses This includes strategies that will make it easier for children to walk to school, encourage homeowners to reduce their energy bills by installing solar panels, and continue City efforts to plant low-water street trees and medians.
Economic Development
The quality of life benefits that will accrue over the long term will contribute to economic development over time as well as: pedestrian- and bicycle-friendly streets will support local commercial areas, including the downtown. In addition, local businesses will save money over time due to reduced energy costs, freeing up funds that could be used to further invest in the community either through additional building improvements or additional staff.

City of Concord Citywide Climate Action Plan
Public Review Draft | March 2013 | Arup North America Ltd Page iii
What are Concord’s Greenhouse Gas Emissions? The breakdown of Concord’s current annual emissions of carbon dioxide equivalent (greenhouse gases) is shown below. The major sources of greenhouse gas emissions are buildings (related to natural gas and electricity use) and automobiles (mobile on-road). Together, these are the focus of the strategies found in this CAP. 2005 Citywide GHG Emissions by Source
Source: Arup 2012
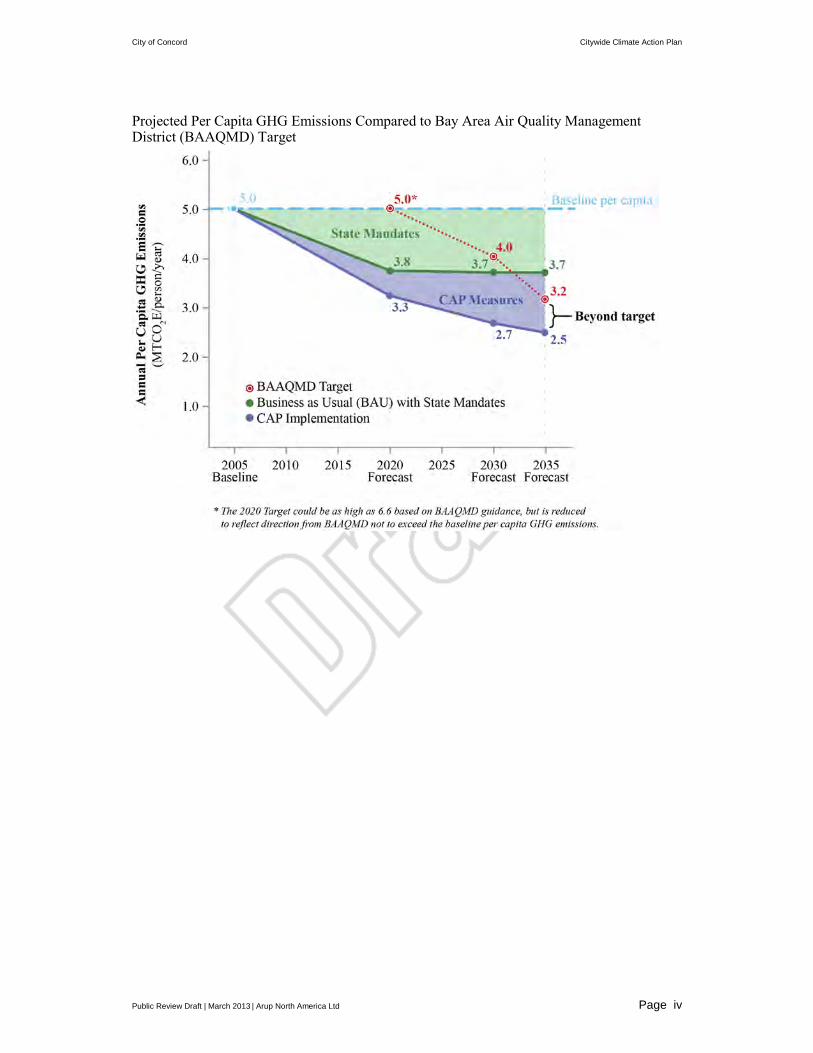
Concord Can Meet its Targets Concord has set targets for future greenhouse gas emissions consistent with State and regional guidance, as shown below. In the years 2020 and 2030, the Business as Usual (BAU) forecast, including State Mandates (fuel economy and building energy savings mandated by the State of California), meets the targets established in this CAP. In the year 2035, implementation of the measures in this CAP exceeds the target. It is important to create a buffer that goes beyond the target at this point because some greenhouse gas reduction strategies are uncertain over a long time horizon. The “extra” reductions projected provide a buffer from uncertainty, enabling the City to be confident that the 2035 target can be met. The Reuse Project Area Plan’s CAP contributes significantly to the City’s efforts to meet the target. It represents up to 44% of the Buildings Performance reductions and up to 78% of the Transportation Systems and Land Use reductions.
Natural Gas, 16%
Electricity, 16%
Mobile Off-road, 6%
Mobile On-road, 52%
Wastewater Treatment
<1%
Solid Waste Disposal, 9%
City of Concord Citywide Climate Action Plan
Public Review Draft | March 2013 | Arup North America Ltd Page iv
Projected Per Capita GHG Emissions Compared to Bay Area Air Quality Management District (BAAQMD) Target
City of Concord Citywide Climate Action Plan
Public Review Draft | March 2013 | Arup North America Ltd Page 1
1. Introduction Because of the risks to property, commerce, and quality of life associated with climate change, the State of California has begun to work toward reductions of GHG emissions statewide. These efforts include the landmark Assembly Bill 32 (AB32) calling for reductions in GHGs statewide by 2020 and Senate Bill 375 (SB375), which focuses on reductions in GHG emissions associated with transportation. These, and several other relevant legislative and administrative efforts, are described further in Appendix G of this plan, and serve as the two most important indications of the State’s commitment to reducing GHG emissions.
This Concord Citywide Climate Action Plan (CAP) has been prepared in response to mandates from the State of California intended to reduce the emission of greenhouse gases statewide, because of their contribution to global climate change. The City has identified the ways it will take action to support the State’s goals while supporting the local economy and quality of life.
The strategies included in this plan work in several ways:
Building Performance strategies save energy, water, and waste disposal costs through practical approaches for new, upgraded, and existing buildings. These strategies fill information gaps for local building owners and anticipate statewide efficiency requirements.
Transportation Systems and Land Use strategies make incremental, long-term improvements to increase the variety of viable transportation options within Concord and to make motor vehicle infrastructure more energy-efficient.
Adaptation strategies coordinate infrastructure plans and emergency response programs, support habitat adaptation, and outreach to building owners to adapt to energy supply shortages during peak periods.
Participation strategies applaud and engage local climate action leaders, and clearly identify the benefits of climate-friendly choices that community members can make, such as home retrofits, purchases large and small, energy choices, recycling, and water conservation.
Many strategies point out how City offices and facilities will modify their operations to help meet the Citywide goals and set an example for GHG-reducing choices, such as by conserving water and energy in facilities and on streets, improving municipal vehicle fleet efficiency, and expanding employee commute options. Where specific strategies, actions, and progress indicators relate to municipal operations, the City logo accompanies the text.
The City of Concord logo
City of Concord Citywide Climate Action Plan
Public Review Draft | March 2013 | Arup North America Ltd Page 2
The strategies in this document are in addition to CAP policies adopted in the Concord Reuse Project (CRP) Area Plan adopted in January 2012 for the site of the former Concord Naval Weapons Station. The strategies found in the CRP Area Plan CAP (CRP CAP) will enable the City to meet its GHG reduction targets in the short- and medium-term through the development of the CRP Area. The CRP CAP contributes significantly to the City’s efforts to meet the target. It represents up to 44% of the Buildings Performance reductions and up to 78% of the Transportation Systems and Land Use reductions, depending upon the level of building activity.
With the CRP CAP contributing so strongly to GHG reductions, the Citywide CAP strategies focus on actions that will meet the state-mandated requirements for GHG reductions in the long term. Building and transportation strategies will take quite a while to implement because outside of the Reuse Area most of Concord is already built-up. For example, through upgrades and infill development buildings will become more efficient. Streets will be refurbished over time as they are re-paved or development along them requires them to be upgraded.
The strategies are designed to provide many benefits to residents, businesses, and visitors to Concord, in addition to reducing GHG emissions. Building-related strategies will help the City, residents, and local builders upgrade or construct new structures that require less money to operate and prepare for standards being implemented at the State level, all while getting credit for reducing GHG emissions sooner.
The transportation-related strategies are supported by a related Complete Streets plan. ‘Complete streets’ are those that serve all people traveling in Concord: pedestrians, cyclists, drivers, transit riders, and freight operators. The complete streets planning effort includes changes to the City’s General Plan Transportation Element that provide policy and street design guidance that responds to the needs of pedestrians, cyclists, and other users on Concord’s streets. These changes to the Transportation Element will help qualify Concord for grant funds from the State and region, assisting with implementation over the long-term.
1.1 Purpose This Citywide CAP is intended to meet the State’s requirements for climate action while identifying opportunities to provide community benefits to residents and workers in the City of Concord. Its consistency with these requirements will allow the City to streamline environmental review of development projects within the City and thereby support a vibrant local economy.
In particular, the Citywide CAP meets the Bay Area Air Quality Management District’s (BAAQMD) requirements for a Qualified Greenhouse Gas Reduction Strategy and enables future projects in Concord to qualify for streamlined California Environmental Quality Act (CEQA) review1 with respect to GHGs. See Appendix H
1 The BAAQMD encourages local governments to adopt a qualified GHG Reduction Strategy that is consistent with AB32 goals. If a long-range plan includes goals, policies, performance standards, and
City of Concord Citywide Climate Action Plan
Public Review Draft | March 2013 | Arup North America Ltd Page 3
for details on how the CAP meets these requirements. As a Qualified Greenhouse Gas Reduction Strategy, following CEQA review, future development projects may rely upon the CAP to address the cumulative impacts for greenhouse gas emissions and climate change. Any project relying on the CAP for CEQA purposes must demonstrate consistency with the CAP.
1.2 Background and Context The Bay Area Air Quality Management District (BAAQMD) CEQA Guidelines2 state that “for local jurisdictions, the General Plan is perhaps the best venue for addressing GHG emissions in making meaningful progress toward attaining AB32 goals while addressing CEQA requirements.” See Appendix G for information about Assembly Bill 32 (AB32) and Senate Bill 375 (SB375), California’s greenhouse gas laws, which prompted preparation of this CAP. This Citywide CAP will be incorporated into the City’s General Plan by reference, setting the overall policy in the General Plan and providing specifics in this plan.
The City’s General Plan contains numerous goals and policies that support reductions in GHG emissions. In particular, the Land Use Element focuses new development around the Downtown Concord and North Concord Bay Area Rapid Transit (BART) stations, supporting efficient local transportation. The Transportation Element was revised in 2012 to provide an enhanced focus on ensuring walking, bicycling, and transit are viable transportation options in Concord.
The impetus for this Climate Action Plan began in the spring of 2006, when the City and its local and regional community stakeholders began work to define reuse of the former Concord Naval Weapons Station (Reuse Project Area), which represents one quarter of the City’s area. It adjoins the North Concord BART station and represents a unique opportunity to create sustainable development that reduces greenhouse gas emissions, preserves and restores natural habitat, and protects public health while providing a diverse range of housing, commercial, and retail opportunities for all economic levels.
The focus on sustainable development is reflected in Book 3 of the Area Plan, Climate Action. The Area Plan CAP (CRP CAP) was based on four key sets of strategies: Integrated Transportation and Urban Form; Building and Site Energy; Water and Waste; and Public Education/Collaboration. This Citywide CAP will ensure that the CRP CAP is fully implemented by creating supporting strategies for the other areas of the City.
Consistent with the CRP CAP, development to take place in the Reuse Project Area will be designed to support bicycling, walking, and transit use; include state-of-the-art green building techniques; and significantly reduce potable water use through
implementation measures achieving GHG emission reductions that can be shown to meet and/or exceed AB32 mandates, as outlined in Section 4.3 of the BAAQMD CEQA Guidelines, subsequent projects consistent with the plan could be relieved of performing GHG analysis as part of their CEQA compliance. This approach is consistent with the State CEQA Guidelines, Section 15183.5. 2 BAAQMD 2012B

City of Concord Citywide Climate Action Plan
Public Review Draft | March 2013 | Arup North America Ltd Page 4
landscape and facility design. In contrast, the rest of Concord is essentially built-out, so change will take place more incrementally and within the existing suburban context.
1.3 Concord Development Segments This CAP covers the whole City of Concord. However, some of the ways the City will be taking climate action over the coming years are most applicable to particular segments of the community as described here:
• Segment 1: Concord Reuse Project Area (i.e., Concord Naval Weapons Station Inland Area)
• Segment 2: Infill Development (i.e., all new growth after 2005 within Concord outside of the Concord Reuse Project Area)
• Segment 3: Existing Development (i.e., the residential population and employment that exists in the 2005 base year)
Many of the strategies found in this plan are targeted to segments 1, 2, or 3. For example, green building regulations for new buildings that reflect the State’s efforts to reduce energy use associated with buildings are focused on infill development, while pedestrian and bicycle master plans serve a citywide function and apply to the whole City of Concord.
1.4 Community Benefits from Greenhouse Gas Reductions
In any GHG reduction effort it is important to realize that most people do not adopt behaviors that reduce greenhouse gases primarily for the sake of the environment. Cost savings, health benefits, social approval, and reducing risks are the most common reasons for choices that happen to be more sustainable. Fortunately, greenhouse gas reducing behaviors have many additional benefits that can be the primary motivators:
• Saving money • Avoiding risks/hazards • Increased ease and comfort • Better health • Social recognition and status • Sense of purpose and common goals

City of Concord Citywide Climate Action Plan
Public Review Draft | March 2013 | Arup North America Ltd Page 5
The CAP strategies will reduce GHG emissions and prepare the community of Concord for possible climate changes in the future. Some specific examples of the additional benefits, called co-benefits, are shown in Table 1. 3
Table 1: Co-Benefits from GHG Reduction and Adaptation Policies Co-benefit How it works Supporting strategies
Healthier Travel Bicycle and pedestrian travel improvements provide options to increase physical activity.4
Transportation and Land Use strategies
Local Economic Benefits
Increased pedestrian and bicycle activity in downtown commercial areas have been linked to more successful downtown commercial areas.5
Transportation and Land Use strategies TL1,4,8,12, 21
Healthier Air (e.g., reduced onset of asthma in children6).
Reduced pollution from motor vehicles from cleaner vehicles and reduced motor vehicle travel.7
All strategies in Transportation and Land Use and State mandates cleaning up fuels.
Safer Streets Reduced motor vehicle speeds due to traffic calming.8 Pedestrian and bicycle-friendly streets. 9
Transportation and Land Use strategies TL1,3,4,6,9, 11,
Energy Savings Reduced energy use in buildings and other facilities. Participation in Demand Response Program incentives.
Buildings strategies BE1-8
Water Cost Savings Reduced water use in buildings and other facilities.
Buildings strategies BH1 and BH3
Waste Disposal Savings
Reduced volumes of waste sent to landfill, lower operations and construction costs for new and existing landfills.
Buildings strategy BW1
3 For a quantitative and comprehensive discussion of health co-benefits of larger reductions in GHG emissions from transportation in the Bay Area, see Maizlish, Neil et al. 2011. 4 Sallis et al, 2009. 5 Bent and Singa, 2009. For discussions of how pedestrian activity increases with shorter blocks and other design features, see Marshall and Garrick 2010, as well as Ewing and Cervero 2010. 6 Health Effects Institute 2010 notes that motor vehicles are a significant source of urban air pollution, and are especially health-impacting to people living and working within close proximity of busy highways and roads despite more stringent emissions controls currently in place. Links from traffic-related exposure to childhood on-set pulmonary disease are approaching sufficiently causal (rather than just "suggestive"), while causal links to other chronic diseases and overall mortality are suggestive though not yet sufficiently proven in the literature. 7 See Appendix D for detailed quantification of this factor. 8 Litman 1999 summarizes numerous studies linking lower vehicle speed to reduced crashes and injuries, and links traffic calming interventions to lower vehicle speeds. 9 Community Preventative Services Task Force 2004. A task force appointed by the US Centers for Disease Control reviewed research and found that policy instruments (like building codes, roadway design standards, and other environmental changes) as well as design approaches (like improved street lighting, infrastructure projects to increase safety of street crossing, use of traffic calming approaches, and enhancing street landscaping) resulted in a 35% median improvement in some aspect of physical activity (e.g., number of walkers or percent of active individuals).

City of Concord Citywide Climate Action Plan
Public Review Draft | March 2013 | Arup North America Ltd Page 6
Taken together, these benefits add to the positive impact of this CAP. The Concord community can take pride in reducing emissions that cause climate change, while making improvements to the City’s overall comfort and livability.
2 Climate Change and Concord Thousands of scientists agree: climate change is now underway globally and in all California communities. Concord and other communities throughout the State are doing their part to reduce their contribution to this phenomenon, but those efforts will not halt climate change right away. So, it is important to understand what is expected to happen in California and particularly in Concord. Because climate change is a global phenomenon, its effects are difficult to pinpoint in both timing and severity. The sections in this chapter describe the best available information about impacts in California and Concord. Actions such as those detailed in this CAP are expected to reduce these impacts over time.
2.1 Projected Climate Change Impacts in California Direct impacts in California are expected to include higher average temperatures, more frequent and intense heat-waves, more severe storm events, and sea-level rise. These direct impacts result in significant secondary impacts including:
• Increased air pollution10 • More frequent and intense wildfires11 • More frequent and intense droughts12 • More severe flooding13 • Higher demand for electricity14 • Disruption of native ecosystems15 • Rising costs for many agricultural, marine, and forest products16 • Loss of Sierra snowpack and related resources17 • Intrusion of saltwater into groundwater supplies18
10 Public Policy Institute of California, 2008A. 11 California Energy Commission, 2011. 12 California Energy Commission, 2012. 13 San Francisco Bay Conservation and Development Commission, 2011. 14 Public Policy Institute of California, 2008A. 15 Public Policy Institute of California, 2008A. 16 California Energy Commission, 2012. 17 San Francisco Bay Conservation and Development Commission, 2011. 18 Pacific Council on International Policy, 2010.

City of Concord Citywide Climate Action Plan
Public Review Draft | March 2013 | Arup North America Ltd Page 7
2.2 Projected Climate Change Impacts in Concord Climate change will not impact the Concord community uniformly. People, families, and groups with fewer resources and less mobility will be more vulnerable to the effects of global warming and warrant special attention in climate adaptation plans. For example, people more susceptible to respiratory or heat-related illnesses include children, elderly people, and people with compromised health.
Compared with many of California’s communities, Concord will likely experience milder versions of several climate change effects:
• Average annual temperatures are expected to rise less by the end of the twenty-first century (around 4 degrees Fahrenheit) for Concord than for inland communities, such as Sacramento (around 6 degrees Fahrenheit).19
• Wildfire risk is projected to decrease in the areas around Concord in 2020, 2050, and beyond. This is in contrast to many areas of the state where wildfires are likely to become more severe and more frequent.20
• Sea-level rise of nearly five feet is not expected to increase flood risk in the City, although the Buchanan Airport may flood where it borders the City for more than 1.5 feet of rise. A report on sea level rise in the Bay Area in 2011 estimated that local sea levels will rise 1.3 feet by mid‐century and 4.5 feet by the end of the century.21
Nevertheless, serious impacts are projected to affect Concord. City, State, and other community efforts are ultimately expected to reduce the following impacts, but not before many of them begin to take effect.
• Higher risks of illness: respiratory, heat-related, or vector-borne.22 Hotter days will become more common in Concord. In 2035 Concord is expected to have 29 days when temperatures exceed 94 degrees compared to 7 such days in 2010. Corresponding heat-related illnesses such as heat exhaustion and stroke are likely to be more frequent, especially among older people. 23 Air pollution is likely to increase in Concord and aggravate respiratory illnesses and others.24 After warm-weather rains, mosquitoes can breed quickly and increase infection with illnesses such as West Nile Virus or new viruses.25
• Risks to habitats and wildlife. Climate changes may force plants and animals to change locations or risk extinction.26 Worldwide 20 to 30 percent of plant and animal species are at risk of extinction if global temperatures rise in excess of 2.7
19 California Energy Commission, 2012. 20 California Energy Commission, 2012. 21 San Francisco Bay Conservation and Development Commission, 2011. Page 44. 22 Public Policy Institute of California, 2008A. 23 Public Policy Institute of California, 2008A. 24 US EPA, 2012B. 25 Public Policy Institute of California, 2008A. 26 Public Policy Institute of California, 2008A.

City of Concord Citywide Climate Action Plan
Public Review Draft | March 2013 | Arup North America Ltd Page 8
to 4.5 ºF.27 As the climate changes, some species with small habitat ranges may find that their habitat is no longer suitable for them. Also, protected habitats currently available may no longer be suitable for local species, which require special approaches to ensure their futures, especially for endemic species.28
• Damage to regional transportation infrastructure. The nearest highways to the City of Concord, including I-680, SR-242 and SR-160 will not likely be flooded. However, several state highways, such as SR 160 and SR 12, that cross islands in the Sacramento Delta are projected to be flooded by sea level rise, which could alter traffic patterns around Concord by requiring traffic to be rerouted to Highways 680 and 80.29
• Rising costs for food, electricity, and insurance. Climate change may pose challenges to the agricultural, power, and insurance industries. Farmers and ranchers in the United States will likely face increasing pests, weeds, and extreme weather events, as well as reduced growing seasons for staple crops in most of central North America.30 This challenge to agriculture is expected to result in higher food prices. Similarly, extreme weather events and reduced snowmelt will likely impact energy production processes, even while increasing temperatures demand more energy at peak periods.31 As weather-related crises increase in severity, insurance costs for residents and businesses are expected to rise.32
• Risks to water quality and supply. Water provision will likely become more difficult for Concord’s water supplier, Contra Costa Water District (CCWD), as well as for many areas of the State. Saltwater from the San Francisco Bay may flood key surface facilities and contaminate groundwater.33 This contamination, called saltwater intrusion, would result from a trio of factors: sea-level rise, reduced groundwater flows from the Sierras, and rising salt concentrations in the Bay. Areas near CCWD’s Mallard Reservoir and portions of the Contra Costa Canal may be vulnerable to sea-level rise. Rising salt concentrations threaten to push underground into the water table, reducing the quality of local well water.
27 Intergovernmental Panel on Climate Change, 2007. 28 Public Policy Institute of California, 2008A. 29 Public Policy Institute of California, 2008A. 30 US EPA, 2012A. 31 United States Global Change Research Program, 2009. 32 United States Global Change Research Program, 2009. 33 Means et. al. 2010.

City of Concord Citywide Climate Action Plan
Public Review Draft | March 2013 | Arup North America Ltd Page 9
3 Greenhouse Gas Emissions: Existing and Future Conditions
The City of Concord has prepared a baseline emissions inventory for 2005 and has forecast emissions inventories for 2020, 2030, and 2035. The purpose of the inventories is to understand the major sources of Concord’s GHG emissions so this CAP can target its approach to emissions reductions appropriately. Each of these inventories is described in the following sections. Appendices C and D identify all data sources, assumptions and methodologies so that the inventories may be replicated in future years.
3.1 2005 Baseline Emissions Inventory Approach The City has prepared a baseline emissions inventory to understand the sources of its current emissions. The inventory serves as the basis for forecasting future emissions.
The year 2005 was selected as the baseline year for several reasons:
(1) SB375 requires regional emissions reductions from cars and light trucks by 7% in 2020, and 15% in 203534, relative to 2005 emissions, and
(3) 2005 is a common baseline year for cities, which allows benchmarking of Concord’s emissions relative to other cities of similar size and climate conditions.
The Citywide 2005 Baseline GHG emissions come from the following sources:
• On-road – Emissions from cars and trucks, based on the total number of vehicle miles travelled (VMT) for all trips that begin and end in Concord and half of the total vehicle miles travelled for all trips that either begin or end in Concord.
• Off-road – Emissions are based on hours of operation of off-road equipment including, construction equipment, landscaping equipment, all-terrain vehicles (ATVs), and other small sources owned by Concord businesses and residents.
• Electricity – Emissions from the electricity used in residential, commercial and industrial buildings or building construction, and also includes electric-powered public infrastructure such as public streetlights and traffic signals.
• Natural Gas - Emissions from the natural gas used in residential, commercial and industrial buildings.
• Water – Emissions from energy associated with water and wastewater treatment and conveyance, as well as the emissions released during the process of wastewater treatment.
• Waste – Emissions from energy used in waste management (such as waste hauling, waste processing and waste disposal operations), as well as emissions that are released when waste breaks down.
34 MTC 2010

City of Concord Citywide Climate Action Plan
Public Review Draft | March 2013 | Arup North America Ltd Page 10
Concord’s 2005 community-wide GHG emissions total just under one million metric tons carbon dioxide equivalent35 (928,497 MTCO2e). Concord is similar to other cities in California without significant industrial energy users: transportation emissions and buildings are the two largest sources. On- and off-road vehicles emit 58% of Concord’s GHGs, and electricity and natural gas serving buildings emit another 32%.
The breakout of baseline emissions by source type is shown in Figure 1.
Figure 1: 2005 Citywide GHG Emissions by Source
Source: Arup 2012
More details on the specific emissions by source and the baseline inventory methodology are presented in Appendix A. All models and tools used to produce the baseline emissions inventory are described in Appendix C.
35 The City of Concord has evaluated emissions of carbon dioxide (CO2), methane (CH4), and nitrous oxide (N2O). These gases represent the vast majority of GHG emissions. Each gas has a different potential to increase global warming e.g., emitting the same amounts of CO2 and CH4 will have different impacts to global warming. The factors measuring the differences in impact between gasses are called the Global Warming Potential (GWP) factors. The GWP factors are used in this analysis to compare emissions of GHGs according to the Carbon Dioxide Equivalent (CO2e) of their impact to global warming. This facilitates comparison of total emissions across sectors, across years, and across municipalities regardless of the composition of the emissions profile (i.e., which gases are emitted). CN4 and N2O emissions were converted to CO2 equivalent using GWPs from the Intergovernmental Panel on Climate Change Second Assessment Report published in 1995. The GWPs for CH4 and N2O are 21 and 310, respectively.
Natural Gas, 16%
Electricity, 16%
Mobile Off-road, 6%
Mobile On-road, 52%
Wastewater Treatment
<1%
Solid Waste Disposal, 9%

City of Concord Citywide Climate Action Plan
Public Review Draft | March 2013 | Arup North America Ltd Page 11
3.2 2020, 2030, and 2035 Business as Usual Forecast Emissions Approach
Using the baseline inventory for 2005, the City has forecast GHG emissions for the future years being monitored in this CAP. These forecasts show what GHG emissions would be in these years without implementation of the CAP, helping the City demonstrate how its work and the State Mandates describe below result in reduced emissions.
The benchmark years for the community-wide GHG emission forecast inventories were selected for the following reasons:
2020: to reflect the AB32 benchmark year
2030: to reflect the City’s General Plan horizon and the projected build out year of the 5,000-acre CRP Area
2035: to allow for an assessment of the City’s ability to help meet regional emissions reductions targets under SB375.
Three projections have been prepared for each year:
• Business-as-Usual reflects emissions expected under current trends, policies, and practices in the City of Concord. The 2020, 2030, and 2035 business-as-usual forecasts were developed from the 2005 baseline inventory using growth factors reflecting residential population and employment growth and emissions growth projected in the CRP CAP.
• Business-as-Usual with State Mandates reflects emissions expected under current trends, policies, and practices in the City of Concord, with the incorporation of best-case-scenario reductions from three State mandates: the low carbon fuel standard (LCFS), Pavley (pollution control standards for vehicles), and the Renewable Portfolio Standard (RPS), all of which are described further in Appendix G. Although these State mandates are expected to make huge strides in reducing GHG emissions statewide, they may not achieve their full potential during the mandated timeframe because of the large-scale, systemic nature of the changes they are striving to make. For this reason, the Concord Citywide CAP will achieve additional reductions to provide a “buffer” ensuring that its target is reached even if the benefits of the State mandates are not fully realized.
• CAP Implementation reflects GHG reduction measures included in the CAP designed to reduce GHG emissions, with a focus on the transportation and building sectors that emit the majority of GHGs. This category also benefits from the significant reductions associated with implementation of State mandates.
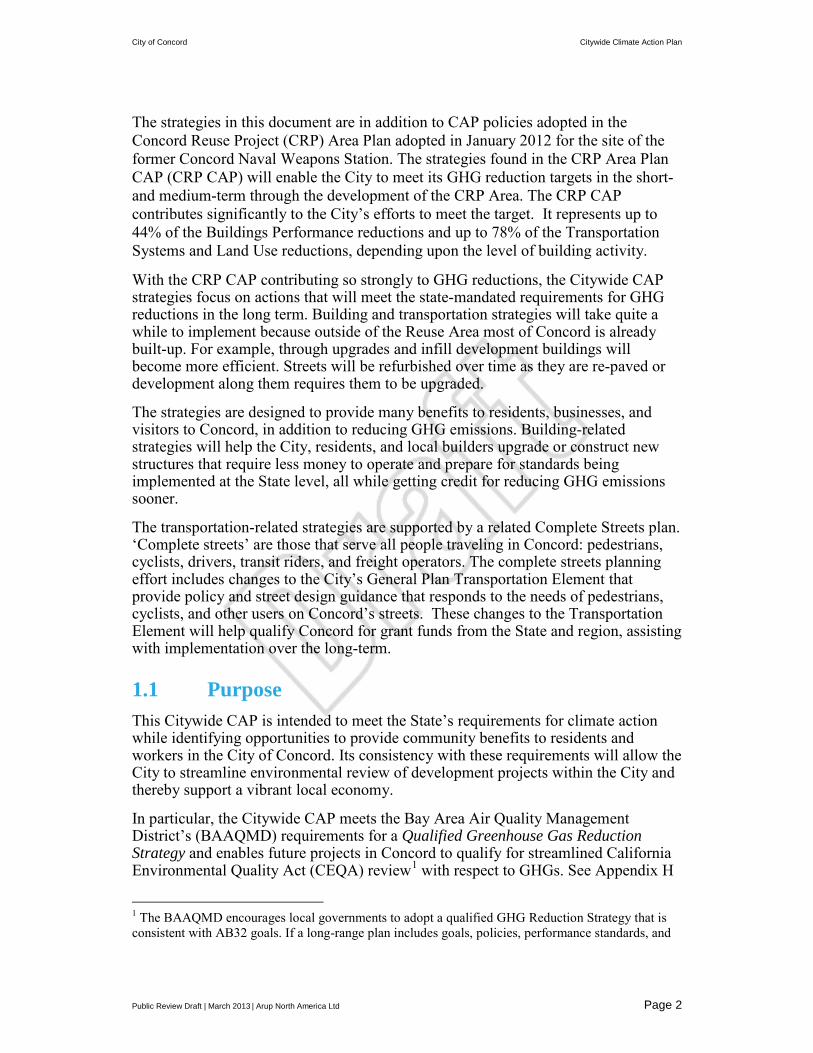
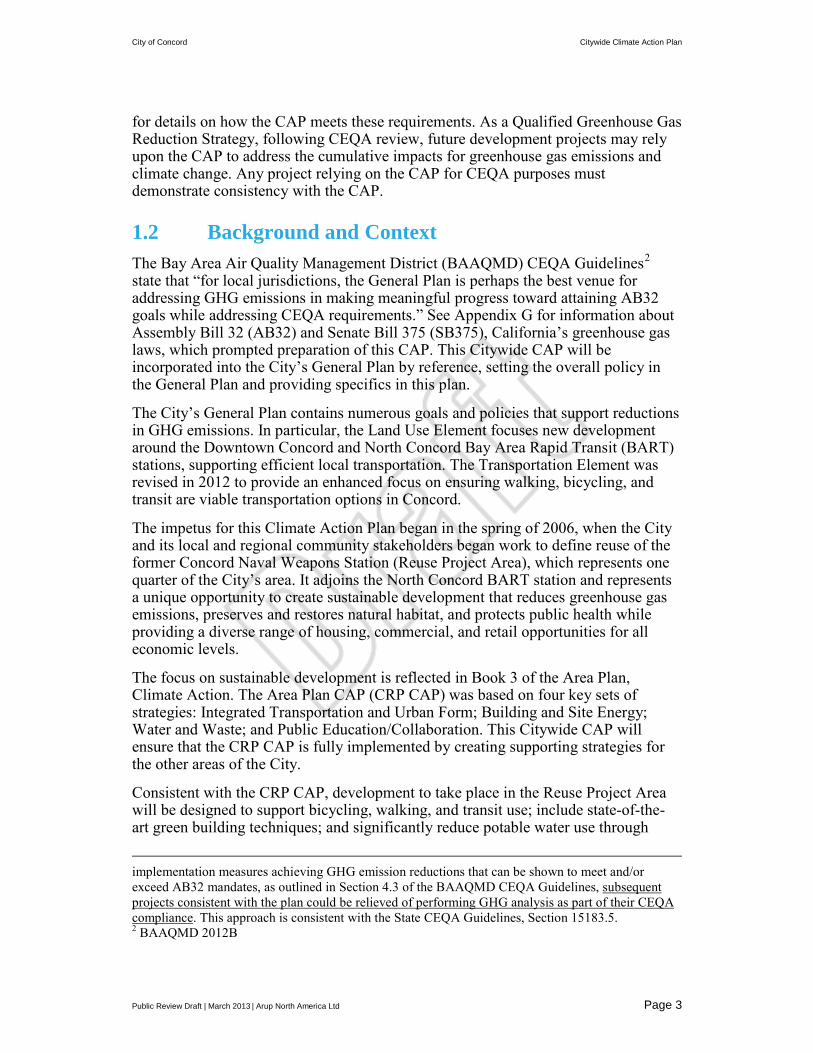
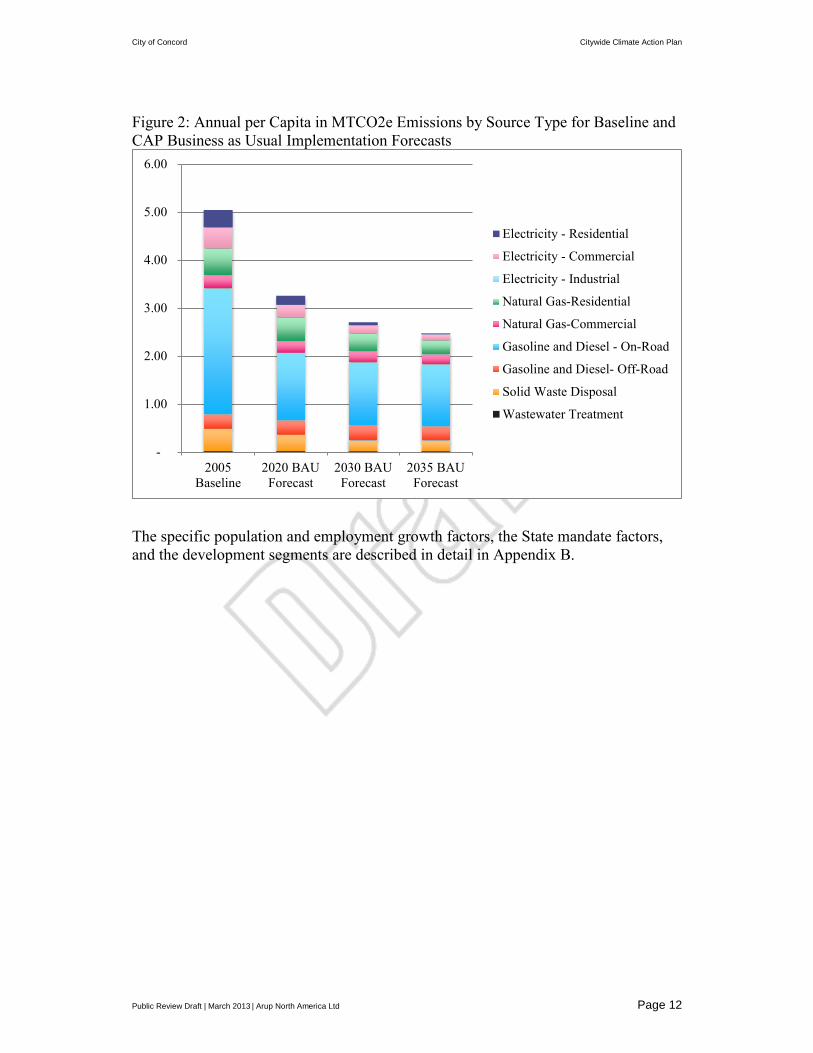
As shown in Figure 2, the distribution of emissions from various source types remains similar across each of the emissions forecasts, with some variance due to the relative effectiveness of strategies within each sector.
City of Concord Citywide Climate Action Plan
Public Review Draft | March 2013 | Arup North America Ltd Page 12
Figure 2: Annual per Capita in MTCO2e Emissions by Source Type for Baseline and CAP Business as Usual Implementation Forecasts
The specific population and employment growth factors, the State mandate factors, and the development segments are described in detail in Appendix B.
-
1.00
2.00
3.00
4.00
5.00
6.00
2005Baseline
2020 BAUForecast
2030 BAUForecast
2035 BAUForecast
Electricity - Residential
Electricity - Commercial
Electricity - Industrial
Natural Gas-Residential
Natural Gas-Commercial
Gasoline and Diesel - On-Road
Gasoline and Diesel- Off-Road
Solid Waste Disposal
Wastewater Treatment

City of Concord Citywide Climate Action Plan
Public Review Draft | March 2013 | Arup North America Ltd Page 13
4 Greenhouse Gas Emissions Reduction Targets
4.1 Targets Development The CAP Implementation emissions forecasts for 2020, 2030, and 2035 will be compared with (1) BAAQMD’s 2020 CEQA plan-level threshold to demonstrate the CAP’s ability to meet the CEQA thresholds of significance and (2) an extrapolated CEQA per capita target for the 2030 and 2035 timeframes based on the BAAQMD CEQA Guidelines. While the BAAQMD 2020 plan-level threshold is 6.6 metric tons CO2e/person/year, it would be contrary to the purpose of this CAP to include a target that is higher than current emissions. BAAQMD’s guidance in this situation was to use the baseline figure as a target for 2020, focusing on greater reductions for 2030 and 2035, as shown in Table 2.36
Table 2: Citywide CAP GHG Emissions Targets Metric tons CO2e per year
2020 2030 2035
Concord citywide target: per person* 5.0** 4.0 3.2
Citywide emissions target: total 1,078,632 1,117,080 959,474 * Number of people includes both residents and employees in Concord. ** The 2020 target could be as high as 6.6 metric tons CO2e per person per year based on BAAQMD guidance, but is reduced to reflect direction from BAAQMD not to exceed the baseline per capita figure of 5.0.
4.2 Regulatory Guidance The emissions reduction targets are aligned with the regulatory guidance applicable to the City of Concord. These include per capita emissions intensity metrics, and percent reduction metrics, as shown in Table 3.
Table 3: Regulatory Guidance Regulatory Requirements Metric tons CO2e per person per year
2020 2030 2035 BAAQMD CEQA* and ** (Project-Level)
4.6 2.8 2.2
BAAQMD CEQA* and ** (Plan-Level)
6.6 4.0 3.2
AB32 / Executive Order S-3-05 (Trajectory to 2050)
9.6 5.8 4.6
36 Abby Young, BAAQMD. Personal telephone communication with Dahlia Chazan, Arup. December 4, 2012.

City of Concord Citywide Climate Action Plan
Public Review Draft | March 2013 | Arup North America Ltd Page 14
Regulatory Requirements Metric tons CO2e per person per year
2020 2030 2035 SB375 (cars and light trucks only)
7% reduction below 2005
N/A 15% reduction below 2005
*The BAAQMD released the 2020 figures as CEQA thresholds of significance on June 2, 2010. On March 5, 2012, BAAQMD received a court order finding that the thresholds constituted a project under CEQA, but not commenting on the content of the thresholds. BAAQMD is appealing but cannot enforce these thresholds until the legal case is resolved.
**The 2030 and 2035 BAAQMD CEQA targets have been extrapolated from the BAAQMD 2020 target using the Executive Order S-3-05 emissions trajectory.
4.3 Forecasts Compared to Targets As shown in Figure 3, the BAU scenario with State Mandates exceeds the City’s 2020 and 2030 emissions targets. The City will need to start working toward its 2035 target before 2035 because many of the implementation measures needed to achieve the 3.2 MT CO2equivalent per capita target require quite a while to take effect. The development in the Concord Reuse Project Area will address a significant portion of the required reduction for 2035 because the Area Plan includes extensive greenhouse gas reduction measures, which are readily incorporated into new construction supported by a new transportation network and other infrastructure.
Figure 3: Targets and Forecasts Relating to the Concord Citywide CAP

City of Concord Citywide Climate Action Plan
Public Review Draft | March 2013 | Arup North America Ltd Page 15
5 Greenhouse Gas Reduction Program and Climate Change Adaptation
Chapters 6 through 9 describe this CAP’s greenhouse gas reduction program, as well as the City’s strategies for adapting to the effects of climate change. As described in Chapter 4, the City can demonstrate sufficient greenhouse gas reductions to meet its target in 2020 and 2030 through implementation of the Community Reuse Project Area Plan. But, by 2035, it will need to reduce those emissions through strategies that take place in the rest of the City. The following chapters include strategies that will benefit the community in the short- and medium-term. Some will take years, sometimes even decades to fully realize their greenhouse gas savings.
All strategies included in the following chapters contribute to Concord’s greenhouse gas reductions. Each strategy, however, has characteristics that determine where it will be most applicable. This is evident in the segments of the City described in Section 1.3, earlier in this CAP. For example, citywide strategies will be relevant to the Concord Reuse Project area (Segment 1) as well as to the remainder of the City (Segment 2 - Infill and Segment 3 – 2005 existing development). In addition, some strategies are most applicable to a particular area or part of the City’s population, such as transportation strategies aimed at improving access to schools or City staff commuting to work at the Civic Center.
Certain strategies identified in this CAP are more detailed than others, depending on applicable time frames and scope and types of action. For example, a long-term and performance based strategy should be less detailed because it is intended to allow a spectrum of ways to achieve the noted, measurable ends, whereas actions-based strategies need to be more detailed to help guide implementing action toward the most optimal outcomes.
The CRP Area Plan includes a Greenhouse Gas Reduction Program that addresses energy, water, waste, transportation and land use, and cooperation and collaboration strategies. Further information about these strategies is provided in a box at the beginning of each topic-focused chapter that follows.
The total quantified GHG reductions described in Chapters 6 through 9 are shown in Table 4.
“The Air District encourages local governments to adopt a qualified GHG Reduction Strategy that is consistent with AB32 goals. If a project is consistent with an adopted qualified GHG Reduction Strategy that meets the standards laid out below, it can be presumed that the project will not have significant GHG emission impacts. This approach is consistent with the State CEQA Guidelines, Section 15183.5.” -- BAAQMD CEQA Guidelines (May 2012) See Appendix H for details on how this CAP meets the requirements of the BAAQMD CEQA Guidelines for a Qualified Reduction Strategy

City of Concord Citywide Climate Action Plan
Public Review Draft | March 2013 | Arup North America Ltd Page 16
Table 4: Summary of Quantified GHG Reductions by Sector
SECTOR
GHG Emissions Reductions (Metric tons CO2e per year) Includes CRP CAP reductions.
in 2020 in 2030 in 2035
Buildings Performance 85,782 246,530 330,263
Citywide CAP 49,790 138,793 215,788
CRP CAP 35,992 107,737 114,475
Transportation Systems and Land Use 24,258 39,264 43,394
Citywide CAP 5,244 11,814 13,823
CRP CAP 19,014 27,450 29,571
Municipal Operations* 2,027 2,027 2,027
TOTAL 110,040 285,794 373,657
REDUCTION TARGET None required** None required** 156,137
*These are counted in the Buildings Performance and Transportation Systems and Land Use figures and called out here to highlight the impact of the City’s actions to reduce greenhouse gases. **2020 and 2030 BAU forecasted emissions are lower than the City’s per-capita target, so no reductions are required in those years.
5.1 Implementation and Monitoring One of the most practical reasons for implementing this plan is to assist development projects in streamlining CEQA review with respect to GHG emissions. BAAQMD monitors this streamlining process and has indicated that measurable and timely plan implementation is key to successful streamlined review.
The implementation and monitoring sections associated with each sector in the upcoming chapters commit the City to take specific action over time to ensure that the CAP is fully implemented, remains current by incorporating new technologies as they emerge, and achieves the stated goal of greenhouse gas reduction. In addition to the benefit of reduced greenhouse gas emissions, the strategies in this Citywide CAP will benefit Concord residents, businesses, and visitors through improved health, cost savings, and increased economic vitality. City implementation of these strategies and monitoring of their success is described in this chapter. See Appendix E for a timeline of implementation actions.
The City’s monitoring consists of two elements. The first element is to monitor Citywide CAP implementation by asking the question, “are we doing what we said we would do?” To answer this question, the City will track implementation activities and progress indicators for each strategy. The second element is to evaluate the effectiveness of the Citywide CAP as a whole by asking the question, “are we achieving the emissions reduction goal?” To answer this question, the City will regularly perform a community-wide greenhouse gas inventory. These two monitoring elements are described in more detail below.

City of Concord Citywide Climate Action Plan
Public Review Draft | March 2013 | Arup North America Ltd Page 17
5.1.1 Implementation Each strategy in the Citywide CAP contributes to GHG reductions. While most of the strategies have specific GHG reductions, the strategies are more effective together than individually. To ensure the complete, and most effective, implementation of the Citywide CAP, the City will designate a staff member in charge of coordinating Citywide CAP implementation: the CAP Coordinator. In addition to coordinating CAP implementation within the City, the CAP Coordinator should consider ways to work with neighboring jurisdictions to ensure that CAP strategies are mutually supportive across the region. For example, building strategies that place requirements on developers should be coordinated to reduce confusion and to avoid creating an atmosphere where development is favored in one jurisdiction over another.
Because the strategies span a variety of City responsibilities and departments, there will be a designated contact within each City department responsible for coordinating CAP activities within his or her department. These designated staff members will form a committee that meets quarterly to report on strategy implementation. Each staff member will be responsible for tracking the data required from his or her department to assess the strategies’ progress indicators. The City will designate the CAP Coordinator and convene the CAP Implementation Committee within two months of CAP adoption. Among the CAP Implementation Committee’s first actions will be:
1. Refining the “implementation actions” listed for each strategy to ensure they represent the complete list of required actions and assign responsibility for each action.
2. Confirming that the progress indicators are the most appropriate indicators.
3. Identifying data source(s) for each progress indicator and the method for collecting data and reporting it to City Council quarterly.
The committee will regularly evaluate the appropriateness of the progress indicators and data sources and revise each if better progress indicators or data sources become available.
The following departments and divisions will designate a CAP committee member:
• Community and Economic Development Department • Building Division • Planning Division • Engineering Division • Economic Development/Housing Division • Concord Community Reuse Project • Public Works Department • Fleet Division • Facilities Maintenance Division • Parks and Recreation Department • Police Department
City of Concord Citywide Climate Action Plan
Public Review Draft | March 2013 | Arup North America Ltd Page 18
This CAP Implementation Committee will annually prepare a Plan Implementation Review, as a report to the City Council on implementation activities. This report will include an analysis of whether any existing strategies are no longer recommended and whether there are new strategies that should be implemented. If the City determines during the annual Plan Implementation Review that the strategies are not being implemented or are not effective, as demonstrated by the progress indicators, the City will create additional strategies and convert voluntary strategies to mandatory strategies.
This process of ongoing implementation monitoring will keep the CAP current and allow it to continue to be used for streamlined CEQA review of development projects, subject to review by BAAQMD. In order to facilitate strategy implementation, the City will develop a checklist for future land developers to use to demonstrate inclusion of CAP strategies and consistency with CAP.
5.1.2 Inventory Updates The most definitive way to determine the Plan’s effectiveness is to perform a revised greenhouse gas emissions inventory. The City will perform this inventory by 2015, again in 2020, and at least every five years after that. This inventory will replicate the methodology and data sources used in developing the baseline inventory in the CAP (see Appendix A) to the extent possible, while incorporating new tools and information as appropriate. The first inventory to be performed in 2015 will be important in determining initial strategy effectiveness before 2020 when state-mandated goals must be met. The City will be able to re-evaluate the status of state mandates, which are forecast to provide a significant greenhouse gas reduction by 2020. Just as the annual Plan Implementation Report provides an opportunity for the City to re-evaluate the Plan’s strategies, regularly performing the inventory allows the City to establish a quantitative benchmark to set goals and take corrective action, if necessary. Corrective actions could include new strategies, more ambitious targets for established strategies, and converting voluntary strategies to mandatory strategies.
5.1.3 Resources for Implementation The City will use a variety of sources to pay for the implementation and monitoring of the CAP. Available sources continually change and the City will regularly identify and pursue these funds. Funds from that wide range of sources will then be allocated to CAP implementation through the annual budget cycle. Many CAP strategies aimed at City operations will result in energy cost savings, and the City will roll these savings back into plan implementation. Many other CAP strategies will result in energy cost savings to building owners. These will accrue over the lifetime of their buildings and are expected to benefit both building owners and tenants.
Despite these cost-saving efficiencies, the City will require additional funds to implement the CAP in its entirety. The City will pursue grant opportunities; partnerships with regional, state, and local agencies; and identify funding opportunities available to private businesses and residents. The CAP coordinator, during the annual progress report to the City Council, will report on current funding

City of Concord Citywide Climate Action Plan
Public Review Draft | March 2013 | Arup North America Ltd Page 19
opportunities and the City’s success in securing funds. Below is a partial list of potential fund sources that the City will consider pursuing.
• U.S. Department of Energy • U.S. Environmental Protection Agency (e.g., Climate Showcase Communities
Program) • U.S. Department of Housing and Urban Development • California Energy Commission • California Infrastructure and Economic Development Bank (e.g.,
Infrastructure State Revolving Fund Program) • Metropolitan Transportation Commission (e.g., Climate Initiatives Grants) • Association of Bay Area Governments • Bay Area Air Quality Management District (Strategic Incentives Division;
Transportation Fund for Clean Air) • Pacific Gas & Electric
CoolCalifornia.org provides a funding wizard database containing local grants and incentives for implementing climate action plans. The U.S. EPA provides links to federal funding sources available to state and local agencies for projects related to transportation and air quality at http://www.epa.gov/otaq/stateresources/grants.htm.
5.2 Summary of Strategies The strategies presented in the following chapters are summarized in Table 5.

City of Concord Citywide Climate Action Plan
Public Review Draft | March 2013 | Arup North America Ltd Page 20
Table 5: Summary of All Citywide Climate Action Plan Strategies GREENHOUSE GAS REDUCTION
BUILDING PERFORMANCE ENERGY BE1 Green Building Ordinance Exceeding State Requirements BE2 Prepare for California Zero Net Energy Standards BE3 Energy Audits for Existing Buildings BE4 Demand response programs BE5 Efficient Appliances BE6 Renewable Energy Facilitation BE7 Residential Energy Conservation BE8 Energy Information BE9 Public Lighting Retrofit BE10 Construction Energy Use WATER BH1 Water Efficient Indoor Fixtures and Appliances BH2 Water-Efficient Outdoor Irrigation BH3 Water-Metering and Monitoring BH4 Recycled Water WASTE BW1 Expanded waste reduction program
TRANSPORTATION SYSTEMS AND LAND USE TL1 Pedestrian Master Plan TL2 Programs and enforcement for safer active transportation TL3 Traffic calming measures TL4 Bike master plan TL5 Bike parking installations TL6 Safe Routes to Schools comprehensive program TL7 Bus signal priority TL8 Multi-modal way finding TL9 City Forest Plan TL10 Prioritizing active modes in engineering and design TL11 Active transportation priority in 10-year CIP and project funding TL12 TDM and transportation management associations TL13 Parking cash-out credits TL14 Downtown parking meters feasibility study TL15 Fleet efficiency TL16 Limit Idling of City Fleet vehicles TL17 Affordable housing parking credits TL18 Affordable housing density bonuses TL19 Parking lot shading TL20 Cool pavements TL21 Dense and accessible station areas TL22 Unbundled parking credits TL23 Preferred motor vehicle parking
City of Concord Citywide Climate Action Plan
Public Review Draft | March 2013 | Arup North America Ltd Page 21
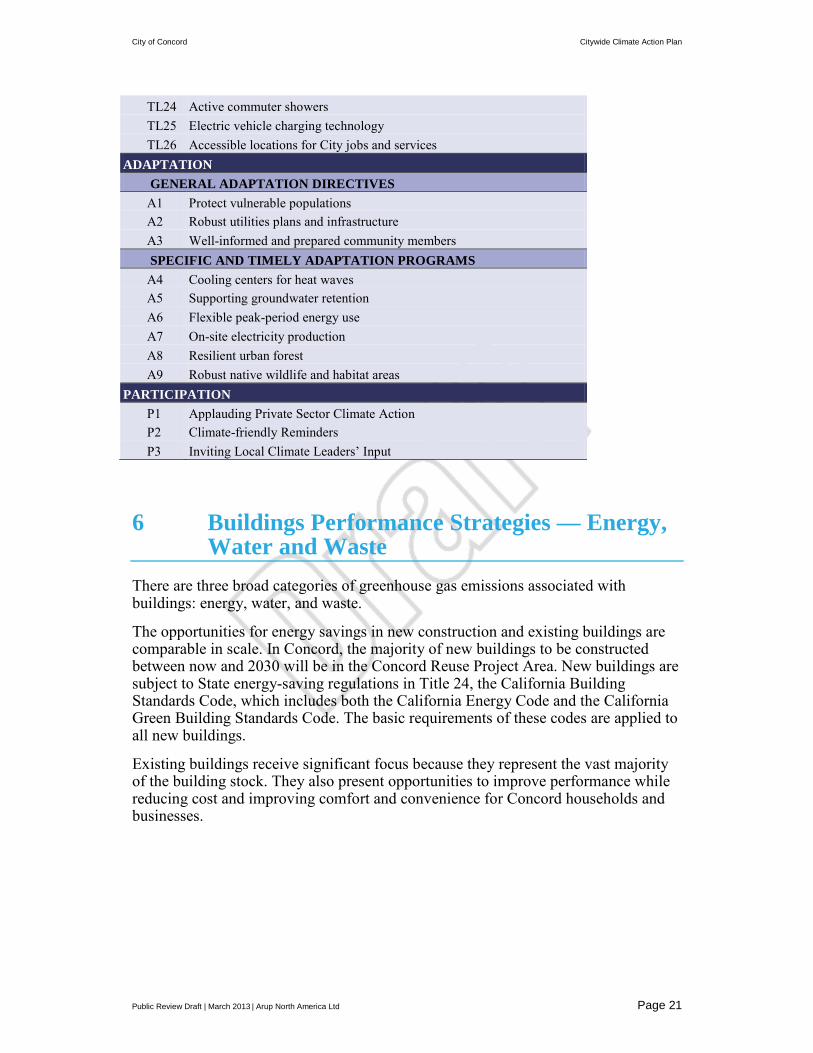
TL24 Active commuter showers TL25 Electric vehicle charging technology TL26 Accessible locations for City jobs and services
ADAPTATION GENERAL ADAPTATION DIRECTIVES A1 Protect vulnerable populations A2 Robust utilities plans and infrastructure A3 Well-informed and prepared community members SPECIFIC AND TIMELY ADAPTATION PROGRAMS A4 Cooling centers for heat waves A5 Supporting groundwater retention A6 Flexible peak-period energy use A7 On-site electricity production A8 Resilient urban forest A9 Robust native wildlife and habitat areas
PARTICIPATION P1 Applauding Private Sector Climate Action P2 Climate-friendly Reminders P3 Inviting Local Climate Leaders’ Input
6 Buildings Performance Strategies — Energy, Water and Waste
There are three broad categories of greenhouse gas emissions associated with buildings: energy, water, and waste.
The opportunities for energy savings in new construction and existing buildings are comparable in scale. In Concord, the majority of new buildings to be constructed between now and 2030 will be in the Concord Reuse Project Area. New buildings are subject to State energy-saving regulations in Title 24, the California Building Standards Code, which includes both the California Energy Code and the California Green Building Standards Code. The basic requirements of these codes are applied to all new buildings.
Existing buildings receive significant focus because they represent the vast majority of the building stock. They also present opportunities to improve performance while reducing cost and improving comfort and convenience for Concord households and businesses.

City of Concord Citywide Climate Action Plan
Public Review Draft | March 2013 | Arup North America Ltd Page 22
By 2035, approximately 50% of the commercial building stock in Concord will have been constructed after 2010, and 25% of the residential building stock will have been constructed post-2010.37
Water efficiency programs will be implemented through a number of the broader building energy efficiency improvement programs: energy code upgrades, time-of-sale retrofit programs, and targeted appliance replacement programs. The primary energy savings associated with water savings are those that reduce water heating loads.
The solid waste reduction strategies from the CRP Area Plan CAP are extended to the rest of Concord through this CAP. Energy savings and other emission reductions (such as reduced fugitive emissions associated with landfill) within the existing portion of the city will be commensurate with the reductions projected for the Reuse Area.
6.1 Energy Citywide
Energy consumption is a major source of GHG emissions in all cities and a major cost of operating buildings. Reducing energy consumption is therefore a large source of GHG emissions reductions. An important component of a carbon reduction program targeting the building sector is the rate at which a carbon reduction strategy will be implemented (the “saturation” rate) and the timeframe over which that strategy will be in effect. Buildings, ideally, last 50 to 100 years. This longevity adds to the fabric of a community and maximizes the value of the resources used in construction. However, longevity limits opportunities to improve the efficiency of a building’s systems creating an imperative to ensure that buildings are constructed to be as efficient as reasonably possible.
Carbon reduction measures such as rooftop photovoltaic systems should be “enabled” at time of construction – making buildings solar-ready where 37 These numbers are driven in part by the projected rates of population and employment growth, as well as the assumed turnover rate for the existing building stock. The employment rate is projected to increase at a higher rate than population. Commercial building stock turnover is estimated at 1% per year and residential building stock turnover is estimated at 0.4% per year.
Benefits from the CRP Area Plan (Segment 1) Greenhouse Gas Reduction Program
The CRP Area Plan CAP includes a variety of reduction initiatives that will deepen the CRP area’s GHG reductions:
Building and Site Energy Efficiency (5 policies) Waste Reduction (4 policies) Water Efficiency (7 policies)
Metric tons CO2e (MT CO2e) reduced beyond the Buildings Performance strategies: In 2020: 35,992 In 2030: 107,567 In 2035: 114,300 See Book Three of the CRP Area Plan for more details.

City of Concord Citywide Climate Action Plan
Public Review Draft | March 2013 | Arup North America Ltd Page 23
possible. Because such systems can be added relatively easily at a later date, it is less crucial that they be installed at the time of construction. The most important way to make a building solar ready is to ensure that there is adequate flat, south facing open roof area.
Appliances have much shorter lifecycles, and even installed lighting systems in commercial buildings can have lifespans under 10 years. These building components with high-turnover rates present unique opportunities for carbon reductions because efficiency systems can be achieved over time, resulting in much broader saturation.
City Buildings The City measures indicated with the City’s sun logo in this section are often quite specific because they reflect the energy savings documented through a contract with Chevron Energy Solutions for a variety of equipment upgrades and installation of a photovoltaic system.
Climate Action Strategies: Energy
BE1 Green Building Ordinance
BE2 Prepare for California Zero Net Energy Standards
BE3 Energy Audits for Existing Buildings
BE4 Demand response programs
BE5 Efficient Appliances
BE6 Renewable Energy Facilitation
BE7 Residential Energy Conservation
BE8 Energy Information
BE9 Public Lighting Retrofit
BE10 Construction Energy Use

City of Concord Citywide Climate Action Plan
Public Review Draft | March 2013 | Arup North America Ltd Page 24
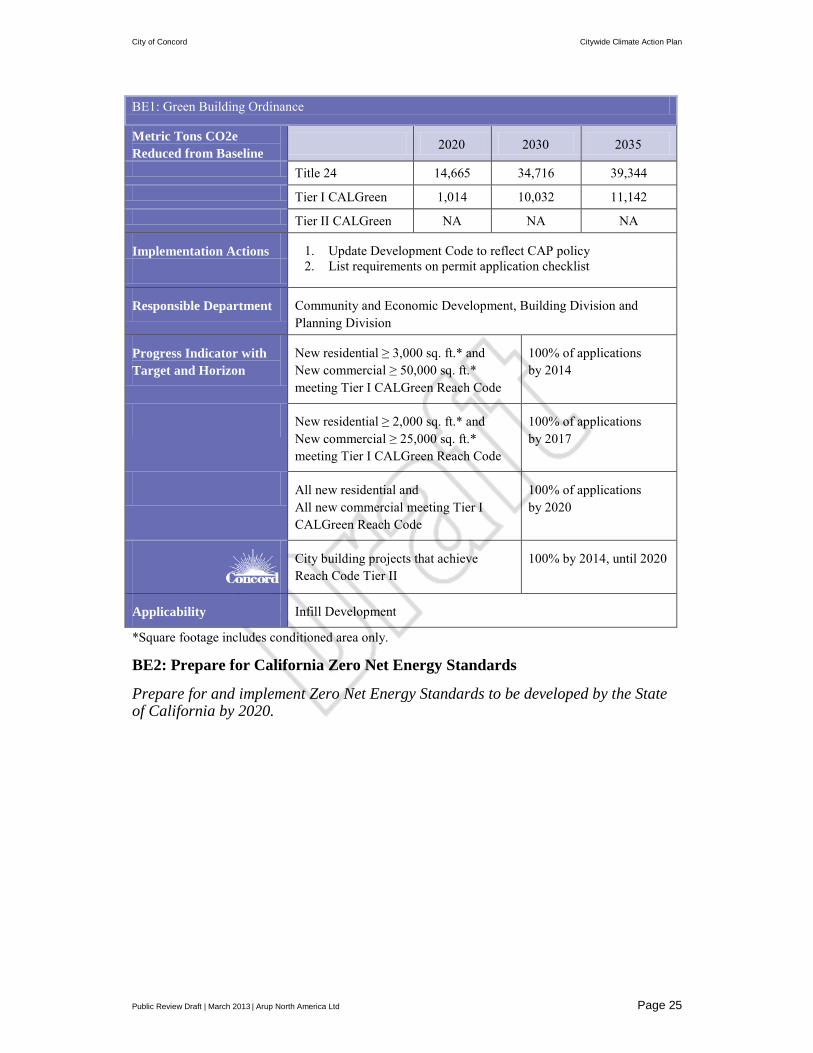
BE1. Green Building Ordinance
Implement the Tier I CALGreen Reach Code for building energy efficiency according to the following schedule:
BE1 Implementation Schedule
2014 New Residential Buildings ≥ 3,000 sq. ft. New Commercial Buildings ≥ 50,000 sq. ft.
2017 New Residential Buildings ≥ 2,000 sq. ft. New Commercial Buildings ≥ 25,000 sq. ft.
2020 All New Residential Buildings All New Commercial Buildings
Achieve Reach Code Level II in all City building projects until Zero Net Energy standards come into effect in 2020. This will require a 20% energy use reduction beyond the code baseline starting with Title 24 in 2013.
The City is already implementing the State’s Title 24 (CALGreen) requirements. This strategy will focus the gradual application of the Tier I Reach Code above the requirements of Title 24 over time. The California Energy Commission will establish a Tier I Reach Code each time it revises the building code and the years of implementation correspond to the anticipated timeframe for those revisions. Title 24 2013 is anticipated to be in effect starting January 1, 2014. For this code, the Level I reductions are expected to be a 15% reduction in energy use below Title 24 for residential construction and a 10% reduction for commercial construction. These targets are performance based and can be achieved through any set of approaches desired by the building owner and design team.
To assist owners and builders in meeting these targets, the City will allow the use of renewable energy systems to meet the energy use reduction targets beyond the base code levels. The renewable energy systems may be installed under any ownership structure that is likely to keep the system in place for 20 years. Any building using a renewable energy system to meet the reach code targets would still, at a minimum, need to meet the base code requirements of Title 24 through efficiency measures alone.
To implement Tier I, the City will need to submit a brief application to the California Energy Commission including a finding by the City that the Reach Code is cost effective. This is required by California Energy Efficiency regulations. PG&E may be able to assist the City of Concord in preparing the necessary cost effectiveness analysis.
The City’s reduction target exceeds the minimum LEED target of 10% savings. Complying with the higher rate of energy savings required by Reach Code Level II will lead to additional points for energy efficiency in the LEED compliance process.
City of Concord Citywide Climate Action Plan
Public Review Draft | March 2013 | Arup North America Ltd Page 25
BE1: Green Building Ordinance
Metric Tons CO2e Reduced from Baseline
2020 2030 2035
Title 24 14,665 34,716 39,344 Tier I CALGreen 1,014 10,032 11,142 Tier II CALGreen NA NA NA
Implementation Actions 1. Update Development Code to reflect CAP policy
2. List requirements on permit application checklist
Responsible Department Community and Economic Development, Building Division and Planning Division
Progress Indicator with Target and Horizon
New residential ≥ 3,000 sq. ft.* and New commercial ≥ 50,000 sq. ft.* meeting Tier I CALGreen Reach Code
100% of applications by 2014
New residential ≥ 2,000 sq. ft.* and New commercial ≥ 25,000 sq. ft.* meeting Tier I CALGreen Reach Code
100% of applications by 2017
All new residential and All new commercial meeting Tier I CALGreen Reach Code
100% of applications by 2020
City building projects that achieve Reach Code Tier II
100% by 2014, until 2020
Applicability Infill Development
*Square footage includes conditioned area only.
BE2: Prepare for California Zero Net Energy Standards
Prepare for and implement Zero Net Energy Standards to be developed by the State of California by 2020.

City of Concord Citywide Climate Action Plan
Public Review Draft | March 2013 | Arup North America Ltd Page 26
Achieve zero net energy (ZNE) in all City building projects after 2020. Where insufficient space is available on a building site for the city to offset the building’s energy use via photovoltaic systems, the City may comply with the ZNE target through the production of the required renewable energy at other city facilities and properties. Where possible, such offsite renewable energy production should be placed in visible locations, including road medians, where they could provide a demonstration of the City’s commitment to carbon reduction strategies.
As this CAP is implemented over the coming years, the Title 24 updates will move new buildings closer to the State’s broader Zero Net Energy (ZNE) new construction goals. Those goals seek to move residential new construction to a ZNE standard by 2020 and to move commercial new construction to a ZNE standard by 2030. Because the efficiency of new buildings cannot reasonably be moved beyond that ZNE standard once that becomes the state norm, the City of Concord will see the greatest gains beyond default code compliance levels by using the Reach Code structure outlined above to move near-term construction to higher levels of energy efficiency. The Reach Code provisions will also help the building industry in-and-around Concord to prepare for the upcoming ZNE Standards.
The Statewide ZNE program is likely to be the most systematic way to integrate renewable energy systems into new buildings. It will most likely happen via the building standards, with appropriate policies adopted at a Statewide level. However, the City of Concord will prepare to implement the necessary renewable energy components of a ZNE building standard if the state does not itself bring the 2020 and 2030 ZNE goals to fruition.

City of Concord Citywide Climate Action Plan
Public Review Draft | March 2013 | Arup North America Ltd Page 27
BE2: Prepare for California Zero Net Energy Standards
Metric Tons CO2e Reduced from Baseline
Area 2020 2030 2035
Infill reduction from Zero Net Energy 5,378 20,038 49,039
Municipal Reduction from Zero Net Energy
NA NA NA
Implementation Actions 1. Update Development Code to reflect policy
2. List requirements on permit application checklist
Responsible Department Community and Economic Development, Building Division and Planning Division
Progress Indicator with Target and Horizon
Residential development plans received meeting the applicable criteria
100% by 2020
Commercial development plans received meeting the applicable criteria
100% by 2030
After 2020, City building projects that achieve ZNE
100% by 2020
Applicability Infill Development
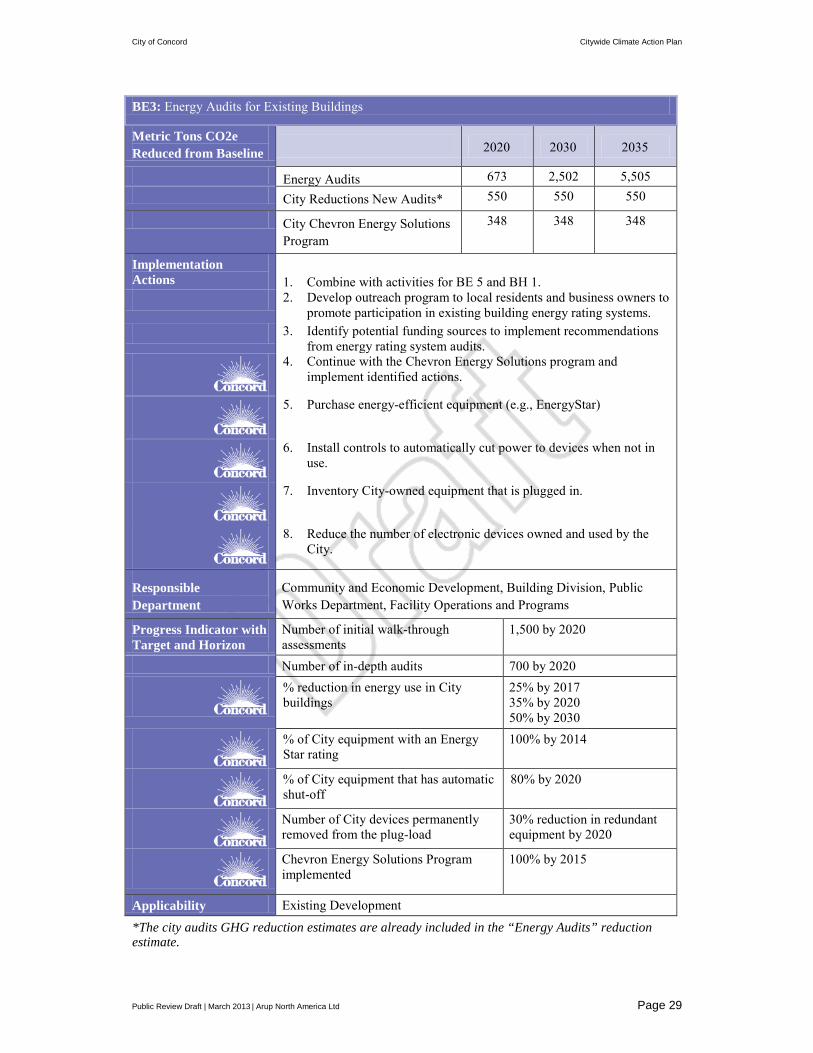
BE3 Energy Audits for Existing Buildings
Promote energy audits for existing buildings citywide through voluntary efficiency rating programs that analyze existing buildings for energy savings and identify potential improvements.
Improve the efficiency of existing city buildings through energy audits and implementation of recommended measures. The City will implement the following actions identified through the Chevron Energy Solutions contract.
Citywide, the City will work with private property-owners to evaluate existing residential and commercial buildings for potential energy savings. Energy efficiency programs for existing buildings are often implemented through three broadly defined stages:
• Initial walk-through assessment • In-depth audit • Implementation of identified efficiency measures

City of Concord Citywide Climate Action Plan
Public Review Draft | March 2013 | Arup North America Ltd Page 28
The initial walk-through assessments provide residential or commercial building owners with a low-cost analysis of the likelihood of finding energy savings opportunities within a building. If sufficient opportunities are identified, the walk-through can lead to a more in-depth audit at the owner’s discretion. That audit will then lead, ideally, to the implementation of the most cost-effective efficiency measures.
The City will encourage property owners in Concord to participate in such programs. These include the Home Energy Rating System (HERS II), which provides scoring of the energy efficiency of residential and non-residential buildings and the Building Energy Asset Rating System (BEARS), which identify cost-effective improvements that can be implemented by building owners. The BEARS program is under development, and is expected to be released in the next few years.
In addition to the programs encouraging audits of privately-owned buildings in Concord, the City will audit its own buildings and facilities to identify energy efficiency improvement opportunities. Those audits, followed by actions to improve building systems, are expected to reduce energy consumption at city buildings by 25 to 50%. This approach is consistent with the City’s existing agreement with Chevron Energy Solutions, which includes specific HVAC retrofits and improvements; retrofit of the community pool’s pump and boiler; replacement of the Police Station building management system; and interior/exterior buildings lighting retrofit.
Beyond the Chevron effort, the City will examine ways to reduce the extensive plug-loads throughout its operations (computers, copiers, T.V.s and other energy consuming equipment that is not hard-wired). Those plug-loads can be controlled through smart purchasing decisions, starting with EnergyStar equipment, and extending to improved controls that automatically cut power to devices when not in use.
City of Concord Citywide Climate Action Plan
Public Review Draft | March 2013 | Arup North America Ltd Page 29
BE3: Energy Audits for Existing Buildings
Metric Tons CO2e Reduced from Baseline 2020 2030 2035
Energy Audits 673 2,502 5,505 City Reductions New Audits* 550 550 550
City Chevron Energy Solutions Program
348 348 348
Implementation Actions 1. Combine with activities for BE 5 and BH 1. 2. Develop outreach program to local residents and business owners to
promote participation in existing building energy rating systems. 3. Identify potential funding sources to implement recommendations
from energy rating system audits.
4. Continue with the Chevron Energy Solutions program and implement identified actions.
5. Purchase energy-efficient equipment (e.g., EnergyStar)
6. Install controls to automatically cut power to devices when not in use.
7. Inventory City-owned equipment that is plugged in.
8. Reduce the number of electronic devices owned and used by the City.
Responsible Department
Community and Economic Development, Building Division, Public Works Department, Facility Operations and Programs
Progress Indicator with Target and Horizon
Number of initial walk-through assessments
1,500 by 2020
Number of in-depth audits 700 by 2020
% reduction in energy use in City buildings
25% by 2017 35% by 2020 50% by 2030
% of City equipment with an Energy Star rating
100% by 2014
% of City equipment that has automatic shut-off
80% by 2020
Number of City devices permanently removed from the plug-load
30% reduction in redundant equipment by 2020
Chevron Energy Solutions Program implemented
100% by 2015
Applicability Existing Development
*The city audits GHG reduction estimates are already included in the “Energy Audits” reduction estimate.

City of Concord Citywide Climate Action Plan
Public Review Draft | March 2013 | Arup North America Ltd Page 30
BE4: Demand response programs
Enroll all applicable municipal facilities in demand response (DR) programs and install smart thermostats where appropriate.
This strategy will allow the City to reduce its energy use during peak period energy demand periods, to help prevent energy shortages at those times. The strategy could be implemented through participation in Pacific Gas and Electric’s (PG&E) Smart AC Program, installation of Smart AC thermostats in City facilities, or PG&E’s Automated Demand Response Program, or Scheduled Demand Response Program. This effort will complement the City's existing participation in the Chevron Energy Solutions program and allow the City to earn financial savings through PG&E's demand response incentives programs.
BE4: Demand response programs
Metric Tons CO2e Reduced from Baseline
2020 2030 2035
Not quantified NA NA NA
Implementation Actions
1. Contact PG&E to learn more and assess which facilities to add to which kinds of DR programs.
2. Enroll all applicable municipal facilities in demand response programs
Responsible Department Public Works Department, Facility Operations and Programs
Progress Indicator with Target and Horizon
Municipal facilities enrolled in demand response programs
50% by 2015 75% by 2020
Applicability All Development Types
BE5 Efficient Appliances
Promote targeted appliance improvement through outreach to local appliance vendors and by disseminating information on rebate programs
A number of home and commercial appliances deserve special attention due to their unique potential to reduce overall energy use. As a first step to improve the saturation of high-efficiency appliances, the City will work with local appliance retailers to promote EnergyStar qualified products and to make readily available information about rebate programs applicable to such appliances.

City of Concord Citywide Climate Action Plan
Public Review Draft | March 2013 | Arup North America Ltd Page 31
Residential equipment deserving special attention through city outreach efforts includes:
• Tankless water heaters • High performance air conditioning systems at SEER 16 or higher • Condensing gas furnaces at 94% Annual Fuel Utilization Efficiency (AFUE) • The removal of second refrigerators in garages • Commercial equipment deserving special attention through city outreach efforts
includes: • High performance air conditioning systems, particularly packaged rooftop units at
SEER 16 • Commercial refrigeration • Water heating systems in high-usage applications
BE5: Efficient Appliances Metric Tons CO2e Reduced from Baseline
2020 2030 2035
Efficient Appliances 1,539 4,281 8,749
Implementation Actions 1. Combine with activities for BE 5 and BH 1.
2. Develop outreach program to local appliance vendors.
3. Develop outreach program to local residents and business
owners including information on rebates for applicable appliances through utility providers.
4. Perform outreach.
5. Post information on vendors and rebates on City website.
Responsible Department Community and Economic Development, Building Division
Progress Indicator with Target and Horizon
Number of households and/or businesses that have received an energy efficiency rebate from a utility provider or via tax rebates.
7,000 by 2020
Applicability All Development Types
City of Concord Citywide Climate Action Plan
Public Review Draft | March 2013 | Arup North America Ltd Page 32
BE6 Renewable Energy Facilitation
Facilitate the installation of onsite renewable energy through permit streamlining, installing visible public projects, and education programs.
Install a 191.5 kW photovoltaic system to offset the majority of the electrical consumption at the Community Pool as part of the Chevron Energy Solutions program.
The City will promote the installation of renewable energy systems on both new and existing buildings. The renewable energy program will address: photovoltaics for electricity production and solar thermal for hot water production. For photovoltaics, the program will support both rooftop installations and ground-based installations using available space such as parking lots.
The City will facilitate such installations by streamlining the permit and approval process, by installing its own high-visibility demonstration projects, by engaging in other promotions activities, and by helping building owners to better understand the economics of solar energy systems.
Photovoltaics: The prices of photovoltaic systems are dropping fairly rapidly – facilitated by decreasing panel prices, improved installation processes, and evolving financing mechanisms. Keeping Concord residents informed of the price point of renewable energy – in relation to projected utility power prices – can act as a strong signal for building owners to include photovoltaics in their power supply.
Solar thermal: With prices not dropping nearly as quickly on photovoltaic systems, solar thermal systems can be a more challenging carbon reduction product to promote. That challenge is heightened by record low natural gas prices that may continue for some time to come. Solar thermal systems should be promoted primarily where they can benefit from economies of scale:
• On multi-unit residences • On commercial facilities with high hot water loads, such as hospitals and
larger restaurants By installing its own high-visibility demonstration projects, the City can facilitate installations of renewable energy technologies including solar thermal and photovoltaics in rooftop installations and ground-based installations using available space such as parking lots. This Strategy is complementary to Strategy BE6: Renewable Energy Facilitation.

City of Concord Citywide Climate Action Plan
Public Review Draft | March 2013 | Arup North America Ltd Page 33
BE6: Renewable Energy Facilitation
Metric Tons CO2e Reduced from Baseline
2020 2030 2035
Commercial and Residential
9,350 30,062 57,780
City facilities* 44 44 44
Implementation Actions 1. Streamline permit process for renewable energy installation.
2. Post information on City website.
3. Perform educational outreach activities.
4. Install a 191.5 kW photovoltaic system to offset the majority of
the electrical consumption at the Community Pool.
Responsible Department Community and Economic Development, Building Division and Planning Division, Public Works Department, Facility Operations and Programs
Progress Indicator with Target and Horizon
Number of photovoltaic installations
700 by 2020
Number of solar thermal installations
700 by 2020
Percent of electrical consumption offset at the Community Pool by photovoltaic system
80% by 2015
Applicability All Development Types
*The City facilities GHG reduction is already included in the Commercial reduction estimate.
BE7 Residential Energy Conservation
Create a voluntary time of sale residential efficiency improvements program, to encourage homeowners to make energy upgrades along with the other upgrades they are likely to make immediately following the purchase of a new home.
The City will create a voluntary time-of-sale efficiency upgrade program, which will create steady improvements in the efficiency of the existing building stock using turnover of homes in the community as a point of contact to provide energy efficiency information. Several cities in the Bay Area have, or are considering, similar programs that are structured as mandatory requirements or voluntary programs. The mandatory versions are referred to as Residential Energy Conservation Ordinances (RECOs). These generally require an investment of around

City of Concord Citywide Climate Action Plan
Public Review Draft | March 2013 | Arup North America Ltd Page 34
$1,30038 in prescribed efficiency upgrades by a property seller at the time of a property transaction.
To ensure that this Strategy does not make homes in Concord less attractive to potential buyers, it will be voluntary. When a home sells in Concord, the new owners will be provided with energy efficiency information. This will include a list of energy efficiency improvements that are generally effective in Concord, as well as information about performance-based measures that would provide a broader set of options more tailored to the home, but only after the completion of a basic home energy audit. That audit might take the form of a Home Energy Rating System (HERS) rating, which tests a home and then makes recommendations for energy improvements that have been shown to be cost-effective.
Such a program would be more effective if mandatory. For this reason, the City will also work with other jurisdictions in the region (Contra Costa County) to see if a regional approach applicable to all homes in the County can be created. This would create a level playing field for home sales transactions in the County and reduce the costs associated with administering the program by pooling resources among the jurisdictions.
BE7: Residential Energy Conservation
Metric Tons CO2e Reduced from Baseline
2020 2030 2035
Voluntary Time-of-Sale
Residential Energy
Conservation
79 559 917
Implementation Actions
1. Create voluntary time-of-sale residential energy conservation program.
2. Work with other Contra Costa County jurisdictions toward the
creation of a regional time-of-sale residential energy conservation program, considering whether to make it voluntary (with incentives) or mandatory.
Responsible Department
Community and Economic Development, Building Division and Planning Division
Progress Indicator with Target and Horizon
Number of homebuyers participating in voluntary energy conservation at time-of-sale.
5% by 2020 10% by 2030 15% by 2035
Applicability All Development Types
38 This is the limit on the San Francisco ordinance. Berkeley’s limit is 0.75% of the sales price ($3,750 on a $500,000 home).

City of Concord Citywide Climate Action Plan
Public Review Draft | March 2013 | Arup North America Ltd Page 35
BE8 Energy Information
Work with PG&E and Contra Costa County to develop a shared Energy Reduction Information Question and Answer Center to ensure residents and builders have access to information about energy reduction programs, rebates, and technologies.
There is a persistent gap between the promise of carbon reduction programs and their ultimate realization. Many cost-effective investments that save money for consumers and reduce energy use are left untouched. The gap between cost-effective efficiency potential and realized energy savings holds true for publicly implemented programs, privately promoted technologies, and renewable energy systems.
A universal challenge across all such energy-saving measures is the complexity of implementing measures, the competing claims of performance, complicated fiscal comparisons, and a quickly shifting technology landscape. Simply matching lighting dimmer technologies across the spectrum of high-efficacy lighting fixtures can require hours of research, with the product combinations finally installed often still not matching expectations.
The City of Concord will work with PG&E and Contra Costa County to establish a shared education resource for Contra Costa County citizens looking to improve the energy efficiency of their home or business. A shared energy efficiency information program will help in reducing program costs and would have improved awareness of regional energy efficiency resources. The program sponsored by the Marin County Community Development Agency is an example, with well-produced green design guidelines and a designated planner to answer technical questions, among other resources.
A regional partnership would also improve the chances of bringing in outside support for such an educational program, whether from utilities or another government organization. A challenge for such educational programs is in documenting the associated energy savings, wherever such documentation might be necessary. The California Public Utilities Commission has approved education programs by the Investor Owned Utilities, such as PG&E, for years because of the common understanding of their overall importance.
While printed materials and web resources might be a part of the educational program, those are available in a number of useful forms already. The most immediate need is to have an energy efficiency specialist available to speak with, either in person or by phone. That specialist would help sort through the available information, provide shortcuts in the decision making process, flag common problems, and make residents and business owners sufficiently comfortable to move from research to action.
City of Concord Citywide Climate Action Plan
Public Review Draft | March 2013 | Arup North America Ltd Page 36
BE8: Energy Information
Metric Tons CO2e Reduced from Baseline
2020 2030 2035
Facilitates other BE strategies NA NA NA
Implementation Actions 1. Provide website clearing house for links to the most useful, existing websites, and for information specific to Concord.
2. Partner with PG&E and Contra Costa County to provide a shared
education resource for home energy efficiency improvements.
3. Provide an energy expert who is available in-person or by phone
to answer energy-related questions.
Responsible Department Community and Economic Development, Building Division
Progress Indicator with Target and Horizon
Website hits per month To be determined by City based on City website traffic and permit applications.
Person-contacts by the energy expert
To be determined by City based on City website traffic and permit applications.
Applicability Infill and Existing Development Types
BE9 Public lighting retrofit
Replace street lights, light fixtures throughout City parks and near building exteriors with new induction fixtures.
Through the Chevron Energy Solutions contract, the City will retrofit lighting throughout City buildings. Street light retrofits will include a new lamp, generator, photo cell and lens. Park and building lighting retrofit will replace 379 high pressure sodium and metal halide lamps with new induction fixtures. The induction fixtures will not only save energy and GHG emissions, but will improve lighting quality and reduce required maintenance because the lamps have a long operating life.

City of Concord Citywide Climate Action Plan
Public Review Draft | March 2013 | Arup North America Ltd Page 37
BE9: Public lighting retrofit
Metric Tons CO2e Reduced from Baseline
2020 2030 2035
Public Lighting 466 466 466
Implementation Actions
1. Replace 8,419 street lights with induction lamp technology.
2. Replace 379 fixtures throughout City parks and near building exteriors with new induction fixtures, including in the following sites: Baldwin Park, Boatwright Park, Cambridge Park, Centre Concord, Civic Center, Corp Yard, Concord Community Park, Police Station, Dave Brubeck Park, Ellis Lake Park, Hillcrest Park, Highlands Park, Markham Nature Park, Len Hester Park, Meadow Homes Park, Newhall Park, Pixie Playland Parking Lot, Sun Terrace Park, Todos Santos Plaza, Baldwin Senior Center, Willow Pass Park, Ygnacio Valley Park
Responsible Department Public Works Department, Traffic/Engineering Division
Progress Indicator with Target and Horizon
Number of street lights replaced
2,000 by 2015 4,000 by 2020 6,000 by 2025 8,419 by 2035
Number of fixtures replaced 200 by 2015 379 by 2020
Applicability Infill and Existing Development
BE10 Construction Energy Use
Reduce emissions from building construction by using cleaner fuels and equipment.
The City will develop a program encouraging construction companies operating in Concord to use best practices with respect to fuel use and clean air equipment during construction operations. This Strategy will, in particular, benefit local air quality while reducing greenhouse gas emissions.

City of Concord Citywide Climate Action Plan
Public Review Draft | March 2013 | Arup North America Ltd Page 38
BE10: Construction Energy Use
Metric Tons CO2e Reduced from Baseline
2020 2030 2035
Not Quantified NA NA NA
Implementation Actions 1. Contact BAAQMD for best practices for clean construction equipment.
2. Create program encouraging use of clean vehicles and equipment
for construction projects.
Responsible Department Community and Economic Development, Building Division
Progress Indicator with Target and Horizon
Proportion of construction projects participating in voluntary program.
5% by 2020 10% by 2030 15% by 2035
Applicability Infill Development Types
6.2 Water Water efficiency programs have clear benefits in California, where water is scarce and often must be pumped across mountain ranges. These efficiencies also support local energy savings by reducing the energy used to heat water.
Climate Action Strategies: Water
BH1 Water Efficient Indoor Fixtures and Appliances
BH2 Water-Efficient Outdoor Irrigation
BH3 Water-Metering and Monitoring
BH4 Recycled Water
BH1 Water Efficient Indoor Fixtures and Appliances
Improve fixture and appliance water efficiency in commercial and residential buildings by promoting information about rebates and incentives, and by continuing to ensure implementation of the CALGreen code.
Promote and model as appropriate within City facilities the use of efficient fixtures and appliances in commercial and residential buildings. Target fixtures that use hot water in order to drive the greatest energy savings from high-efficiency fixtures and appliances.
The nature of fixtures and appliances – rarely embedded in a permanent manner within a building – means that water efficiency can be promoted equally in both new and existing buildings. The high-efficiency fixtures and appliances that affect hot water use will drive the greatest energy savings. Low-flush and dual-flush toilets as well as EnergyStar appliances are primary examples of potential equipment improvements.
City of Concord Citywide Climate Action Plan
Public Review Draft | March 2013 | Arup North America Ltd Page 39
The City will promote the use of water efficient fixtures and appliances in commercial and residential buildings as well as identifying and replacing appliances in its own buildings. The City may be able to work with Contra Costa Water District and PG&E to distribute information on rebate programs and other available incentives. Online tools that promote water efficiency for utilities through consumer communications are currently coming to market. Such tools will likely provide an effective platform in years to come, with information and recommended solutions tailored to individual consumers.
Water efficiency is becoming an increasingly important part of the Title 24 energy code, including the Title 24, Part 11 CALGreen Reach Code. The city can promote water efficiency by ensuring full implementation of the code provisions enforceable within the City.
BH1: Water efficient indoor fixtures and appliances
Metric Tons CO2e Reduced from Baseline
2020 2030 2035 Support BE Savings NA NA NA
Implementation Actions 1. Develop outreach program to local appliance and fixture vendors.
2. Develop outreach program to local residents and business
owners including information on rebates for applicable appliances and fixtures.
3. Perform outreach.
4. Post information on vendors and rebates on City website.
5. Adopt policy to purchase high-efficiency fixtures and appliances.
6. Purchase and install high-efficiency fixtures and appliances in all new construction and replace existing equipment as-needed.
Responsible Department Community and Economic Development, Building Division and Planning Division
Progress Indicator with Target and Horizon
Number of households that have received a water efficiency rebate.
7,000 by 2020
Percent of new fixture and appliance purchases that are high-efficiency
100% on-going
Applicability Existing Development
BH2 Water-Efficient Outdoor Irrigation
Minimize water used to irrigate outdoor areas through application of the Development Code and promotion of expanded water-efficiency opportunities.
City of Concord Citywide Climate Action Plan
Public Review Draft | March 2013 | Arup North America Ltd Page 40
Minimize water used to landscape and irrigate outdoor areas, such as City-owned medians and parks. Include the following approaches: • Use water efficient and/or native landscape plantings. • Install permeable pavement, create green streets, and use
other landscaping techniques that manage stormwater runoff and reduce heat island effects
• Pursue grants to fund the plantings and landscaping retrofits.
The City will continue to implement the water-efficient landscaping portion of the Development Code. In addition, it will use the development review process to promote opportunities to go beyond the basic landscaping requirements by distributing information on innovative approaches to irrigation and planting methods.
Irrigation requires the use of energy to power water pumps, which can cause GHG emissions. The landscapes that require the most irrigation are those not adapted to the climate in Concord, such as non-native plant species or plants evolved for moist habitats. Non-native species are also less likely to adapt readily to climate change.

City of Concord Citywide Climate Action Plan
Public Review Draft | March 2013 | Arup North America Ltd Page 41
BH2: Water-efficient outdoor irrigation
Metric Tons CO2e Reduced from Baseline
2020 2030 2035
Support BE Savings NA NA NA
Implementation Actions 1. Continue to implement the water efficient landscaping portion of the Development Code.
2. List water-efficient landscaping criteria on permit application checklist.
3. Distribute information on innovative approaches to irrigation and planting beyond the Development Code requirements.
4. Calculate how much city landscaping currently uses drought
tolerant plants.
5. Use water efficient landscape plantings, such as locally native,
drought tolerant landscaping.
6. Install permeable pavement, create green streets, and use other landscaping techniques that manage stormwater runoff and reduce heat island effects
7. Pursue grants to fund the plantings and landscaping retrofits
Responsible Department Community and Economic Development, Building Division and Planning Division
Public Works Department, Parks Division, Streets Division, and Sewer/Stormwater Division
Progress Indicator with Target and Horizon
Development plans received meeting the applicable criteria.
100% on-going
Percent of City landscaping with drought tolerant landscaping
20% by 2017 40% by 2020 60% by 2025
Number of permeable pavement or other green street stormwater runoff projects implemented
>2 annually beginning 2015
Number of grants applied for to fund site water efficiency
>1 annually beginning 2015
Applicability Infill Development

City of Concord Citywide Climate Action Plan
Public Review Draft | March 2013 | Arup North America Ltd Page 42
BH3 Water-Metering and Monitoring
Incorporate best-in-class water use metering and monitoring for all new commercial and multi-family development.
In new construction of municipal buildings, install best-in-class metering systems to provide more detailed information on water usage patterns.
Best-in-class metering systems will be required for new private and city-owned buildings to provide more detailed information to building owners and managers on water usage rates. Best-in-class water use metering is that which meets the highest possible current performance levels in terms of providing real-time ‘smart’ information about use and location that is available both on-site and remotely.
BH3: Water metering and monitoring
Metric Tons CO2e Reduced from Baseline
2020 2030 2035
Not Quantified NA NA NA
Implementation Actions 1. Update development code to require best-in-class water metering systems in new commercial and multi-family construction.
2. List water-use metering and monitoring criteria on permit application checklist.
3. Install best-in-class water metering systems in new
municipal construction Responsible Department Community and Economic Development, Building Division and
Planning Division Public Works Department, Facility Operations and Programs
Progress Indicator with Target and Horizon
Development plans received meeting the applicable criteria.
100% by 2014
New municipal construction with best-in-class water metering systems
100% by 2015
Applicability Infill Development

City of Concord Citywide Climate Action Plan
Public Review Draft | March 2013 | Arup North America Ltd Page 43
BH4 Recycled Water
Extend CRP recycled water system to the rest of the City for appropriate use in outdoor places and in buildings, and plan ahead for future expansion of the system.
Identify areas outside the CRP Area where a purple pipe system could sensibly be extended, such as municipal parks. For any municipal construction projects larger than 50,000 square feet, build in plumbing systems that can eventually accommodate the use of recycled water even if the recycled water is not available at the site at the time of construction.
While the use of purple pipe systems to reuse wastewater is an important part of the CRP Area Plan, such systems are more difficult to implement within the rest of the City where utility infrastructure has already been put in place. Concord will explore if there are areas to sensibly extend a purple pipe system, such as municipal parks, golf courses, HOA common areas, and commercial landscaped areas.
Commercial and municipal construction above 50,000 square feet will be built with plumbing systems to eventually accommodate the use of recycled water even if the recycled water is not available at the site at the time of construction.
BH4: Recycled water
Metric Tons CO2e Reduced from Baseline
2020 2030 2035
Not quantified NA NA NA
Implementation Actions 1. Update development code to allow for installation of purple pipe
systems in all development and require purple pipes in new commercial construction >50,000 square feet.
2. Update development code to allow for installation of purple pipe
systems in all development and require purple pipes in new commercial construction <50,000 square feet.
3. List criteria on permit application checklist.
Responsible Department Community and Economic Development, Building Division and Planning Division
Progress Indicator with Target and Horizon
Development plans received meeting the applicable criteria.
100% by 2014
Number of infill non-commercial facilities and commercial facilities >150,000 square feet with purple pipes.
2 additional per year beginning 2015
New City construction >50,000 square feet with purple pipes
100% by 2015
Applicability Infill Development

City of Concord Citywide Climate Action Plan
Public Review Draft | March 2013 | Arup North America Ltd Page 44
6.3 Waste A primary mechanism for reducing carbon emissions due to waste is by reducing transportation costs. This occurs through a reduction of overall waste volume, managing composting activities close to the source of the organic content, and increasing recycling diversion rates. In 2005, the City’s diversion rate was 46%, but it has grown rapidly in recent years, reaching 69% citywide by 2010.39
Reductions in waste, whether at time of construction or during building occupancy, also have secondary benefits in carbon reduction through reduced manufacturing and delivery impacts. Likewise, recycled materials can reduce the energy required to make new items compared to working from raw materials.
In 2005, 4,238 tons of solid waste was sent to the landfill from municipal operations. In that year, the city had diverted approximately 42% of all the solid waste it produced to recycling and compost. Because materials use and waste practices vary so much between City departments, the strategy that follows sets a performance goal and leaves it up to each department of the City to ensure the City reaches its municipal operations goal.
Climate Action Strategy: Waste
BW1 Expanded waste reduction program
BW1 Expanded waste reduction program
Reduce business and multi-family waste, anticipating the State’s 2020 requirement of 75% diversion for these sources; strive for the same reduction for single-family household waste by 2020 and mandate it by 2030.
Reduce waste generation and increase diversion of solid waste produced by City operations from the landfill to 75% by 2020.
This strategy aims to reduce the amount of solid waste sent to landfills, where the waste fuels the production of methane, a key GHG. Because diverse implementation approaches could lead to greater diversion of solid waste, this strategy is focused on the overall performance goal.
The City’s current waste reduction program will continue to be implemented, expanding the level of information about the program and education of residents and businesses. This target will exceed the State’s current 50% diversion mandate by 25% for single-family households. For businesses and multi-family buildings, this strategy will anticipate the State’s mandated 2020 diversion rate of 75%, under AB 341. 39 City of Concord. Report to Council Committee on Infrastructure and Franchise: Committee Recommendation to the City Council for Consideration of a Request by Concord Disposal Services for a Rate Increase Associated with the Existing Franchise Agreement for the Provision of Solid Waste Services. June 14, 2012.

City of Concord Citywide Climate Action Plan
Public Review Draft | March 2013 | Arup North America Ltd Page 45
The City will collaborate closely with the Concord Disposal Service to complete this strategy, focusing on joint opportunities to provide educational information about recycling and composting. The City will consider ways to divert building construction, demolition, and remodel waste from landfills through reuse and salvage programs.
BW1: Expanded Waste Reduction Program
Metric Tons CO2e Reduced from Baseline
2020 2030 2035
Commercial and Residential
17,093 36,604 43,313
Municipal* 537 537 537
Implementation Actions 1. Work with Concord Disposal Service to achieve 75% diversion
2. Consider expansion of Yard Waste program to include all
household compost (e.g., food waste)
Responsible Department Concord Disposal Service
Progress Indicators with Target and Horizon
Diversion rate for household and business waste to landfill.
75% by 2020 except 75% for single-family households by 2030
Diversion rate for municipal waste 75% by 2020
Applicability All Development Segments
*The Municipal waste GHG reduction is already included in the Commercial reduction estimate.

City of Concord Citywide Climate Action Plan
Public Review Draft | March 2013 | Arup North America Ltd Page 46
7 Transportation Systems and Land Use Strategies
Key approaches to reducing GHG emissions from transportation include enabling residents, employees, and visitors to Concord to travel via transit, walking, and
biking, to take shorter trips, and to use vehicles that emit fewer GHGs when they drive. These changes also improve the health, safety, and quality of life of the Concord community by reducing vehicle collisions, lowering pollution levels, increasing mobility for people with physical disabilities, and increasing access to local businesses.
These changes take the most time to implement because the built environment and personal habits change slowly. For this reason, GHG reductions will increase over time, with the most measurable reductions in later years. Policies designed to increase travel choice need to address the transportation systems in Concord as a whole, the regulations that shape the designs of streets, and the land use and urban design rules. The
“Transportation Strategies” focus on changing the transportation systems, while the “Land Use Strategies” address the role of design, locations, and intensities of uses in influencing travel choices. Even subtle changes to the patterns of streets and buildings can move Concord toward lower-GHG transportation choices. The strategies in this Chapter support a variety of Goals and Policies in the City’s General Plan Land Use and Transportation Chapters.
In general, new development can be more readily designed to support walking and biking than existing development, which requires modification. Several of the strategies use the City’s permitting process to trigger improvements. Other programs and policies will benefit both new and existing developments, like improving the ease and comfort of walking and biking on Concord’s public streets and paths. Walking and biking are supported by Concord’s Complete Streets project.
Some strategies cannot yet be quantified due to limited research. For others, research best demonstrates benefits when grouped together. These groupings are reflected in the summary tables indicating GHG reductions for the strategies in the Pedestrian
Benefits from the CRP Area Plan (Segment 1) Greenhouse Gas Reduction Program
The CRP Area Plan CAP includes Vehicle Miles Travelled (VMT) Reduction initiatives that will deepen the CRP area’s GHG reductions:
Walkable Communities (4 policies) Intermodal Connectivity (7 policies) Emerging Technologies (3 policies) Parking Management (7 policies) Transportation Demand Management (7 policies)
MT CO2e reduced beyond the citywide Transportation, Streets, and Land Use strategies: In 2020: 19,014 In 2030: 27,450 In 2035: 29,571 See Book Three of the CRP Area Plan for more details.

City of Concord Citywide Climate Action Plan
Public Review Draft | March 2013 | Arup North America Ltd Page 47
Improvements, Bicycling Improvements, Transit Improvements, Commute Mode Shift, and Shade Trees categories. For details on the quantifiable GHG reductions from each strategy, see Appendix D. Emissions reductions from strategies in this chapter are shown in Table 6.
Table 6: Transportation and Land Use Strategies: Summary of Emissions Reductions Year 2020 2030 2035
Metric Tons CO2e Reduced from Baseline (accounting for state mandates)
5,244 11,814 13,823
The strategies listed in this chapter to make infrastructure work better for pedestrians, cyclists, and public transportation riders, while making the roads safer for everyone. This infrastructure cannot stand alone. Even the widest sidewalks or bike lanes will not serve many cyclists and pedestrians if destinations are distant and buildings along the way focus on serving visitors arriving by car. Land use and design regulations are key tools for ensuring that non-motorized transportation modes become viable options for more trips taken in Concord.
The strategies in this chapter are centered on the following concepts:
• Creating complete streets that serve all people traveling in Concord • Priority for active modes and public transit in funding and use of streets • Support for carsharing (an alternative to owning a car) • Roadway safety enhancements through education and law enforcement • Cleaner-burning buses • More efficient bus service
CAP Strategies Help Meet Regional SB375 Targets Senate Bill 375 (passed in 2008) calls for transportation planning agencies and local governments in California to reduce GHG emissions from passenger vehicles by reducing per capita vehicle miles traveled (VMT). SB375 focuses on potential emissions reductions from land use and transportation coordination, allowing shorter driving trips and more frequent walking, biking, carpooling, and public transit-riding trips. The bill specifically sets emissions reduction targets that require measures in addition to advances in fuel and vehicle efficiency. California’s Air Resources Board has assigned specific targets to each region of the State compared to 2005 emissions levels from passenger travel. For the San Francisco Bay Area, the targets have been set at 7% reduction by 2020 and 15% reduction by 2035. While the City of Concord cannot change regional transportation patterns single-handedly, changes in Concord will contribute substantially to reducing VMT by Concord residents and workers. In the short term, through 2020, these changes provide half of the reduction needed to meet the City’s target. As implementation of the CAP continues and additional strategies come online, VMT reductions from Concord will provide over a third of the reduction required for the City’s 2035 target.

City of Concord Citywide Climate Action Plan
Public Review Draft | March 2013 | Arup North America Ltd Page 48
• Density and mix of land uses, especially in targeted areas of Concord • Walk-friendly design (including reduced street-front parking lots and smaller
block sizes) • End-of-trip amenities for preferred travel modes (like showers for active
commuters, and preferred carpool parking spots at job locations)
Climate Action Strategies: Transportation Systems
TL1 Pedestrian Master Plan
TL2 Programs and enforcement for safer active transportation
TL3 Traffic calming measures
TL4 Bike master plan
TL5 Bike parking installations
TL6 Safe Routes to Schools comprehensive program
TL7 Bus signal priority
TL8 Multi-modal way finding
TL9 City Forest Plan
TL10 Prioritizing active modes in engineering and design
TL11 Active transportation priority in 10-year CIP and project funding
TL12 TDM and transportation management associations
TL13 Parking cash-out credits
TL14 Downtown parking meters feasibility study
TL15 Fleet efficiency
TL16 Limit Idling of City Fleet vehicles
TL17 Affordable housing parking credits
TL18 Affordable housing density bonuses
TL19 Parking lot shading
TL20 Cool pavements
TL21 Dense and accessible station areas
TL22 Unbundled parking credits
TL23 Preferred motor vehicle parking
TL24 Active commuter showers
TL25 Electric vehicle charging technology
TL26 Accessible locations for City jobs and services

City of Concord Citywide Climate Action Plan
Public Review Draft | March 2013 | Arup North America Ltd Page 49
Strategies:
TL1. Pedestrian Master Plan
Develop a pedestrian master plan consistent with the Citywide Complete Streets Standards to minimize barriers to pedestrian access and maximize pedestrian interconnectivity throughout the City.
Pedestrian improvements provide a valuable service to the community: support a low-cost mobility option for travelers, a source of exercise, a way to increase neighborhood safety, and a way to spur local economic development.40 These improvements also benefit the most members of the Concord community, because every trip starts and ends as a pedestrian trip. Making walking an easier, safer, and more comfortable way to travel for more trips requires a variety of efforts, and a pedestrian master plan will help strategize and prioritize these efforts. It will include pedestrian mode share goals and provisions to monitor pedestrian mode share, as well as coordinate all investments in City infrastructure with the pedestrian master plan based on an evaluation of key destinations like transit stations, schools, medical services, and grocery stores. The pedestrian master plan and its development will need to involve community members and groups to inform city staff about the highest-priority improvements.
TL1: Pedestrian Master Plan
Metric Tons CO2e Reduced from Baseline
2020 2030 2035
Pedestrian Group* 978 2,440 2,595
Implementation Actions 1. Develop scope for Pedestrian Master Plan
2. Secure funding to develop the Plan
3. Establish baseline pedestrian mode share by 2015
4. Develop the Plan and CEQA analysis
5. Implement Plan recommendations
Responsible Department Community and Economic Development, Engineering Division
Progress Indicator with Target and Horizon
Pedestrian mode share 2% annual increase over base
Implementation of Plan recommendations
25% by 2017 50% by 2020 75% by 2025 100% by 2030
Applicability All Development Segments
*Several strategies in this chapter contribute to this group. These numbers reflect the total savings from pedestrian group strategies.
40 Bent and Singha 2009.

City of Concord Citywide Climate Action Plan
Public Review Draft | March 2013 | Arup North America Ltd Page 50
TL2. Programs and enforcement for safer active transportation
Work with the Police Department to prioritize traffic enforcement efforts in strategic locations to protect the safety and rights of cyclists and pedestrians. Develop and implement a training program to inform drivers of the need to respect cyclists and pedestrians.
Fear for physical safety on roadways is a major barrier to increasing the number of people using active modes for the short trips. Efforts that increase safe driving around pedestrians and cyclists, particularly in proximity to schools and other common destinations, may address safety concerns and encourage people to try walking and biking. This strategy also reminds drivers of the important, and legally-mandated, role they have in providing a safe environment for walkers and bikers. This effort is included as a supporting strategy for quantifying two groups of GHG reductions: pedestrian improvements, and bicycling improvements.
TL2: Programs and enforcement for safer active transportation
Metric Tons CO2e Reduced from Baseline
2020 2030 2035
Pedestrian Group* 978 2,440 2,595 Bicycling Group* 1,957 4,879 5,190
Implementation Actions 1. Adopt Complete Streets amendments to the General Plan
2. Establish 2010 baseline accident rates for accidents involving
pedestrians and bicycles
3. Develop public information materials
4. Inform, train, and otherwise work with key staff
5. Hold trainings with partner agencies
6. Distribute materials to public and partner agencies
Responsible Departments
Community and Economic Development, Engineering Division Police Department
Progress Indicator with Target and Horizon
Number of accidents involving pedestrians and bicyclists
25% reduction compared to base by 2017 50% by 2020 75% by 2035
Applicability All Development Segments
*Several strategies in this chapter contribute to this group. These numbers reflect the total savings from pedestrian and bicycling group strategies.
TL3. Traffic calming measures
Implement pedestrian and bicycle-friendly traffic calming measures. Require such measures as a condition of development approvals where appropriate, including measures to slow traffic and encourage walking and bicycling. Typical features could include curb bulb-outs, additional street trees, raised crosswalks, roundabouts, smaller corner radii, pavement treatments, and lane narrowing.
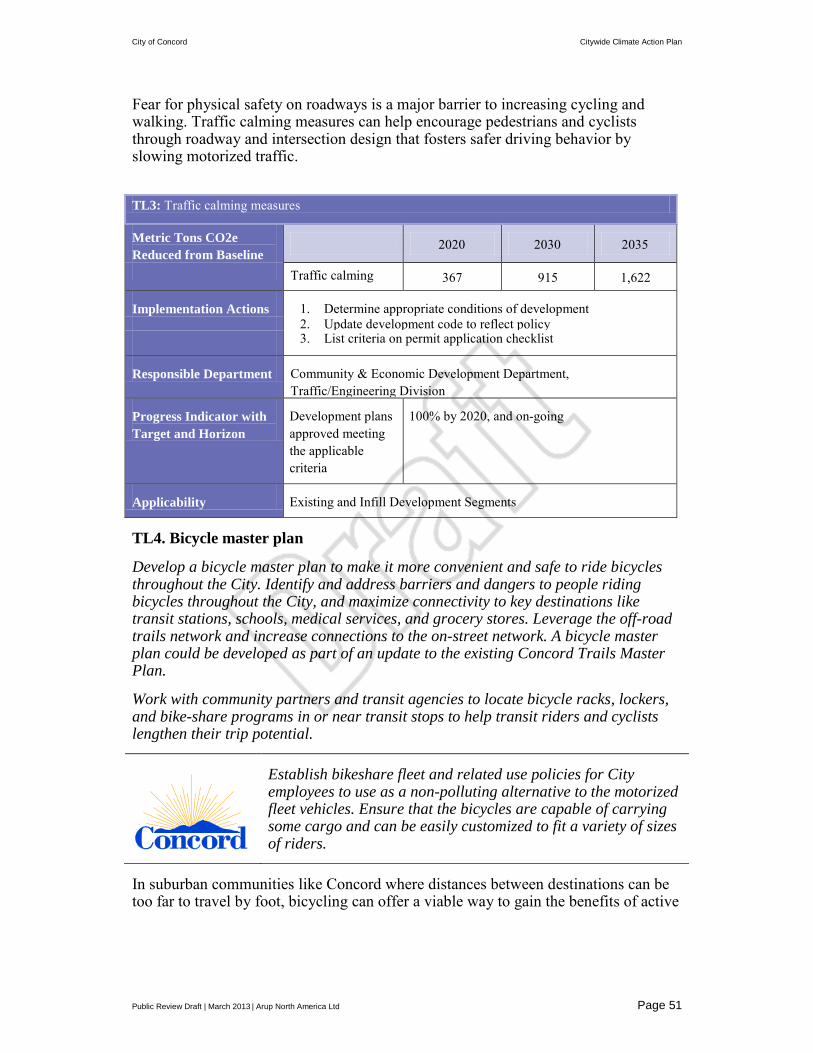
City of Concord Citywide Climate Action Plan
Public Review Draft | March 2013 | Arup North America Ltd Page 51
Fear for physical safety on roadways is a major barrier to increasing cycling and walking. Traffic calming measures can help encourage pedestrians and cyclists through roadway and intersection design that fosters safer driving behavior by slowing motorized traffic.
TL3: Traffic calming measures
Metric Tons CO2e Reduced from Baseline
2020 2030 2035
Traffic calming 367 915 1,622
Implementation Actions 1. Determine appropriate conditions of development
2. Update development code to reflect policy
3. List criteria on permit application checklist
Responsible Department Community & Economic Development Department, Traffic/Engineering Division
Progress Indicator with Target and Horizon
Development plans approved meeting the applicable criteria
100% by 2020, and on-going
Applicability Existing and Infill Development Segments
TL4. Bicycle master plan
Develop a bicycle master plan to make it more convenient and safe to ride bicycles throughout the City. Identify and address barriers and dangers to people riding bicycles throughout the City, and maximize connectivity to key destinations like transit stations, schools, medical services, and grocery stores. Leverage the off-road trails network and increase connections to the on-street network. A bicycle master plan could be developed as part of an update to the existing Concord Trails Master Plan.
Work with community partners and transit agencies to locate bicycle racks, lockers, and bike-share programs in or near transit stops to help transit riders and cyclists lengthen their trip potential.
Establish bikeshare fleet and related use policies for City employees to use as a non-polluting alternative to the motorized fleet vehicles. Ensure that the bicycles are capable of carrying some cargo and can be easily customized to fit a variety of sizes of riders.
In suburban communities like Concord where distances between destinations can be too far to travel by foot, bicycling can offer a viable way to gain the benefits of active

City of Concord Citywide Climate Action Plan
Public Review Draft | March 2013 | Arup North America Ltd Page 52
transportation modes. Increasing bicycling can contribute to healthier populations, safer streets, more successful local businesses41 and lower GHG emissions. Making bicycling an easier, safer, and more comfortable way to travel for more trips requires a variety of efforts, and a pedestrian master plan will help to strategize and prioritize these efforts. It will include bicycle mode share goals and provisions to monitor bicycle mode share, as well as coordinate all investments in City infrastructure with the pedestrian master plan. This will increase local access to dedicated bicycle lanes, and trails are the most important factor in increasing bicycle use, particularly among people that do not currently bicycle. The plan and its development will need to involve community members and groups to inform city staff about high-priority improvements.
This strategy is based on practices being increasingly adopted in corporate offices and aims to reduce travel on the City’s motorized fleet vehicles. This strategy could also help reduce GHG emissions from municipal employee commutes, since the bike fleet would be equipped to carry cargo and thus reduce employee dependence on their own automobiles. If fleet use policies allow the fleet bikes to be parked at the Downtown Concord BART station overnight, these vehicles can also help reduce employee commute VMT by facilitating the "last mile" connection to the City offices from regional transit service. If the fleet is distinctly branded, bicycling employees can help demonstrate low-GHG travel options to the Concord community.
Safe and convenient bicycle parking and related facilities at key transit stops can enable fewer trips to be made by private motor vehicles in Concord. This strategy recognizes the need for inter-agency coordination in planning for multi-modal transit stops.
41 Clifton et al. (2012) note that surveys in San Luis Obispo, downtown San Francisco, and internationally have found that customers arriving by bicycle spend money more frequently and in greater quantities per month at local shops and restaurants than customers arriving by motor vehicle.
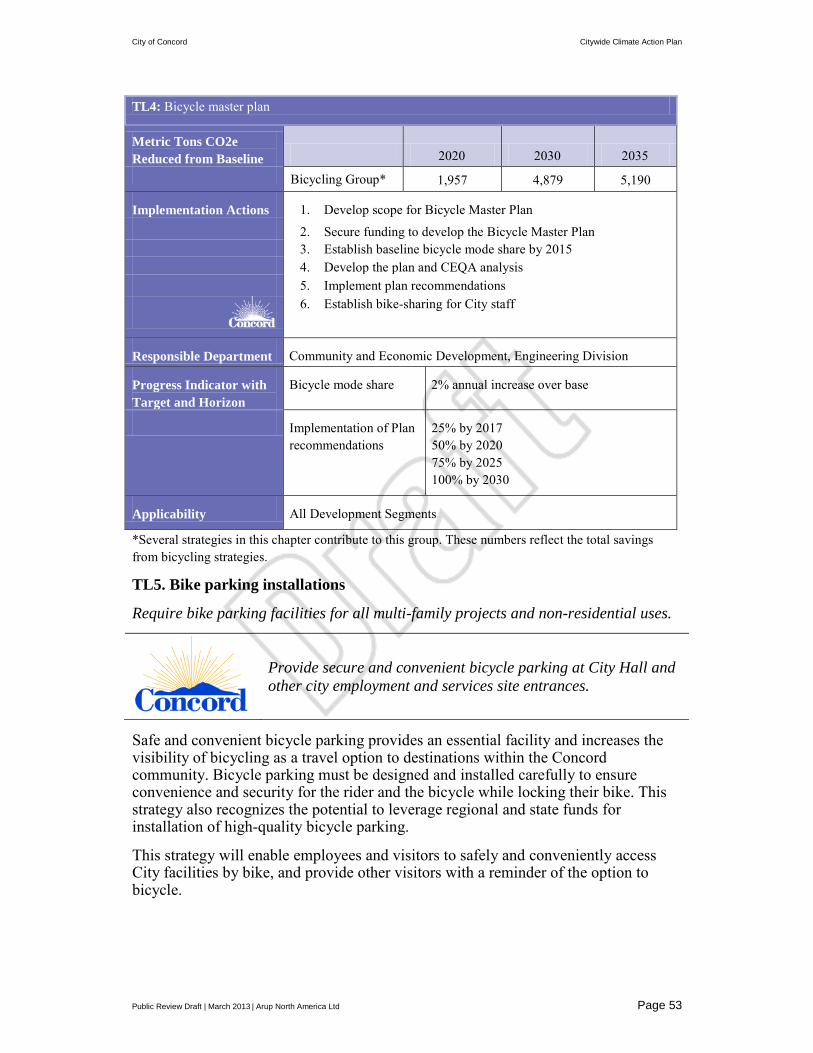
City of Concord Citywide Climate Action Plan
Public Review Draft | March 2013 | Arup North America Ltd Page 53
TL4: Bicycle master plan
Metric Tons CO2e Reduced from Baseline 2020 2030 2035 Bicycling Group* 1,957 4,879 5,190
Implementation Actions 1. Develop scope for Bicycle Master Plan
2. Secure funding to develop the Bicycle Master Plan
3. Establish baseline bicycle mode share by 2015
4. Develop the plan and CEQA analysis
5. Implement plan recommendations
6. Establish bike-sharing for City staff
Responsible Department Community and Economic Development, Engineering Division
Progress Indicator with Target and Horizon
Bicycle mode share 2% annual increase over base
Implementation of Plan recommendations
25% by 2017 50% by 2020 75% by 2025 100% by 2030
Applicability All Development Segments
*Several strategies in this chapter contribute to this group. These numbers reflect the total savings from bicycling strategies.
TL5. Bike parking installations
Require bike parking facilities for all multi-family projects and non-residential uses.
Provide secure and convenient bicycle parking at City Hall and other city employment and services site entrances.
Safe and convenient bicycle parking provides an essential facility and increases the visibility of bicycling as a travel option to destinations within the Concord community. Bicycle parking must be designed and installed carefully to ensure convenience and security for the rider and the bicycle while locking their bike. This strategy also recognizes the potential to leverage regional and state funds for installation of high-quality bicycle parking.
This strategy will enable employees and visitors to safely and conveniently access City facilities by bike, and provide other visitors with a reminder of the option to bicycle.

City of Concord Citywide Climate Action Plan
Public Review Draft | March 2013 | Arup North America Ltd Page 54
TL5: Bike parking installations
Metric Tons CO2e Reduced from Baseline
2020 2030 2035
Bicycling Group* 1,957 4,879 5,190
Implementation Actions 1. Update development code to reflect policy (complete)
2. List criteria on permit application checklist
3. Find and apply for funding to assist developers and City
4. Identify entrances used by employees or visitors that do not have
bike parking that is within 30 feet and well-lit at night.
5. Identify and obtain funding for bicycle parking facilities at
entrances used by employees or visitors.
6. Install new parking and lighting as needed at entrances used by
employees or visitors.
Responsible Department Community and Economic Development, Planning Division, Public Works Department, Facility Operations and Programs
Progress Indicator with Target and Horizon
Percent of new multi-family and non-residential development with bike parking facilities
100% on-going
Number of existing multi-family and non-residential development adding bike parking facilities
5 per year, beginning 2015
Percent of city facilities with secure and convenient bicycle parking spaces
100% by 2020
Applicability All Development Segments
*Several strategies in this chapter contribute to this group. These numbers reflect the total savings from bicycling group strategies.
TL6. Safe Routes to Schools (SR2S) comprehensive program
Create a comprehensive Safe Routes to Schools program within Concord using the "five 'E's" to frame a comprehensive approach: engineering, enforcement, encouragement, education, evaluation.
Travel to- and from- school can be an opportunity to improve the health of students, reduce costs to households, and build skills necessary for future adults to use active transportation modes. Programs like walking school buses (where a group of children walk to school with one or more adults) and bicycle rodeos (where bicyclists learn and practice skills) can foster safe travel behaviors, while walk- and bicycle-audits can identify key improvements necessary to make roads and paths to schools safer. A July 2011 survey of school administrators in the Concord area (in the TRANSPAC jurisdiction) identified a significant opportunity to expand awareness and use of the SR2S programs administered through Contra Costa 511. This strategy could build

City of Concord Citywide Climate Action Plan
Public Review Draft | March 2013 | Arup North America Ltd Page 55
upon the Contra Costa 511 programs and include partnerships with Mt. Diablo Unified School District, private schools, and other organizations in Concord.
TL6: Safe Routes to Schools (SR2S) comprehensive program
Metric Tons CO2e Reduced from Baseline
2020 2030 2035
SR2S comprehensive program 165 262 427
Implementation Actions
1. Hold meetings with schools and identify projects and programs to improve student walking and bicycling access to schools
2. Establish baseline for student walk and bike access by 2015
3. Identify and secure funding for projects
4. Implement projects
Responsible
Community and Economic Development, Engineering Division
Progress Indicator with Target and Horizon
Number of projects improving pedestrian and bicycle access to schools
5 per year, beginning 2017
Percent of children walking or bicycling to school
5% annual increase over base, with goal of 80% walking or bicycling by 2035
Applicability All Development Segments
TL7. Bus signal priority
Study the feasibility and potential service benefits of installing bus priority signaling and queue-jumps at intersections to allow faster, more reliable, and more frequent buses on routes serving in Concord.
Bus priority signal allows approaching buses to trigger downstream traffic signals to extend the green light or change to a green light sooner in the cycle. The time savings to regularly scheduled bus service could allow for faster travel times and more frequent bus service. Bus queue-jumps provide preference to buses at an intersection by allowing a bus to jump to the front of the queue and proceed through the intersection before all other vehicles. The frequency and availability of transit service has been found to be among the greatest determinants of increased transit mode share within communities. If bus priority signals also increase the reliability of bus service (e.g., the consistency of departure and arrival times), it may attract additional riders for that reason. This strategy should be implemented in coordination with CCCTA, which is the primary bus operator in Concord. As this is implemented, the City should consider beginning with the CRP Area and rolling the strategy out to target intersections in other areas of Concord. It should also consider sharing costs across the CCCTA service area if time-savings benefit communities outside of Concord.

City of Concord Citywide Climate Action Plan
Public Review Draft | March 2013 | Arup North America Ltd Page 56
TL7: Bus signal priority
Metric Tons CO2e Reduced from Baseline
2020 2030 2035
Transit Group* 23 57 102
Implementation Actions 1. Coordinate with affected transit operators.
2. Establish baseline transit mode share.
3. Develop scope for Transit Priority Plan.
4. Secure funding to develop the Plan in collaboration with transit
operators.
5. Establish baseline transit mode share by 2015.
6. Develop the plan and CEQA analysis.
7. Implement plan recommendations.
Responsible Department Community & Economic Development Department, Traffic/Engineering Division
Progress Indicator with Target and Horizon
Percentage reduction in headways (increase in frequency)
20% reduction in headways by 2020
Transit mode share 10% increase in bus mode share by 2020
Applicability All Development Segments
*Several strategies in this chapter contribute to this group. These numbers reflect the total savings from transit group strategies.
TL8. Multi-modal way finding
Develop and implement a comprehensive multi-modal way finding plan, and consistent with the City's planning efforts near the Concord BART station and elsewhere in Downtown Concord.
Bicycle and pedestrian routes that are most comfortable, safe, or convenient may differ from those used by motorized traffic. This strategy seeks to facilitate the use of bicycles and walking by people new to riding or walking for those purposes by making it easier to find the best routes across town and to key destinations, such as transit stations, schools, medical services, and grocery stores.

City of Concord Citywide Climate Action Plan
Public Review Draft | March 2013 | Arup North America Ltd Page 57
TL8: Multi-modal way finding
Metric Tons CO2e Reduced from Baseline
2020 2030 2035
Pedestrian Group* 978 2,440 2,595 Bicycling Group* 1,957 4,879 5,190 Transit Group* 23 57 102
Implementation Actions 1. Develop scope for multi-modal wayfinding study and plan
2. Secure funding to develop the Plan
3. Secure funding to install signs
Responsible Department Community and Economic Development, Engineering Division
Progress Indicator with Target and Horizon
Number of new signs installed
50% of recommended signs within 2 years of plan adoption. Remaining 50% within 5 years of plan adoption
Applicability Existing and Infill Development Segments
*Several strategies in this chapter contribute to this group. These numbers reflect the total savings from pedestrian, bicycling, and transit group strategies.
TL9. City Forest Plan
Develop a street tree master plan for Downtown Concord and key street corridors.
Specify species of shade trees with ample canopies in a list of approved trees for the City that are either native trees or otherwise likely to be drought-tolerant.
Plant street trees in strategic locations to reduce the heat island effect and cool facilities owned or operated by the City, as well as reduce local ambient temperatures.
Street trees can help reduce greenhouse gas emissions in Concord in several ways. When planted closely together on either side of a roadway, trees have been shown to have traffic-calming effects.42 As a source of shade and beautification along sidewalks and bike lanes, trees can make walking and bicycling more pleasant, and thereby encourage use of active travel modes. By shading the street, trees also can reduce the relatively high ambient temperatures in urban areas (i.e., the heat island effect), and thereby reduce the need for use of air conditioning in nearby buildings and cars. While trees grow, they also collect and store (i.e., “sequester”) a limited amount of CO2 from the atmosphere. When native tree species are selected, trees also help provide habitat for native species of birds, insects, and other life forms (Please see the Chapter 8 for a discussion of the benefits native tree plantings can provide as the Concord community adapts to climate change.)
42 MacDonald et al 2008, Dumbaugh 2006, Rosenblatt Naderi et al 2008.

City of Concord Citywide Climate Action Plan
Public Review Draft | March 2013 | Arup North America Ltd Page 58
While many of Concord’s municipal facilities have trees nearby, there are many opportunities to strategically locate taller, native and low-water species of shade trees along the West and East faces of buildings, particularly low-rise facilities such as the Corporation Yard warehouses and Police Stations.
TL9: City Forest Plan
Metric Tons CO2e Reduced from Baseline
2020 2030 2035
Shade Trees Group* 6 6 6
Pedestrian Group* 978 2,440 2,595
Implementation Actions 1. Develop scope for Street Tree Master Plan
2. Secure funding to develop the Plan
3. Develop the plan and CEQA analysis
4. Implement plan recommendations
5. Include Municipal Forest Plan in the street tree master plan
described in TL 19.
Responsible Department Community & Economic Development, Planning Division; Public Works, Parks Division
Progress Indicator with Target and Horizon Number of street trees planted > 20 trees per year beginning 2015
Applicability Existing and Infill Development Segments
*Several strategies in this chapter contribute to each group. These numbers reflect the total savings from pedestrian and shade trees group strategies.
TL10. Prioritizing active modes in engineering and design
Implement the Complete Streets project through the following approaches to prioritizing the safety and comfort of active transportation users, among others:
• Prioritize pedestrian, bicycle, and automobile safety over vehicle level-of-service at intersections.
• Incorporate Crime Prevention through Environmental Design (CPTED) principles into review of public and private projects to increase safety for pedestrians, cyclists, and other transportation users.
• Review street reconstruction, development projects, and utility projects to identify opportunities to implement complete streets principles, including the concepts identified in the General Plan Transportation Element and the priorities of any adopted trails, bicycle, or pedestrian plans.
• Develop and apply a streamlined complete streets checklist for review of proposed transportation improvement projects.
• Develop specific street standards, include standard sections and design details, consistent with the guidance in the General Plan Transportation Element. As part of this process, determine the narrowest lane widths and tightest corner radii that
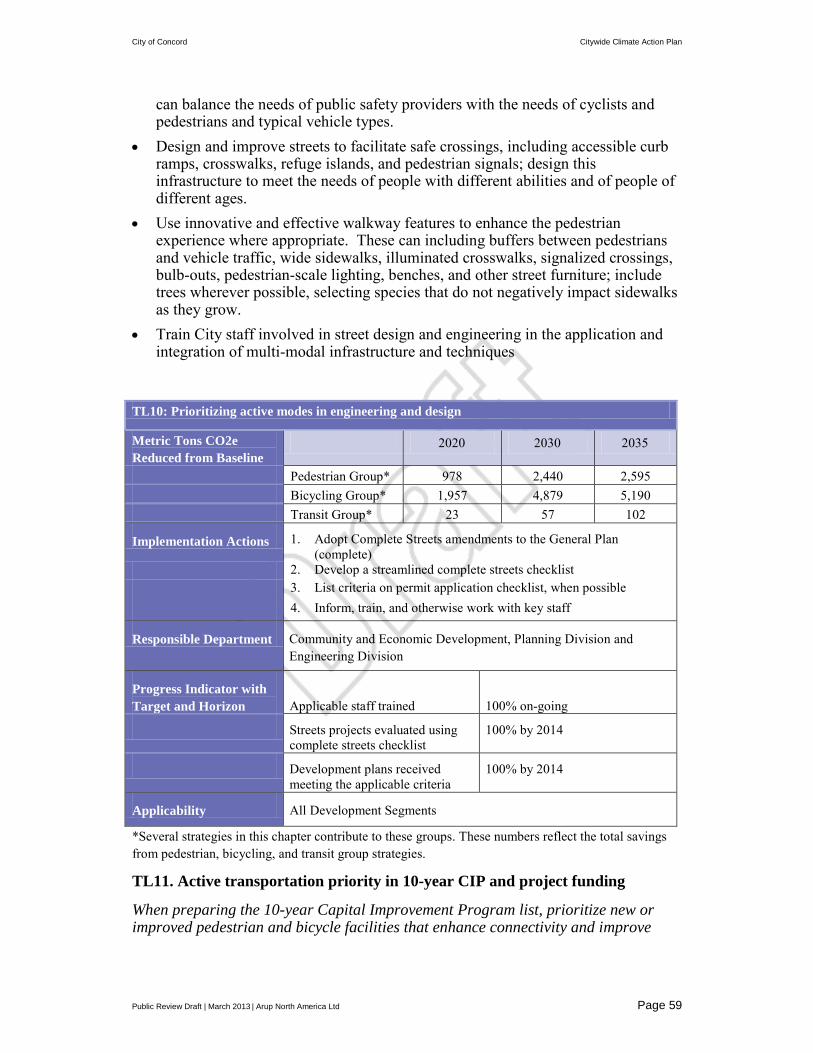
City of Concord Citywide Climate Action Plan
Public Review Draft | March 2013 | Arup North America Ltd Page 59
can balance the needs of public safety providers with the needs of cyclists and pedestrians and typical vehicle types.
• Design and improve streets to facilitate safe crossings, including accessible curb ramps, crosswalks, refuge islands, and pedestrian signals; design this infrastructure to meet the needs of people with different abilities and of people of different ages.
• Use innovative and effective walkway features to enhance the pedestrian experience where appropriate. These can including buffers between pedestrians and vehicle traffic, wide sidewalks, illuminated crosswalks, signalized crossings, bulb-outs, pedestrian-scale lighting, benches, and other street furniture; include trees wherever possible, selecting species that do not negatively impact sidewalks as they grow.
• Train City staff involved in street design and engineering in the application and integration of multi-modal infrastructure and techniques
TL10: Prioritizing active modes in engineering and design
Metric Tons CO2e Reduced from Baseline
2020 2030 2035
Pedestrian Group* 978 2,440 2,595 Bicycling Group* 1,957 4,879 5,190 Transit Group* 23 57 102
Implementation Actions 1. Adopt Complete Streets amendments to the General Plan (complete)
2. Develop a streamlined complete streets checklist
3. List criteria on permit application checklist, when possible
4. Inform, train, and otherwise work with key staff
Responsible Department Community and Economic Development, Planning Division and Engineering Division
Progress Indicator with Target and Horizon Applicable staff trained 100% on-going
Streets projects evaluated using complete streets checklist
100% by 2014
Development plans received meeting the applicable criteria
100% by 2014
Applicability All Development Segments
*Several strategies in this chapter contribute to these groups. These numbers reflect the total savings from pedestrian, bicycling, and transit group strategies.
TL11. Active transportation priority in 10-year CIP and project funding
When preparing the 10-year Capital Improvement Program list, prioritize new or improved pedestrian and bicycle facilities that enhance connectivity and improve

City of Concord Citywide Climate Action Plan
Public Review Draft | March 2013 | Arup North America Ltd Page 60
public safety. Identify priority projects to support active transportation modes and apply for regional, state, and federal grants.
The Capital Improvement Program (CIP) is a “living document” used by city staff to prioritize efforts to fund, study, design, and implement improvements to the City’s infrastructure. This strategy will help ensure that as projects are considered for the CIP list, consideration is given to making infrastructure in Concord more walk-friendly, bike-friendly, and public-transit friendly when feasible.
Growing interest at the regional, state, and national levels in supporting active transportation modes may enable Concord to apply for funds for walk-friendly, bike-friendly, and transit-friendly investments, supporting low-GHG travel.
TL11: Active transportation priority in 10-year CIP and Project Funding
Metric Tons CO2e Reduced from Baseline
2020 2030 2035
Pedestrian Group* 978 2,440 2,595 Bicycling Group* 1,957 4,879 5,190 Transit Group* 23 57 102
Implementation Actions 1. Prioritize bicycle and pedestrian projects in the CIP. 2. Identify funding for active transportation projects. 3. Apply for funding.
Responsible Department Community and Economic Development, Engineering Division
Progress Indicator with Target and Horizon
Percent of bicycle and pedestrian projects in the CIP
25% ongoing
Percent of total CIP cost that is bicycle or pedestrian projects
10% ongoing
Identify and apply for funding for active transportation projects
>2 per year
Applicability All Development Segments
*Several strategies in this chapter contribute to these groups. These numbers reflect the total savings from pedestrian, bicycling, and transit group strategies.
TL12. Transportation demand management (TDM) and transportation management associations
Assess the feasibility of transportation management associations (TMAs), particularly for downtown and other areas with concentrations of employees. TMAs could include such Transportation Demand Management (TDM) measures as promotion of flexible schedules and telecommute options; active commuter showers; emergency ride-home programs; parking cash-out programs; carpool and vanpool facilitation programs; shuttle services, etc. and informational programs such as Contra Costa 511.

City of Concord Citywide Climate Action Plan
Public Review Draft | March 2013 | Arup North America Ltd Page 61
Nation-wide, commuting contributes over a quarter of all vehicle miles traveled43. In order to reduce the greenhouse gas emissions from commuting to Concord jobs, this strategy seeks to find ways to incentivize programs that make it easier for employees to use low-GHG travel modes to work.
TL12: TDM and transportation management associations
Metric Tons CO2e Reduced from Baseline
2020 2030 2035
Commute Mode Shift Group* 253 576 747
Implementation Actions 1. Develop scope for TMA study
2. Secure funding
3. Perform study and develop policy
4. Update development code to reflect policy
5. List criteria on permit application checklist
6. Find and apply for funding to assist developers
Responsible Department Community and Economic Development, Engineering Division
Progress Indicator with Target and Horizon
Development plans received meeting the applicable criteria
100% on-going
Number of employers participating in a TMA
5 additional per year, beginning 2015
Applicability All Development Segments
*Several strategies in this chapter contribute to this group. These numbers reflect the total savings from commute mode shift group strategies.
TL13. Parking cash-out credits
Reduce the minimum parking rates for building owners and managers who offer a parking cash-out program in perpetuity through a Transportation Management Association. Reduce required parking by 6% for areas more than 0.5 miles from BART stations. Reduce required parking by 10% for areas within 0.5 miles of BART stations.
Parking cash-out programs give employees cash refunds equivalent to the cost of employer-provided parking. Parking cash-out programs have been shown to be effective for encouraging the use of low-GHG modes for commuting, especially when used in combination with other TDM programs. The reduced demand for parking can thereby enable property owners to reduce the amount of space given to parking.
43 Hu, 2004

City of Concord Citywide Climate Action Plan
Public Review Draft | March 2013 | Arup North America Ltd Page 62
TL13: Parking cash-out credits
Metric Tons CO2e Reduced from Baseline
2020 2030 2035
Commute Mode Shift Group* 253 576 747
Implementation Actions 1. Update Development Code to reflect policy 2. List criteria on permit application checklist
Responsible Department Community and Economic Development, Engineering Division
Progress Indicator with Target and Horizon
Eligible development plans received providing reductions compared to minimum parking
2% annual increase over base
Applicability Infill Development Segments
*Several strategies in this chapter contribute to this group. These numbers reflect the total savings from commute mode shift group strategies.
TL14. Downtown parking meters feasibility study
Study downtown parking. Include in the study consideration of parking occupancy rates on streets, public lots, and private lots in the downtown area and consider on-street parking pricing as a parking management tool once occupancy levels reach 85-90% in all short-term facilities on a regular basis. Consider a specific program of parking charges for downtown special events before all-day charges are warranted.
This strategy aims to increase downtown walkability while providing efficient and convenient parking access in the downtown area. This strategy builds on the City of Concord’s 2012 Todos Santos Plaza Parking Study, which found that the area was currently below the occupancy rates of 85 to 90 percent that would make the installation of parking meters effective. When that level of occupancy is achieved, the City will consider meters as a strategy to encourage optimal short term parking in metered spaces while encouraging longer term parking to occur in peripheral areas. The 2012 study also noted that private parking lots for services downtown may be impacted by employee parking, especially in the PM peak period, and so employee TDM programs may be especially complementary to this strategy.

City of Concord Citywide Climate Action Plan
Public Review Draft | March 2013 | Arup North America Ltd Page 63
TL14: Downtown parking meters feasibility study
Metric Tons CO2e Reduced from Baseline
2020 2030 2035
Not quantified NA NA NA
Implementation Actions 1. Monitor parking occupancy rates on streets, public lots, and private lots in the downtown area
2. Study on-street parking pricing once occupancy levels reach 85-
90% in all short-term facilities on a regular basis
3. Repeat the parking occupancy/demand survey at least every 3
years
4. Create metering implementation and enforcement fund and
require permit applicants for land use changes that are expected to increase parking demand in the area beyond the 85-90% occupancy rate to pay into the fund
Responsible Department Community and Economic Development, Engineering Division and Community and Economic Development, Planning Division
Progress Indicator with Target and Horizon
Parking occupancy survey shows >85% occupancy before any new parking capacity is added to downtown
100%, on-going
Percent of permit applicants proposing land use changes that are expected to increase parking demand in the area beyond the 85-90% occupancy rate who pay into the metering implementation and enforcement fund
100%, on-going
Applicability Infill Development Segments
TL15. Fleet efficiency
Replace 10 cars from the city's current fleet with hybrid or electric vehicles, and reduce the fleet's overall costs by 10% by retiring the least fuel efficient cars of their vehicle classes.
This strategy aims to reduce GHG emissions from the City’s vehicle fleet while reducing costs to the City and demonstrating low-GHG vehicle options to the public. Both the electric vehicle charging stations and the electric vehicles themselves, if visibly branded, can serve as a visual reminder of the City’s efforts to save energy and money on behalf of the citizens of Concord.

City of Concord Citywide Climate Action Plan
Public Review Draft | March 2013 | Arup North America Ltd Page 64
TL15: Fleet efficiency
Metric Tons CO2e Reduced from Baseline
2020 2030 2035
Fleet Efficiency 31 31 31
Implementation Actions
1. Replace fleet cars with hybrid or electric vehicles. 2. Reduce number of vehicles in fleet.
Responsible Department Public Works Department, Facility Operations and Programs
Progress Indicator with Target and Horizon
Number of fleet vehicles replaced with hybrid or electric vehicles
10 by 2015
Percent of vehicles reduced from the fleet
10% by 2015
Percent reduction of fleet's annual VMT
10% annually beginning 2015
Applicability All Development Segments
TL16. Limit idling of City fleet vehicles
Idling vehicles unnecessarily burn fuel. Implement and ensure awareness of a policy to limit idling to reduce fuel use and associated emissions while saving funds for the City.
This strategy aims to reduce GHG emissions while also reducing costs to the City and air pollution in Concord. The policy created will reduce allowed idling to a specified number of minutes, less than the five minutes currently permitted by the State of California.

City of Concord Citywide Climate Action Plan
Public Review Draft | March 2013 | Arup North America Ltd Page 65
TL16: Limit idling of City fleet vehicles
Metric Tons CO2e Reduced from Baseline
2020 2030 2035
Limit idling 51 51 51
Implementation Actions
1. Identify the number of trucks, buses, and light vehicles subject to
the policy.
2. Remind staff of the policy and its benefits
Responsible Department Public Works Department, Facility Operations and Programs
Progress Indicator with Target and Horizon
Number of times staff is reminded
> 2 times per year
Variety of ways staff is reminded
> 2 methods (e.g., email, postings)
Applicability Concord Naval Weapons Station, Infill Development, Existing Development
TL17. Affordable housing parking credits
For residential developments including affordable housing units, particularly for those near transit, reduce the parking minimums in recognition of reduced rates of car ownership among populations living near high-quality transit and among low-income populations, as well as the need for designated affordable housing.
Lower demand for parking can be leveraged by developers of multi-unit residential buildings to make more efficient use of land near transit stations or where affordable housing is provided. Increasing the number of housing units in Concord near high-quality transit stations and affordable to people at low- and very-low incomes would in turn decrease per capita auto use in Concord and increase the use of public transportation and active transportation modes.
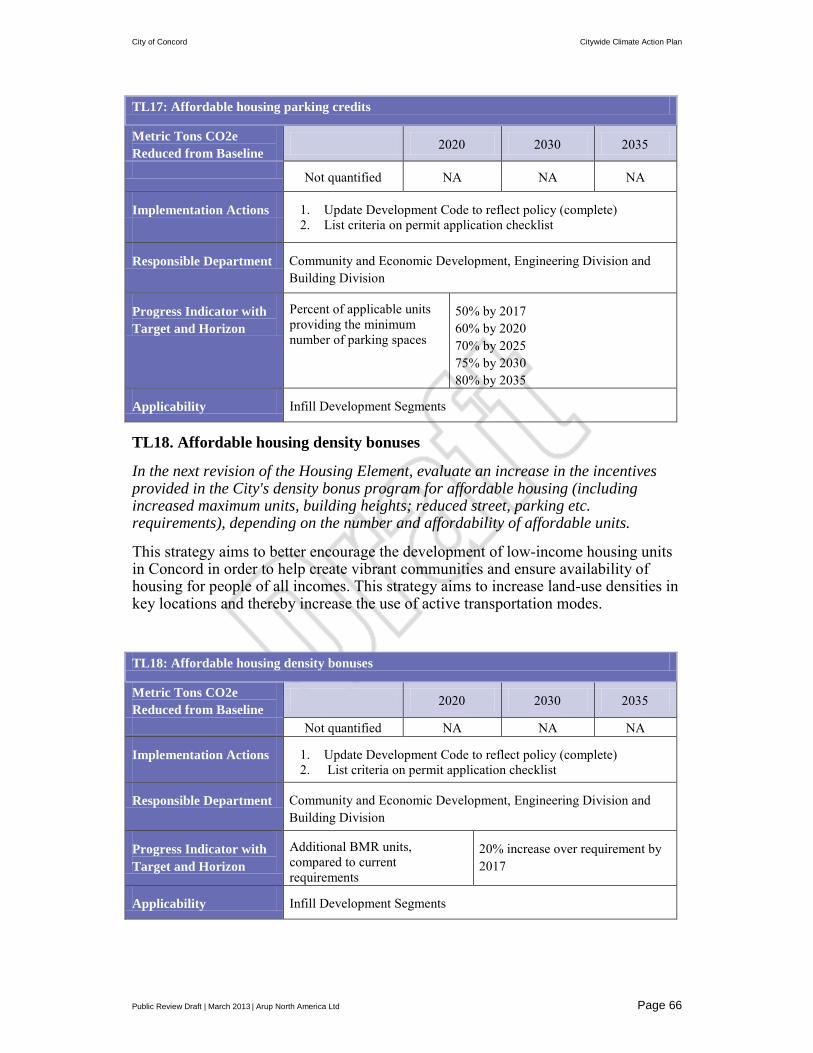
City of Concord Citywide Climate Action Plan
Public Review Draft | March 2013 | Arup North America Ltd Page 66
TL17: Affordable housing parking credits
Metric Tons CO2e Reduced from Baseline
2020 2030 2035
Not quantified NA NA NA
Implementation Actions 1. Update Development Code to reflect policy (complete)
2. List criteria on permit application checklist
Responsible Department Community and Economic Development, Engineering Division and Building Division
Progress Indicator with Target and Horizon
Percent of applicable units providing the minimum number of parking spaces
50% by 2017 60% by 2020 70% by 2025 75% by 2030 80% by 2035
Applicability Infill Development Segments
TL18. Affordable housing density bonuses
In the next revision of the Housing Element, evaluate an increase in the incentives provided in the City's density bonus program for affordable housing (including increased maximum units, building heights; reduced street, parking etc. requirements), depending on the number and affordability of affordable units.
This strategy aims to better encourage the development of low-income housing units in Concord in order to help create vibrant communities and ensure availability of housing for people of all incomes. This strategy aims to increase land-use densities in key locations and thereby increase the use of active transportation modes.
TL18: Affordable housing density bonuses
Metric Tons CO2e Reduced from Baseline
2020 2030 2035
Not quantified NA NA NA
Implementation Actions 1. Update Development Code to reflect policy (complete)
2. List criteria on permit application checklist
Responsible Department Community and Economic Development, Engineering Division and Building Division
Progress Indicator with Target and Horizon
Additional BMR units, compared to current requirements
20% increase over requirement by 2017
Applicability Infill Development Segments

City of Concord Citywide Climate Action Plan
Public Review Draft | March 2013 | Arup North America Ltd Page 67
TL19. Parking lot shading
Develop city-wide parking lot shading regulations to reduce the heat island effect and thereby lower local temperatures. Shading can be achieved through photovoltaic canopies, neighboring buildings, or shade trees of native species. Requirements may be stated as percent of lot area shaded per average daylight hour, averaged over one year in a modeled solar path.
Allow additional shade trees (from list of approved, native or low-water shade trees, considering low-VOC trees) to be installed in existing non-residential parking lots without requiring replacement of lost parking spaces (when increase in building area or change in use is not being proposed) up to 10% of the parking spaces available before planting.
Unshaded pavement in parking lots directly contributes to the urban heat island effect, which makes travel by active modes less comfortable and increases the need for air conditioning and other kinds of cooling in local facilities. When native tree species are selected for shading, they also provide habitat, support a friendly urban environment and sequester carbon. Trees can also improve the aesthetic quality of parking lots for passersby and for parking lot users. In the process of growing, trees collect and store (i.e., sequester) a limited amount of CO2 from the atmosphere. When native tree species are selected, trees also help provide habitat for native species of birds, insects, and other life forms (Please see Chapter 8 for a discussion of the benefits native tree plantings can provide as the Concord community adapts to climate change.)
TL19: Parking lot shading
Metric Tons CO2e Reduced from Baseline
2020 2030 2035
Shade trees* 6 6 6
Implementation Actions 1. Develop parking lot shade requirements
2. Update Development Code to reflect policy
3. Include on Permit Application Checklist
Responsible Department Community & Economic Development, Planning and Building Divisions; Public Works, Parks Division
Progress Indicator with Target and Horizon
Percent of new parking lots shaded per requirement
100%, on-going
Applicability Infill Development Segments
*Two strategies in this chapter contribute to the shade trees quantification group. These numbers reflect the total savings from both strategies.
TL20. Cool Pavements
Require paving that meets minimum Solar Reflectance Index (SRI) values that are higher than conventional paving in new developments and significant retrofit projects.

City of Concord Citywide Climate Action Plan
Public Review Draft | March 2013 | Arup North America Ltd Page 68
Incorporate cool pavement technology into the regular maintenance of existing streets, sidewalks, parking areas, paved trails, and bike lanes.
This strategy aims to reduce the heat island effect in Concord by reducing heat absorption in pavements. The heat island effect raises ambient temperatures in built-up areas, and requires more energy to be used in air conditioning and other cooling systems.
This strategy aims to reduce temperatures local to the pavements and thus reduce the need for air conditioning nearby. By reflecting solar energy back into the atmosphere rather than absorbing it, cool pavements help reduce the heat island effect common in urban areas. Cooler street temperatures also benefit waterways that receive stormwater runoff from streets, and reduce the formation of smog. Reflective pavements can also help illuminate an area and have been shown to reduce the number of light fixtures needed for street lighting at night.44
TL20: Cool Pavements
Metric Tons CO2e Reduced from Baseline
2020 2030 2035
Not quantified NA NA NA
Implementation Actions 1. Update Development Code to reflect policy
2. Include on Permit Application Checklist
3. Incorporate cool pavement technology into the regular maintenance of existing streets, sidewalks, parking areas, paved trails, and bike lanes.
Responsible Department Community and Economic Development, Planning Division and Building Division Public Works Department
Progress Indicator with Target and Horizon
Percent of new development meeting minimum SRI values
100%, on-going
Percent of applicable maintenance projects incorporating cool pavement technology
100% by 2015
Applicability Infill Development Segments
TL21. Dense and accessible station areas
Implement General Plan policies calling for transit-oriented development around the BART stations through Specific Plans and other tools that specify design standards supportive of pedestrian and bicycle access to the stations. 44 See http://heatisland.lbl.gov/coolscience/cool-science-cool-pavements
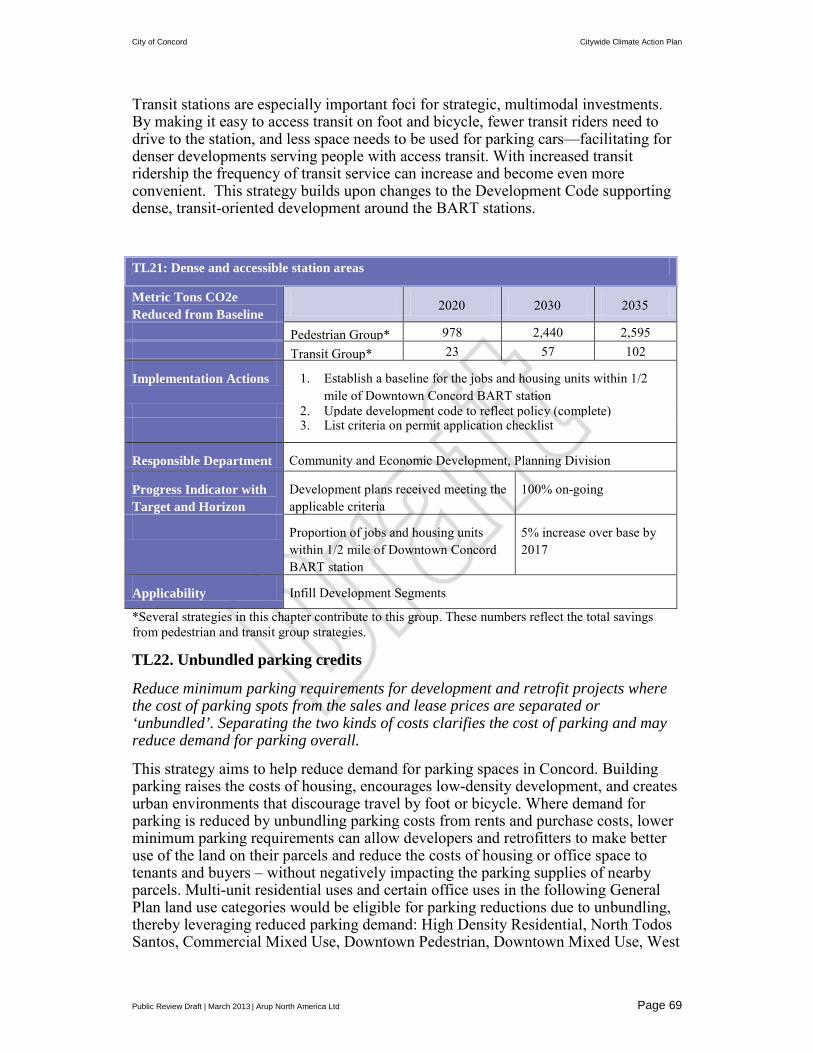
City of Concord Citywide Climate Action Plan
Public Review Draft | March 2013 | Arup North America Ltd Page 69
Transit stations are especially important foci for strategic, multimodal investments. By making it easy to access transit on foot and bicycle, fewer transit riders need to drive to the station, and less space needs to be used for parking cars—facilitating for denser developments serving people with access transit. With increased transit ridership the frequency of transit service can increase and become even more convenient. This strategy builds upon changes to the Development Code supporting dense, transit-oriented development around the BART stations.
TL21: Dense and accessible station areas
Metric Tons CO2e Reduced from Baseline
2020 2030 2035
Pedestrian Group*
978 2,440 2,595 Transit Group* 23 57 102
Implementation Actions 1. Establish a baseline for the jobs and housing units within 1/2 mile of Downtown Concord BART station
2. Update development code to reflect policy (complete)
3. List criteria on permit application checklist
Responsible Department Community and Economic Development, Planning Division
Progress Indicator with Target and Horizon
Development plans received meeting the applicable criteria
100% on-going
Proportion of jobs and housing units within 1/2 mile of Downtown Concord BART station
5% increase over base by 2017
Applicability Infill Development Segments
*Several strategies in this chapter contribute to this group. These numbers reflect the total savings from pedestrian and transit group strategies.
TL22. Unbundled parking credits
Reduce minimum parking requirements for development and retrofit projects where the cost of parking spots from the sales and lease prices are separated or ‘unbundled’. Separating the two kinds of costs clarifies the cost of parking and may reduce demand for parking overall.
This strategy aims to help reduce demand for parking spaces in Concord. Building parking raises the costs of housing, encourages low-density development, and creates urban environments that discourage travel by foot or bicycle. Where demand for parking is reduced by unbundling parking costs from rents and purchase costs, lower minimum parking requirements can allow developers and retrofitters to make better use of the land on their parcels and reduce the costs of housing or office space to tenants and buyers – without negatively impacting the parking supplies of nearby parcels. Multi-unit residential uses and certain office uses in the following General Plan land use categories would be eligible for parking reductions due to unbundling, thereby leveraging reduced parking demand: High Density Residential, North Todos Santos, Commercial Mixed Use, Downtown Pedestrian, Downtown Mixed Use, West
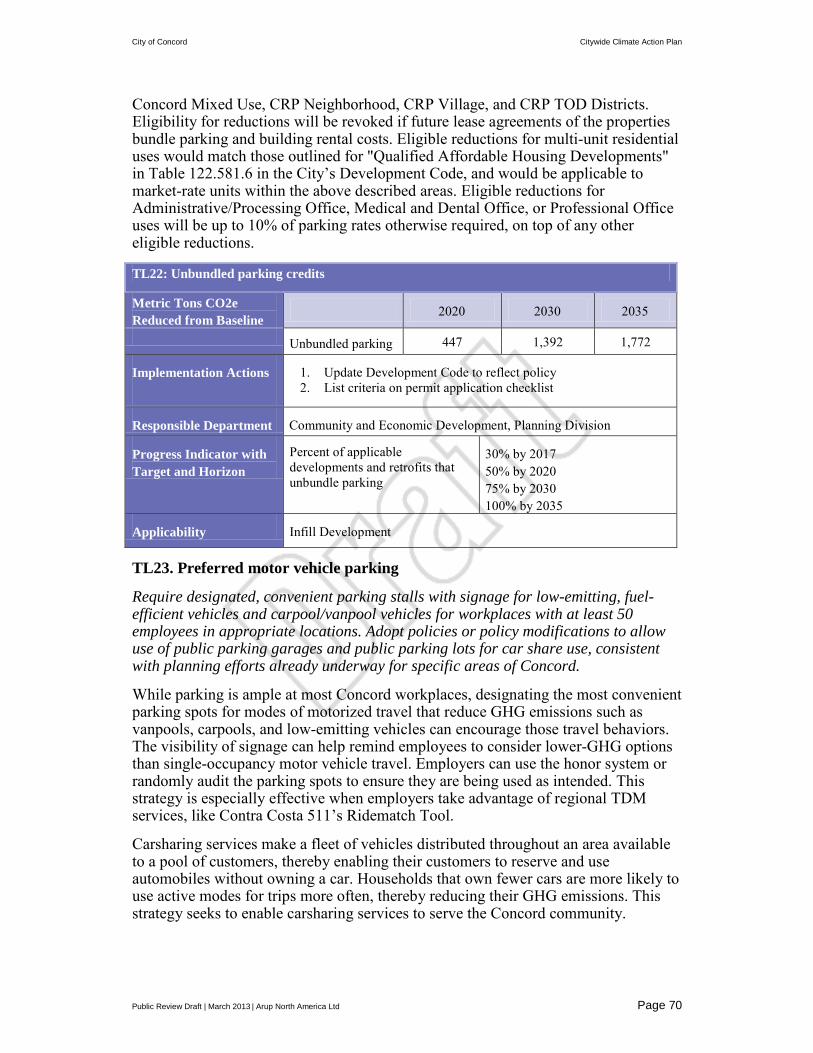
City of Concord Citywide Climate Action Plan
Public Review Draft | March 2013 | Arup North America Ltd Page 70
Concord Mixed Use, CRP Neighborhood, CRP Village, and CRP TOD Districts. Eligibility for reductions will be revoked if future lease agreements of the properties bundle parking and building rental costs. Eligible reductions for multi-unit residential uses would match those outlined for "Qualified Affordable Housing Developments" in Table 122.581.6 in the City’s Development Code, and would be applicable to market-rate units within the above described areas. Eligible reductions for Administrative/Processing Office, Medical and Dental Office, or Professional Office uses will be up to 10% of parking rates otherwise required, on top of any other eligible reductions.
TL22: Unbundled parking credits
Metric Tons CO2e Reduced from Baseline
2020 2030 2035
Unbundled parking 447 1,392 1,772
Implementation Actions 1. Update Development Code to reflect policy
2. List criteria on permit application checklist
Responsible Department Community and Economic Development, Planning Division
Progress Indicator with Target and Horizon
Percent of applicable developments and retrofits that unbundle parking
30% by 2017 50% by 2020 75% by 2030 100% by 2035
Applicability Infill Development
TL23. Preferred motor vehicle parking
Require designated, convenient parking stalls with signage for low-emitting, fuel-efficient vehicles and carpool/vanpool vehicles for workplaces with at least 50 employees in appropriate locations. Adopt policies or policy modifications to allow use of public parking garages and public parking lots for car share use, consistent with planning efforts already underway for specific areas of Concord.
While parking is ample at most Concord workplaces, designating the most convenient parking spots for modes of motorized travel that reduce GHG emissions such as vanpools, carpools, and low-emitting vehicles can encourage those travel behaviors. The visibility of signage can help remind employees to consider lower-GHG options than single-occupancy motor vehicle travel. Employers can use the honor system or randomly audit the parking spots to ensure they are being used as intended. This strategy is especially effective when employers take advantage of regional TDM services, like Contra Costa 511’s Ridematch Tool.
Carsharing services make a fleet of vehicles distributed throughout an area available to a pool of customers, thereby enabling their customers to reserve and use automobiles without owning a car. Households that own fewer cars are more likely to use active modes for trips more often, thereby reducing their GHG emissions. This strategy seeks to enable carsharing services to serve the Concord community.

City of Concord Citywide Climate Action Plan
Public Review Draft | March 2013 | Arup North America Ltd Page 71
TL23: Preferred motor vehicle parking
Metric Tons CO2e Reduced from Baseline
2020 2030 2035
Car-share parking 965 1,204 1,280
Commute Mode Shift Group*
253 576 747
Implementation Actions 1. Notify parking facility owners of policy
2. Update Development Code to reflect policy
3. List criteria on permit application checklist
Responsible Department Community and Economic Development, Engineering Division
Progress Indicator with Target and Horizon
Percent of parking capacity designated for low-emitting, fuel-efficient vehicles and carpool/van pool vehicles in appropriate facilities.
8% on-going
Applicability Existing and Infill Development Segments
*Several strategies in this chapter contribute to this group. These numbers reflect the total savings from commute mode shift group strategies.
TL24. Active commuter showers
Require showers for active commuters to freshen up at all new buildings or building additions as is appropriate to the number of commuters.
In order to allow employees who use active transportation modes like bicycling to be comfortable after their journey to work, well-maintained showers and lockers can be installed at or near workplaces with large numbers of employees. In districts with many employers with a small number of employees each, jointly-maintained showers may serve the same purpose.
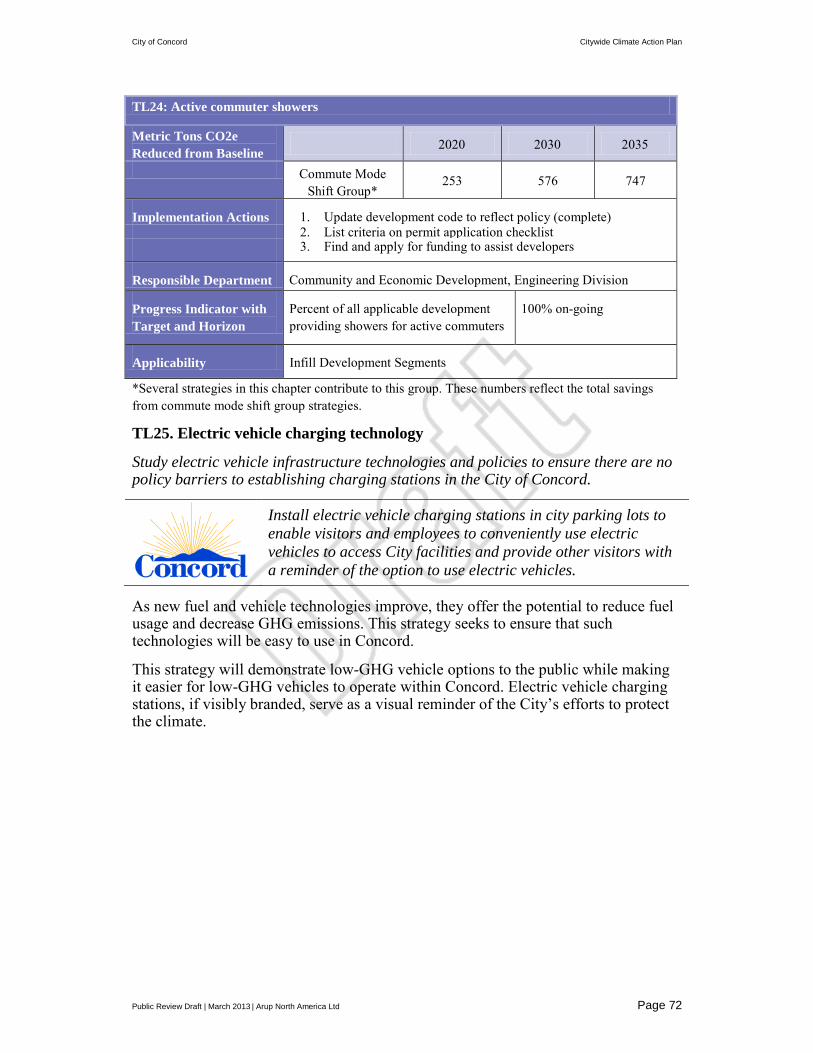
City of Concord Citywide Climate Action Plan
Public Review Draft | March 2013 | Arup North America Ltd Page 72
TL24: Active commuter showers
Metric Tons CO2e Reduced from Baseline
2020 2030 2035
Commute Mode Shift Group*
253 576 747
Implementation Actions 1. Update development code to reflect policy (complete)
2. List criteria on permit application checklist
3. Find and apply for funding to assist developers
Responsible Department Community and Economic Development, Engineering Division
Progress Indicator with Target and Horizon
Percent of all applicable development providing showers for active commuters
100% on-going
Applicability Infill Development Segments
*Several strategies in this chapter contribute to this group. These numbers reflect the total savings from commute mode shift group strategies.
TL25. Electric vehicle charging technology
Study electric vehicle infrastructure technologies and policies to ensure there are no policy barriers to establishing charging stations in the City of Concord.
Install electric vehicle charging stations in city parking lots to enable visitors and employees to conveniently use electric vehicles to access City facilities and provide other visitors with a reminder of the option to use electric vehicles.
As new fuel and vehicle technologies improve, they offer the potential to reduce fuel usage and decrease GHG emissions. This strategy seeks to ensure that such technologies will be easy to use in Concord.
This strategy will demonstrate low-GHG vehicle options to the public while making it easier for low-GHG vehicles to operate within Concord. Electric vehicle charging stations, if visibly branded, serve as a visual reminder of the City’s efforts to protect the climate.

City of Concord Citywide Climate Action Plan
Public Review Draft | March 2013 | Arup North America Ltd Page 73
TL25: Electric vehicle charging technology
Metric Tons CO2e Reduced from Baseline
2020 2030 2035
Not quantified NA NA NA
Implementation Actions 1. Develop scope for electric vehicle charging technology study
2. Secure funding
3. Perform study and develop policy
4. Update development code to reflect policy
5. List criteria on permit application checklist
6. Install electric vehicle charging stations in city parking lots.
Responsible Department Community and Economic Development, Engineering Division Public Works Department, Facility Operations and Programs
Progress Indicator with Target and Horizon
Number of electric vehicle charging stations in the city
>5 by 2020
Percent of city parking facilities with electric vehicle charging stations.
50% by 2015 100% by 2020
Applicability All Development Segments
T26: Accessible locations for City jobs and services
Establish a set of criteria for evaluating and choosing the most conveniently walkable, bikeable, and transit-accessible options when locating City facilities. Ensure that plans address designs for incorporating diverse uses while maintaining the aesthetic integrity of existing uses.
This strategy aims to achieve reductions in greenhouse gas emissions due to employee commute VMT and municipal fleet VMT in the long-term by locating City facilities within walking distance of related uses such as eating establishments, personal services, and transit stops. While the City does not anticipate developing new municipal facilities, any such development would offer opportunities for deep GHG reductions45 due to this strategy. If diverse uses develop near existing facilities they can make those locations more convenient, as well as serve other visitors and residents of the nearby areas.
The City will also investigate ways for employees to telecommute in ways that allow them to complete all of their job duties appropriately and continue to provide seamless service to Concord residents and businesses.
45 CAPCOA Quantification Guide (p.160) notes that developments in places with "suburban center" characteristics, with higher densities and more diverse land uses than conventional suburbs, can achieve 10% reductions of VMT, and thus of GHGs.

City of Concord Citywide Climate Action Plan
Public Review Draft | March 2013 | Arup North America Ltd Page 74
T26: Accessible locations for City jobs and services
Metric Tons CO2e Reduced from Baseline
2020 2030 2035
Not quantified NA NA NA
Implementation Actions
1. Establish a set of criteria for evaluating and choosing the most
conveniently walkable, bikeable, and transit-accessible locations for City facilities.
2. Evaluate potential for City employee telecommutes.
Responsible Department Community and Economic Development, Planning Division
Progress Indicator with Target and Horizon
Percent of new city facilities meeting established criteria for an accessible location
100% by 2014
Applicability Infill Development

City of Concord Citywide Climate Action Plan
Public Review Draft | March 2013 | Arup North America Ltd Page 75
8 Municipal Operations Strategies The Municipal Operations sector includes the greenhouse gas emissions over which the City has the most direct influence. The sector represents opportunities for reduction strategies to be implemented, including going beyond the strategies and targets set for the broader Concord community. Achieving better results for municipal buildings and transportation efficiency, for example, will build awareness within Concord about commercial building retrofits and demonstrate the City’s commitment to reaching the emissions reduction goals of this Climate Action Plan.
Most of the City’s emissions result from the Buildings & Other Facilities sector, as can be seen in Figure 4. The municipal operations emissions are a subset of the community-wide emissions and have already been included in the 2005 community-wide baseline and business-as-usual forecasts for the reduction target years. Totaling 8,27046 MTCO2e in 2005, emissions from municipal operations comprise nearly 1% of community-wide greenhouse gas emissions. This small amount does not reflect the full importance of municipal operations, however. The City can lead by example for GHG reductions in its roles as an employer; an owner; tenant, operator of commercial properties, fleet vehicles and other facilities; and a community services provider.
Figure 4: Components of Municipal Operations Baseline Emissions
Over the target years the City does not expect significant municipal staffing increases, so the municipal operations forecast is expected to decrease over time due to the implementation of Statewide mandates. See Table 7 for a summary of the forecasted Municipal Operations emissions. 46 This total does not include CO2e from HFCs, PFCs, and SF6, as the CAP focuses instead on CO2, CH4, and N2O, the gases for which the City can make reliable estimates.
Buildings & Other
Facilities 30%
Vehicle Fleet 27%
Employee Commute
14%
Solid Waste 13%
Public Lighting
12%
Wastewater 2%
Water Delivery
2%
2005 GHG Emissions by Municipal Operations Sector

City of Concord Citywide Climate Action Plan
Public Review Draft | March 2013 | Arup North America Ltd Page 76
Table 7: Municipal Operations Summary Forecast
Forecast 2005 2020 2030 2035
Inventory MT CO2e
Forecast MT CO2e
Forecast MT CO2e
Forecast MT CO2e
Baseline and BAU 8,269 8,269 8,269 8,269
Baseline and BAU with State Mandates
8,269 6,521 6,250 6,233
The City has already undertaken a variety of climate actions to reduce Municipal Operations emissions, especially through a contract with Chevron Energy Solutions for a variety of equipment upgrades and installation of a photovoltaic system. The energy efficiency strategies the City has already committed to will reduce its emissions by over 5.5% (34747 metric tons CO2e) from the 2035 target year business-as-usual forecast when accounting for State Mandates. The City of Concord is committed to enacting substantial emissions through a wide variety of strategies included in this section, which will reduce Municipal Operations sector emissions even further.
Throughout the two prior chapters on buildings and transportation and land use strategies, strategies with a municipal component have been indicated with the City’s logo. This chapter provides additional background on municipal strategies and identifies the relevant strategies in the prior chapters.
Several of the strategies designed to reduce municipal operations GHG emissions are not quantifiable at this time. Future updates to this CAP should take advantage of improved knowledge in the fields of green building, VMT reduction, utilities, and urban planning to quantify the reductions from these strategies if possible.
A full list of all strategies with specific actions or performance targets to reduce GHG emissions is included below, and discussed by theme in the following sections.
Climate Action Measures: Municipal Buildings and Other Facilities
BE1 Green Building Ordinance
BE2 Prepare for California Zero Net Energy Standards
BE3 Energy Audits for Existing Buildings: Actions 4 through 8
BE4 Demand response programs: All actions
BE6 Renewable Energy Facilitation: Action 4
TL9 City Forest Plan
TL20 Cool pavements: Action 3
47 This includes the solid waste reductions in the Chevron Energy Solutions contract.

City of Concord Citywide Climate Action Plan
Public Review Draft | March 2013 | Arup North America Ltd Page 77
Climate Action Measures: Municipal Vehicle Fleet
TL4 Bike master plan: Action 6
TL15 Fleet efficiency
TL16 Limit idling of City fleet vehicles
Climate Action Measures: Municipal Employee Commute
TL5 Bike parking installations: Actions 4 through 6
TL25 Electric vehicle charging technology: Action 6
TL26 Accessible locations for City jobs and services: All actions
Climate Action Measure: Municipal Public Lighting
BE9 Public lighting retrofit
Climate Action Measures: Municipal Water Delivery and Waste Water
BH1 Water efficient fixtures and appliances: Actions 5 and 6
BH2 Water-efficient outdoor irrigation: Actions 4 through 6
BH3 Water metering and monitoring: Action 3
BH4 Recycled water
Climate Action Strategy: Municipal Solid Waste
BW1 Expanded waste reduction program
8.1 Municipal Buildings and Other Facilities The City of Concord operates 22 major facilities and numerous minor facilities and wireless transmitters that contribute to GHG emissions. Facilities include offices, parks, police stations, the community pool, recreation centers, parking garages, the corporation yard, Camp Concord—located in South Lake Tahoe—and more.
Climate Action Measures: Municipal Buildings and Other Facilities
BE1 Green Building Ordinance
BE2 Prepare for California Zero Net Energy Standards
BE3 Energy Audits for Existing Buildings: Actions 4 through 8
BE4 Demand response programs: All actions
BE6 Renewable Energy Facilitation: Action 4
TL9 City Forest Plan
TL20 Cool pavements: Action 3
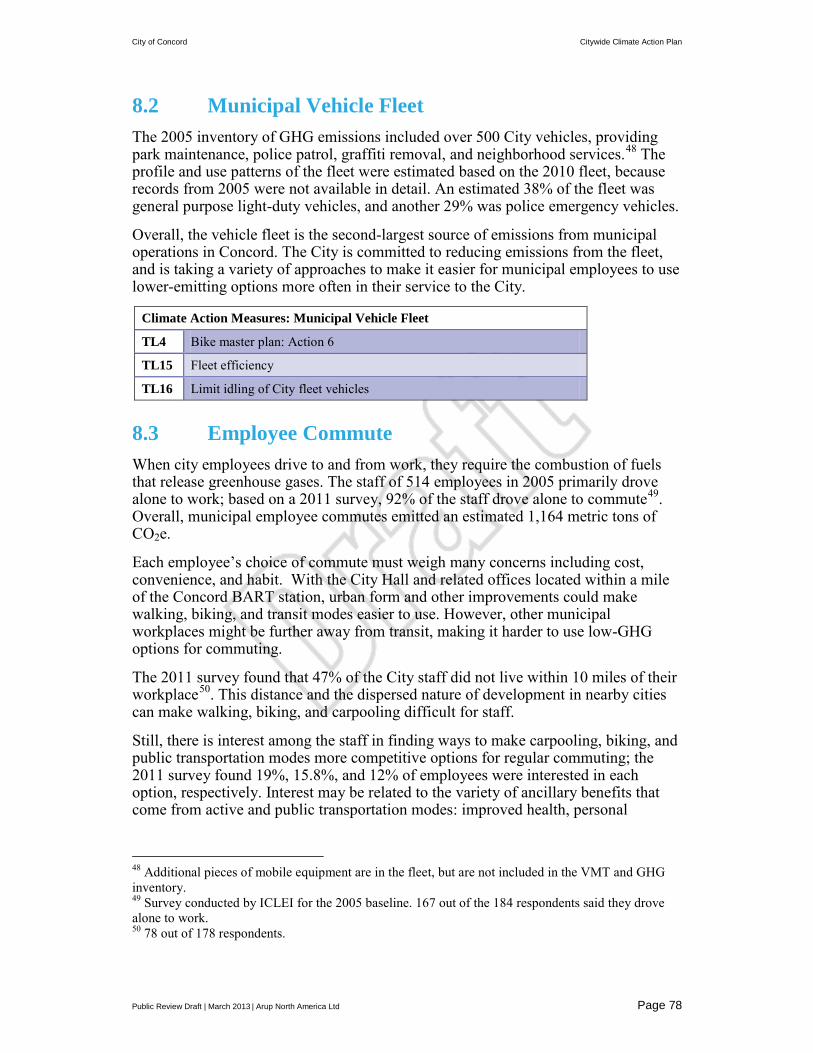
City of Concord Citywide Climate Action Plan
Public Review Draft | March 2013 | Arup North America Ltd Page 78
8.2 Municipal Vehicle Fleet The 2005 inventory of GHG emissions included over 500 City vehicles, providing park maintenance, police patrol, graffiti removal, and neighborhood services.48 The profile and use patterns of the fleet were estimated based on the 2010 fleet, because records from 2005 were not available in detail. An estimated 38% of the fleet was general purpose light-duty vehicles, and another 29% was police emergency vehicles.
Overall, the vehicle fleet is the second-largest source of emissions from municipal operations in Concord. The City is committed to reducing emissions from the fleet, and is taking a variety of approaches to make it easier for municipal employees to use lower-emitting options more often in their service to the City.
Climate Action Measures: Municipal Vehicle Fleet
TL4 Bike master plan: Action 6
TL15 Fleet efficiency
TL16 Limit idling of City fleet vehicles
8.3 Employee Commute When city employees drive to and from work, they require the combustion of fuels that release greenhouse gases. The staff of 514 employees in 2005 primarily drove alone to work; based on a 2011 survey, 92% of the staff drove alone to commute49. Overall, municipal employee commutes emitted an estimated 1,164 metric tons of CO2e.
Each employee’s choice of commute must weigh many concerns including cost, convenience, and habit. With the City Hall and related offices located within a mile of the Concord BART station, urban form and other improvements could make walking, biking, and transit modes easier to use. However, other municipal workplaces might be further away from transit, making it harder to use low-GHG options for commuting.
The 2011 survey found that 47% of the City staff did not live within 10 miles of their workplace50. This distance and the dispersed nature of development in nearby cities can make walking, biking, and carpooling difficult for staff.
Still, there is interest among the staff in finding ways to make carpooling, biking, and public transportation modes more competitive options for regular commuting; the 2011 survey found 19%, 15.8%, and 12% of employees were interested in each option, respectively. Interest may be related to the variety of ancillary benefits that come from active and public transportation modes: improved health, personal
48 Additional pieces of mobile equipment are in the fleet, but are not included in the VMT and GHG inventory. 49 Survey conducted by ICLEI for the 2005 baseline. 167 out of the 184 respondents said they drove alone to work. 50 78 out of 178 respondents.
City of Concord Citywide Climate Action Plan
Public Review Draft | March 2013 | Arup North America Ltd Page 79
financial savings, and availability of travel time to read, socialize, or otherwise multitask.
For these reasons, the strategies for reducing employee commute emissions use a variety of approaches to ensure benefits to all employees, as well as to visitors to City facilities.
Climate Action Measures: Municipal Employee Commute
TL5 Bike parking installations: Actions 4 through 6
TL25 Electric vehicle charging technology: Action 6
TL26 Accessible locations for City jobs and services: All actions
8.4 Public Lighting The 2005 inventory of GHG emissions from government operations found that public lighting resulted in 978 MTCO2e.51 Of that, 78% came just from street lights. Traffic signals and controllers accounted for 14%, while park lighting contributed 6% of the emissions in this sector.
The street lighting and park lighting categories offer the greatest opportunity for improvement due to energy efficient technologies like induction lamps. They also present opportunities for improved lighting quality (clearer lights) and reduced maintenance costs to the City. Even 40W induction lamps can achieve higher quality lighting than the 70W high pressure sodium lamps. Additionally, the expected life of the induction lamp and generator is 100,000 hours, which at the current street lamp operational hours is the equivalent of nearly 20 years.
The retrofits called for in the strategies below are already contracted by the City to Chevron Energy Solutions, and are likely to start reducing GHGs by the end of 2013.52
Climate Action Measure: Municipal Public Lighting
BE9 Public lighting retrofit
8.5 Water It takes energy to pump and distribute clean water toward municipal facilities and remove waste water to be treated at the Central Contra Costa Sanitary District plant. In 2005, water delivery (including pumping and irrigating) to municipal facilities caused an estimated 126 metric tons CO2e, while waste water pumping caused an estimated 145 metric tons CO2e.
51 Per the Government Operations 2005 Inventory (page 18), “prior to April 22, 2005, a portion of the City's streetlights were owned, operated, and maintained by PG&E. The emissions created during PG&E ownership (4.033 montl1s) are reflected as an information item. The remaining months of usage and resulting emissions are captured in the City of Concord's streetlight emissions.” 52 Chevron Energy Solutions. 2011.
City of Concord Citywide Climate Action Plan
Public Review Draft | March 2013 | Arup North America Ltd Page 80
By conserving water, the City of Concord can reduce GHG emissions while also saving money on utility bills. Conserving water can also help reduce costly infrastructure investments by the water and sanitary districts.
Strategies from other sectors may also help reduce water consumption in municipal operations in the future. For example, choosing native or low-water plants for City plantings will demand less irrigation water while also helping to make local ecosystems more adaptive to the effects of climate change.
Climate Action Measures: Municipal Water Delivery and Waste Water
BH1 Fixture and appliance water efficiency
BH2 Site water efficiency BH3 Water use metering and monitoring
BH4 Recycled water
8.6 Waste In 2005, 4,238 tons of solid waste was hauled by truck to the landfill from municipal operations, where biodegradable waste materials contributed to the production of methane gas. In that year, the city had diverted approximately 42% of all the solid waste it produced by to recycling and compost.
Because materials use and waste practices vary so much between City departments, the strategy that follows sets a simple performance goal and leaves it up to each department of the City to ensure the City reaches its municipal operations goal, ensuring that the City does its part to reach the citywide 2020 targets for solid waste diversion.
Climate Action Strategy: Municipal Waste
BW1 Expanded waste reduction program
9 Climate Change Adaptation Strategies As was described in Chapter 2, some significant climate change impacts are expected over the coming decades. The actions that Concord is taking through this CAP, supporting actions by other communities throughout the state, will take years to implement, and further time to reduce or eventually reverse the effects of climate change. For this reason, it is important that the community be prepared for climate change, including readiness to adapt to its predicted impacts. This chapter highlights adaptation strategies specific to Concord, relying upon the predicted impacts described in Chapter 2.
It is important to note that there is a range of adaptation strategies: some are more complementary to the climate action strategies in this CAP than others. See Figure 5 for examples of actions that help achieve both goals of slowing climate change and also helping adapt to climate change impacts, in contrast to actions that conflict with either or both goals. All actions included in Concord’s Adaptation Strategies or

City of Concord Citywide Climate Action Plan
Public Review Draft | March 2013 | Arup North America Ltd Page 81
Climate Action Strategies are consistent with the “favorable for adaptation and mitigation” category in Figure 5.
Figure 5: Actions that Complement and Conflict with Adaptation to Climate Change
Source: Public Policy Institute of California, 2008.
In addition to the goals of climate action and climate change adaptation, all adaptation strategies have been screened for achievability. Through partnerships with relevant agencies, many of the strategies ensure that City staff will benefit from expertise and assistance from key agencies at the county-, regional-, state- and federal levels.
9.1 Adaptation Strategies Nine Climate Change Adaptation Strategies, shown in Table 8, will reduce the negative impacts of climate change on the Concord community. They include broad approaches to adaptation and specific programs targeted to specific climate change concerns.

City of Concord Citywide Climate Action Plan
Public Review Draft | March 2013 | Arup North America Ltd Page 82
Table 8: Summary of Adaptation Strategies # Title Adaptive Benefit
GENERAL ADAPTATION DIRECTIVES
A1 Protect vulnerable populations To adapt to all identifiable kinds of risk.
A2 Robust utilities plans and infrastructure To adapt to all identifiable kinds of risk.
A3 Well-informed and prepared community members
To adapt to all identifiable kinds of risk.
SPECIFIC AND TIMELY ADAPTATION PROGRAMS
A4 Cooling centers for heat waves To adapt to heat waves.
A5 Supporting groundwater retention To adapt to uncertainty in water supply.
A6 Flexible peak-period energy use To adapt to uncertainty in electricity supply.
A7 On-site electricity production To adapt to power supply uncertainty.
A8 Resilient urban forest To adapt to changing precipitation, temperatures, and local ecology. Also to maintain carbon sequestration and shade benefits.
A9 Robust native wildlife and habitat areas To adapt to ecological stressors.The PPIC has called this the single most important adaptive action for California to take.
9.1.1 General Adaptation Directives These policies will guide the City as it invests in the community’s climate adaptability. These overarching policies ensure coordination and effectiveness for all kinds of adaptive strategies.
A1. Protect vulnerable populations Partner with community organizations to analyze social equity issues related to climate change effects, focusing on the resilience of low-income communities and relevant, future policy/program development. Create a heat response plan and plan for other effects identified through the analysis, focusing on vulnerable populations.
This measure would apply to all identifiable kinds of risk, because it is a general effect that vulnerable populations tend to. Types of vulnerability that should be considered include:
• Low income individuals and households • Young children • Senior citizens • People with compromised immune systems, such as people residing in hospitals
and skilled nursing facilities

City of Concord Citywide Climate Action Plan
Public Review Draft | March 2013 | Arup North America Ltd Page 83
A2. Robust utilities plans and infrastructure Ensure that current information and data on future climate change effects and impacts are considered and addressed as part of the following utilities and infrastructure activities:
• Updating utility plans, manuals, and specifications. • Siting new infrastructure and maintaining • Renovating existing infrastructure. • Designing, constructing, operating, and maintaining infrastructure Utilities infrastructure can be very costly to change, so ensuring that all utilities and infrastructure plans take climate change impacts into account can save money and reduce emergencies in the future.
A3. Well-informed and prepared community members As part of the implementation of the Contra Costa County Local Multi-Hazard Mitigation Plan, participate in outreach and education campaigns to enhance public awareness about the risk of natural hazards, disaster preparedness, climate change impacts, and how citizens can reduce exposure to hazard-related losses.
Climate change impacts are uncertain, but there is the potential for disasters to occur or to be worse due to climate change impacts. During any disasters or unexpected events, communicating about the best way to respond can be difficult, or even too late. This strategy aims to better handle and even avoid emergencies in the future through information campaigns.
9.1.2 Specific and Timely Adaptation Programs These adaptation strategies address one or more climate change impacts that are expected to affect the Concord community.
A4. Cooling centers for heat waves Work with the Contra Costa County Office of Emergency Services to designate and operate cooling centers during heat waves (including overnight on warm nights), and publicize precautions for preventing heat-related illness.
Heat waves can jeopardize the health of vulnerable segments of Concord’s population, especially residents and workers without air conditioning or with insufficient funds for energy bills. By offering cooling centers where people can regain healthy temperatures without cooling their individual homes or workplaces, Concord can reduce energy consumption overall and prevent or reduce emergency hospital visits due to heat-related illnesses.
A5. Supporting groundwater retention Establish a limit on area of impervious surface allowable and require the use of pervious surface materials in new developments to improve groundwater recharge and limit saltwater intrusion.
This strategy aims to protect water quality and supply in Concord by maintaining a clean and full groundwater table. Almost all of CCWD’s water supply comes from surface water flowing out of the Sierras (as snow melt or rain fall) and into the

City of Concord Citywide Climate Action Plan
Public Review Draft | March 2013 | Arup North America Ltd Page 84
Sacramento Delta. As temperatures rise and reduces overall snowfall and rainfall in the Sierras, these surface supplies may decrease in quality and quantity. The groundwater table is currently a backup resource for drinking water, and it is threatened by climate change due to reduced freshwater flows and increased intrusion forces:
• Freshwater flows from the Sierra to the groundwater table during winter rains or summer snowmelts will likely decrease due to reduced snowfall and rainfall in the mountains as temperatures rise.
• Higher salt concentrations (salinity) in the San Francisco and Suisun Bays may effectively push saltier water into the groundwater table (called salt water intrusion) and thereby shrink or reduce the quality of the groundwater supply.
Snow melt is not the only source of fresh water to recharge the ground water table. Stormwater runoff from rains can percolate into the ground water table from the surface of the ground, if the surface is not impermeable like most urban ground surfaces are. Pervious alternative surfaces are available for many urban applications, so where those are possible to use, the City will require them.
This strategy will likely become more important as temperatures rise and cause increased water consumption, on top of increases due to population growth.
A6. Flexible peak-period energy use Work with PG&E to encourage residents and businesses to enroll in energy Demand Response Programs to avoid higher costs of peak energy use.
This strategy will help the Concord community adapt to uncertainty in electricity supplies. Demand Response Programs take advantage of flexibility in energy customers’ consumption patterns to lower the peak energy demands and help ensure all-day energy supply for everyone. Demand Response Program participants can commit to an appropriate level of flexibility in their energy use during peak periods and receive incentives from energy suppliers. The City of Concord can help ensure that energy customers in the Concord community know about Demand Response Program options and benefits. The city may consider partnering with the Contra Costa Green Business Program to reach their participants.
A7. On-site electricity production Conduct a study of potential solar power (photovoltaic) installation locations on public properties in the City of Concord, to plan for installation when electricity cost increases ensure cost-effectiveness.
Energy supplies may be jeopardized by rising levels of energy use, reduced power production from dams in the Sierras, or other impacts. On-site, renewable energy sources can provide more dependable energy systems during emergencies and reduce demand on the energy system overall.
A8. Resilient urban forest Work with local and regional tree experts and non-profit organizations to keep an up-to-date list of preferred tree species that will thrive in Concord's current climate, support locally native ecosystems, and continue to survive in hotter, drier future climate conditions. Strengthen the Heritage Tree Ordinance for protection of native species of trees, and strengthen the landscape standards of the Development Code to
City of Concord Citywide Climate Action Plan
Public Review Draft | March 2013 | Arup North America Ltd Page 85
encourage use of native and low-water vegetation in landscaping, considering low-VOC trees.
This strategy aims to leverage native trees to adapt to three kinds of climate impacts: changing precipitation patterns, temperature patterns, and local ecology. Trees can cool ambient temperatures, slow down stormwater and use it to recharge aquifers, and provide valuable habitat for many kinds of other native life forms. Some requirements in the Landscape Standards of the City’s Development Code (section 122-446) were updated in 2012 to encourage protection and preserving existing native plants species.
A9. Robust native wildlife and habitat areas As funding becomes available, implement active habitat restoration and enhancement to reduce impact of climate change stressors and improve overall resilience of habitat within existing parks and open space in the city. Support the efforts of local ecological area managers to adaptively manage wildlife areas to ensure adequate connectivity, habitat range, and diversity of topographic and climatic conditions are provided for species to move as climate shifts. Coordinate with managers of habitat and wildlife areas in and near the City of Concord that are owned by regional agencies—such as the CCWD and East Bay Regional Parks District—to support their climate resilience efforts. Protect the habitat values of local riparian areas by prohibiting the planting of non-native or non-riparian plant species in riparian areas and their designated set-back areas, and by prohibiting the destruction or removal of native plants for those areas.
This strategy includes a set of actions that aim to address ecological stressors from climate change. The Public Policy Institute of California has called this the single most important adaptive action for California to take. Minimizing the use of non-native species in plantings and protecting existing native habitats can help stressed native species and ecosystems.
Habitat and wildlife areas in the City include such Concord parks as:
• Lime Ridge and Greater Lime Ridge • Newhall Community Park • Brazil Quarry Park • Ellis Lake Park • Markham Nature Park and Arboretum • CRP Area Mt. Diablo Creek Buffer (planned) • Additional parks that may serve migratory water fowl, such as Diablo Creek Golf
Course, Hillcrest Community Park, and Willow Pass Community Park
Already, the City of Concord has instated new protections of riparian corridors in the City by several new provisions in the Development Standards (Section 122-802) adopted in July 2012. These require:
• No planting of exotic/non-native or non-riparian plant species, or removal of native vegetation within structure setback area, except where authorized for flood

City of Concord Citywide Climate Action Plan
Public Review Draft | March 2013 | Arup North America Ltd Page 86
control purposes with the proper permits issued by the California State Department of Fish and Game, and all other applicable State and federal agencies.
• Planting native plant materials where needed for drainage improvements, and planting native trees and shrubs in riparian open space areas.
9.2 Climate Action Strategies Assisting Adaptation Sixteen of the GHG Reduction Strategies presented in this Climate Action Plan, and shown in Table 9, will also help the Concord community adapt to the effects of climate change.
Table 9: Summary of Adaptive Climate Action Strategies No. Title Adaptive Benefit
ADAPTIVE BUILDING PERFORMANCE STRATEGIES
BE1 Green Building Ordinance To reduce energy supply uncertainty.
BE2 Prepare for California Zero Net Energy Standards To reduce energy supply uncertainty.
BE3 Energy Audits for Existing Buildings To reduce energy supply uncertainty.
BE4 Efficient Appliances To reduce energy supply uncertainty.
BE5 Renewable Energy Facilitation To reduce energy supply uncertainty.
BE6 Residential Energy Conservation To reduce energy supply uncertainty.
BH1 Water Efficient Fixtures and Appliances To reduce water supply uncertainty.
BH2 Water-Efficient Outdoor Irrigation To reduce water supply uncertainty.
BH3 Water-Metering and Monitoring To reduce water supply uncertainty.
BH4 Recycled Water To reduce water supply uncertainty.
ADAPTIVE TRANSPORTATION SYSTEMS AND LAND USE STRATEGIES
TL9 City Forest Plan To adapt to ecological stressors and rising temperatures.
TL19 Parking lot shading To adapt to rising temperatures.
TL20 Cool pavements To adapt to rising temperatures.

City of Concord Citywide Climate Action Plan
Public Review Draft | March 2013 | Arup North America Ltd Page 87
10 Participation Strategies
10.1 How Community Members Can Help A significant component of GHG emissions can be linked to individual choices and behavior. A nation-wide study found that household choices could reasonably lead to carbon emissions reductions of 123 million metric tons per year, which is 20% of household direct emissions or 7.4% of US national emissions, with little or no reduction in household well-being.53
As residents, workers, business managers, renters, land owners, and members of community groups, the Concord community can leverage diverse opportunities to reduce GHG emissions themselves. In communities across the country, teams of neighbors help each other reduce their carbon footprint and demonstrate low-GHG choices. Some key approaches are shown in Table 10.
Table 10: Ways to Participate in Climate Action Type of participants
Ways to Participate in Climate Action
Residents and workers
• Walk, bicycle, take transit, or carpool instead of driving. • Use insulating curtains during cold weather. • Unplug lights and appliances when they are not in use. • Draft-proof your home, office, or facility. • Install energy-saving light bulbs. • Recycle. • Compost. • Buy recyclable and compost-able products and packaging. • Ensure tires are inflated to optimal pressure levels. • Support the development of affordable housing near transit stops and
walkable areas of town. • Purchase, build or rent smaller, more efficient homes. • Develop your own program to join with neighbors and colleagues
interested in reducing greenhouse gas emissions together through goals, competitions, or events.
53 Dietz, Thomas et al, 2009
The Power of All of Us From the December 2010 issue of Scientific American: “…Ecologist and sociologist Thomas Dietz of Michigan State University remains optimistic. ‘I often hear energy experts who have never studied behavior say that behavior doesn't change…but if we learn anything from the last 50 years, it's that behavior changes in huge ways.’ ” Palmer, Lisa. 2010

City of Concord Citywide Climate Action Plan
Public Review Draft | March 2013 | Arup North America Ltd Page 88
Type of participants
Ways to Participate in Climate Action
Property owners • Replace drafty single-pane windows with well-made double-paned windows.
• Lower the temperature on water heaters. • Install insulation to all exterior walls. • Install reflective roofing materials. • Provide recycling and compost services to your home or rental units. • Retrofit your driveway with permeable pavements/pavers to recharge
groundwater supplies and reduce stormwater pumping. • Plant climate-wise, native shade trees on the east and west sides of
your building(s). • Plant climate-wise native plants instead of lawns or other water-
needy plants. • Install rain gardens and swales to recharge groundwater supplies and
reduce stormwater pumping. • Install sidewalks along your street, if you don’t already have them.
Businesses and employers
• Offer a parking spot cash-out to reduce solo-driving commuting. • Plant climate-wise, native plants and shade trees around buildings
and paved areas (e.g., parking lots). • Become a Contra Costa Green Business and do energy-saving
retrofits to your office or facility. • Locate your services, offices, or retail in areas that are easy to access
by transit, walking, or biking (Reduces transportation emissions). • Install secure bike racks conveniently near the entrances of your
facilities in well-lit areas (Reduces transportation emissions). • Procure recyclable and compostable supplies, and conserve supplies.
(Reduces landfill waste). • Locate facility entrances on the sidewalks, facing the streets in order
to increase activity visible on the sidewalks. • Install awnings over sidewalks along your facilities. • Develop your own program to join with industry colleagues and
employees interested in reducing greenhouse gas emissions together through goals, competitions, or events.
Community-Based Organizations
• Draft-proof your office or facility. • Plant climate-wise, native plants and shade trees. • Ensure that the city and county agencies understand how climate
change effects will impact your constituencies. • Educate allies and constituencies on how to reduce their GHG
emissions too. • Develop programs to convene members of your constituency who are
interested in reducing greenhouse gas emissions together through goals, competitions, or events.
City of Concord Citywide Climate Action Plan
Public Review Draft | March 2013 | Arup North America Ltd Page 89
Seeing peers take on actions that reduce GHG emissions can help people take those actions too. By participating in climate action, you can make a real contribution to reducing climate change. Concord community groups can be even more effective, developing and implementing their own programs to motivate and enable GHG reductions.
GHG reduction also does not require everyone to become an environmentalist. A community group can promote GHG reduction simply by helping people conserve energy and thus save money on their energy bills. Or by helping people who are curious about biking to work for exercise to find the most convenient routes and equipment they might need to get on their bikes more often. Often, encouraging GHG reduction is about improving convenience
Good information and social events together can help reduce GHGs. One study54 found that efforts to encourage environmentally friendly choices were most effective when they combined four kinds of benefits:
1. Clarifying information to meaningfully address people’s concerns with environmentally friendly choices.
2. Demonstrating ways of incorporating environmentally friendly choices in people’s lifestyles, especially among peers.
3. Making sure that reminders about environmentally friendly options are convenient when people are making their decisions.
4. Rewarding friendly competitions or pledges to help people set their own goals to make changes.
10.2 Making Participation Easier
The GHG Reduction and Adaptation Program in this plan aim to make it easier for Concord residents and workers to reduce their emissions. Many strategies demonstrate how to make GHG-reducing choices, like installing solar energy technologies (Strategy M3), or using bicycles for work trips (Strategy M9). Other strategies will provide needed information, like the many Safe Routes to Schools programs that show how biking can be a safe and fun way to get to school (Strategy TL7). A variety of the strategies also create timely prompts so that people with the opportunity to reduce GHG emissions significantly realize they can do so, and may even be required to do so – such as when a building permit requires a minimum level of energy efficiency, which builders will be able to design into their projects.
In order to support individuals and private groups in Concord to make more climate-friendly choices, the City will adopt three key strategies in addition to the GHG reduction program.
54 Osbaldiston, Richard and John Paul Schott, 2011. “Meta-Analysis of Proenvironmental Behavior Experiments,” Environmental Sustainability and Behavioral Science. March 2012 vol. 44 no. 2 257-299. Accessed 2012-10-02. Available online: http://eab.sagepub.com/content/44/2/257.abstract Osbaldiston, and Schott, 2011

City of Concord Citywide Climate Action Plan
Public Review Draft | March 2013 | Arup North America Ltd Page 90
Participation Strategies
P1 Applauding Private Climate Action
P2 Climate-friendly Reminders
P3 Inviting Local Climate Leaders’ Input
P1. Applauding Private Climate Action In recognition of the importance of choices by households and businesses in reducing GHG emissions, offer official recognition through mayoral proclamations to winners of GHG reduction competitions at the neighbourhood- and city-wide levels for residents and businesses of Concord.
Programs that bring neighbors together to identify opportunities and overcome barriers for lowering GHG emissions can be very effective. Programs like Contra Costa Green Business program are leading the way in modelling climate-friendly ways of doing business in Concord. This strategy aims to recognize those and other efforts by individuals and businesses to help fight global warming.
P2. Climate-friendly reminders Identify key moments when choices could be made that reduce GHG emissions, and develop promotional materials that prompt decisions that have low-GHG emissions.
A systematic audit of opportunities to inform and remind members of the Concord community of GHG reductions they can make might reveal cost-effective actions the City can take. Any visitor to city facilities, for example, may see posters and pamphlets with timely information. This strategy aims to inform residents and visitors through such opportunities.
P3. Inviting Local Leaders’ Input Invite local neighbourhood and community groups to hold their own meetings to identify knowledge gaps or other barriers to climate-friendly choices by their constituents, and to report on their feedback to city staff about any ways the City can help them reduce GHG emissions.
This strategy aims to foster dialog and deepen understanding of climate change interest and challenges in the Concord community. Meetings held by community members or community groups need not be focused on climate change. Because of the many co-benefits of GHG-reducing actions, community meetings could focus on many other topics and provide valuable knowledge about climate friendly choices in the Concord community.
City of Concord Citywide Climate Action Plan
Public Review Draft | March 2013| Arup North America Ltd Page 91
11 References Anderson, L. M. and H. K. Cordell. 1985. "Residential Property Values Improved
by Landscaping with Trees." Southern Journal of Applied Forestry. 9(3):162-166(5) Accessed 10 Oct 2012. Available online. http://www.ingentaconnect.com/content/saf/sjaf/1985/00000009/00000003/art00012
Bay Area Air Quality Management District, 2012A. Website. "CARE Program." Accessed 7 July 2012. http://www.baaqmd.gov/Divisions/Planning-and-Research/CARE-Program.aspx
Bay Area Air Quality Management District, 2012B. California Environmental Quality Act Air Quality Guidelines, Updated May 2012.
Bent, Elizabeth M and Krute Singa. 2009. "Modal Choices and Spending Patterns of Travelers to Downtown San Francisco, California: Impacts of Congestion Pricing on Retail Trade." Transportation Research Record 2115:66-74 Accessed 2012 Oct 10. Available online http://pubsindex.trb.org/view.aspx?id=882238
California Climate Change Center, 2006. "Our Changing Climate: Assessing the Risks to California, A Summary Report from the California Climate Change Center." July 2006.
California Energy Commission, 2011. Website. “Cal-Adapt: Exploring California's Climate Change Research." Accessed 6 July 2012. http://cal-adapt.org/
Chevron Energy Solutions. 2011. Concord Energy Efficiency and System Improvements Project Comprehensive Energy Analysis. Unpublished report.
Clifton, Kelly et al. 2012. Consumer Behavior and Travel Choices: A Focus on Cyclists and Pedestrians. 92nd Annual Meeting of the Transportation Research Board. Accessed 10-10-2012. Available online. http://otrec.us/files/OTS2012_Morrissey-Poster.pdf
Community Preventative Services Task Force. 2004. "Promoting Physical Activity: Environmental and Policy Approaches." Website. Accessed 23 Oct 2012. Available online. http://www.thecommunityguide.org/pa/environmental-policy/index.html
Dietz, Thomas et al. “Household actions can provide a behavioral wedge to rapidly reduce U.S. carbon emissions.” Sept. 2009. Proceedings of the National Academy of Sciences. 11July 2012. Accessed 10 Oct 2012. Available online http://www.pnas.org/content/106/44/18452
Dumbaugh, Eric. 2006. "Design of Safe Urban Roadsides: An Empirical Analysis" Transportation Research Record: Journal of the Transportation

City of Concord Citywide Climate Action Plan
Public Review Draft | March 2013| Arup North America Ltd Page 92
Research Board, 1961:74-82. Accessed 10 Oct 2012. Available online. http://trid.trb.org/view/2006/C/776878
Ewing, R. and R. Cervero. 2010. “Travel and the Built Environment.” Journal of the American Planning Association 76:3. Pages 265-294.
Health Effects Institute. 2010. "Traffic-Related Air Pollution: A Critical Review of the Literature on Emissions, Exposure, and Health Effects." Special Report 17. Accessed 1 Oct 2011. Available online. http://pubs.healtheffects.org/view.php?id=334
ICLEI 2011. City of Concord 2005 Government Operations Greenhouse Gas Emissions Inventory. Unpublished report. June 2005
Intergovernmental Panel on Climate Change, 2007. "Summary for Policymakers," Climate Change 2007: Impacts, Adaptation and Vulnerability. Contribution of Working Group II to the Fourth Assessment Report of the Intergovernmental Panel on Climate Change, edited by M. L. Parry, O. F. Canziani, J. P. Palutikof, P. J. v. d. Linden, and C. E. Hanson, Cambridge University Press, Cambridge, U.K., pp. 7-22.
Litman, T. “Traffic Calming Benefits, Costs and Equity Impacts.” Victoria Transport Policy Institute, 1999. Accessed 10 Oct 2012. Available online. http://www.vtpi.org/calming.pdf
MacDonald, Elizabeth et al 2008. “The Effects of Transportation Corridors’ Roadside Design Features on User Behavior and Safety, and Their Contributions to Health, Environmental Quality, and Community Economic Vitality: A Literature Review.” Accessed 10 Oct 2012. Available online. http://www.dot.ca.gov/hq/LandArch/research/docs/corridor_lit_review_08.pdf
Maizlish, Neil et al. 2011. “Health Co-Benefits and Transportation-Related Reductions in Greenhouse Gas Emissions in the Bay Area: Technical Report. California Department of Public Health.” Accessed 10 Oct 2012. Available online. http://www.cdph.ca.gov/programs/CCDPHP/Documents/ITHIM_Technical_Report11-21-11.pdf
Marshall, W. E., and N. W. Garrick. 2010. “Effect of Street Network Design on Walking and Biking.” Transportation Research Record: Journal of the Transportation Research Board 2198.-1:103–115.
Means, Edward, et. al., 2010. Effects of Climate Change on Water Utility Planning Criteria and Design Standards (Order# 4154). Water Research Foundation. Accessed 5 July 2012. http://waterinstitute.ufl.edu/WorkingGroups/downloads/WRF Climate Change DocumentsSHARE/Project 4154 Executive Summary - Evaluating

City of Concord Citywide Climate Action Plan
Public Review Draft | March 2013| Arup North America Ltd Page 93
Effects of Climate Change on Water Quality Planning Criteria and Design Standards.pdf
Metropolitan Transportation Commission (MTC), 2010. Air Resources Board Adopts Greenhouse Gas Reduction Targets. Available online: http://www.mtc.ca.gov/news/current_topics/9-10/arb.htm
Morales, Dominic J. 1980. "The Contribution of Trees to Residential Property Value". Journal of Arboriculture 6(11):305. Accessed 10 Oct 2012. Available online: http://www.tcpilots.org/resource/Tree_propvalue.pdf
Osbaldiston, Richard and John Paul Schott, 2011. “Meta-Analysis of Proenvironmental Behavior Experiments,” Environmental Sustainability and Behavioral Science. March 2012 vol. 44 no. 2 257-299. Accessed 2012-10-02. Available online: http://eab.sagepub.com/content/44/2/257.abstract
Pacific Council on International Policy, 2010. Preparing for the Effects of Climate Change - A Strategy for California. http://www.pacificcouncil.org/document.doc?id=183
Palmer, Lisa. 2010. "Behavior Frontiers: Can Social Science Combat Climate Change?" Scientific American. December 28, 2010. Accessed 01 Oct 2012. Available online: http://www.scientificamerican.com/article.cfm?id=can-social-science-help-combat-climate-change&page=2
Public Policy Institute of California, 2008A. Preparing California for a Changing Climate.. Accessed 6 July 2012. http://www.ppic.org/main/publication.asp?i=755
Public Policy Institute of California, 2008B. Air Quality Planning and California's Changing Climate. Accessed 6 July 2012. http://www.ppic.org/main/publication.asp?i=854
Rosenblatt Naderi, Jody, Byoung Suk Kweon, and Praveen Maghelal. 2008. “The Street Tree Effect and Driver Safety” ITE Journal 2008. Accessed 10 Oct 2012. Available online http://www.walkable.org/assets/downloads/StreetTreeEffectandDriverSafety_ITEfeb08_.pdf
Sallis, James F, Heather R. Bowles, Adrian Bauman, Barbara E. Ainsworth, et al. 2009. “Neighborhood Environments and Physical Activity Among Adults in 11 Countries.” American Journal of Preventative Medicine 36(6): 484-90.
San Francisco Bay Conservation and Development Commission. 2011. Living with a Rising Bay: Vulnerability and Adaptation in San Francisco Bay and on its Shoreline. Accessed 2 July 2012. http://www.bcdc.ca.gov/BPA/LivingWithRisingBay.pdf

City of Concord Citywide Climate Action Plan
Public Review Draft | March 2013| Arup North America Ltd Page 94
Strategic Growth Council. 2012. Annual Report. Accessed on 10/8/2012. Available on-line at http://sgc.ca.gov/docs/workplan/SGC-2012-AnnualReport.pdf
US EPA, 2012A. Website. "Climate Change: Agriculture and Food Supply Impacts & Adaptation." Accessed 8 July 2012. http://www.epa.gov/climatechange/impacts-adaptation/agriculture.html
US EPA 2012B. Website. "Six Common Pollutants." Accessed 6 July 2012. http://www.epa.gov/airquality/urbanair/
United States Global Change Research Program, 2009. "Global Climate Change Impacts in the US." Accessed 8 July 2012. http://www.globalchange.gov/publications/reports/scientific-assessments/us-impacts/climate-change-impacts-by-sector/society#key5

City of Concord Citywide Climate Action Plan Appendix A
Draft 2 | January 2013| Arup North America Ltd. Page A1
Appendix A
Baseline Emissions Inventory Development Methodology
City of Concord Citywide Climate Action Plan Appendix A
Draft 2 | January 2013| Arup North America Ltd. Page A2
A1 Introduction A Climate Action Plan is intended to measure and monitor the trend of GHG emissions within a municipality to gauge the need for—and optimize effectiveness of—policies aimed at reducing GHG emissions. The baseline represents conditions before climate action measures are implemented, and the forecast emissions inventories reflect likely future emissions under different possible scenarios. Specifically, the forecasts evaluate (1) a Business as Usual (BAU) case, which assumes no changes from the current 2030 General Plan—in other words, a no-plan case, and (2) a Mitigated Plan case, which reflects the policies and performance-based standards outlined in the Citywide CAP. Forecasts for both cases will account for the impact of the following Statewide mandates: the Renewable Portfolio Standard, the Low Carbon Fuel Standard, and Pavley I & II (AB 1493).
A2 Inventory Boundaries Defined The scope of any emissions inventory must be clearly defined to understand the emissions totals. The following sections describe the parameters of the City of Concord’s community-scale emissions inventories that serve as the basis for this CAP. There are four types of parameters defined below: what gases are assessed, where emissions occur, what activities are producing the emissions, and when the emissions are assessed.
A2.1 GHGs Assessed The City of Concord has evaluated emissions of carbon dioxide (CO2), methane (CH4), and nitrous oxide (N2O). These gases represent the vast majority of emissions of Kyoto GHGs. Each gas has a different potential to increase global warming (e.g., emitting the same amounts of CO2 and CH4 will have different impacts to global warming). The factors measuring the differences in impact between gasses are called the Global Warming Potential (GWP) factors. The GWP factors are used in this analysis to compare emissions of GHGs according to the Carbon Dioxide Equivalent (CO2e) of their impact to global warming. This facilitates comparison of total emissions across sectors, across years, and across municipalities regardless of the composition of the emissions profile (i.e. which gases are emitted). CN4 and N2O emissions were converted to CO2 equivalent using GWPs from the Intergovernmental Panel on Climate Change Second Assessment Report published in 1995. The GWPs for CH4 and N2O are 21 and 310, respectively.
While the LGOP also recommends that local governments assess emissions from the other three internationally recognized greenhouse gases regulated under the Kyoto Protocol—Perfluorocarbons (PFCs); Hydrofluorocarbons (HFCs); and Sulfur hexafluoride (SF6) — those remaining three GHGs were excluded from the chemical boundary of the community-scale inventory due to the uncertainty in collecting the
City of Concord Citywide Climate Action Plan Appendix A
Draft 2 | January 2013| Arup North America Ltd. Page A3
activity data, in accordance with the BAAQMD CEQA guidelines55. However, the 2005 Municipal Operations Emissions Inventory does include emissions from HFCs, PFCs, and SF6 under the direct operational control of the City.
A2.2 Organizational Boundary The organizational boundary for the City of Concord’s Citywide CAP is the limits of the City of Concord and a small residential area, the Ayers Ranch property, in Concord’s sphere of influence (SOI). This includes all the GHG emissions that occur within areas where the City of Concord has jurisdiction to affect policy change.
Ayers Ranch is a small residential area (less than 1 square mile) that is within Concord’s Sphere of Influence (SOI), but not within the City. It is bounded by the CNWS Inland Area, Bailey Road, and Concord Boulevard. Because this is a small area entirely surrounded by the City of Concord, policies implemented in the City will affect this area. For example, the implementation of a Complete Streets program surrounding this area will result in benefit to the residents of this area, as would improvement of transit service, and the mixed-use and walkable development on the CNWS. It is important to note that if the City annexes land, any sources that are acquired as a result of annexation must be reflected in an adjusted baseline. Because the City’s policies will indirectly impact Ayers Ranch, and because Ayers Ranch is a likely to be annexed, these emissions are included. The City has indicated it is unlikely to annex the remaining SOI areas, and it is unable to affect change in the remaining areas.
Specifically excluded from the scope of the inventory are the following areas within the General Plan SOI, over which the City of Concord has no policy control:
• Community of Clyde (residential area north of the golf course and east of Port Chicago Highway)
• Port Chicago and the Concord Naval Weapons Station Tidal portion (port and rail facilities)
• Wetlands (north of SR 4 and west of Port Chicago Highway) • Industrial land north of SR 4 along Solano Way (Air Liquide Indl US LP,
Tesoro Golden Eagle Refinery) • Buchanan Field Airport
A2.3 Operational Boundary The operational boundary covers activities that directly and indirectly result in GHG emissions. Specifically, Direct (Scope 1), Indirect (Scope 2), and select other indirect (Scope 3) (i.e., process and fugitive trans-boundary emissions from wastewater treatment and solid waste management) emissions are included, in accordance with local and internationally-recognized protocols.
55 BAAQMD 2011

City of Concord Citywide Climate Action Plan Appendix A
Draft 2 | January 2013| Arup North America Ltd. Page A4
The City’s operational boundary includes the following sectors:
Building Performance and Infrastructure: Energy-, water-, and waste-related emissions from residential, commercial, and industrial sources within the City’s geographic boundary and Ayers Ranch. This sector includes stationary direct and indirect emissions from natural gas and electricity usage, as well as process (i.e., wastewater treatment) and fugitive (i.e., solid waste disposal) emissions.
Transportation and Land Use: Emissions from transportation and land use are based on on-road and off-road emissions sources. On-road emissions are calculated from the vehicles miles travelled (VMT) and the associated vehicle fleet profile. VMT will include the total length of all trips that begin and end in Concord and Ayers Ranch and half the length of all trips that begin or end in Concord and Ayers Ranch. VMT will not include vehicle “pass-through” trips that neither start nor end in the City of Concord or Ayers Ranch. This approach to VMT calculation, known as an “origin-destination” approach, has been agreed with BAAQMD56, and their pending Quantification Guidance document will be revised to reflect this recommended approach. The origin/destination approach is also consistent with on-going work on the ICLEI Community-Scale GHG Accounting and Reporting Protocol. This approach is based on recognition of the City’s inability to influence pass-through emissions, and a greater ability to influence trip rates and trip lengths for trips beginning or ending within the City’s geographic boundary. Off-road emissions include emissions from landscaping equipment, grills, ATVs, private planes, and other small sources owned by Concord businesses and residents.
Municipal Operations: Emissions from municipal operations are already reflected in the sectors outlined above, contributing about 1% of the total community-scale inventory in 2005 (9,553 metric tons CO2e)57. The details of the municipal inventory conducted by ICLEI will help to identify and prioritize emissions reduction actions that the City can undertake directly to reduce emissions.
A2.4 Geographic Boundary The inventory includes emissions from within the geographic area comprised of the City of Concord and Ayers Ranch, as well as trans-boundary emissions associated with essential services, such as emissions from treatment and conveyance of water and wastewater, and management of solid waste. (The water treatment service, wastewater treatment plant, and landfill are all located outside of the City’s geographic boundary.)
As noted in the description of the Operational Boundary, the exception within the geographic boundary is that emissions from on-road vehicles passing through the geographic boundaries described above are excluded in favor of the Origin/Destination approach to measuring of transportation-related emissions. 56 Per Oct 11, 2011 meeting with Abby Young (BAAQMD) and Ian Peterson (BAAQMD) to outline the proposed approach to emissions inventory development. 57 ICLEI 2011

City of Concord Citywide Climate Action Plan Appendix A
Draft 2 | January 2013| Arup North America Ltd. Page A5
A2.5 Temporal Boundary The temporal boundary is defined by setting a baseline year and developing forecast emissions inventories that align with regulatory or policy-relevant timeframes. For the City of Concord, the baseline is set at 2005, and the forecast emission inventories are developed for 2020, 2030, and 2035.
The baseline inventory of 2005 is consistent with the SB375 baseline year and the BAAQMD CEQA Guidelines. The forecast emissions inventories presented for 2020, 2030, and 2035 are consistent with AB32, SB375, the BAAQMD CEQA guidelines, and the General Plan and Concord Reuse Project (CRP) area CAP.
The specific requirements for each of these forecast years are outlined below:
• 2020: AB32 commits the State of California to reduce emissions to 1990 levels by 2020, presented as both an absolute emissions target and a per capita target based on projected population growth. Based on this regulatory requirement, the BAAQMD CEQA Guidelines set per capita emissions thresholds for 2020 for projects or plans in the San Francisco Bay Area. The BAAQMD plan-level threshold is the basis for the Citywide CAP analyses for both 2020 and 2030. A 2020 and 2030 analysis for the CRP area CAP is included in Book Three of the CRP Area Plan using the BAAQMD project-level threshold, an approach recommended by BAAQMD staff.
• 2030: The CRP Area Plan has a build out date of 2030. The City’s General Plan similarly uses a 2030 build out date. For these reasons, the CRP area CAP evaluates a 2030 scenario against an extrapolated 2030 per capita threshold based on the CEQA target using the rate of reductions outlined in Executive Order S-3-05 (which extends the AB32 trajectory out to an 80% reduction from 1990 GHG emission levels by 2050). The Citywide CAP therefore also establishes a citywide plan-level target for 2030.
• 2035: SB375 required ARB to develop regional 2020 and 2035 reduction targets for GHG emissions from automobiles and light trucks resulting from transportation and land use planning. For the Bay Area region, the targets are a seven percent per capita reduction target for 2020 and 15 percent per capita reduction target for 2035, relative to 2005 levels. The CAP therefore assesses emissions reductions from mobile on-road sources and percent reductions in vehicle miles travelled per capita as a result of land use and transportation policies and programs (i.e., reductions not including those resulting from Pavley and LCFS) to help the region meet this requirement.
A3 Source Types Following is a brief description of each type of emissions.
Direct Emissions. Direct emissions are from sources within the city boundary (e.g., natural gas consumption) or transboundary sources that directly emit GHGs at the point of use e.g., transportation or waste management. These include the following source types:

City of Concord Citywide Climate Action Plan Appendix A
Draft 2 | January 2013| Arup North America Ltd. Page A6
• Stationary – stationary direct emissions come from natural gas consumption. • Mobile – mobile emissions come from on-road and off-road vehicles • Process – process emissions come from the wastewater treatment process, which
is located outside of the City, but the direct emissions are attributable to the City. • Fugitive – fugitive emissions come from the landfill, which is located outside of
the City, but the direct emissions are attributable to City.
Indirect Emissions. Indirect emissions are a consequence of the activities within the city boundary, but which occur outside of the city and away from the City’s point of use. For Concord, the indirect emissions are solely from electricity consumption attributable to residential, commercial, and industrial activities that occur within the City.

City of Concord Citywide Climate Action Plan Appendix B
Draft 2 | January 2013 | Arup North America Ltd. Page B1
Appendix B
Forecast Emissions Inventory Development Methodology
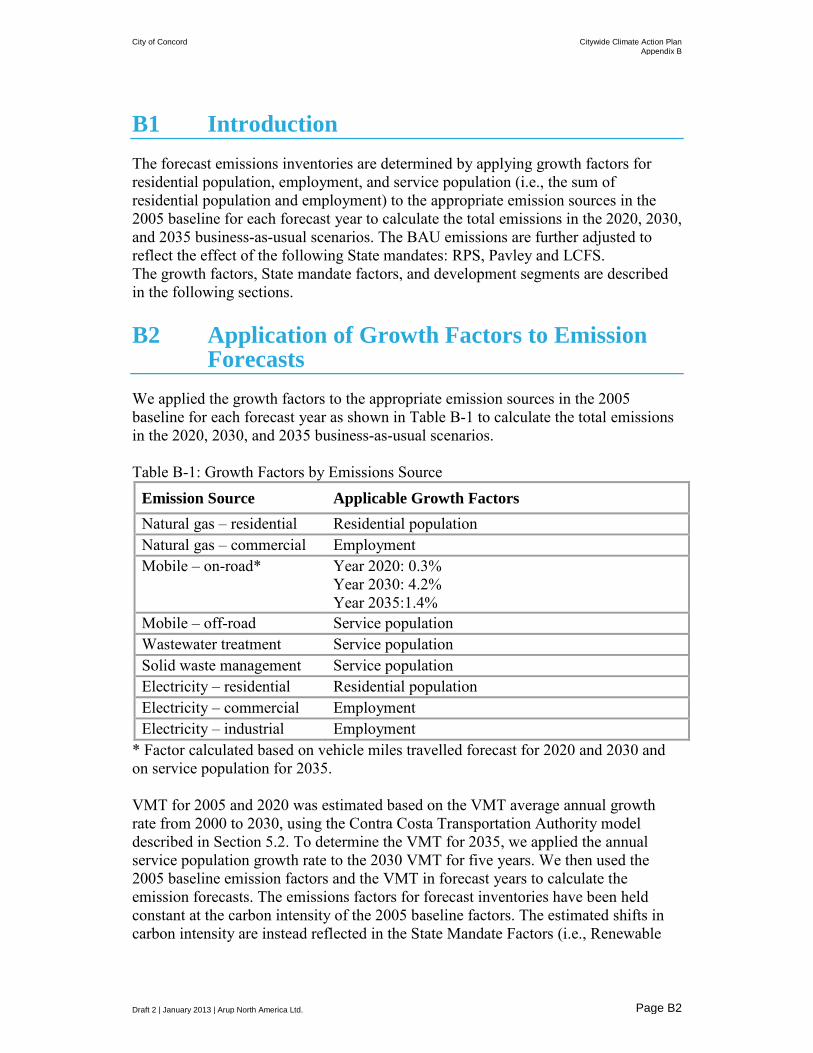
City of Concord Citywide Climate Action Plan Appendix B
Draft 2 | January 2013 | Arup North America Ltd. Page B2
B1 Introduction The forecast emissions inventories are determined by applying growth factors for residential population, employment, and service population (i.e., the sum of residential population and employment) to the appropriate emission sources in the 2005 baseline for each forecast year to calculate the total emissions in the 2020, 2030, and 2035 business-as-usual scenarios. The BAU emissions are further adjusted to reflect the effect of the following State mandates: RPS, Pavley and LCFS. The growth factors, State mandate factors, and development segments are described in the following sections.
B2 Application of Growth Factors to Emission Forecasts
We applied the growth factors to the appropriate emission sources in the 2005 baseline for each forecast year as shown in Table B-1 to calculate the total emissions in the 2020, 2030, and 2035 business-as-usual scenarios. Table B-1: Growth Factors by Emissions Source
Emission Source Applicable Growth Factors Natural gas – residential Residential population Natural gas – commercial Employment Mobile – on-road* Year 2020: 0.3%
Year 2030: 4.2% Year 2035:1.4%
Mobile – off-road Service population Wastewater treatment Service population Solid waste management Service population Electricity – residential Residential population Electricity – commercial Employment Electricity – industrial Employment
* Factor calculated based on vehicle miles travelled forecast for 2020 and 2030 and on service population for 2035. VMT for 2005 and 2020 was estimated based on the VMT average annual growth rate from 2000 to 2030, using the Contra Costa Transportation Authority model described in Section 5.2. To determine the VMT for 2035, we applied the annual service population growth rate to the 2030 VMT for five years. We then used the 2005 baseline emission factors and the VMT in forecast years to calculate the emission forecasts. The emissions factors for forecast inventories have been held constant at the carbon intensity of the 2005 baseline factors. The estimated shifts in carbon intensity are instead reflected in the State Mandate Factors (i.e., Renewable

City of Concord Citywide Climate Action Plan Appendix B
Draft 2 | January 2013 | Arup North America Ltd. Page B3
Portfolio Standard, Low Carbon Fuel Standard, and Pavley). This approach was selected in order to show which policy drivers are directly affecting carbon intensity in the forecast years. The source of the growth factors is a combination of sources to best reflect the actual projected activity in the City Concord. Most of the data are from ABAG Projections 2005 or the Concord General Plan projections, as amended in 2012 for consistency with the Development Code Update. However, the total quantity for 2035 was developed based on a growth rate calculated from ABAG forecasts, which was applied to the 2030 Concord General Plan populations. These growth factors are presented in Table B-2.

City of Concord Citywide Climate Action Plan Appendix B
Draft 2 | January 2013 | Arup North America Ltd. Page B4
Table B-2: Concord Population and Growth Factors
Sector 2005 2020 2030* 2035
Quantity Segment 1 - Reuse Area
Segment 2 - Infill
Development
Segment 3 - Existing
Development
Annual Growth Factor
2005-2020 Total Quantity Segment 1 -
Reuse Area
Segment 2 - Infill
Development
Segment 3 - Existing
Development
Annual Growth Factor
2020-2030 Total Quantity Segment 1 -
Reuse Area
Segment 2 - Infill
Development
Segment 3 - Existing
Development
Annual Growth Factor
2030-2035 Total Quantity
Population 123,900 9,599 5,901 123,900 0.8% 139,400 28,800 14,660 123,900 2.0% 167,360 28,800 19,605 123,900 0.6% 172,305
Jobs 60,210 9,010 5,260 60,210 1.6% 74,480 26,530 25,170 60,210 5.0% 111,910 26,530 40,791 60,210 2.8% 127,531
Service Population
184,110 18,609 11,161 184,110 1.1% 213,880 55,330 39,830 184,110 3.1% 279,270 55,330 60,396 184,110 1.4% 299,836
Municipal Employees 514 52 31 514 1.1% 597 154 111 514 3.1% 780 154 169 514 1.4% 837
Source ABAG Projections 2005
Comes from CRP Area Plan CAP Table A-1
Calculated: (2020 ABAG pop - 2005 ABAG pop)
ABAG Projections 2005 ABAG Projections
2005 Concord General Plan
Calculated: (Concord GP 2030 pop - (2005 ABAG pop + Reuse Area))
ABAG Projections 2005
Concord General Plan, as amended 7/12
Concord General Plan
Calculated: (2035 pop - (2005 ABAG pop + Reuse Area))
ABAG Projections 2005
Calculated based on 2030-2035 ABAG growth rate, applied to GP 2030 figures
*2030 is the assumed build-out year for the CNWS, resulting in comparatively greater growth than 2020 and 2035.

City of Concord Citywide Climate Action Plan Appendix B
Draft 2 | January 2013 | Arup North America Ltd. Page B5
B3 State Mandate Factors Reductions from state mandates were applied to the appropriate emission sources and forecast years to reflect successful implementation of the mandates. These reductions will reflect the future shift in carbon intensity.
See Attachment A for draft calculations applying the business-as-usual forecasting methodology described in this memo. Attachment A assumes the following relative to the 2005 baseline year: a 10% reduction in on-road mobile emissions by 2020 due to the Low Carbon Fuel Standard, and a 21% reduction in emissions from electricity use by 2020, due to the Renewable Portfolio Standard. Emissions reductions due to Pavley differ for the three forecast years: 25.21% in 2020, 33.10% in 2030, and 33.61% in 2035.
• Renewable Portfolio Standard requires 33% of electricity purchased in California to be supplied from renewable sources by 2020. Because PG&E’s 200558 fuel mix contained 12% eligible renewables already, Arup applied a 21% further reduction in the carbon intensity (i.e., the rate of GHG emissions per unit of electricity consumed, MT CO2e/kWh) of supplying electricity to residential, commercial, and industrial users in 2020 to reflect the remaining shift needed to reach 33% by 2020. This approach assumes a linear phased transition for the period from 2005 to 2020. The initial reduction in carbon intensity is held constant for the subsequent analysis years.
• Low Carbon Fuel Standard requires a 10% reduction in 2010 fuel carbon intensity by 2020, as shown in Table B-3. Arup applied a 10% reduction to on-road mobile emissions in 2020 to reflect this reduction. The initial reduction in carbon intensity is held constant for the subsequent analysis years.
Table B-3: 10% Reduction in 2010 Fuel Carbon Intensity by 2020 LCFS Calendar Year Reduction Factor 2010 Reporting only 2011 0.25% 2012 0.50% 2013 1.00% 2014 1.50% 2015 2.50% 2016 3.50% 2017 5.00% 2018 6.50% 2019 8.00% 2020 10.00%
58 Arup used PG&E 2007 fuel mix as a proxy for 2005.

City of Concord Citywide Climate Action Plan Appendix B
Draft 2 | January 2013 | Arup North America Ltd. Page B6
Reference: ARB's "Pavley I + Low Carbon Fuel Standard Postprocessor Version 1.0 User’s Guide" • Pavley (AB 1493) requires a decrease in motor vehicle emissions through
improved pollution control standards. New standards apply to light duty and medium duty vehicles and become more stringent starting with vehicle model year 2009 through 2016. Table B-4 shows the required reductions by vehicle model year. For example, vehicles that are 0 to 4 years old in 2020 will reflect the maximum reductions, 34.3% and 25.1%. Arup used the vehicle fleet age profile, shown in Table B-5, for California to determine the Pavley reduction to apply to emissions from light and medium duty vehicles for the forecast years.
Table B-4: Pavley Emissions Reduction to Light and Medium Duty Vehicles Model Year LDA/LDT1
(Light Duty) LDT2/MDV (Medium Duty)
2008 and older 0.00% 0.00% 2009 0.00% 0.90% 2010 3.50% 5.20% 2011 14.40% 12.00% 2012 25.30% 18.50% 2013 27.20% 19.90% 2014 28.80% 21.00% 2015 31.70% 23.00% 2016+ 34.30% 25.10%
Reference: ARB's "Pavley I + Low Carbon Fuel Standard Postprocessor Version 1.0 User’s Guide"

City of Concord Citywide Climate Action Plan Appendix B
Draft 2 | January 2013 | Arup North America Ltd. Page B7
Table B-5: California Vehicle Fleet by Model Year as counted in 2005 Years Old
Model Year
Total Count
Avg VMT
Total VMT % of VMT
% for year 2020
% for year 2030
% for year 2035
28 1976 29,099 3,763 109,512,595 0.05% - - - 27 1977 41,305 4,062 167,763,444 0.08% - - 0.13% 26 1978 46,984 4,119 193,531,088 0.09% - - 0.09% 25 1979 53,652 4,200 225,360,301 0.11% - - 0.11% 24 1980 34,967 4,442 155,334,392 0.07% - - 0.07% 23 1981 40,216 4,647 186,865,745 0.09% - - 0.09% 22 1982 48,911 4,675 228,677,123 0.11% - 0.60% 0.11% 21 1983 67,637 4,931 333,534,296 0.16% - 0.16% 0.16% 20 1984 125,260 5,240 656,309,556 0.31% - 0.31% 0.31% 19 1985 176,020 5,509 969,676,561 0.46% - 0.46% 98.93% 18 1986 250,232 5,864 1,467,423,250 0.70% - 0.70% - 17 1987 298,987 6,283 1,878,567,877 0.89% - 0.89% - 16 1988 354,271 6,653 2,356,812,737 1.12% - 1.12% - 15 1989 468,397 6,966 3,262,808,904 1.55% - 1.55% - 14 1990 529,761 7,429 3,935,709,061 1.87% - 94.20% - 13 1991 607,289 7,899 4,796,900,493 2.28% - - - 12 1992 593,674 8,397 4,985,186,674 2.37% 12.32% - - 11 1993 717,874 8,810 6,324,242,099 3.01% 3.01% - - 10 1994 829,707 9,185 7,620,960,078 3.62% 3.62% - - 9 1995 988,800 9,539 9,432,364,050 4.49% 4.49% - - 8 1996 943,176 10,215 9,634,121,911 4.58% 4.58% - - 7 1997 1,171,468 10,856 12,717,146,581 6.05% 6.05% - - 6 1998 1,279,044 11,398 14,578,825,801 6.93% 6.93% - - 5 1999 1,436,478 11,898 17,090,783,178 8.13% 8.13% - - 4 2000 1,693,859 12,528 21,220,726,756 10.09% 50.87% - - 3 2001 1,668,688 13,004 21,699,012,549 10.32% - - - 2 2002 1,624,330 13,038 21,178,404,760 10.07% - - - 1 2003 1,643,669 13,140 21,598,366,040 10.27% - - - 0 2004 1,607,974 13,217 21,252,191,935 10.11% - - - Total 19,371,729 231,907 210,257,119,834 100.00% 100.00% 100.00% 100.00%
Source: Williams, J., Salon, D., and Cook, J. 2011. Vehicle Count and Average Miles Traveled for Each Model Year of Vehicles Registered in 2005 for California State. Unpublished dataset based on original Smog Check and Department of Motor Vehicle records, Inspection and Maintenance Review Committee, Bureau of Automotive Repair, Department of Consumer Affairs, State of California.

City of Concord Citywide Climate Action Plan Appendix B
Draft 2 | January 2013 | Arup North America Ltd. Page B8
B4 Development Segments for Forecast Years The scale of future development at the Concord Reuse Project Area lends some unique characteristics to Concord’s CAP. For this reason, population and employment figures, as well as some measures to reduce emissions, are reported in three distinct development segments. These segments have different development characteristics and future climate action strategies will be applied differently across the three segments, which include:
• Segment 1: Concord Reuse Project Area (i.e., Concord Naval Weapons Station Inland Area)
• Segment 2: Infill Development (i.e., all new growth after 2005 within Concord not in Segment 1)
• Segment 3: Existing Development (i.e., the residential population and employment that exists in the 2005 base year)

City of Concord Citywide Climate Action Plan Appendix B
Draft 2 | January 2013 | Arup North America Ltd. Page B9
B5 Forecast for Municipal Operations GHG emissions due to Municipal Operations were roughly forecasted in order to better understand the extent of impact possible from the Municipal Operations strategies.
The City does not expect to add staff or facilities over the CAP timeframe, providing no factors to increase the emissions estimates. The City’s vehicles and energy sources would be subject to the State Mandates discussed above. The reductions due to these mandates were calculated based on the 2005 inventory by source type, as shown in Table B-6.
Table B-6: Forecasting Municipal Operations Emissions due to State Mandates Source 2005 2020 2030 2035
Inventory MT CO2e
% change per
state mandates
Forecast MT CO2e
% change per state mandates
Forecast MT CO2e
% change per state mandates
Forecast MT CO2e
Electricity 2,559 -21% 2,022 -21% 2,022 -21% 2,022 Natural Gas 1,165 - 1,165 - 1,165 - 1,165 Diesel 399 -35% 258 -43% 227 -44% 225 Gasoline 3,039 -35% 1,969 -43% 1,729 -44% 1,713 CNG 3 - 3 - 3 - 3 Propane 30 - 30 - 30 - 30 Solid Waste 1,075 - 1,075 - 1,075 - 1,075
Totals 8,269 6,521 6,250 6,233

City of Concord Citywide Climate Action Plan Appendix C
Draft 2 | January 2013 | Arup North America Ltd. Page C1
Appendix C
Data Sources, Tools, and Models
City of Concord Citywide Climate Action Plan Appendix C
Draft 2 | January 2013 | Arup North America Ltd. Page C2
C1 Introduction Arup assessed the available tools, data sources, and models to develop the 2005 baseline inventory. The forecast future emissions were created by adjusting the baseline according to the growth factors described in Appendix B. Based on this assessment, we selected the following tools, data sources, and models to develop the emissions inventory and forecasts for the Concord Citywide CAP. They are the best available to calculate an accurate and replicable baseline and future forecasts. This approach has been discussed with BAAQMD. BAAQMD staff generally accepted the proposed approach during meetings, but did not provide written comments on the approach.
C2 Building Performance and Infrastructure The building performance and infrastructure sector evaluated GHG emissions from the following sources:
• Building Energy (Stationary direct and indirect emissions from natural gas and electricity usage): 2005 baseline data was obtained directly from the utility, PG&E.
• Water (Stationary emissions from energy associated with water and wastewater treatment and conveyance, as well as the process emissions from wastewater treatment): 2005 baseline data was obtained directly from Central Contra Costa Sanitary District. Note that emissions from water delivery within buildings, after water has left the utility’s pipelines, generally appear as Building Energy.
• Waste (Stationary emissions from energy used in waste management, and fugitive emissions from landfill gas): 2005 baseline data was obtained from Contra Costa Waste Service (CCWS) and Mt. Diablo Recycling (pro-rated based on CCWS service population). The US EPA 2010 Waste Reduction Model (WARM) was used to calculate GHG emissions of baseline and alternative waste management practices—source reduction, recycling, combustion, composting, and landfilling. The model calculates emissions in metric tons of carbon equivalent (MTCE), metric tons of carbon dioxide equivalent (MTCO2E), and energy units (million BTU) across a wide range of material types commonly found in municipal solid waste (MSW). WARM was used in the Concord baseline inventory to calculate fugitive emissions, based on the total tons of municipal solid waste and recycled materials for the baseline year. WARM is available59 as either an excel-based or a web-based software; this analysis used the excel-based version.
59 To access the model, go to http://epa.gov/climatechange/wycd/waste/calculators/Warm_home.html.
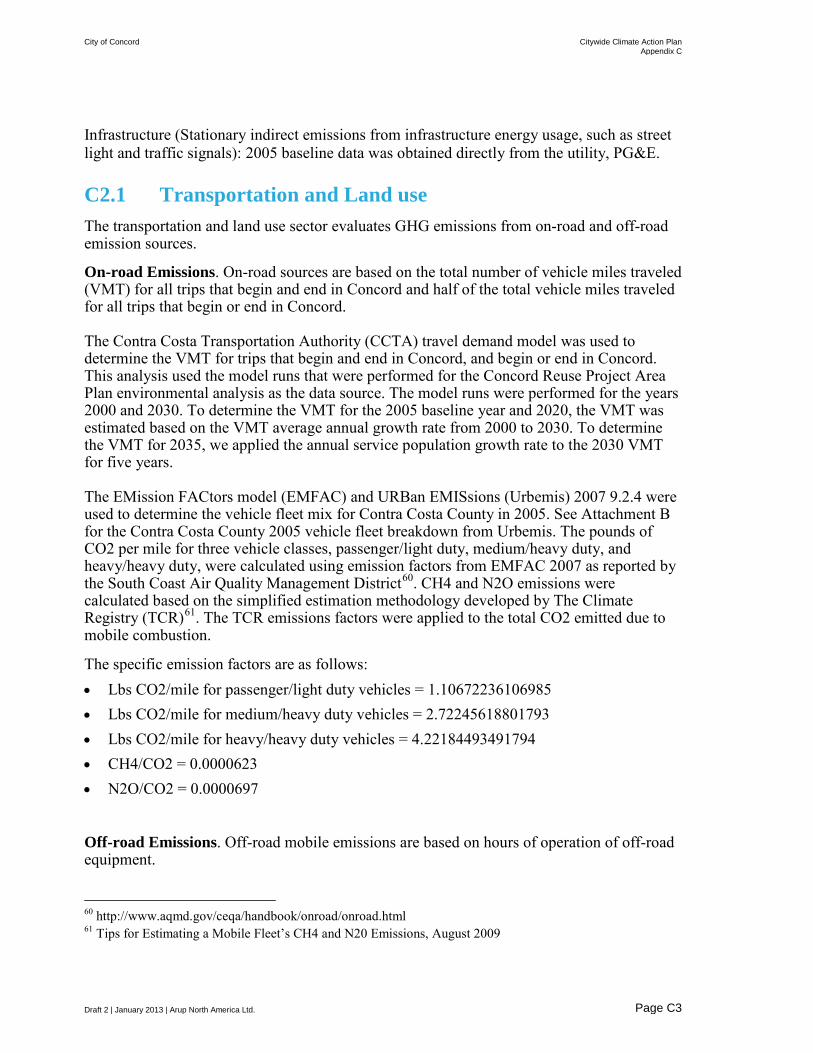
City of Concord Citywide Climate Action Plan Appendix C
Draft 2 | January 2013 | Arup North America Ltd. Page C3
Infrastructure (Stationary indirect emissions from infrastructure energy usage, such as street light and traffic signals): 2005 baseline data was obtained directly from the utility, PG&E.
C2.1 Transportation and Land use The transportation and land use sector evaluates GHG emissions from on-road and off-road emission sources.
On-road Emissions. On-road sources are based on the total number of vehicle miles traveled (VMT) for all trips that begin and end in Concord and half of the total vehicle miles traveled for all trips that begin or end in Concord. The Contra Costa Transportation Authority (CCTA) travel demand model was used to determine the VMT for trips that begin and end in Concord, and begin or end in Concord. This analysis used the model runs that were performed for the Concord Reuse Project Area Plan environmental analysis as the data source. The model runs were performed for the years 2000 and 2030. To determine the VMT for the 2005 baseline year and 2020, the VMT was estimated based on the VMT average annual growth rate from 2000 to 2030. To determine the VMT for 2035, we applied the annual service population growth rate to the 2030 VMT for five years. The EMission FACtors model (EMFAC) and URBan EMISsions (Urbemis) 2007 9.2.4 were used to determine the vehicle fleet mix for Contra Costa County in 2005. See Attachment B for the Contra Costa County 2005 vehicle fleet breakdown from Urbemis. The pounds of CO2 per mile for three vehicle classes, passenger/light duty, medium/heavy duty, and heavy/heavy duty, were calculated using emission factors from EMFAC 2007 as reported by the South Coast Air Quality Management District60. CH4 and N2O emissions were calculated based on the simplified estimation methodology developed by The Climate Registry (TCR)61. The TCR emissions factors were applied to the total CO2 emitted due to mobile combustion.
The specific emission factors are as follows: • Lbs CO2/mile for passenger/light duty vehicles = 1.10672236106985 • Lbs CO2/mile for medium/heavy duty vehicles = 2.72245618801793 • Lbs CO2/mile for heavy/heavy duty vehicles = 4.22184493491794 • CH4/CO2 = 0.0000623 • N2O/CO2 = 0.0000697
Off-road Emissions. Off-road mobile emissions are based on hours of operation of off-road equipment. 60 http://www.aqmd.gov/ceqa/handbook/onroad/onroad.html 61 Tips for Estimating a Mobile Fleet’s CH4 and N20 Emissions, August 2009

City of Concord Citywide Climate Action Plan Appendix C
Draft 2 | January 2013 | Arup North America Ltd. Page C4
Off-road equipment was included in the community-wide inventory using the California Air Resources Board’s OFFROAD2007 model62, in accordance with applicable BAAQMD guidance. The following emissions sources are covered in the OFFROAD2007 model: emissions from fossil fuel use in landscaping equipment, grills, ATVs, private planes and other small sources owned by Concord businesses and residents. Total off-road 2005 baseline emissions were calculated for Contra Costa County, then they were prorated based on the proportion of the City of Concord’s population relative to Contra Costa County’s population to reflect the City’s contribution.
C3 Emissions Factors Emissions factors are the rate of GHGs emitted per unit of activity. The emissions factors used to calculate the 2005 baseline inventory come from internationally-recognized protocols and State and local regulations and guidance. The emissions factors are presented in Table C-1.
Table C-1: Emissions Factors and References by Sector
Description Factor Reference
Electricity 489.16 lbs CO2/MWh 30.24 lbs CH4/GWh 8.08 lbs N2O/GWh
LGOP Equation 6.10 with PG&E utility-specific emission factors for CO2 (Table G.6 LGOP) and eGRID factors for CH4 and N2O (U.S. EPA eGRID2007 Version 1.1)63
Natural gas 11.70 lbs CO2/therm 5.00 g CH4/MMBtu 0.10 g N2O/MMBtu
LGOP Equation 6.2
Wastewater N2O from WWTP without nitrification/denitrification
N2O from effluent discharge without nitrification/ denitrification
LGOP Equation 10.8
LGOP Equation 10.10
Solid waste Various EPA WARM model updated August 2010
62 To access the OFFROAD2007 model, go to http://www.arb.ca.gov/msei/offroad/offroad.htm 63 http://www.theclimateregistry.org/downloads/2011/03/Table-14.1-eGRID-2007.pdf

City of Concord Citywide Climate Action Plan Appendix C
Draft 2 | January 2013 | Arup North America Ltd. Page C5
Description Factor Reference
On-road mobile Lbs CO2/mile for passenger/light duty vehicles = 1.10672236106985
Lbs CO2/mile for medium/heavy duty vehicles = 2.72245618801793
2007 EMFAC as reported by the South Coast Air Quality Management District
Lbs CO2/mile for heavy/heavy duty vehicles = 4.22184493491794
CH4/CO2 = 0.0000623 The Climate Registry, 2009
N2O/CO2 = 0.0000697
Off-road Various OFFROAD2007 model

Appendix D
Quantification Methods and Assumptions for Emissions Reductions

City of Concord Citywide Climate Action Plan Appendix D
Draft 2 | January 2013 | Arup North America Ltd. Page D1
D1 Quantification Methods and Assumptions for Emissions Reductions
This section describes the assumptions and methods behind the quantifying reductions in GHG emissions due to the strategies in this plan. Not all reductions due to all strategies could be calculated. For example, only the amount of CO2 sequestered from the atmosphere can be calculated as a reduction from planting trees, even though they have also been shown to reduce the energy loads of buildings from shade and from reduced ambient temperatures, and increase the amount of walking and cycling in a hot area. Some strategies have no quantifiable reductions, but are included because of their importance in supporting a variety of other strategies and for realizing long-term benefits as the science of calculating GHG impacts improves. Future updates to the CAP will be key opportunities to check for advances in quantification for the GHG reduction benefits that are not currently quantified.
For the strategies in the transportation and land-use sector, evidence currently shows that many strategies work together to result in reductions in VMT, and that the benefits must be calculated in groups. These are called "quantification groups" for the purpose of this analysis. Strategies that have directly quantifiable and separable benefits each constitute their own quantification group. Similarly, some strategies complement more than one quantification group. For example, the multi-modal wayfinding strategy benefits the pedestrian, bicycle, and transit improvement quantification groups. Some strategies within a quantification group are more significant to the calculation of GHG reductions than the other strategies in that group. Widely accepted guidance and conservative estimates were utilized in order to ensure that reductions were not over-estimated.
Table D-1 presents the reductions, assumptions, and methods for each quantification group. A list of sources of guidance and assumptions follows.

City of Concord Citywide Climate Action Plan Appendix D
Draft 2 | January 2013 | Arup North America Ltd. Page D2
Table D-1: Methods and Assumptions for Quantifying GHG Reductions Se
ctor
Strategy No.(s)
Quantification Group
Metric Tons CO2e Reduced from Baseline Methods and Assumptions 2020 2030 2035
Bui
ldin
gs P
erfo
rman
ce
BE1 Green Building Ordinance 15,679 44,748 50,486
These savings are derived from a combination of infill construction and replacement construction, increasing in overall saturation with each year. It is built upon an assumption for high efficiency buildings that use 43% less energy than an average building in Concord today. This 43% reduction is predicated upon the energy consumption of new homes averaging 2.0 kWh/ft2/yr and 0.12 therms/ft2/yr while commercial buildings average 7.0 kWh/ft2/yr and 0.15 therms/ft2/yr. These values are approximately a 50% reduction in natural gas use compared to current city average consumption values and a 40% reduction in electricity use. The reduction in electricity use is less than that for natural gas due to the higher concentration of unregulated electric loads and the increasing saturation of electric loads. Of the 43% savings, 88% is attributed to broader state energy standards advancement (Title 24 Part 6) and 12% is attributed to local Reach Code adoption requiring efficiency 15% beyond Title 24 in residential projects. In commercial projects, 75% of the reduction is attributed to Title 24 Part 6, and 25% is attributed to local Reach Code adoption. The carbon reductions occur primarily in the commercial sector because of the much higher projected growth rate for employment in Concord as compared to residential growth, and this policy is closely tied to new construction volume.
BE2 Promote Zero Net Energy 5,378 20,038 49,039
These reductions represent a midpoint between current consumption levels and the state's Zero Net Energy targets. The reduced energy consumption documented here could include reductions from solar energy systems installed as a part of new construction. Reductions reflect effectiveness of 92% for residential projects, and 95% for commercial projects. These reductions are implemented in increments of 2%, 8%, and 9% over the plan target years for residential, and 2%, 4%, and 16% over the plan target years for commercial.
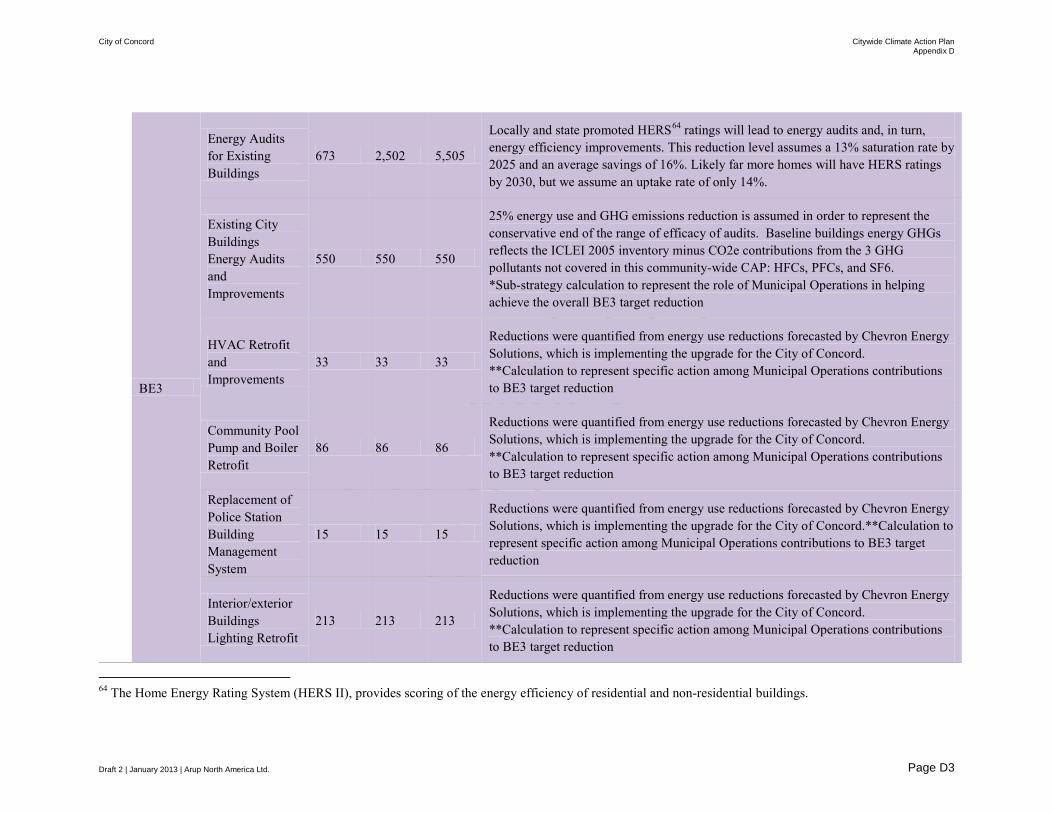
City of Concord Citywide Climate Action Plan Appendix D
Draft 2 | January 2013 | Arup North America Ltd. Page D3
BE3
Energy Audits for Existing Buildings
673 2,502 5,505
Locally and state promoted HERS64 ratings will lead to energy audits and, in turn, energy efficiency improvements. This reduction level assumes a 13% saturation rate by 2025 and an average savings of 16%. Likely far more homes will have HERS ratings by 2030, but we assume an uptake rate of only 14%.
Existing City Buildings Energy Audits and Improvements
550 550 550
25% energy use and GHG emissions reduction is assumed in order to represent the conservative end of the range of efficacy of audits. Baseline buildings energy GHGs reflects the ICLEI 2005 inventory minus CO2e contributions from the 3 GHG pollutants not covered in this community-wide CAP: HFCs, PFCs, and SF6. *Sub-strategy calculation to represent the role of Municipal Operations in helping achieve the overall BE3 target reduction
HVAC Retrofit and Improvements
33 33 33
Reductions were quantified from energy use reductions forecasted by Chevron Energy Solutions, which is implementing the upgrade for the City of Concord. **Calculation to represent specific action among Municipal Operations contributions to BE3 target reduction
Community Pool Pump and Boiler Retrofit
86 86 86
Reductions were quantified from energy use reductions forecasted by Chevron Energy Solutions, which is implementing the upgrade for the City of Concord. **Calculation to represent specific action among Municipal Operations contributions to BE3 target reduction
Replacement of Police Station Building Management System
15 15 15
Reductions were quantified from energy use reductions forecasted by Chevron Energy Solutions, which is implementing the upgrade for the City of Concord.**Calculation to represent specific action among Municipal Operations contributions to BE3 target reduction
Interior/exterior Buildings Lighting Retrofit
213 213 213
Reductions were quantified from energy use reductions forecasted by Chevron Energy Solutions, which is implementing the upgrade for the City of Concord. **Calculation to represent specific action among Municipal Operations contributions to BE3 target reduction
64 The Home Energy Rating System (HERS II), provides scoring of the energy efficiency of residential and non-residential buildings.

City of Concord Citywide Climate Action Plan Appendix D
Draft 2 | January 2013 | Arup North America Ltd. Page D4
BE5 Targeted Appliance Improvement
1,539 4,281 8,749 We expect to see a 10% reduction in energy use in 2035 through the procurement of improved residential appliances and 7% commercially, with those reductions occurring in 28% of residential and 26% of commercial building stock.
BE6
Onsite Renewable Energy
9,350 30,062 57,780
Continuously dropping panel prices will continue to accelerate market saturation, reaching 30% of buildings in Concord by 2035 and reducing fossil fuel-based electricity use in those buildings by 37% commercially and 64% residentially. Most residential panels are expected to offset most of the electric load, but will not offset any of the natural gas load.
Solar Photovoltaics for the Community Pool
44 44 44
Reductions were quantified from energy use reductions forecasted by Chevron Energy Solutions, which is implementing the upgrade for the City of Concord. Assumes 0.07% annual reduction in production performance, based on Chevron Energy Solutions calculations.
BE7
Voluntary Time-of-Sale Residential Energy Conservation
79 559 917
This voluntary program will encourage energy efficiency improvements following home sales. Because it is voluntary, it is expected to have relatively minimal reach, but will account for approximately a 1% reduction in energy use by 2035. The program should reach 3% of Concord homes by 2035 due to the continuous resale of properties. Over time, this program may be modified or made mandatory through collaboration with other jurisdictions in the County.
BE9
Streetlighting retrofit 431 431 431
Reductions were quantified from energy use reductions forecasted by Chevron Energy Solutions, which is implementing the upgrade for the City of Concord.
Park lighting retrofit
35 35 35 Reductions were quantified from energy use reductions forecasted by Chevron Energy Solutions, which is implementing the upgrade for the City of Concord.
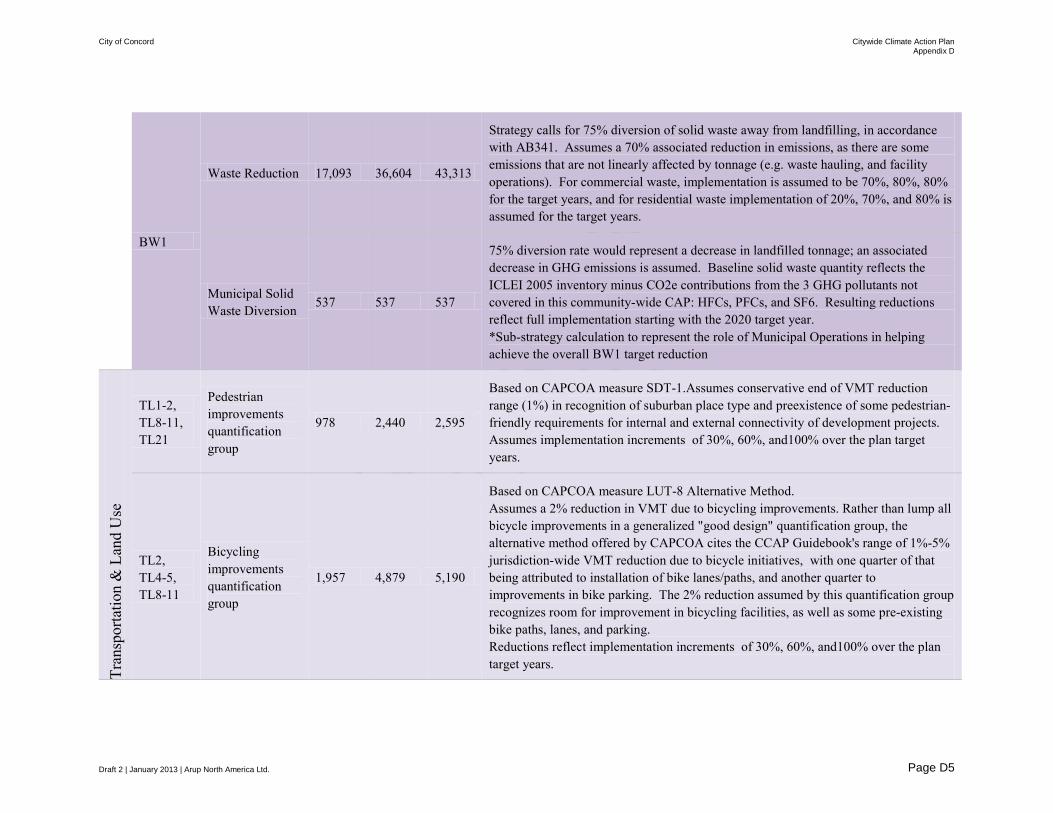
City of Concord Citywide Climate Action Plan Appendix D
Draft 2 | January 2013 | Arup North America Ltd. Page D5
BW1
Waste Reduction 17,093 36,604 43,313
Strategy calls for 75% diversion of solid waste away from landfilling, in accordance with AB341. Assumes a 70% associated reduction in emissions, as there are some emissions that are not linearly affected by tonnage (e.g. waste hauling, and facility operations). For commercial waste, implementation is assumed to be 70%, 80%, 80% for the target years, and for residential waste implementation of 20%, 70%, and 80% is assumed for the target years.
Municipal Solid Waste Diversion 537 537 537
75% diversion rate would represent a decrease in landfilled tonnage; an associated decrease in GHG emissions is assumed. Baseline solid waste quantity reflects the ICLEI 2005 inventory minus CO2e contributions from the 3 GHG pollutants not covered in this community-wide CAP: HFCs, PFCs, and SF6. Resulting reductions reflect full implementation starting with the 2020 target year. *Sub-strategy calculation to represent the role of Municipal Operations in helping achieve the overall BW1 target reduction
Tran
spor
tatio
n &
Lan
d U
se
TL1-2, TL8-11, TL21
Pedestrian improvements quantification group
978 2,440 2,595
Based on CAPCOA measure SDT-1.Assumes conservative end of VMT reduction range (1%) in recognition of suburban place type and preexistence of some pedestrian-friendly requirements for internal and external connectivity of development projects. Assumes implementation increments of 30%, 60%, and100% over the plan target years.
TL2, TL4-5, TL8-11
Bicycling improvements quantification group
1,957 4,879 5,190
Based on CAPCOA measure LUT-8 Alternative Method. Assumes a 2% reduction in VMT due to bicycling improvements. Rather than lump all bicycle improvements in a generalized "good design" quantification group, the alternative method offered by CAPCOA cites the CCAP Guidebook's range of 1%-5% jurisdiction-wide VMT reduction due to bicycle initiatives, with one quarter of that being attributed to installation of bike lanes/paths, and another quarter to improvements in bike parking. The 2% reduction assumed by this quantification group recognizes room for improvement in bicycling facilities, as well as some pre-existing bike paths, lanes, and parking. Reductions reflect implementation increments of 30%, 60%, and100% over the plan target years.
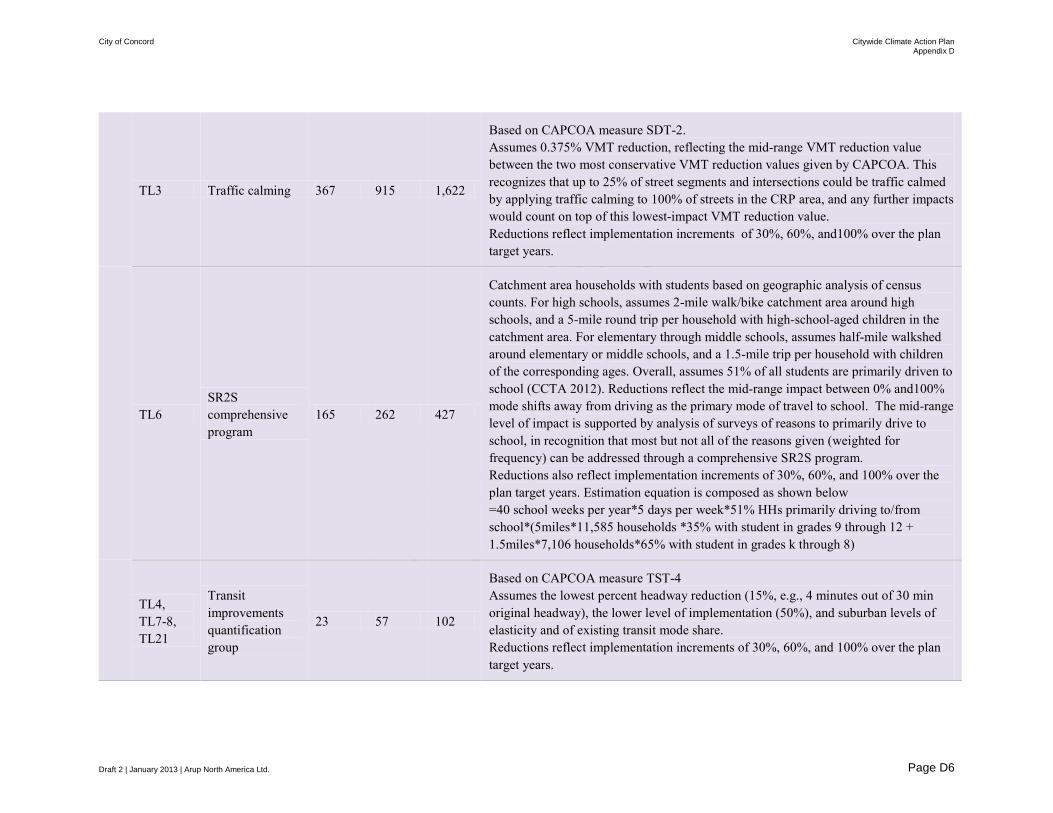
City of Concord Citywide Climate Action Plan Appendix D
Draft 2 | January 2013 | Arup North America Ltd. Page D6
TL3 Traffic calming 367 915 1,622
Based on CAPCOA measure SDT-2. Assumes 0.375% VMT reduction, reflecting the mid-range VMT reduction value between the two most conservative VMT reduction values given by CAPCOA. This recognizes that up to 25% of street segments and intersections could be traffic calmed by applying traffic calming to 100% of streets in the CRP area, and any further impacts would count on top of this lowest-impact VMT reduction value. Reductions reflect implementation increments of 30%, 60%, and100% over the plan target years.
TL6 SR2S comprehensive program
165 262 427
Catchment area households with students based on geographic analysis of census counts. For high schools, assumes 2-mile walk/bike catchment area around high schools, and a 5-mile round trip per household with high-school-aged children in the catchment area. For elementary through middle schools, assumes half-mile walkshed around elementary or middle schools, and a 1.5-mile trip per household with children of the corresponding ages. Overall, assumes 51% of all students are primarily driven to school (CCTA 2012). Reductions reflect the mid-range impact between 0% and100% mode shifts away from driving as the primary mode of travel to school. The mid-range level of impact is supported by analysis of surveys of reasons to primarily drive to school, in recognition that most but not all of the reasons given (weighted for frequency) can be addressed through a comprehensive SR2S program. Reductions also reflect implementation increments of 30%, 60%, and 100% over the plan target years. Estimation equation is composed as shown below =40 school weeks per year*5 days per week*51% HHs primarily driving to/from school*(5miles*11,585 households *35% with student in grades 9 through 12 + 1.5miles*7,106 households*65% with student in grades k through 8)
TL4, TL7-8, TL21
Transit improvements quantification group
23 57 102
Based on CAPCOA measure TST-4 Assumes the lowest percent headway reduction (15%, e.g., 4 minutes out of 30 min original headway), the lower level of implementation (50%), and suburban levels of elasticity and of existing transit mode share. Reductions reflect implementation increments of 30%, 60%, and 100% over the plan target years.
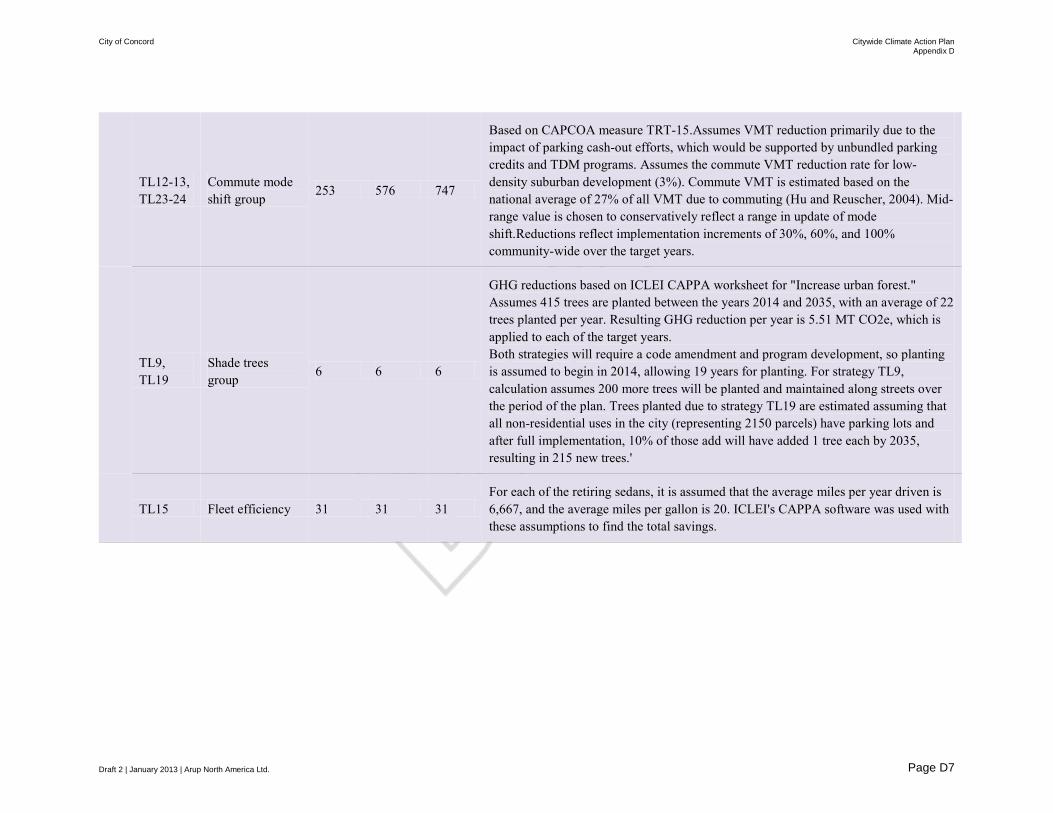
City of Concord Citywide Climate Action Plan Appendix D
Draft 2 | January 2013 | Arup North America Ltd. Page D7
TL12-13, TL23-24
Commute mode shift group 253 576 747
Based on CAPCOA measure TRT-15.Assumes VMT reduction primarily due to the impact of parking cash-out efforts, which would be supported by unbundled parking credits and TDM programs. Assumes the commute VMT reduction rate for low-density suburban development (3%). Commute VMT is estimated based on the national average of 27% of all VMT due to commuting (Hu and Reuscher, 2004). Mid-range value is chosen to conservatively reflect a range in update of mode shift.Reductions reflect implementation increments of 30%, 60%, and 100% community-wide over the target years.
TL9, TL19
Shade trees group 6 6 6
GHG reductions based on ICLEI CAPPA worksheet for "Increase urban forest." Assumes 415 trees are planted between the years 2014 and 2035, with an average of 22 trees planted per year. Resulting GHG reduction per year is 5.51 MT CO2e, which is applied to each of the target years. Both strategies will require a code amendment and program development, so planting is assumed to begin in 2014, allowing 19 years for planting. For strategy TL9, calculation assumes 200 more trees will be planted and maintained along streets over the period of the plan. Trees planted due to strategy TL19 are estimated assuming that all non-residential uses in the city (representing 2150 parcels) have parking lots and after full implementation, 10% of those add will have added 1 tree each by 2035, resulting in 215 new trees.'
TL15 Fleet efficiency 31 31 31 For each of the retiring sedans, it is assumed that the average miles per year driven is 6,667, and the average miles per gallon is 20. ICLEI's CAPPA software was used with these assumptions to find the total savings.
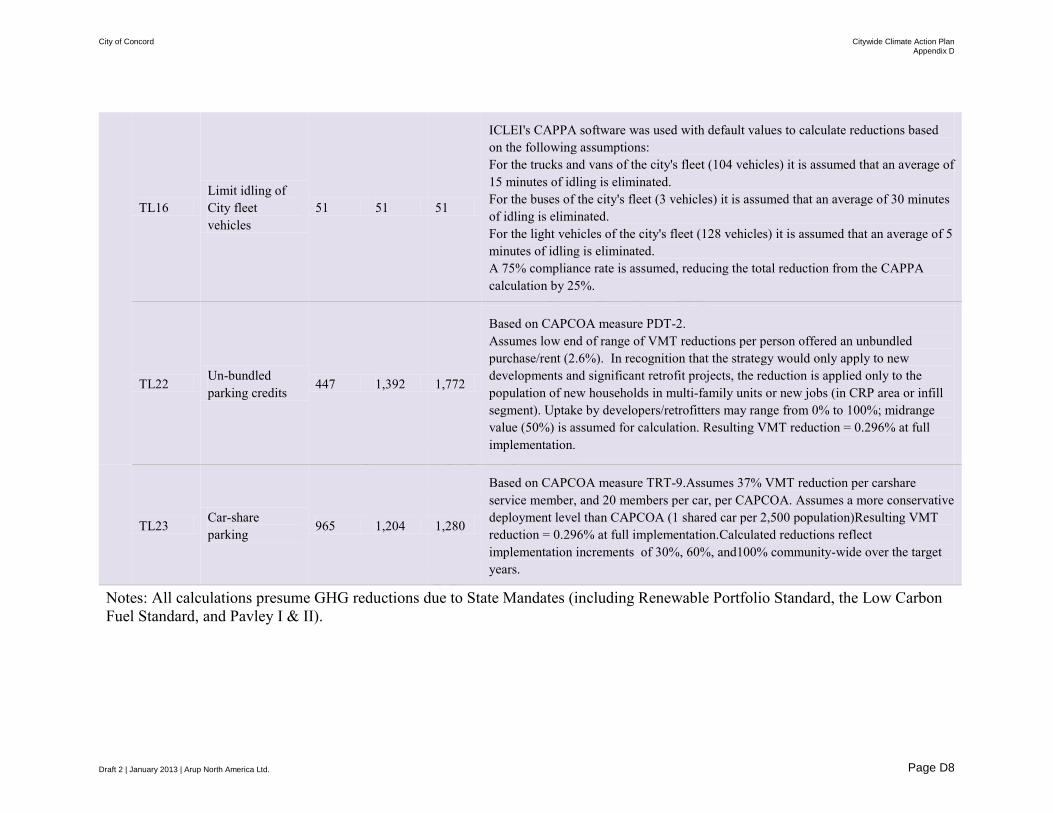
City of Concord Citywide Climate Action Plan Appendix D
Draft 2 | January 2013 | Arup North America Ltd. Page D8
TL16 Limit idling of City fleet vehicles
51 51 51
ICLEI's CAPPA software was used with default values to calculate reductions based on the following assumptions: For the trucks and vans of the city's fleet (104 vehicles) it is assumed that an average of 15 minutes of idling is eliminated. For the buses of the city's fleet (3 vehicles) it is assumed that an average of 30 minutes of idling is eliminated. For the light vehicles of the city's fleet (128 vehicles) it is assumed that an average of 5 minutes of idling is eliminated. A 75% compliance rate is assumed, reducing the total reduction from the CAPPA calculation by 25%.
TL22 Un-bundled parking credits
447 1,392 1,772
Based on CAPCOA measure PDT-2. Assumes low end of range of VMT reductions per person offered an unbundled purchase/rent (2.6%). In recognition that the strategy would only apply to new developments and significant retrofit projects, the reduction is applied only to the population of new households in multi-family units or new jobs (in CRP area or infill segment). Uptake by developers/retrofitters may range from 0% to 100%; midrange value (50%) is assumed for calculation. Resulting VMT reduction = 0.296% at full implementation.
TL23 Car-share parking 965 1,204 1,280
Based on CAPCOA measure TRT-9.Assumes 37% VMT reduction per carshare service member, and 20 members per car, per CAPCOA. Assumes a more conservative deployment level than CAPCOA (1 shared car per 2,500 population)Resulting VMT reduction = 0.296% at full implementation.Calculated reductions reflect implementation increments of 30%, 60%, and100% community-wide over the target years.
Notes: All calculations presume GHG reductions due to State Mandates (including Renewable Portfolio Standard, the Low Carbon Fuel Standard, and Pavley I & II).

City of Concord Citywide Climate Action Plan Appendix D
Draft 2 | January 2013 | Arup North America Ltd. Page D9
Quantification references
[1] California Air Pollution Control Officers Association (CAPCOA). 2010. Quantifying Greenhouse Gas Mitigation Measures. Available online: http://www.capcoa.org/wp-content/uploads/2010/11/CAPCOA-Quantification-Report-9-14-Final.pdf
[2] Center for Clean Air Policy (CCAP). 2005. CCAP Transportation Emissions Guidebook: Part 1. Pages 54-58. Accessed 2012-10-01. Available online: http://www.ccap.org/safe/guidebook/guide_complete.html .
[3] Chevron Energy Solutions. 2010. “Concord Energy Efficiency and System Improvements Project: Comprehensive Energy Analysis.” Confidential Internal Report.
[4] Contra Costa Transportation Authority (CCTA). 2012. Contra Costa County Safe Routes To School Masterplan: Existing Conditions: Data Summary DRAFT. February 28, 2012. Accessed 2012-10-01. Available online: http://www.ccta.net/assets/documents/RFP-RFQs~and~Notices~to~Contractors/RFP~12-3/Attach%205%20-%20SR2S%20Existing%20Conditions%20Summary%20Report.pdf
[5] Hu, Patricia, and Timothy Reuscher. 2004. Summary of Travel Trends: 2001 National Household Travel Survey. Washington, DC: U.S. Department of Transportation. Accessed 2012-10-01. Available at http://nhts.ornl.gov/2001/pub/STT.pdf
[6] Schlossberg, Marc, et. al. 2006. "School Trips: Effects of Urban Form and Distance on Travel Mode." Journal of the American Planning Association. 72:3. Pp337-346. Available online: http://dx.doi.org/10.1080/01944360608976755
[7] Transit Cooperative Research Program (TCRP). 2000. Report 59 Hybrid-Electric Transit Buses: Status, Issues, and Benefits. Page 88. Accessed 2012-10-01. Available online: http://onlinepubs.trb.org/onlinepubs/tcrp/tcrp_rpt_59.pdf

City of Concord Citywide Climate Action Plan Appendix E
Draft 2 | January 2013 | Arup North America Ltd. Page E1
Appendix E
Implementation and Monitoring Program
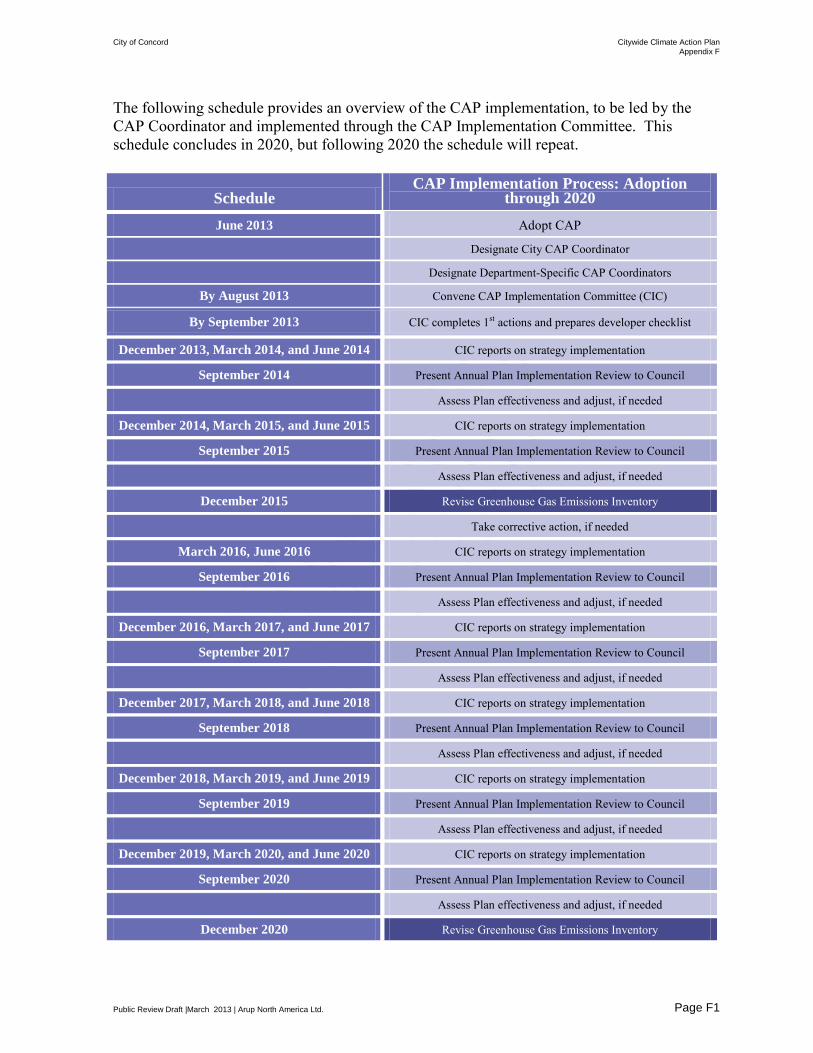
City of Concord Citywide Climate Action Plan Appendix F
Public Review Draft |March 2013 | Arup North America Ltd. Page F1
The following schedule provides an overview of the CAP implementation, to be led by the CAP Coordinator and implemented through the CAP Implementation Committee. This schedule concludes in 2020, but following 2020 the schedule will repeat.
Schedule CAP Implementation Process: Adoption
through 2020 June 2013 Adopt CAP
Designate City CAP Coordinator
Designate Department-Specific CAP Coordinators
By August 2013 Convene CAP Implementation Committee (CIC)
By September 2013 CIC completes 1st actions and prepares developer checklist
December 2013, March 2014, and June 2014 CIC reports on strategy implementation
September 2014 Present Annual Plan Implementation Review to Council
Assess Plan effectiveness and adjust, if needed
December 2014, March 2015, and June 2015 CIC reports on strategy implementation
September 2015 Present Annual Plan Implementation Review to Council
Assess Plan effectiveness and adjust, if needed
December 2015 Revise Greenhouse Gas Emissions Inventory
Take corrective action, if needed
March 2016, June 2016 CIC reports on strategy implementation
September 2016 Present Annual Plan Implementation Review to Council
Assess Plan effectiveness and adjust, if needed
December 2016, March 2017, and June 2017 CIC reports on strategy implementation
September 2017 Present Annual Plan Implementation Review to Council
Assess Plan effectiveness and adjust, if needed
December 2017, March 2018, and June 2018 CIC reports on strategy implementation
September 2018 Present Annual Plan Implementation Review to Council
Assess Plan effectiveness and adjust, if needed
December 2018, March 2019, and June 2019 CIC reports on strategy implementation
September 2019 Present Annual Plan Implementation Review to Council
Assess Plan effectiveness and adjust, if needed
December 2019, March 2020, and June 2020 CIC reports on strategy implementation
September 2020 Present Annual Plan Implementation Review to Council
Assess Plan effectiveness and adjust, if needed
December 2020 Revise Greenhouse Gas Emissions Inventory

City of Concord Citywide Climate Action Plan Appendix F
Public Review Draft |March 2013 | Arup North America Ltd. Page F2
Take corrective action, if needed
Identifying whether a strategy is mandatory or voluntary is an important distinction to the Bay Area Air Quality Management District (BAAQMD). Whether a strategy is mandatory or voluntary is an indication of the likely future greenhouse gas reduction attributable to a strategy. All strategies in this CAP are mandatory for the City. Some of the strategies are voluntary for business or residents. Table E1 indicates whether each strategy is mandatory or voluntary. Table E1: Mandatory or Voluntary Strategies
GREENHOUSE GAS REDUCTION Mandatory or Voluntary BUILDING PERFORMANCE
ENERGY BE1 Green Building Ordinance Exceeding State Requirements Mandatory BE2 Prepare for California Zero Net Energy Standards Mandatory
BE3 Energy Audits for Existing Buildings City actions are mandatory; resident and business participation is voluntary.
BE4 Demand response programs Mandatory
BE5 Efficient Appliances City actions are mandatory; resident and business participation is voluntary.
BE6 Renewable Energy Facilitation City actions are mandatory; resident and business participation is voluntary.
BE7 Residential Energy Conservation City actions are mandatory; resident and business participation is voluntary.
BE8 Energy Information City actions are mandatory; resident and business participation is voluntary.
BE9 Public Lighting Retrofit Mandatory
BE10 Construction Energy Use City actions are mandatory; business participation is voluntary.
WATER
BH1 Water Efficient Indoor Fixtures and Appliances City actions are mandatory; resident and business participation is voluntary.
BH2 Water-Efficient Outdoor Irrigation Mandatory BH3 Water-Metering and Monitoring Mandatory BH4 Recycled Water Mandatory WASTE BW1 Expanded waste reduction program Mandatory
TRANSPORTATION SYSTEMS AND LAND USE TL1 Pedestrian Master Plan Mandatory TL2 Programs and enforcement for safer active transportation Mandatory TL3 Traffic calming measures Mandatory TL4 Bike master plan Mandatory TL5 Bike parking installations Mandatory
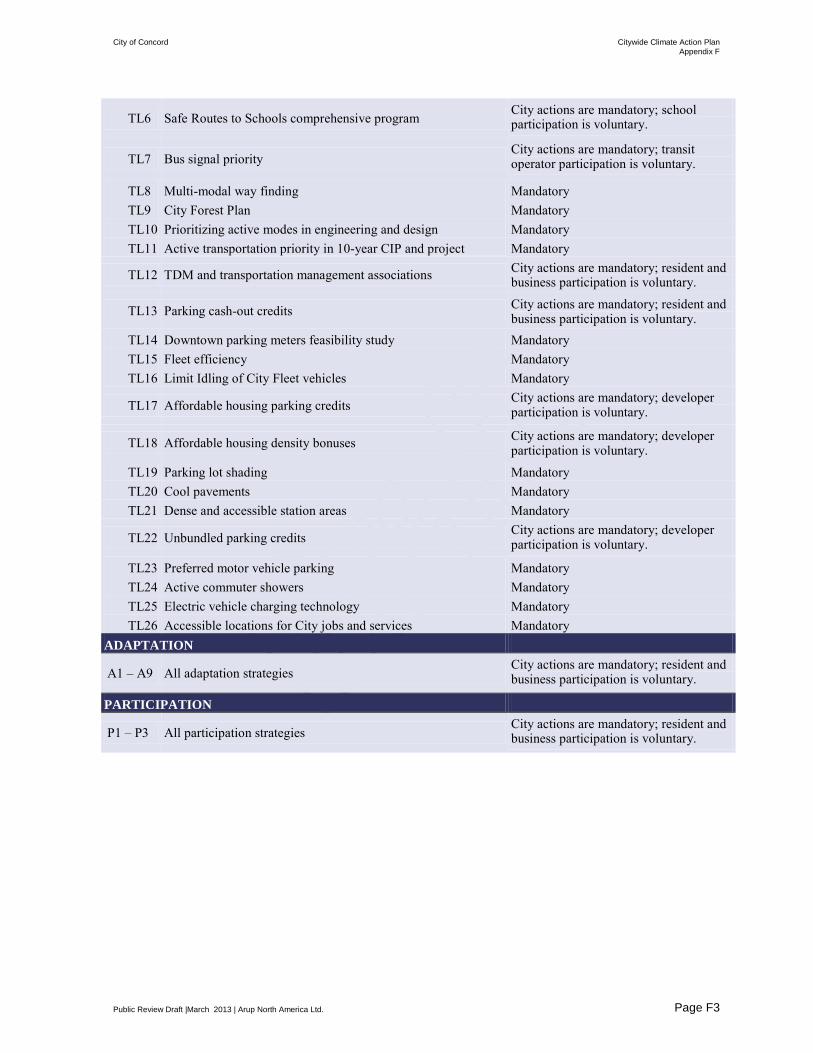
City of Concord Citywide Climate Action Plan Appendix F
Public Review Draft |March 2013 | Arup North America Ltd. Page F3
TL6 Safe Routes to Schools comprehensive program City actions are mandatory; school participation is voluntary.
TL7 Bus signal priority City actions are mandatory; transit operator participation is voluntary.
TL8 Multi-modal way finding Mandatory TL9 City Forest Plan Mandatory TL10 Prioritizing active modes in engineering and design Mandatory TL11 Active transportation priority in 10-year CIP and project
Mandatory
TL12 TDM and transportation management associations City actions are mandatory; resident and business participation is voluntary.
TL13 Parking cash-out credits City actions are mandatory; resident and business participation is voluntary.
TL14 Downtown parking meters feasibility study Mandatory TL15 Fleet efficiency Mandatory TL16 Limit Idling of City Fleet vehicles Mandatory
TL17 Affordable housing parking credits City actions are mandatory; developer participation is voluntary.
TL18 Affordable housing density bonuses City actions are mandatory; developer participation is voluntary.
TL19 Parking lot shading Mandatory TL20 Cool pavements Mandatory TL21 Dense and accessible station areas Mandatory
TL22 Unbundled parking credits City actions are mandatory; developer participation is voluntary.
TL23 Preferred motor vehicle parking Mandatory TL24 Active commuter showers Mandatory TL25 Electric vehicle charging technology Mandatory TL26 Accessible locations for City jobs and services Mandatory
ADAPTATION
A1 – A9 All adaptation strategies City actions are mandatory; resident and business participation is voluntary.
PARTICIPATION
P1 – P3 All participation strategies City actions are mandatory; resident and business participation is voluntary.

City of Concord Citywide Climate Action Plan Appendix F
Public Review Draft |March 2013 | Arup North America Ltd. Page F4
City of Concord Citywide Climate Action Plan Appendix F
Public Review Draft |March 2013 | Arup North America Ltd. Page F5
Appendix F
Supporting Files NOTE Upon adoption of this Citywide Climate Action Plan, a compact disc that will be provided that includes materials linking the raw data inputs with the calculations of forecast emissions. This will assist the regular monitoring and updating of the plan, in order to retain its status as a Qualified Greenhouse Gas Reduction Program and the associated CEQA clearance. The forecasts will include:
• Business-as-Usual Forecast (BAU), • Business-as-Usual Forecast with State Mandates, and • CAP Implementation Forecast
The inputs will include:
• Baseline inventory, • Population growth factors, and • Reductions assumptions
City of Concord Citywide Climate Action Plan Appendix G
Draft 2 | January 2013 | Arup North America Ltd. Page G1
Appendix G
Regulatory Landscape

City of Concord Citywide Climate Action Plan Appendix G
Draft 2 | January 2013 | Arup North America Ltd. Page G2
G1 California State Regulations Legislation and guidance from the State of California is both spurring and facilitating much of the effort to reduce GHG emissions at the local level. Through coordination, analysis, and targeted programs (both voluntary and mandatory), the State of California has initiated a variety of efforts that will assist the City of Concord to reduce its GHG emissions. Summaries of the nine State laws and policies that are most relevant to GHG reduction in Concord are presented below, as well as regional guidance specific to the Bay Area.
G1.1 State of California Executive Order S-3-05 In June 2005, Governor Schwarzenegger signed Executive Order S-3-05, calling for an 80 percent reduction in GHG emissions below 1990 levels by 2050. The California Air Resources Board’s Climate Change Scoping Plan presents a possible GHG emissions trajectory through 2050, based on a linear path, which would be needed to achieve these reductions, as shown in Figure G-1. This Executive Order serves as the basis for extrapolating the BAAQMD Plan-level 2020 guidance to determine the Concord Citywide CAP GHG per capita targets for forecast years of 2030 and 2035.
Figure G-1 Executive Order S-3-05 GHG Emissions Trajectory Toward 2050
Source: ARB 2008 “Climate Change Scoping Plan.”
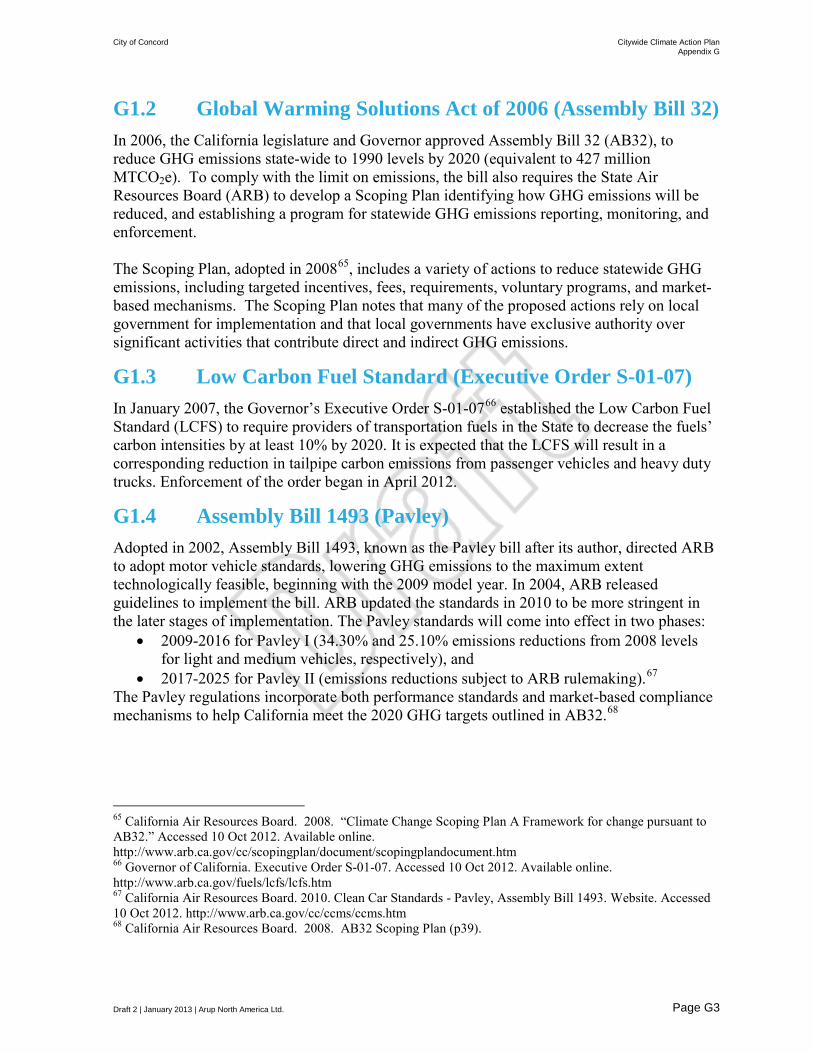
City of Concord Citywide Climate Action Plan Appendix G
Draft 2 | January 2013 | Arup North America Ltd. Page G3
G1.2 Global Warming Solutions Act of 2006 (Assembly Bill 32) In 2006, the California legislature and Governor approved Assembly Bill 32 (AB32), to reduce GHG emissions state-wide to 1990 levels by 2020 (equivalent to 427 million MTCO2e). To comply with the limit on emissions, the bill also requires the State Air Resources Board (ARB) to develop a Scoping Plan identifying how GHG emissions will be reduced, and establishing a program for statewide GHG emissions reporting, monitoring, and enforcement. The Scoping Plan, adopted in 200865, includes a variety of actions to reduce statewide GHG emissions, including targeted incentives, fees, requirements, voluntary programs, and market-based mechanisms. The Scoping Plan notes that many of the proposed actions rely on local government for implementation and that local governments have exclusive authority over significant activities that contribute direct and indirect GHG emissions.
G1.3 Low Carbon Fuel Standard (Executive Order S-01-07) In January 2007, the Governor’s Executive Order S-01-0766 established the Low Carbon Fuel Standard (LCFS) to require providers of transportation fuels in the State to decrease the fuels’ carbon intensities by at least 10% by 2020. It is expected that the LCFS will result in a corresponding reduction in tailpipe carbon emissions from passenger vehicles and heavy duty trucks. Enforcement of the order began in April 2012.
G1.4 Assembly Bill 1493 (Pavley) Adopted in 2002, Assembly Bill 1493, known as the Pavley bill after its author, directed ARB to adopt motor vehicle standards, lowering GHG emissions to the maximum extent technologically feasible, beginning with the 2009 model year. In 2004, ARB released guidelines to implement the bill. ARB updated the standards in 2010 to be more stringent in the later stages of implementation. The Pavley standards will come into effect in two phases:
• 2009-2016 for Pavley I (34.30% and 25.10% emissions reductions from 2008 levels for light and medium vehicles, respectively), and
• 2017-2025 for Pavley II (emissions reductions subject to ARB rulemaking).67 The Pavley regulations incorporate both performance standards and market-based compliance mechanisms to help California meet the 2020 GHG targets outlined in AB32.68
65 California Air Resources Board. 2008. “Climate Change Scoping Plan A Framework for change pursuant to AB32.” Accessed 10 Oct 2012. Available online. http://www.arb.ca.gov/cc/scopingplan/document/scopingplandocument.htm 66 Governor of California. Executive Order S-01-07. Accessed 10 Oct 2012. Available online. http://www.arb.ca.gov/fuels/lcfs/lcfs.htm 67 California Air Resources Board. 2010. Clean Car Standards - Pavley, Assembly Bill 1493. Website. Accessed 10 Oct 2012. http://www.arb.ca.gov/cc/ccms/ccms.htm 68 California Air Resources Board. 2008. AB32 Scoping Plan (p39).
City of Concord Citywide Climate Action Plan Appendix G
Draft 2 | January 2013 | Arup North America Ltd. Page G4
G1.5 Renewable Portfolio Standard (Senate Bills 1078, 107, and 2)
California’s Renewable Portfolio Standard (RPS) was established in 2002 under Senate Bill 1078 (SB1078) to increase the percent of renewable energy in the State. The timeframe for targets and implementation of the RPS was accelerated in 2006 under SB107. The targets were then raised in 2011 under Senate Bill 2 (SB2). The RPS now requires energy retailers (investor-owned utilities, electric service providers, and community choice aggregators) to source 20% of their energy from renewable sources as of 2010, and increase to 33% by 2020.69 As of 2005, about 12% of PG&E’s portfolio qualified as renewable. By 2020, a 21-percent increase is expected to comply with RPS.70
G1.6 CEQA Guidelines on Greenhouse Gas Emissions Senate Bill 97
Addressing the role of environmental impact analysis for meeting statewide GHG emissions targets, the legislature enacted Senate Bill 97 (SB97) in 2009 to draft and adopt amendments to the California Environmental Quality Act (CEQA) guidelines for the analysis and mitigation of GHG emissions from proposed projects regulated by CEQA. The Governor’s Office of Planning and Research (OPR) developed the amendments, which were adopted by the State Natural Resources Agency. As of March 18, 2010 all newly prepared CEQA documents must comply with the amended requirements, including:71 • Analyzing the GHG emissions of proposed projects and ruling on the significance of those
emissions. • If found significant, considering a range of mitigation measures to reduce GHG emissions. • Analyzing potentially significant impacts associated with hazardous project locations due
to the potential effects of climate change. • Analyzing the project’s potential energy use (including transportation-related energy),
sources of energy, and ways to reduce demand, including through the use of efficient transportation alternatives.
• Optionally, streamlining the analysis of GHGs for a project by using a programmatic GHG emissions reduction plan meeting certain criteria.
69 California Public Utilities Commission. http://www.cpuc.ca.gov/PUC/energy/Renewables/overview.htm 70 PG&E, 2005. http://www.pge.com/b2b/energysupply/wholesaleelectricsuppliersolicitation/renewables2005.shtml. Accessed on June 14, 2011. 71 Governor’s Office of Planning and Research. 2011. Webpage. “CEQA and Climate Change.” Accessed 10 Oct 2012. Available online. http://opr.ca.gov/s_ceqaandclimatechange.php

City of Concord Citywide Climate Action Plan Appendix G
Draft 2 | January 2013 | Arup North America Ltd. Page G5
G1.7 Sustainable Communities and Climate Protection Act of 2008 (Senate Bill 375)
In 2008, Senate Bill 375 (SB375) was adopted by the State of California to reduce GHG emissions from passenger vehicles, recognizing the relationship between vehicle miles traveled and land use. SB375 created a process whereby local governments and other stakeholders must work together within their region to achieve reduction of GHG emissions through integrated land use and transportation planning, and other transportation measures and policies72. In February 2011, the State’s Air Resources Board adopted per capita targets for the nine-county Bay Area73: 7% by 2020, and 15% by 2035 when compared to 2005. The Bay Area’s metropolitan planning organization, the Metropolitan Transportation Commission, developed a Sustainable Communities Strategy (SCS) to meet the regional GHG reduction targets. The Bay Area’s draft SCS, called the Jobs-Housing Connection Strategy, was selected as a preferred alternative in May 2012, and will undergo environmental clearance prior to adoption. A state-wide analysis by the Public Policy Institute of California74 found that three general strategies would be most likely to result in the GHG reductions called for by SB375:
• Higher-density development, particularly in areas well-served by transit; • Investments in alternatives to solo driving, such as transit, biking, walking, and
carpooling; and • Pricing policies that raise the cost of driving and parking.
SB375 also incentivizes local developers to follow strategies set by the regional SCS by allowing developers to bypass environmental review of their project’s GHG impact under CEQA if the project is consistent with the SCS.
G1.8 Business Solid Waste Diversion (Assembly Bill 341) Assembly Bill 341 (AB341) was adopted in 2011 to require commercial or public entities generating more than four cubic yards of solid waste per week to participate in recycling services.75 Multifamily dwellings of five or more units also must participate. The bill requires local governments to promote and outreach to businesses and multi-family building owners within their jurisdictions. Both requirements were effective as of July 1, 2012. AB341 specifies that strategies should reduce the amount of solid waste generated by commercial
72 California Air Resources Board. 2008. AB 32 Scoping Plan (p 27) 73 California Air Resources Board. 2011. "Executive Order G-11-024." Accessed 10 Oct 2012. Available online. http://www.arb.ca.gov/cc/sb375/executive_order_g11024.pdf 74 Bedsworth, Louise, Ellen Hanak and Jed Kolko. 2011. "Driving Change: Reducing Vehicle Miles Traveled in California." Accessed 10 Oct 2012. Available online. http://www.ppic.org/content/pubs/report/R_211LBR.pdf 75 CalRecycles. 2012. “Mandatory Commercial Recycling.” Website. Accessed 10 Oct 2012. Available online. http://www.calrecycle.ca.gov/climate/Recycling/default.htm
City of Concord Citywide Climate Action Plan Appendix G
Draft 2 | January 2013 | Arup North America Ltd. Page G6
entities that is neither recyclable nor compostable, and increase the use of recycling and composting.
According to 2008 Statewide Waste Characterization data76, the commercial sector generated nearly three fourths of the solid waste in California, and much of the commercial sector waste sent to landfills was readily recyclable. AB341 is designed to enable the California Department of Resources Recycling and Recovery (CalRecycles) to meet the state’s goal of at least 75% diversion of solid waste to recycling and compost instead of landfills by the year 2020, and to contribute to meeting the GHG reduction goals in AB32. The statewide 75% diversion goal is on top of the Integrated Waste Management Plan mandate that local jurisdictions achieve 50% of solid waste diversion annually (starting in 2000).
G1.9 Water Conservation Act of 2009 (Senate Bill 7) California Senate Bill 7 (SBx7-7) was enacted in November, 2009 to set and meet statewide per capita water consumption reduction targets: 10% reduction by the end of 2015, and 20% by 202077 from 2010 levels. The bill requires all water suppliers in the State to affect water conservation measures and encourage conservation by water customers. Urban water suppliers must set targets to contribute to the statewide reductions, and pass water management plans that would meet those targets starting in 2012. The bill mandates a minimum 5% reduction in base water use by 2020 for all urban water suppliers that use at least 100 gallons per capita per day. The bill also requires agricultural water suppliers to implement specified, efficient water management practices before August 2012 and create water management plans. Water suppliers who do not meet the water conservation requirements of the bill will not be eligible for state water grants or loans effective 2013 (agricultural) or 2016 (urban).
G2 Regional Guidelines G2.1 Bay Area Air Quality Management District In 2005, the Bay Area Air Quality Management District (BAAQMD) established a Climate Protection Program to address climate change within existing BAAQMD programs and functions. In order to meet the state’s AB 32 emissions reductions goals, BAAQMD also developed a detailed GHG emissions inventory and offers technical assistance and grant programs to local jurisdictions. In order to pay for climate protection activities and programs related to stationary sources, the District added a fee in 2008 to the permit bills for industrial facilities and businesses required
76 CalRecycles. 2012. “Solid Waste Characterization: Waste Characterization Studies.” Website. Accessed 10 Oct 2012. Available online. http://www.calrecycle.ca.gov/wastechar/wastestudies.htm 77 Department of Water Resources. 2012. Website “The Water Conservation Act of 2009.” Accessed 10 Oct 2012. Available online. http://www.water.ca.gov/wateruseefficiency/sb7/

City of Concord Citywide Climate Action Plan Appendix G
Draft 2 | January 2013 | Arup North America Ltd. Page G7
to obtain an air quality permit to operate.78 The fee adds 4.4 cents per metric ton of greenhouse gas emissions to the permit bills. BAAQMD has produced a detailed regional GHG emission inventory for 2008, which includes historical and future year emission projections for the period 1990 through 2025.79 This inventory provides an overview of GHG emission sources in the Bay Area and breakdowns by county levels, emission sectors, and season of the year. BAAQMD established thresholds of significance in 2010 for GHG emissions from projects and plans subject CEQA analysis, similar to those for other regulated air pollutants.80 However, in March 2012 the Alameda County Superior Court ordered the District to cease use and dissemination of the thresholds until environmental analysis of the thresholds could determine whether they have a significant impact on the environment under CEQA.81
78 BAAQMD. 2012. “California Environmental Quality Act: Air Quality Guidelines.” Accessed 10 Oct 2012. http://www.baaqmd.gov/?sc_itemid=83004271-3753-4519-8B09-D85F3FC7AE70 79 BAAQMD, 2011. Source Inventory of Bay Area. Accessed 10 Oct 2012. Available online. http://www.baaqmd.gov/~/media/Files/Planning%20and%20Research/Emission%20Inventory/BY08SummaryReportFinal.ashx 80 The thresholds were again updated in the June 2011 guidelines. See "Bay Area Air Quality Management District: CEQA Guidelines Updated May 2011." Available online. http://www.baaqmd.gov/Divisions/Planning-and-Research/CEQA-GUIDELINES/Updated-CEQA-Guidelines.aspx According to the 2010 Guidelines that have since been updated, a plan would have a significant environmental impact if it allowed development that would generate more than 6.6 metric tons of CO2e per service population per year by 2020. (Service population equals the sum of residents and employees in an area.) Alternatively, the significance of the plan’s impact could have been evaluated based on the consistency of the plan with an adopted GHG Reduction Strategy that is found to be consistent with AB 32 reduction goals; if the plan is consistent, it would not result in a significant impact. See “ 81 BAA QMD. 2012. “California Environmental Quality Act: Air Quality Guidelines.” Accessed 10 Oct 2012. Available online. http://www.baaqmd.gov/~/media/Files/Planning%20and%20Research/CEQA/BAAQMD%20CEQA%20Guidelines_Final_May%202012.ashx?la=en

City of Concord Citywide Climate Action Plan Appendix H
Draft 2 | January 2013 | Arup North America Ltd. Page H1
Appendix H
Qualified Greenhouse Gas Reduction Program

City of Concord Citywide Climate Action Plan Appendix H
Draft 2 | January 2013 | Arup North America Ltd. Page H2
This CAP is intended to enable streamlined CEQA review as outlined in the State CEQA Guidelines (Section 15183.5) and the BAAQMD CEQA Guidelines (May 2012). This section outlines the CEQA requirements and demonstrates how the CAP meets the requirements of a Qualified GHG Reduction Strategy.
The State CEQA Guidelines (Section 15183.5) outline the elements needed to “analyze and mitigate the significant effects of greenhouse gas emissions at a programmatic level,” from which project-specific environmental projects may tier. The BAAQMD CEQA Guidelines (May 2012) further clarify these elements as part of a “Qualified GHG Reduction Strategy” under which a project can qualify for streamlined CEQA review.
Each element from the State CEQA Guidelines (Section 15183.5)82 is described below with a description of how this Citywide CAP meets the requirements.
• Element A: Quantify greenhouse gas emissions, both existing and projected over a specified time period, resulting from activities within a defined geographic area83 This CAP includes: 2005 Baseline, BAU (no plan) emissions for 2020, 2030, and 2035, and Mitigated Plan emissions for 2020, 2030, and 2035. As agreed with BAAQMD, this CAP addresses CO2, CH4, and N2O, the Kyoto gases for which Concord can reliably estimate emissions.
• Element B: Establish a level, based on substantial evidence, below which the contribution to greenhouse gas emissions from activities covered by the plan would not be cumulatively considerable This CAP will achieve the Citywide per capita (service population) plan-level average target of 6.6 MT/SP by 2020. The plan-level per capita targets for subsequent forecast years, 2030 and 2035, have been extrapolated from the 2020 target using the Executive Order S-3-05 emission reduction trajectory to 2050.
• Element C: Identify and analyze the greenhouse gas emissions resulting from specific actions or categories of actions anticipated within the geographic area
82 §15183.5. Tiering and Streamlining the Analysis of Greenhouse Gas Emissions. 83 BAAQMD recommends preparing a community-wide GHG emission projection to identify the expected levels of GHG emissions for: (1) 2020 (i.e., the AB32 benchmark year), and (2) the projected year of the plan build out. Two projections should be prepared for each year:
• A projection reflecting existing conditions (e.g., business-as-usual), and • A projection that accounts for proposed policies, programs, and plans included within the
general plan that would reduce GHG emissions from build-out of the plan.
The first projection should be used as the basis for evaluation of the no project alternative in the plan‘s EIR. The second projection should be used as the basis for evaluation of the proposed project. Additional projections corresponding to plan alternatives considered within the EIR should also be prepared and included within the EIR‘s alternatives analysis.

City of Concord Citywide Climate Action Plan Appendix H
Draft 2 | January 2013 | Arup North America Ltd. Page H3
This CAP quantifies the anticipated effects of Statewide mandates including the RPS, Pavley, and LCFS. While the CAP quantifies the impact assuming successful implementation of the policies as stated, the CAP also proposes strategies that will go beyond the target. This “excess” emissions reduction will provide a buffer in the case that some of the Statewide mandates are not fully implemented.
• Element D: Specify measures or a group of measures, including performance standards, that substantial evidence demonstrates, if implemented on a project-by-project basis, would collectively achieve the specified emissions level This CAP specifies measures in each major sector of the community-scale inventory including: buildings and infrastructure, transportation, and municipal operations, as well as adaptation and community participation strategies. Taken together, these strategies reduce emissions to a level below the per capita target for each of the forecast years.
• Element E: Establish a mechanism to monitor the plan’s progress toward achieving the level and to require amendment if the plan is not achieving specified levels The CAP’s implementation and monitoring approach is described for each strategy, assigning responsibility and noting the timeline of anticipated implementation. Progress metrics have been identified to track uptake of various strategies, and performance metrics will track effectiveness of GHG emissions reductions.
• Element F: Be adopted in a public process following environmental review. The CAP will be included by reference as an amendment to the Concord 2030 General Plan, with language and structure that compliments the current document.