Embed Size (px)
Citation preview

City of Cape Town Mini Hydro
Prefeasibility Study
An assessment of the potential for the development of hydroelectric plants at eight
sites in the CCT Bulk Water System
5th August 2011
Authors: Luel Culwick
Christiaan Bode

CCT Mini Hydro Power Prefeasibility Report
Page i
Executive Summary This study was undertaken to determine the initial feasibility of Mini Hydro Electric generation in the
City of Cape Town’s Bulk Water Infrastructure system. The study commenced on the 1st June 2011
and was finalized on the 5th August 2011 over a period of 10 weeks.
Prefeasibility Design
The analysis yielded positive results and it is recommended that a full feasibility study is to
commence.
A total of eight sites were assessed at four of the major water treatment works. These being:
1. Steenbras Water Treatment Plant
o Rockview Dam to Steenbras Upper Dam
o Steenbras Lower Dam to the Steenbras Water Treatment Plant
o Steenbras Water Treatment Plant to the 840 & 810 Break Pressure Tanks
2. Wemmershoek Water Treatment Plant
o Wemmershoek Dam to Wemmershoek Water Treatment Plant
3. Blackheath Water Treatment Plant
o Blackheath Water Treatment Plant raw water supply pipeline
o Blackheath Water Treatment Plant to the Upper Blackheath Reservoir
o Blackheath Lower Reservoir Inlet
4. Faure Water Treatment Plant
o Faure Water Treatment Plant Inlet
A full technical and financial assessment was performed on each of the sites, identifying various potentials for each site. The following is a list of feasible options identified. Table 1 is a summary of all the sites that should be investigated further in the feasibility study following the outcomes of this prefeasibility. Table 2 and Table 3 summarise the design and financial results for these sites.
Table 1: Feasible Sites
List of Feasible Sites
1 Steenbras Water treatment works to break pressure tanks 810, 840
2 Steenbras Lower Dam to Steenbras Water treatment works 2
3 Wemmershoek water treatment works
4 Blackheath Raw Water Inlet
5 Blackheath Water Treatment Works to Upper Service Reservoir
6 Blackheath Upper reservoir to Lower Reservoir 1
7 Faure water treatment works 2
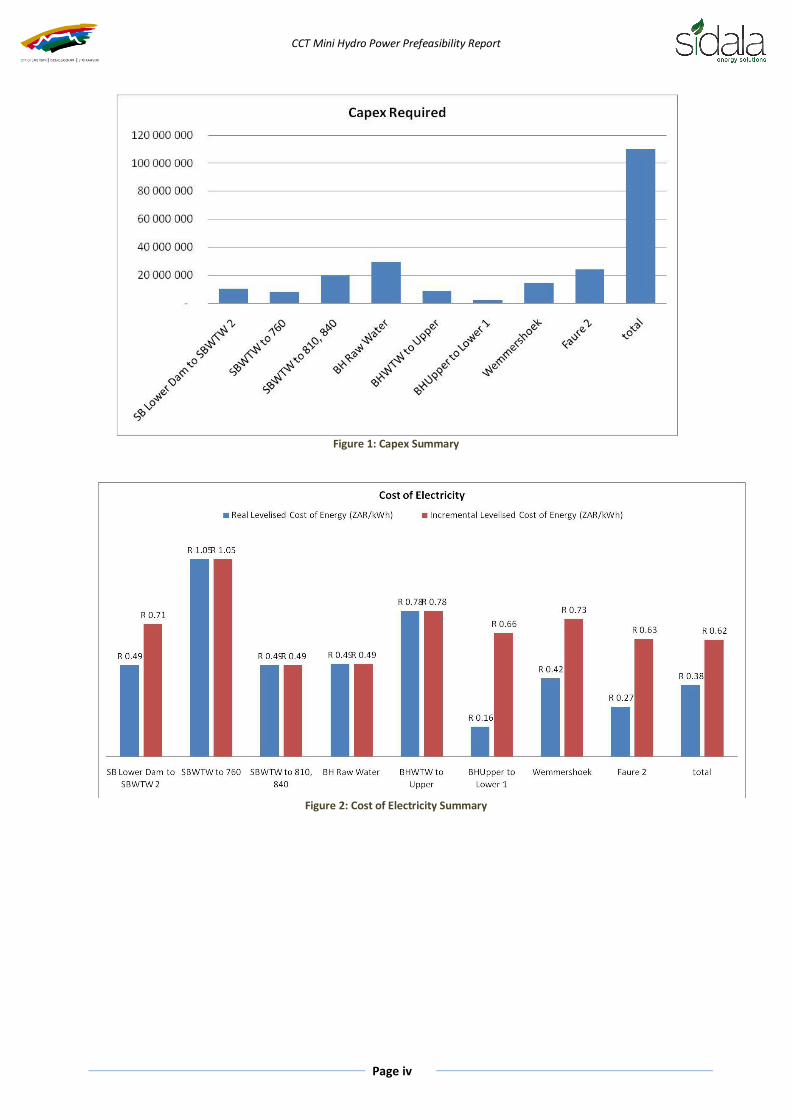
When performing the site investigation at Steenbras, another potential site was identified and included in this investigation. The plant is to be situated at the 760 break pressure tank at Steenbras but did not yield positive investment results. It was concluded that it would still worth investigating further in the feasibility study. Figure 1 to Figure 4 show a summary of the Capex, Cost of Electricity, NPV and Equity IRR for the sites to be further assessed.

CCT Mini Hydro Power Prefeasibility Report
Page ii
Table 2: Summary of design results for sites to be further investigated
SB Lower Dam to SBWTW C
SB Lower Dam to SBWTW 2
SBWTW to 760
SBWTW to 810, 840
BH Raw Water
BHWTW to Upper
BHUpper to Lower C
BHUpper to Lower 2
Wemmers-hoek C
Wemmers-hoek 1
Faure C Faure 2
Static Head m * 55 172 74 77 8 64 64 * 35 * *
Hydraulic losses % * 15% 10% 10% 45% 5% 5% 7% * 10% * 5%
Rated Head m 34 48 155 66 42 7.6 60 60 28 31 130 124
Design Flow m3/s 0.66 1.60 0.18 1.50 3.40 3.40 1.16 2.00 0.46 2.50 1.16 2.50
Design Flow Ml/day 58 138 16 130 294 294 100 173 40 216 100 216
Turbine type
2 xTurgo Francis Pelton Pelton Francis Kaplan Turgo Francis Francis Francis Turgo Francis
Runner Diameter m 0.53 0.57 0.22 0.58 0.82 0.82 0.71 0.79 0.71
Turbine Design Efficiency % * 87% 91% 87% 86% 91% * 88% * 85% * 90%
Turbine Capacity kW 179
605
228
784
1 096
184
537
932
207
576
1 174
2 441
Annual Plant Downtime Losses % * * 5% 5% 5% 5% 5% 5% 5% 5% * 5%
Theoretical Energy Delivered kWh
2 508 864
5 035 791
1 896 047
6 521 722
9 119 251
1 530 190
6 219 600
7 759 567
1 544 356
4 795 447
12 921 000
20 316 175
Actual Energy Delivered kWh
788 196
2 532 311
767 260
4 266 995
6 138 489
1 041 251
3 294 928
4 473 515 *
3 596 066
7 772 310
13 445 706
Capacity Factor % 31% 50% 40% 65% 67% 68% 53% 58% 75% 60% 66%
Actual Increase from Current Generation kWh -
1 744 116 - - - - -
1 178 587 -
2 051 711 -
5 673 396
% Increase % - 221% - - - - - 36% - 133% - 73%

CCT Mini Hydro Power Prefeasibility Report
Page iii
Table 3: Summary of financial results for sites to be further investigated
Key Outputs SB Lower Dam to SBWTW 2
SBWTW to 760
SBWTW to 810, 840
BH Raw Water
BHWTW to Upper
BHUpper to Lower 1
Wemmershoek Faure 2 total
Capex Required 10 497 625 8 395 250 19 858 625 29 442 375 8 818 750 2 590 000 14 284 375 24 005 625 110 122 827
Equity Required at Fin Close 3 149 288 2 518 575 5 957 588 8 832 713 2 645 625 777 000 4 285 313 7 201 688 33 036 848
PPA Revenue 60 951 029 26 813 190 149 117 267 214 519 745
36 388 266 37 001 251 71 700 451 198 266 275 603 042 102
Operating Costs 10 004 401 3 766 800 12 956 439 18 116 844 3 039 966 3 303 029 9 526 918 40 361 314 93 339 250
EBITDA 50 946 628 23 046 390 136 160 828 196 402 901
33 348 300 33 698 222 62 173 533 157 904 961 544 281 910
Net Cashflow 34 791 947 10 127 031 105 600 606 151 094 350
19 777 221 29 712 499 40 191 463 120 962 965 255 770 682
NPV 2 171 023 -1 437 295 11 471 378 16 023 515 175 233 4 279 048 1 707 157 12 276 372 7 130 424
Equity IRR 19% 8% 29% 28% 14% 54% 17% 27% 27%
Incremental Levelised Cost of Energy (ZAR/kWh)
R 0.71
R 1.05
R 0.49
R 0.49
R 0.78
R 0.66
R 0.73
R 0.63
R 0.62
Real Levelised Cost of Energy (ZAR/kWh)
R 0.49
R 1.05
R 0.49
R 0.49
R 0.78
R 0.16
R 0.42
R 0.27
R 0.38
CCT Mini Hydro Power Prefeasibility Report
Page iv
Figure 1: Capex Summary
Figure 2: Cost of Electricity Summary

CCT Mini Hydro Power Prefeasibility Report
Page v
Figure 3: NPV Summary
Figure 4: IRR Summary
Project Plan
The project cycle through all phases was considered with a likely phasing shown in Figure 5.

CCT Mini Hydro Power Prefeasibility Report
Page vi
Figure 5: Project Cycle
Optimization of the project cycle is largely driven by the technical elements. Each technical item will
occur within a phase of the project cycle. Each project phase has a different intention, and it is
important that the technical items are scoped in such a way that the right level of detail is achieved
according to spending levels appropriate to the phase of development.
A conservative program was constructed to illustrate the path ahead for the Project starting from
the beginning of 2012 shown in Figure 6.
Figure 6: Project Program
The Development and Implementation Phases are estimated to take a little over one and a half years
each, and the Operation Phase to commence in the first half of 2015, a little over three years after
the start of the Feasibility Study.
Project Structure
The CCT must determine its risk appetite and availability of finance to determine the desirable
procurement mechanism for the Project. Risks associated with the Project include:
Resource
o Flow reductions/non supply
o Flow fluctuation
o Sub-optimal flow regime
o Head Losses
Capex
o Low or negative Equity returns
o Inability to repay Lenders
Opex
o Cashflow shortages

CCT Mini Hydro Power Prefeasibility Report
Page vii
o Unexpected or “lumpy” maintenance costs
Energy Offtake
o Non-payment
o Insufficient term
o Insufficient balance sheet of buyer
o Insufficient security, inability to attach public assets
CER Offtake
o Non-payment
o Insufficient term
o Insufficient balance sheet of counterparty
Implementation
o Cost overrun
o Delay
Operational
o Suboptimal operation
o Unplanned, unpredictable unavailability
Production
o Underperforming energy production and therefore CER production
Grid Connection
o Inability to connect
o Connection delay
o Connection unavailability
Compliance
o Environmental non-authorisation
o Water use non-authorisation
o Other non-compliance
Terminal Project Hazards
o Earthquake
o Flood
o etc
A potential PPP Agreement is proposed, the structure of which is shown in Figure 7.

CCT Mini Hydro Power Prefeasibility Report
Page viii
Figure 7: PPP Structure
The PPP agreement provides for the commercial use of Public Property (CCT Bulk Water
Infrastructure) by the Private Party (IPP). The basis of the agreement is to provide tenure to the IPP
over CCT assets required for hydroelectric generation, which the IPP will develop and operate for a
profit. In return, the IPP will pay CCT for this tenure. The terms of the agreement will include the
following:
It is suggested that the IPP receive tenure over infrastructure via a lease in order to generate
power. Note, the IPP does not acquire assets, the CCT will continue to own the power
generation assets throughout and following the term of the PPP.
Infrastructure required includes:
o Land on which the plant will be located
o Existing buildings within which plant will be located
o Water conveyance infrastructure
o Existing power generation assets
The lease term will need to be sufficient to allow the IPP to project finance itself. This would
need to be a minimum of 20 years.
The IPP is required to develop and operate the leased assets to produce and sell energy
profitably.
The IPP makes concessionary payments to CCT. Note these payments should be linked to the
profitability of the IPP. In this way a partnership is forged through alignment. The more

CCT Mini Hydro Power Prefeasibility Report
Page ix
profitable the IPP is the more direct financial benefits CCT will receive.
CCT is required to supply water according to agreed flow regimes. Note the flow regime
received by the IPP of course impacts directly on the profitability of the IPP. Through the
alignment created by the structure of concessionary payments, the CCT and the IPP will strive
to provide optimal flows for power generation while maintaining water supply objectives.
Output Specification placed on IPP:
o Based on flow received, energy production levels and corresponding profit must be
generated by the IPP according to agreed levels. If the production levels are not
attained, the IPP will pay penalties to the CCT.
Through this structure the CCT receives guaranteed income through the PPP agreement via either
concessionary payments or penalties. Financial, technical and operational risk is assumed by the IPP.
The IPP and CCT are aligned, promoting cooperation between the two parties.
Determination of Project Structure
Consideration of internal and external procurement mechanisms allows CCT to assume or transfer
virtually all of the risks associated with power generation. The proposed PPP transfers all but
Resource risk to the IPP. In addition, the proposed PPP provides relief from capital shortage to CCT
by leveraging Private Sector finance. The PPP will provide long term, guaranteed income and will
enable efficient use of CCT Assets. On the other end of the scale, using an internal mechanism with
a traditional contracting structure, CCT assumes all the risk and capital requirements. Internal
Procurement using an EPC Wrap contracting structure is a hybrid between the two.
Clear consideration of structural options will allow the CCT to ensure that risks assumed are
manageable and that the activities taking place in-house are determined to be core, as well
providing options suited to the capital constrains of the Institution.
Environmental Authorisation
The expected Project activities were analyses and compared to activities listed in the NEMA. The
analysis indicated that a full EIA is not necessary and no activities triggering a BA are definitely
present. The assessment could change once more detailed information become available. Following
the completion of the Feasibility Design, a general assessment of activities and potential triggers of
environmental authorisations by an EAP is recommended.
Clean Development Mechanism
The scale of the individual sites considered in the Project means that it is not viable to develop a
single CDM project for each site. Hence it is necessary to develop the CDM potential through within
a Program of Activities, or some other structure bundles of the sites to share the costs of CDM
component development. A Carbon Consultant must advise on this in the Feasibility Study.

CCT Mini Hydro Power Prefeasibility Report
Page x
The production and resulting income from CDM are shown in Table 4. It is recommended that a
Carbon Consultant be employed in the Feasibility Study to fully investigate the CDM aspect of the
Project.
Table 4: CER production and income
Total Energy kWh/annum 35 100 549
Total CERs #/annum 33 633
Total CER Revenue ZAR 70 337 219
Total CER Costs ZAR 7 569 182
Total CER Net Income ZAR 62 768 038
Local Socio-Economic Benefits
Job creation created by the Project is somewhat limited. Temporary jobs will be created during the
Development and Implementation phases. In hydropower projects, the biggest job creation element
is found in the procurement of the Civil Contractor, due to civil construction and earthworks. Based
on previous experience in South African hydropower projects, the temporary jobs created could
potentially be 96 employees. Because the majority of the sites in this study do not require
significant civil works, this number is most likely to be lower.
Further local benefits can be created by the project through the creation of a Community Trust,
which is a powerful way to create local and targeted broad-based socio-economic benefits. A Needs
Analysis will identify areas to be targeted including, but are not limited to:
involvement of, and direct benefits to, non-governmental organisations, religious
institutions, civics, clinics, child-care centres, and the like
employment preference for youth in a targeted geographic area
employment targets for disabled people
employment preferences for women
preference for contracting with SMMEs as suppliers of materials and/or services in a
targeted geographic area
initiatives that will support HIV and Aids education
other local socio-economic impacts appropriate to the project and its location

CCT Mini Hydro Power Prefeasibility Report
Page xi
Table of Contents Executive Summary ............................................................................................................................ i
List of Figures ................................................................................................................................ xviii
List of Tables ................................................................................................................................... xxi
List of Acronyms ............................................................................................................................ xxiv
1 Introduction .............................................................................................................................. 1
1.1 Background ........................................................................................................................ 1
1.2 Context .............................................................................................................................. 1
1.3 Scope ................................................................................................................................. 1
1.3.1 Feasibility Design ........................................................................................................ 1
1.3.2 Project Plan ................................................................................................................ 3
1.3.3 Project Structure ........................................................................................................ 3
1.3.4 Environmental Authorisation ...................................................................................... 3
1.3.5 Clean Development Mechanism ................................................................................. 3
1.3.6 Local Socio-Economic Benefits .................................................................................... 3
2 Background ............................................................................................................................... 4
2.1 Prefeasibility Analysis of Small Hydro Projects .................................................................... 4
2.2 Small Hydro........................................................................................................................ 6
2.2.1 Definition of Small Hydro ............................................................................................ 6
2.2.2 Operational Distinctions ............................................................................................. 6
2.2.3 Head Distinction ......................................................................................................... 6
2.2.4 Hydro Power Conversion ............................................................................................ 6
2.2.5 Turbine Selection........................................................................................................ 9
2.3 Risks to Water Supply Objective ....................................................................................... 10
2.3.1 Technical recommendations for hydroelectric plants set in existing infrastructures .. 11
3 Prefeasibility Technical Modelling ............................................................................................ 15
3.1 Methodology Followed .................................................................................................... 15
3.2 Head ................................................................................................................................ 15
3.3 Design Flow Rate .............................................................................................................. 15
3.4 Turbine selection and Sizing ............................................................................................. 15
3.5 Turbine Efficiency ............................................................................................................. 16
3.6 Losses .............................................................................................................................. 16
3.7 Energy Delivered .............................................................................................................. 16
3.8 Capacity factor ................................................................................................................. 16

CCT Mini Hydro Power Prefeasibility Report
Page xii
4 Financial Modelling .................................................................................................................. 17
4.1 Methodology ................................................................................................................... 17
4.1.1 Incremental Energy Costs ......................................................................................... 17
4.2 Project Development Costs .............................................................................................. 17
4.3 Capital Costs .................................................................................................................... 19
4.4 Income Streams ............................................................................................................... 20
4.4.1 Sale of Electricity – Power Purchase Agreement (PPA) .............................................. 20
4.4.2 Clean Development Mechanism (CDM) .................................................................... 23
4.5 Operation and Maintenance (O&M) Costs ........................................................................ 24
4.6 Project Finance ................................................................................................................ 25
4.7 Other Financial Assumptions (Inputs) ............................................................................... 26
5 Steenbras Water Treatment Works (SWTW) ............................................................................ 28
5.1 Steenbras Water Treatment Plant to the Break pressure tanks 840 and 810 (SBWTW to
810, 840) ..................................................................................................................................... 29
5.1.1 Description ............................................................................................................... 29
5.1.2 Data Used ................................................................................................................. 29
5.1.3 Design concept ......................................................................................................... 31
5.1.4 Design Results .......................................................................................................... 32
5.1.5 Grid Connection ....................................................................................................... 33
5.1.6 Works ....................................................................................................................... 34
5.1.7 Financial Modelling results ....................................................................................... 35
5.1.8 Conclusions and Recommendations.......................................................................... 36
5.2 Steenbras Lower Dam to Steenbras Water Treatment Works (SB Lower to SBWTW) ........ 37
5.2.1 Description (SB Lower Dam to SBWTW C) ................................................................. 37
5.2.2 Data used ................................................................................................................. 37
5.2.3 Current Turbine Operation ....................................................................................... 38
5.2.4 Design Concept - SB Lower Dam to SBWTW 1 ........................................................... 40
5.2.5 Design Concept - SB Lower Dam to SBWTW 2 ........................................................... 40
5.2.6 Design Results .......................................................................................................... 42
5.2.7 Grid Connection ....................................................................................................... 43
5.2.8 Financial Modelling and Results ................................................................................ 43
5.2.9 Conclusions and recommendations .......................................................................... 46
5.3 Steenbras Water Treatment Plant to the Break pressure tank 760 (SBWTW to 760) ......... 46
5.3.1 Description ............................................................................................................... 46

CCT Mini Hydro Power Prefeasibility Report
Page xiii
5.3.2 Data Used ................................................................................................................. 47
5.3.3 Design concept ......................................................................................................... 48
5.3.4 Works ....................................................................................................................... 48
5.3.5 Grid Connection ....................................................................................................... 49
5.3.6 Design Summary ....................................................................................................... 49
5.3.7 Financial Modelling Results ...................................................................................... 50
5.3.8 Conclusions and Recommendations.......................................................................... 51
5.4 Rockview Dam to Upper Steenbras Dam (Rockview to USD) ............................................. 52
5.4.1 Description ............................................................................................................... 52
5.4.2 Data Used ................................................................................................................. 53
5.4.3 Design concept (Rockview to USD 1) ......................................................................... 54
5.4.4 Design (Rockview to USD 2) ...................................................................................... 55
5.4.5 Grid Connection ....................................................................................................... 57
5.4.6 Design Summary ....................................................................................................... 57
5.4.7 Financial Modelling and Results ................................................................................ 59
5.4.8 Conclusions and Recommendations.......................................................................... 61
6 Wemmershoek ........................................................................................................................ 62
6.1 Description....................................................................................................................... 62
6.2 Current Turbine Operation ............................................................................................... 62
6.3 Data Used ........................................................................................................................ 63
6.3.1 Levels ....................................................................................................................... 63
6.3.2 Flow Rates ................................................................................................................ 64
6.4 Design concept................................................................................................................. 65
6.5 Grid Connection ............................................................................................................... 66
6.6 Works .............................................................................................................................. 68
6.7 Design Results .................................................................................................................. 68
6.8 Financial Modelling and Results ....................................................................................... 70
6.9 Conclusions and Recommendations ................................................................................. 71
7 Faure Water Treatment Works ................................................................................................ 73
7.1 Description....................................................................................................................... 73
7.2 Current Turbine Operation ............................................................................................... 73
7.3 Data Used ........................................................................................................................ 74
7.3.1 Levels ....................................................................................................................... 74
7.3.2 Flow Rates ................................................................................................................ 75

CCT Mini Hydro Power Prefeasibility Report
Page xiv
7.4 Design Concept - Increase production to Design Capacity (Faure 1) .................................. 77
7.4.1 Works ....................................................................................................................... 77
7.5 Design Concept - Replace Existing Turbine (Faure 2) ......................................................... 77
7.5.1 Works ....................................................................................................................... 78
7.6 Design Concept - Replace Existing Turbine (Faure 3) ......................................................... 78
7.6.1 Works ....................................................................................................................... 80
7.7 Grid Connection ............................................................................................................... 80
7.8 Design Summary .............................................................................................................. 81
7.9 Financial Modelling and Results ....................................................................................... 83
7.10 Conclusions and Recommendations ................................................................................. 85
8 Blackheath Water Treatment Works ........................................................................................ 87
8.1 Blackheath Raw Water Inlet (BH Raw Water) ................................................................... 87
8.1.1 Description ............................................................................................................... 87
8.1.2 Data Used ................................................................................................................. 88
8.1.3 Design concept ......................................................................................................... 89
8.1.4 Grid Connection ....................................................................................................... 90
8.1.5 Works ....................................................................................................................... 91
8.1.6 Design Summary ....................................................................................................... 92
8.1.7 Financial Modelling and Results ................................................................................ 93
8.1.8 Conclusions and recommendations .......................................................................... 94
8.2 Blackheath Water Treatment Plant to the Upper Service Reservoir (BHWTW to Upper) ... 95
8.2.1 Description ............................................................................................................... 95
8.2.2 Data Used ................................................................................................................. 95
8.2.3 Design Concept ........................................................................................................ 95
8.2.4 Grid Connection ....................................................................................................... 96
8.2.5 Works ....................................................................................................................... 96
8.2.6 Design Summary ....................................................................................................... 96
8.2.7 Financial Modelling and Results ................................................................................ 97
8.2.8 Conclusions and recommendations .......................................................................... 99
8.3 Blackheath Lower Reservoir Inlet (BH Upper to Lower)..................................................... 99
8.3.1 Description ............................................................................................................... 99
8.3.2 Current Turbine Operation ....................................................................................... 99
8.3.3 Data Used ............................................................................................................... 100
8.3.4 Design Concept - Increase Production (BH Upper to Lower 1) ................................. 101
CCT Mini Hydro Power Prefeasibility Report
Page xv
8.3.5 Design Concept – Turbine Replacement (BH Upper to Lower 2) .............................. 102
8.3.6 Grid Connection ..................................................................................................... 102
8.3.7 Design Summary ..................................................................................................... 102
8.3.8 Financial Modelling and Results .............................................................................. 104
8.3.9 Conclusions and recommendations ........................................................................ 106
9 Summary of Results ............................................................................................................... 107
10 Project Plan ....................................................................................................................... 112
10.1 Project Program ............................................................................................................. 114
10.2 Development Phase ....................................................................................................... 115
10.2.1 Feasibility Study ..................................................................................................... 116
10.2.2 CDM ....................................................................................................................... 117
10.2.3 Tender Design ........................................................................................................ 118
10.2.4 Procurement .......................................................................................................... 118
10.2.5 Commercial and Legal ............................................................................................ 118
10.2.6 Development Phase Program ................................................................................. 118
10.3 Implementation Phase ................................................................................................... 119
10.3.1 Detailed Design ...................................................................................................... 119
10.3.2 Contracting............................................................................................................. 119
10.3.3 Commissioning ....................................................................................................... 119
11 Project Structure ................................................................................................................ 120
11.1 Introduction to PPPs ...................................................................................................... 120
11.2 PPP for CCT Small Hydro ................................................................................................. 124
11.2.1 Proposed PPP Structure .......................................................................................... 124
11.2.2 Risk Allocation ........................................................................................................ 125
11.2.3 PPP Inception ......................................................................................................... 127
11.3 PPP and Project Cycles ................................................................................................... 130
11.4 Contracting structure and risk management ................................................................... 131
11.5 Conclusions .................................................................................................................... 133
12 Environmental Authorisation ............................................................................................. 135
12.1 Legislation ...................................................................................................................... 135
12.2 Specialist Studies ............................................................................................................ 137
13 Clean Development Mechanism ......................................................................................... 139
13.1 Context .......................................................................................................................... 139
13.2 CDM Project Cycle .......................................................................................................... 139

CCT Mini Hydro Power Prefeasibility Report
Page xvi
13.2.1 Project Idea Note.................................................................................................... 140
13.2.2 Project Design Document ....................................................................................... 140
13.2.3 Host country approval ............................................................................................ 140
13.2.4 Validation ............................................................................................................... 140
13.2.5 Registration ............................................................................................................ 140
13.2.6 Monitoring ............................................................................................................. 140
13.2.7 Third-party verification of project performance ...................................................... 140
13.2.8 Certification and issuance of CERs .......................................................................... 140
13.3 Structure ........................................................................................................................ 141
13.4 PIN ................................................................................................................................. 141
13.5 CER Production and Income ........................................................................................... 141
14 Local Socio - Economic Benefits ......................................................................................... 142
14.1 Job Creation ................................................................................................................... 142
14.1.1 Temporary Jobs ...................................................................................................... 142
14.1.2 Permanent Jobs ...................................................................................................... 143
14.2 PPP projects ................................................................................................................... 143
14.3 Community Trust ........................................................................................................... 143
Appendix A Turbine Spec Sheets .................................................................................................... 145
Appendix B CDM Assumptions ....................................................................................................... 147
Appendix C PPPs in South Africa .................................................................................................... 149
Appendix D Development Phase TOR ............................................................................................ 175
Technical TOR ................................................................................................................................ 175
Background ............................................................................................................................... 175
Scope ........................................................................................................................................ 175
Head Assessment................................................................................................................... 175
Hydrology Assessment ........................................................................................................... 175
Feasibility Design ................................................................................................................... 175
Cost Estimation ...................................................................................................................... 177
Production Projection ............................................................................................................ 177
Design of future phases ......................................................................................................... 177
Deliverables ............................................................................................................................... 177
Counterpart Provisions .......................................................................................................... 178
Information Required for Selection Process: .............................................................................. 178
Legal TOR .................................................................................................................................. 179

CCT Mini Hydro Power Prefeasibility Report
Page xvii
Background ............................................................................................................................... 179
Scope ........................................................................................................................................ 179
Project Documentation .......................................................................................................... 179
Project Finance ...................................................................................................................... 179
Ancillary................................................................................................................................. 180
Deliverables ............................................................................................................................... 180
Information Required for Selection Process: .............................................................................. 180
Environmental TOR ....................................................................................................................... 181
Scope ........................................................................................................................................ 181
Notify Authorities .................................................................................................................. 181
Public Participation ................................................................................................................ 181
Application Form ................................................................................................................... 181
Basic Assessment Report ....................................................................................................... 181
Submit Basic Assessment Report ........................................................................................... 182
Deliverables ............................................................................................................................... 182
Counterpart Provisions .............................................................................................................. 183
Information Required for Selection Process: .............................................................................. 183
Clean Development Mechanism TOR ............................................................................................. 184
Scope ........................................................................................................................................ 184
Confirm Project eligibility under CDM .................................................................................... 184
Select optimal CDM project structure .................................................................................... 184
Prepare Preliminary Estimates of GHG Reductions and Determine Their Market Value .......... 184
Obtain DNA letter of no objection .......................................................................................... 184
Public Participation ................................................................................................................ 184
Develop Project Design Document (PDD) ............................................................................... 184
Validation and Registration .................................................................................................... 184
Deliverables ............................................................................................................................... 185
Counterpart Provisions .............................................................................................................. 185
Information Required for Selection Process: .............................................................................. 185
CCT Mini Hydro Power Prefeasibility Report
Page xviii
List of Figures Figure 1: Capex Summary ................................................................................................................. iv
Figure 2: Cost of Electricity Summary ................................................................................................ iv
Figure 3: NPV Summary ..................................................................................................................... v
Figure 4: IRR Summary ...................................................................................................................... v
Figure 5: Project Cycle ...................................................................................................................... vi
Figure 6: Project Program ................................................................................................................. vi
Figure 7: PPP Structure .................................................................................................................... viii
Figure 8: Project development phases .............................................................................................. 4
Figure 9: Thorndike curve for wind projects ...................................................................................... 5
Figure 10: Pelton Wheel ................................................................................................................... 7
Figure 11: Turgo Turbine................................................................................................................... 7
Figure 12: Cross-Flow Turbine ........................................................................................................... 8
Figure 13: Francis Turbine ................................................................................................................. 8
Figure 14: Kaplan Turbine. ................................................................................................................ 9
Figure 15: Turbine Selection Chart .................................................................................................. 10
Figure 16: Pump and Turbine Comparison ....................................................................................... 13
Figure 17: Capital cost estimate accuracy ....................................................................................... 20
Figure 18: Time of Use structure ...................................................................................................... 21
Figure 19: Tariff Comparison............................................................................................................ 23
Figure 20: View of Lower Steenbras and the SWTW ......................................................................... 28
Figure 21: Break Pressure tanks 810 & 840 ...................................................................................... 29
Figure 22: Flow Duration curve Steenbras........................................................................................ 31
Figure 23: Steenbras Grid Connect Eskom Sub-station ..................................................................... 34
Figure 24: Cash Flow and NPV for SBWTW to 810, 840 .................................................................... 36
Figure 25: View of Lower Steenbras and the WTW .......................................................................... 37
Figure 26: Steenbras Turgo Turbine ................................................................................................. 39
Figure 27: SB LD to SBWTW 1 .......................................................................................................... 45
Figure 28: SB LD to SBWTW 2 .......................................................................................................... 45
Figure 29: Water Treatment works to upper 760 break pressure tank ............................................. 47
Figure 30: Lower Break pressure tank 760 ....................................................................................... 47
Figure 31: SBWTW to 760 NPV and IRR ............................................................................................ 51
Figure 32: Rockview Dam with canal outlet...................................................................................... 52
Figure 33: Rockiew dam inlet to Upper Steenbras ............................................................................ 53
Figure 34: Flow Duration Curve for Water entering Upper Steenbras Dam....................................... 54
Figure 35: Average daily hours operating at design flow .................................................................. 56
Figure 36: Rockview Grid Connection .............................................................................................. 57
Figure 37: Rockview to USD 1 NPV and Cash Flows .......................................................................... 60
Figure 38: Rockview to USD 2 NPV and Cash Flows .......................................................................... 60
Figure 39: Wemmershoek Water Treatment Works ......................................................................... 62
Figure 40: Wemmershoek Turbine ................................................................................................... 63
Figure 41: Wemmershoek Schematic ............................................................................................... 64
Figure 42: Flow Duration Curve Wemmershoek ............................................................................... 65
CCT Mini Hydro Power Prefeasibility Report
Page xix
Figure 43: Wemmershoek Grid Connect Eskom Sub-station ............................................................. 67
Figure 44: Wemmershoek grid connect Eskom Loop in .................................................................... 67
Figure 45: Wemmershoek Theoretical Power Output 2010 .............................................................. 68
Figure 46: Wemmershoek Cash flow and NPV ................................................................................. 71
Figure 47: Faure Water Treatment works ........................................................................................ 73
Figure 48: Existing Faure Turgo Turbine ........................................................................................... 74
Figure 49: Faure Flow Duration Curve Monthly 2009 ....................................................................... 76
Figure 50: Faure Flow Duration Curve 1997-2011 ............................................................................ 76
Figure 51: Faure 2 Power Output 2009 ............................................................................................ 78
Figure 52: Daily average operating hours at Faure ........................................................................... 79
Figure 53: Faure 3 Capacity factor ................................................................................................... 79
Figure 54: Faure Grid Connect Eskom Sub-station ............................................................................ 81
Figure 55: Faure 1 Cash Flow and NPV ............................................................................................. 84
Figure 56: Faure 2 Cash Flow and NPV ............................................................................................. 84
Figure 57: Faure 3 Cash Flow and NPV ............................................................................................. 85
Figure 58: Blackheath Water Treatment Works ............................................................................... 87
Figure 59: 1500mm needle valve ..................................................................................................... 88
Figure 60: 1100 mm bypass needle valve ......................................................................................... 88
Figure 61: Flow Duration Curve Blackheath ..................................................................................... 89
Figure 62: Blackheath Grid Connect Eskom Sub-station ................................................................... 91
Figure 63: BH Raw Water Cash Flow and NPV .................................................................................. 94
Figure 64: Drop between the works and the Upper Service Reservoir .............................................. 95
Figure 65: BHWTW to Upper NPV and Cash Flows ........................................................................... 98
Figure 66: Blackheath Lower Reservoir inlet Turgo Turbine ............................................................ 100
Figure 67: Blackheath Power output 3 sites ................................................................................... 104
Figure 68: BH Upper to Lower 2 NPV and Cash Flow ...................................................................... 106
Figure 69: Capex Summary ............................................................................................................ 110
Figure 70: Cost of Electricity Summary ........................................................................................... 110
Figure 71: NPV Summary ............................................................................................................... 111
Figure 72: IRR Summary................................................................................................................. 111
Figure 73: Project Cycle ................................................................................................................. 112
Figure 74: Alternate Project Cycle .................................................................................................. 112
Figure 75: Project Program ............................................................................................................ 115
Figure 76: Development Phase ...................................................................................................... 115
Figure 77: Feasibility Study Program .............................................................................................. 117
Figure 78: CDM Program ............................................................................................................... 118
Figure 79: Development Phase Program ........................................................................................ 119
Figure 80: PPP structure ................................................................................................................ 121
Figure 81: PPP Process ................................................................................................................... 123
Figure 82: CoCT PPP Structure ....................................................................................................... 124
Figure 83: PPP Cycle ...................................................................................................................... 130
Figure 84: Project Cycle ................................................................................................................. 130
Figure 85: PPP and Project Cycle .................................................................................................... 130
Figure 86: EPC Wrap Structure ....................................................................................................... 131
Figure 87: Internal Procurement with EPC Wrap contracting structure .......................................... 132

CCT Mini Hydro Power Prefeasibility Report
Page xx
Figure 88: Internal procurement with traditional contracting structure ......................................... 133
Figure 89: Bethlehem Hydro socio-economic benefits ................................................................... 142
Figure 90: Steenbras Turbine Spec Sheet ....................................................................................... 145
Figure 91: Faure Turbine Spec Sheet .............................................................................................. 146

CCT Mini Hydro Power Prefeasibility Report
Page xxi
List of Tables Table 1: Feasible Sites......................................................................................................................... i
Table 2: Summary of design results for sites to be further investigated ............................................. ii
Table 3: Summary of financial results for sites to be further investigated ......................................... iii
Table 4: CER production and income ................................................................................................. x
Table 5: Project Feasibility Costs ...................................................................................................... 18
Table 6: Power Price assumptions ................................................................................................... 21
Table 7: Price Forecast ..................................................................................................................... 22
Table 8: O&M costs ......................................................................................................................... 24
Table 9: Financial Assumptions ........................................................................................................ 27
Table 10: Levels at 810 & 840 [m] .................................................................................................... 30
Table 11: Flow Rates SBWTW to 810, 840 ........................................................................................ 30
Table 12: Design inputs and assumptions ........................................................................................ 32
Table 13: Design Results SBWTW to 810, 840 .................................................................................. 32
Table 14: Steenbras Grid Connection ............................................................................................... 33
Table 15: SBWTW to 810, 840 works ............................................................................................... 34
Table 16: Total Project Costs SBWTW to 810, 840............................................................................ 35
Table 17: Financial Modelling results SBWTW to 810, 840 ............................................................... 36
Table 18: Steenbras Lower Dam to WTW ......................................................................................... 38
Table 19: Flow rate data for SB Lower Dam to SBWTW C ................................................................. 38
Table 20: Current Steenbras Turbine Operation Assumptions .......................................................... 39
Table 21: Works SB Lower Dam to SBWTW 1 ................................................................................... 40
Table 22: Works SB Lower Dam to SBWTW 2 ................................................................................... 41
Table 23: SB Lower Dam to SBWTW Design Summary ...................................................................... 42
Table 24: Design Results SB Lower Dam to SBWTW 2....................................................................... 43
Table 25: SB LD to SBWTW Financial Summary ................................................................................ 44
Table 26: SBLD to SBWTW Key Financial Outputs ............................................................................. 45
Table 27: Flow rates SBWTW to 760 ................................................................................................ 48
Table 28: Works SBWTW to 760 ...................................................................................................... 48
Table 29: Design Summary SBWTW to 760 ...................................................................................... 49
Table 30: Design Results SBWTW to 760 .......................................................................................... 49
Table 31: SBWTW to 760 Project Costs ............................................................................................ 50
Table 32: SBWTW to 760 Key Financial Outputs ............................................................................... 51
Table 33: Flow Rate Summary Rockview to USD .............................................................................. 54
Table 34: Works Rockview to USD 1................................................................................................. 55
Table 35: Average daily Hours at design flow 2002- Rockview to USD 2 ........................................... 55
Table 36: Works Rockview to USD 2................................................................................................. 57
Table 37: Design Summary Rockview to USD ................................................................................... 58
Table 38: Design Results Rockview to USD 1 .................................................................................... 58
Table 39: Rockview Total Costs ........................................................................................................ 59
Table 40: Rockview to USD 1 Key Financial outputs ......................................................................... 60
Table 41: Current Plant Operation ................................................................................................... 63
Table 42: Level data Wemmershoek ................................................................................................ 64
Table 43: Flow rates Wemmershoek ................................................................................................ 64
Table 44: Grid Connection Wemmershoek....................................................................................... 66

CCT Mini Hydro Power Prefeasibility Report
Page xxii
Table 45: Works Wemmershoek ...................................................................................................... 68
Table 46: Wemmershoek Design Results ......................................................................................... 69
Table 47: Design Summary Wemmershoek ...................................................................................... 69
Table 48: Total Project Costs Wemmershoek ................................................................................... 70
Table 49: Wemmershoek Key Financial Outputs .............................................................................. 71
Table 50: Existing Faure operation ................................................................................................... 74
Table 51: Faure Flow Summary ........................................................................................................ 75
Table 52: Works Faure 1 .................................................................................................................. 77
Table 53: Works Faure 2 .................................................................................................................. 78
Table 54: Works Faure 3 .................................................................................................................. 80
Table 55: Faure Grid Connection...................................................................................................... 80
Table 56: Faure Design Results for Replacement Turbine ................................................................. 81
Table 57: Faure Design Summary ..................................................................................................... 82
Table 58: Faure Total Costs .............................................................................................................. 83
Table 59: Faure Financial Modelling Key Results .............................................................................. 85
Table 60: Blackheath Raw Water Flow Rate Summary ..................................................................... 89
Table 61: Blackheath Grid Connection ............................................................................................. 90
Table 62: Works BH Raw Water ....................................................................................................... 91
Table 63: Design Summary BH Raw Water ....................................................................................... 92
Table 64: Design Results BH Raw Water ........................................................................................... 92
Table 65: BH Raw water total costs .................................................................................................. 93
Table 66: BH Raw Water Key Financial Outputs ............................................................................... 94
Table 67: Works BHWTW to Upper .................................................................................................. 96
Table 68: Design Summary (BHWTW to Upper) ............................................................................... 96
Table 69: Design Results BHWTW to Upper ..................................................................................... 97
Table 70: BH Upper Total Costs........................................................................................................ 97
Table 71: BH Upper Key Financial Outputs ....................................................................................... 99
Table 72: Blackheath Lower Res Inlet Turbine Data ........................................................................ 100
Table 73: Head Levels .................................................................................................................... 101
Table 74: Flow Summary BH Upper to Lower ................................................................................. 101
Table 75: Works BH Upper to Lower 1 ........................................................................................... 102
Table 76: Works BH Upper to Lower 2 ........................................................................................... 102
Table 77: BH Upper to Lower 2 Energy Results............................................................................... 103
Table 78: Blackheath Upper to Lower Design Summary ................................................................. 103
Table 79: Total Costs BH Lower Res Inlet ....................................................................................... 105
Table 80: BH Upper to Lower 2 Key financial results ...................................................................... 106
Table 81: Feasible Sites .................................................................................................................. 107
Table 82: Summary of design results for sites to be further investigated........................................ 108
Table 83: Summary of financial results for sites to be further investigated..................................... 109
Table 84: Risk Allocation ................................................................................................................ 126
Table 85: Risk Allocation ................................................................................................................ 132
Table 86: Risk Allocation ................................................................................................................ 133
Table 87: Activities which trigger BA .............................................................................................. 137
Table 88: CDM Project Cycle .......................................................................................................... 139
Table 89: CER Results .................................................................................................................... 141

CCT Mini Hydro Power Prefeasibility Report
Page xxiii
Table 90: CDM Assumptions .......................................................................................................... 147

CCT Mini Hydro Power Prefeasibility Report
Page xxiv
List of Acronyms
Acronym Expanded Form
CDM Clean Development Mechanism
CER Certified Emission Reduction
CCT City of Cape Town
CPI Consumer Price Inflation
DWA Department of Water Affairs
EIA Environmental Impact Assessment
EPC Engineering Procurement Contracting
ESD Electricity Services Department
GHG Green House Gas
IPP Independent Power Producer
IRR Internal Rate of Return
ISMO Independent System Market Operator
O&M Operation and Maintenance
NERSA National Energy Regulator of South Africa
NPV Net Present Value
PDD Project Design Document
PIN Project Idea Note
PPA Power Purchase Agreement
PPP Public-Private Partnership
REFIT Renewable Energy Feed-In Tariff
ROR Run of River
SHP Small Hydro Plant
TOR Terms of Reference
TOU Time of Use
WACC Weighted Average Cost of Capital
WTW Water Treatment Works

CCT Mini Hydro Power Prefeasibility Report
Page 1
1 Introduction
1.1 Background
The South African Local Government Association (SALGA) and the South African Cities Network
(SACN) sourced funding for this study from the Public-Private Infrastructure Advisory Facility (PPIAF)
to undertake a REEE programme to support improved municipal infrastructure development through
private investment.
Sidala Energy Solutions was contracted by SACN to conduct a Prefeasibility Study on the Mini Hydro
Electric generation in the City of Cape Town’s Bulk Water Infrastructure system. The study
commenced on the 1st June 2011 and was finalized on the 5th August 2011 over a period of ten
weeks.
1.2 Context
The development of the Project occurs within the parameters defined by the Bulk Water supply
system. As such hydroelectric power generation is a secondary activity. At present, power
generation occurs purely as a support activity to water distribution. It is only considered in terms of
its benefit to water supply activities. This is illustrated by the fact that existing generation plant are
used to offset electricity bills and power water supply related infrastructure exclusively.
However, changes in the South African and world energy environment and the climate change
phenomenon warrant specific focus on the hydroelectric generation potential. Electricity tariffs in
South Africa are set to rise far quicker than inflation, and a premium will be paid for green power.
This makes the generation of green power an economic opportunity which it will not have been a
decade ago. In addition, the potential should be optimized for ethical reasons, and the exposure of
the projects maximized to demonstrate what local, provincial and national government
achievements.
Both water supply and renewable power generation objectives are present and will remain
inextricably linked. While renewable power generation will never compromise or supplant water
supply, it can provide significant economic and social benefits. As such it has a valid position and
within a fully functional and balanced Municipality renewable power generation should receive just
recognition. It is possible to integrate both objectives in such a way that water supply is not
compromised and power generation is maximized.
1.3 Scope
1.3.1 Feasibility Design
A total of eight sites were assessed at four of the major water treatment works. These being:
Steenbras Water Treatment Plant
1. Rockview Dam to Steenbras Upper Dam
2. Steenbras Lower Dam to the Steenbras Water Treatment Plant
3. Steenbras Water Treatment Plant to the 840 & 810 Break Pressure Tanks
Wemmershoek Water Treatment Plant

CCT Mini Hydro Power Prefeasibility Report
Page 2
4. Wemmershoek Dam to Wemmershoek Water Treatment Plant
Blackheath Water Treatment Plant
5. Blackheath Water Treatment Plant raw water supply pipeline
6. Blackheath Water Treatment Plant to the Upper Blackheath Reservoir
7. Blackheath Lower Reservoir Inlet
Faure Water Treatment Plant
8. Faure Water Treatment Plant Inlet
The viability of these sites was assessed by estimating potential power output using the latest
hydropower conversion technologies. The financial business cases for these sites were then
analysed.
The methodology used is described in detail below.
1.3.1.1 Technical Assessment
This commenced with a literature review to identify available hydropower conversion technologies.
Site visits were conducted to properly evaluate each site. Various layout options, surrounding
infrastructure, grid connection options and general technical feasibility were be assessed first hand.
Any recommendations for further specialist studies were recorded.
Layout options were assessed and described. A preliminary flow analysis of the various resources
using historical flow data was conducted. The hydrology data was compiled into Flow Duration
Curves (FDCs).
Technical models were constructed to evaluate each site according to its head and flow parameters,
which drive the electromechanical specification. Technical modelling was performed using
RETScreen methodology and included consideration of the following:
Gross and Net Head
Flow Duration Curves
Turbine Design
o Preliminary Type Selection
o Design Flow
Model Construction
o Efficiency Curves
o Electricity Production
o Capacity Factor
1.3.1.2 Financial Assessment
Financial models were constructed to analyse the sites financial viability. The results from the
technical feasibility were used as the input data for the financial modelling. Market based
assumptions were made, outlining the various interest rates and cost of capital. Various structuring
options were assessed taking into account different sources of finance from commercial and
development banks as well as equity financing from the private and the public sector.
A basic costing analysis was performed which analysed the cost of infrastructure required. This
costing analysis was based on RETScreen Methodology for costing mini hydro plants. The results of

CCT Mini Hydro Power Prefeasibility Report
Page 3
the costing analysis and the technical viability resulted in the preferred options that will be taken to
the final feasibility design.
Financial modelling of each site included the consideration of:
Sale of Electricity and operation costs
Finance Assumptions
Cashflow Analysis
Investment Analysis
1.3.2 Project Plan
The project cycle through all phases was considered and the optimisation in terms of appropriate
spending levels for each stage of development. A conservative program was constructed to illustrate
the path ahead for the Project starting from the beginning of 2012.
1.3.3 Project Structure
A risk assessment of the Project was conducted to assist CCT to determine procurement mechanism
for the Project.
A stated objective of the study is to develop “an implementation plan for the establishment of the
micro hydro project as PPPs between the selected municipalities and private sector partners”. In
line with this, a potential PPP Agreement was proposed through which CCT can procure the Project
shifting financial burden and risk to the Private Sector.
1.3.4 Environmental Authorisation
The expected Project activities were analysed and compared to activities listed in the NEMA. This
gave an indication of the likely environmental authorisation requirements. The process of meeting
these requirements were then investigated and described.
1.3.5 Clean Development Mechanism
Development of CDM potential was investigated for the Project. The production and resulting
income from CDM were calculated based on the energy production results from the Prefeasibility
Design.
1.3.6 Local Socio-Economic Benefits
Temporary and Permanent job creation is assessed according to South African hydropower
experience. The likely direct job creation stemming from the CCT project is quantified. Further to
this, other methods of creating local socio-economic benefits are assessed.
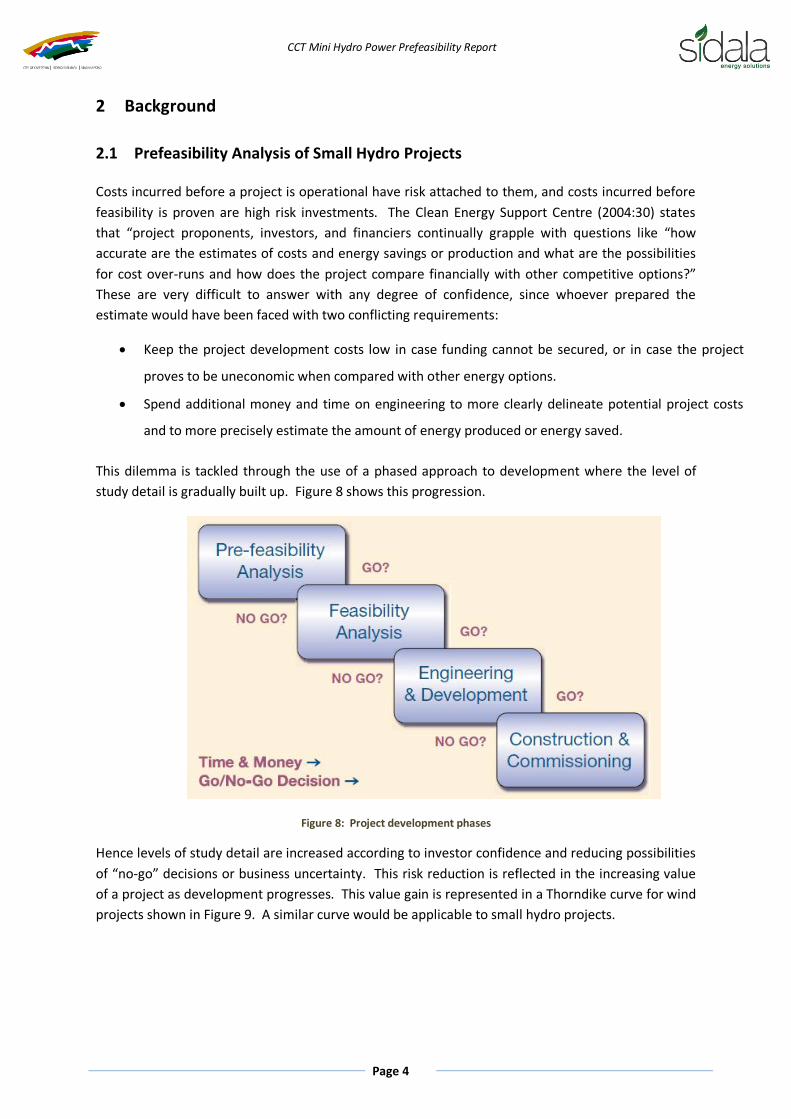
CCT Mini Hydro Power Prefeasibility Report
Page 4
2 Background
2.1 Prefeasibility Analysis of Small Hydro Projects
Costs incurred before a project is operational have risk attached to them, and costs incurred before
feasibility is proven are high risk investments. The Clean Energy Support Centre (2004:30) states
that “project proponents, investors, and financiers continually grapple with questions like “how
accurate are the estimates of costs and energy savings or production and what are the possibilities
for cost over-runs and how does the project compare financially with other competitive options?”
These are very difficult to answer with any degree of confidence, since whoever prepared the
estimate would have been faced with two conflicting requirements:
Keep the project development costs low in case funding cannot be secured, or in case the project
proves to be uneconomic when compared with other energy options.
Spend additional money and time on engineering to more clearly delineate potential project costs
and to more precisely estimate the amount of energy produced or energy saved.
This dilemma is tackled through the use of a phased approach to development where the level of
study detail is gradually built up. Figure 8 shows this progression.
Figure 8: Project development phases
Hence levels of study detail are increased according to investor confidence and reducing possibilities
of “no-go” decisions or business uncertainty. This risk reduction is reflected in the increasing value
of a project as development progresses. This value gain is represented in a Thorndike curve for wind
projects shown in Figure 9. A similar curve would be applicable to small hydro projects.

CCT Mini Hydro Power Prefeasibility Report
Page 5
Figure 9: Thorndike curve for wind projects

CCT Mini Hydro Power Prefeasibility Report
Page 6
2.2 Small Hydro
2.2.1 Definition of Small Hydro
Small Hydro typically receives a higher tariff than Large Hydro because it is considered to be a
renewable energy source. This is not the case for Large Hydro because of the adverse
environmental effects caused by the storage of water and flow alteration. 10MW is the generally
accepted threshold between small and large hydro, although in China this is agreed to be 50MW, in
France 12MW, and in the UK 20MW. (ESHA, 2004) The threshold for small hydro tariff eligibility in
South Africa is set by the Renewable Energy Feed-In Tariff at 10MW.
2.2.2 Operational Distinctions
Small Hydro can be either Run of River, located at the base of a dam or integrated in a canal or
pipeline. In a ROR scheme the system only generates power according to the flow it receives. It
does not have the capability of altering the flow for the purposes of generating power optimally.
This is largely applicable in the CCT sites as well.
2.2.3 Head Distinction
Schemes are generally classified according to head as this has large bearing on the layout type.
Three head classifications are recognised:
• High head: 100-m and above
• Medium head: 30 - 100 m
• Low head: 2 - 30 m
In higher head schemes, the cost of the penstock becomes a dominant cost component because of
the length required. In lower head schemes, turbine and turbine casing costs are a dominant cost
component because they must accommodate large volumes of water at elevated pressures.
2.2.4 Hydro Power Conversion
Strongly connected to the head classification is the type of energy conversion technology required.
Hydro power conversion occurs through the use of either impulse or reaction turbines. Impulse
turbines convert the kinetic energy into mechanical energy while reaction turbines convert the
pressure energy.
2.2.4.1 Impulse Turbines
The most common impulse turbine is the Pelton Wheel. Here water jets impinge perpendicular to
buckets, transferring linear kinetic energy of the water into rotation of the runner. A Pelton wheel is
shown in Figure 10.

CCT Mini Hydro Power Prefeasibility Report
Page 7
Figure 10: Pelton Wheel
A variation to the Pelton Wheel is the Turgo turbine. The function of a Turgo runner is similar to a
Pelton wheel except that the jet impinges at an angle of (usually) 20° and exits on the other face.
The 20° angle at which the jets impinge is to avoid interference between consecutive buckets, which
can occur in Pelton wheels. Efficiency is sacrificed however according to the cosine of the angle of
incidence. A Turgo turbine is shown in Figure 11.
Figure 11: Turgo Turbine
Cross-flow turbines are a low cost, highly flexible (to head variation) and low efficiency impulse
turbine. It is easy to manufacture and repair, and can be useful for well defined energy
requirements where there is a sufficient water resource and small investment availability. A Cross-
flow turbine is shown in Figure 12.

CCT Mini Hydro Power Prefeasibility Report
Page 8
Figure 12: Cross-Flow Turbine
2.2.4.2 Reaction Turbines
Francis Turbines have fixed runner blades and adjustable guide vanes. Water enters the runner
radially and exits axially. The spiral casing is designed to keep the water’s tangential velocity
constant along the consecutive sections and to distribute it peripherally to the distributor. A Francis
turbine is shown in Figure 13.
Figure 13: Francis Turbine

CCT Mini Hydro Power Prefeasibility Report
Page 9
Axial flow turbines include both propeller and Kaplan turbines. Propeller turbines are axial flow
turbines and are similar to marine propellers in appearance. A Kaplan turbine is a flexible propeller
turbine. The flexibility is provided by either “single-“ or “double-regulation”, with either adjustable
guide vanes or runner blades or both. The double regulation allows for the adaptation of the runner
and guide vanes coupling to any head or discharge variation. It is the most flexible Kaplan turbine
that can work between 15% and 100% of the maximum design discharge. Single regulated Kaplan
allows a good adaptation to varying available flow but is less flexible in the case of important head
variation. They can work between 30% and 100% of the design flow. A Kaplan runner is shown in
Figure 14.
Figure 14: Kaplan Turbine.
2.2.5 Turbine Selection
A very basic method of turbine selection is through the use of charts such as that shown in Figure 15.
Because of the overlap in the regions and the flexibility provided by the technologies, this method is
not definitive. It can provide a reasonable initial suggestion of turbine type, but it gives no indication
of the dimensions of the turbine.

CCT Mini Hydro Power Prefeasibility Report
Page 10
Figure 15: Turbine Selection Chart
More advanced methods of turbine selection involve the use of the quantity specific speed.
2.3 Risks to Water Supply Objective
Both water supply and hydroelectric power generation objectives are present and will remain
inextricably linked.
Hydroelectric power generation is emerging as a focus in its own right when in the past is has only
been a support to water supply activities. It may therefore present increased risks to water supply
objective such as:
Disruption of systems during execution of the works
Disruption of operations
Water contamination
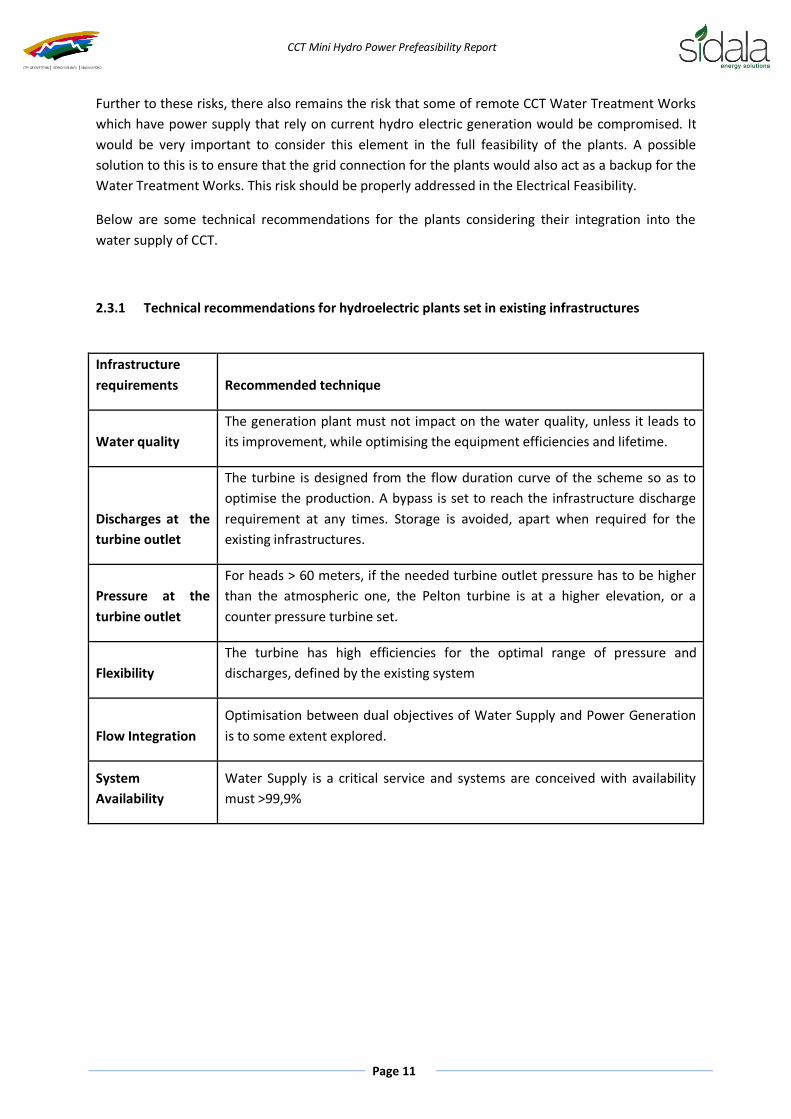
CCT Mini Hydro Power Prefeasibility Report
Page 11
Further to these risks, there also remains the risk that some of remote CCT Water Treatment Works
which have power supply that rely on current hydro electric generation would be compromised. It
would be very important to consider this element in the full feasibility of the plants. A possible
solution to this is to ensure that the grid connection for the plants would also act as a backup for the
Water Treatment Works. This risk should be properly addressed in the Electrical Feasibility.
Below are some technical recommendations for the plants considering their integration into the
water supply of CCT.
2.3.1 Technical recommendations for hydroelectric plants set in existing infrastructures
Infrastructure
requirements Recommended technique
Water quality
The generation plant must not impact on the water quality, unless it leads to
its improvement, while optimising the equipment efficiencies and lifetime.
Discharges at the
turbine outlet
The turbine is designed from the flow duration curve of the scheme so as to
optimise the production. A bypass is set to reach the infrastructure discharge
requirement at any times. Storage is avoided, apart when required for the
existing infrastructures.
Pressure at the
turbine outlet
For heads > 60 meters, if the needed turbine outlet pressure has to be higher
than the atmospheric one, the Pelton turbine is at a higher elevation, or a
counter pressure turbine set.
Flexibility
The turbine has high efficiencies for the optimal range of pressure and
discharges, defined by the existing system
Flow Integration
Optimisation between dual objectives of Water Supply and Power Generation
is to some extent explored.
System
Availability
Water Supply is a critical service and systems are conceived with availability
must >99,9%

CCT Mini Hydro Power Prefeasibility Report
Page 12
2.3.1.1 Water quality
A SHP plant must not impact on the water quality, unless it leads to its improvement, while
optimising the equipment efficiencies and lifetime. Especially while defining the penstock and
turbine, attention will be paid on the mechanical resistance and manufacturing easiness of the
selected materials but also on their corrosion and abrasiveness behaviour.
Water Quality Recommended technique
Gravels and stones Setting of a grid at the forebay
Sand particles Setting of a de-silted set before the forebay
Pelton runner built with mounted bucket to unset and replace the buckets
Drinking water All parts in contact with water in stainless steel
Electrical actuators to replace all oil ones
2.3.1.2 Discharges, flexibility and performances
The SHP plant operation must not impact on the primary function of the existing infrastructure.
Thus, the turbine has to be as much flexible as possible regarding the available pressures and
discharges, while guaranteeing high performance on the largest operation ranges. The turbine
design is based on the site flow duration curve, a crucial tool to optimize the production and the
viability of the project. Indeed, the discharges can evolve with the spring hydrology and/or with
human activities.
2.3.1.3 Drinking water quality and turbines
To demonstrate that turbines can respect water quality, or in other words that drinking water can
pass through the turbine before being consumed, a comparison with pumps can be achieved, as
shown in Figure 16.

CCT Mini Hydro Power Prefeasibility Report
Page 13
Figure 16: Pump and Turbine Comparison
2.3.1.4 Regulation
Generally, the turbine is regulated on the upstream water level in the forebay, so that it remains
steady. The process can be defined by the following steps: When the upstream level tends to rise,
the turbine opens up to increase its discharge up to the nominal one. If the upstream level keeps on
rising, the surplus can pass through the bypass. When the upstream level tends to go down, the
turbine closes itself to take less discharge. If the upstream level keeps on going down, the turbine is
shut down. By controlling the needle stroke for Pelton turbines, the vanes or blades opening for
Francis, and Kaplan turbines, the turbine can turn to be an efficient and convenient device to
regulate discharges.
2.3.1.5 Bypass
A bypass of the turbine may be required to guarantee the primary function of the existing
infrastructure at any time. For water networks for example, it has to be systematically set. It can be
used when the turbine is not operating due, for example, to a too low discharge or to maintenance
needs. It can also be used when the discharge needed for the existing scheme is higher than the
turbine nominal one. In such situation, the turbine uses its maximal discharge, whereas the surplus
flows through the bypass (if the head losses are still acceptable for the turbine). As it replaces the
turbine, the bypass has different functions: to regulate the discharges and/or the water levels, and
to reduce the pressure.
2.3.1.6 Penstock and head losses
At the start of a SHP project in existing infrastructure, a first issue is to define if the existing
penstocks and channels are suitable for electricity production, which implies mainly to check their
mechanical resistance (nominal pressure for a penstock) and head losses. In general, head losses are
acceptable if at nominal discharge they are lower than 10% of the difference in levels, or in other

CCT Mini Hydro Power Prefeasibility Report
Page 14
words if the penstock efficiency is higher than 90%. Indeed, this corresponds to the present state of
the art for equipment that uses optimally the water resource.
To sum up, head losses in a penstock depend on:
Its shape: singularities as elbows, forks tend to increase head losses
Its internal diameter
Its wall roughness and its evolution due to its degradation or/and to wall deposits.

CCT Mini Hydro Power Prefeasibility Report
Page 15
3 Prefeasibility Technical Modelling
3.1 Methodology Followed
To progress with the project it is necessary to make decisions educated using a sound techno-
economic model. The technical component of this deals with the manner in which hydraulic energy
is converted to electrical power. It is possible to simplify this model vastly through various
assumptions. However, a more detailed approach was possible in this study through the use of the
RETScreen publication. This increases accuracy of results enables a more holistic understanding of
the system under consideration.
The RETScreen International Clean Energy Project Analysis Software is the leading tool specifically
aimed at facilitating pre-feasibility and feasibility analysis of clean energy technologies. RETScreen
tool is particularly appropriate as it has been shown to dramatically reduce the time and cost
associated with preparing pre-feasibility studies.
The RETScreen tool is built on the experience of over 210 experts from industry, government and
academia and has vast meteorological and product data support. Of these, technology performance
is particularly important in this study. For this purpose over 6,000 pertinent product performance
and specification data needed to describe the performance of the proposed clean energy system are
provided.
The technical model developed for this study was performed in Microsoft Excel and is based on the
method proposed by RETScreen. It has been developed primarily to determine the small hydro
project possibilities and to evaluate a number of alternatives identified. The method has been
verified against certain turbine manufacturers showing a very close correlation to the results
predicted. Some of the model definitions are described below.
3.2 Head
The static head experienced at the plant and is merely a difference in height levels. After the
penstock and hydraulic losses the net rated head is the pressure seen on the turbine at the design
flow rate.
3.3 Design Flow Rate
The selection of the design flow depends, primarily, on the available flow (hydrology) at the site. For
grid connected run-of-river projects the optimum design flow is usually close to the flow that is
equalled or exceeded about 30% of the time. For isolated-grid and off-grid applications, the flow
required to meet the peak load may be the deciding factor for selecting the design flow, provided
that this flow is available.
For the various sites the choice of design flow was optimised to give the maximum amount of energy
over a given year in kWh. It was assumed that the cost of production for the incremental amount of
power output was less than the purchase price of that energy. Therefore the turbines are sized to
maximise the energy output.
3.4 Turbine selection and Sizing
The purpose of a hydraulic turbine is to transform the water’s potential energy to mechanical
rotational energy. It is necessary to emphasize that no advice is comparable to that provided by the

CCT Mini Hydro Power Prefeasibility Report
Page 16
manufacturer, and every developer should refer to manufacturer from the beginning of the
development project. It is however appropriate at this stage to provide a few criteria to guide the
choice of the right turbine for a particular application and even to provide appropriate formulae to
determine its main dimensions.
Note: Only Francis, Kaplan, and Pelton Wheel turbines were considered in the Prefeasibility Design.
There were a number of sites where a Turgo turbine would also be suitable but these turbines are
no longer prevalent in the industry and Pelton’s have similar characteristics and higher efficiency.
3.5 Turbine Efficiency
The type of turbine is selected based on its suitability to the available head and flow conditions. The
calculated turbine efficiency curves take into account a number of factors including rated head
(static head less maximum hydraulic and penstock losses), runner diameter (calculated), turbine
specific speed (calculated for reaction turbines) and the turbine manufacture/design coefficient.
Turbine efficiency was calculated using the RETScreen approach. In this, the efficiency equations
were derived from a large number of manufacturer’s efficiency curves for different turbine types
and head and flow conditions.
3.6 Losses
Maximum Hydraulic Losses In a small hydro system, energy is lost as water flows through the water
passages. A value of 5% has been selected for the scenarios identified. Hydraulic losses are adjusted
over the range of available flows based on the method.
Maximum tailwater effect At most sites, during high flows, the tailwater level rises more than the
level upstream of the intake and causes a reduction in the gross head. Consequently, during these
periods, less power and energy are available.
The maximum tailwater head loss for the plants has been taken as 1m the tailwater effect can be
significant, especially for low-head sites. This value is only applied to river flows that are greater than
the plant design flow.
Other Losses Other losses assumed were generator losses (3%), transformer losses (3%) and
parasitic losses (2%).
3.7 Energy Delivered
This represents the total amount of electricity produced at a certain flow rate. Actual energy
delivered from the small hydro plant at any given flow value Q is calculated for every historical daily
flowrate and summed over a year to give the total energy production over the historical period
(Flow data from CCT is available from 1997-2011). Most of the plants have a varying head for the
range of different flows due to friction losses in pipes and varying head conditions from dams. This
variance in head was not considered in the calculations and should be done in the feasibility study.
3.8 Capacity factor
The annual capacity factor of the small hydro power plant is a measure of the available flow at the
site and how efficiently it is used. It is defined as the average output of the plant compared to its
rated capacity.

CCT Mini Hydro Power Prefeasibility Report
Page 17
4 Financial Modelling
4.1 Methodology
In order to evaluate the financial feasibility of the separate schemes a full financial model has been
produced. This model evaluates Before Tax Cash Flows for each individual site as well as Discounted
Cash Flows which result in investment results such as NPVs as well as IRRs for the sites. This section
describes the assumptions used in the financial modelling.
4.1.1 Incremental Energy Costs
Where there are existing turbines at the Water Treatment Works analysed, a real cost of electricity
(R/KWh) as well as the incremental cost or marginal cost of electricity (R/kWh).
The real cost of electricity is calculated by dividing the full capital cost and lifetime costs for a site by
the total lifetime energy produced by the site.
The incremental cost of electricity produced is calculated by dividing the full capital cost and lifetime
costs for a site by the incremental lifetime energy produced by the site. That is the energy over and
above what is currently being produced to run the plant.
The cash flows and IRRs are based on the incremental costs of the plant and therefore are the ‘worst
case’ option which doesn’t truly represent the actual cost of electricity produced. This is a
conservative approach and the true cost of electricity will sit in between the real costs and the
incremental costs of energy.
4.2 Project Development Costs
The project development costs have been estimated based on current industry experience. This
pricing is indicative and will vary from firm to firm. A good project manager who is knowledgeable in
this area will be able to negotiate a reasonable proposal from the various firms.
It is important to note that the costs indicated here were selected conservatively and a 25%
contingency was added to the total costs. The total costs of R16.65M were equally divided over the
feasible sites in the investigation.

CCT Mini Hydro Power Prefeasibility Report
Page 18
Table 5: Project Feasibility Costs
Project Feasibility Costs Total
SB Lower Dam to
SBWTW 2 SBWTW to
760 SBWTW to
810, 840 BH Raw Water
BHWTW to Upper
BHUpper to Lower 1
Wemmershoek Faure 2
Technical Feasibility Design 1 300 000 170 000 170 000 200 000 200 000 120 000 120 000 200 000 120 000
Hydrology 400 000 50 000 50 000 50 000 50 000 50 000 50 000 50 000 50 000
Head Assessment 350 000 50 000 50 000 50 000 100 000 - - - 100 000
Bulk Water Integration 240 000 30 000 30 000 30 000 30 000 30 000 30 000 30 000 30 000
Geological assessment of site 90 000 30 000 15 000 15 000 10 000 10 000 - 10 000 -
0 0 0 0 0 0 0 0
Environmental - Assessment 150 000 Basic Assessment 210 000 70 000 70 000 70 000 - - - - -
Full EIA - - - - - - - - -
Water Use License - - - - - - - - -
Specialist Studies 180 000 60 000 60 000 60 000 - - - - -
CDM - Project Development and
Documentation 500 000 Registration 500 000 Legal - Project Documentation 2 500 000 Project Finance 3 000 000 Ancillary 1 000 000
-
Finance - Financial Modeling 400 000 Lender Due Diligence 2 500 000
Sub Total 13 320 000 Contingency 3 330 000 Total 16 650 000

CCT Mini Hydro Power Prefeasibility Report
Page 19
4.3 Capital Costs
The most significant cost component in this study is the capital cost incurred during the
implementation phase. The capital required for small hydro plant depends on a number of
determining factors including the effective head, flow rate, geological and geographical features, the
equipment (turbines, generators etc.), civil engineering works, and water flow variation throughout
the year. Making use of existing weirs, dams, storage reservoirs and ponds can significantly reduce
both environmental impact and costs. Sites with low heads and high flows require a greater capital
outlay as larger civil engineering works and turbine machinery will be needed to handle the larger
flow of water. Each site is unique, since about 75% of the development cost is determined by the
location and site conditions. Only about 25% of the cost is relatively fixed, being the cost of
manufacturing the electromechanical equipment.
For the costing of each of the sites analysed for CCT Hydro, the major works were separated into
major cost components. These being:
Civil- These costs mainly comprise of major civil works such as power house construction,
penstocks, earthworks, water conveyance infrastructure etc
Mechanical & Electrical – these costs include the turbine and generator costs and all
associated ancillaries
Electrical – these costs mainly comprise of the grid connection costs and grid infrastructure
needed to support the feed in of electricity.
The construction arrangement would generally comprise of three contracts for each of the above
with the balance of plant contract held with the civil contractor.
In order to estimate the costs for the individual systems for CCT, the major electrical and M&E costs
were estimated using the hydro costing model in RETScreen. The accuracy of this methodology is
assumed to be within 50% of the actual costs. Only through the feasibility design phase where a Bill
of Quantities is drawn up, will one be able to estimate more accurate values. Figure 17 below shows
how the accuracy of the estimate will increase over time.
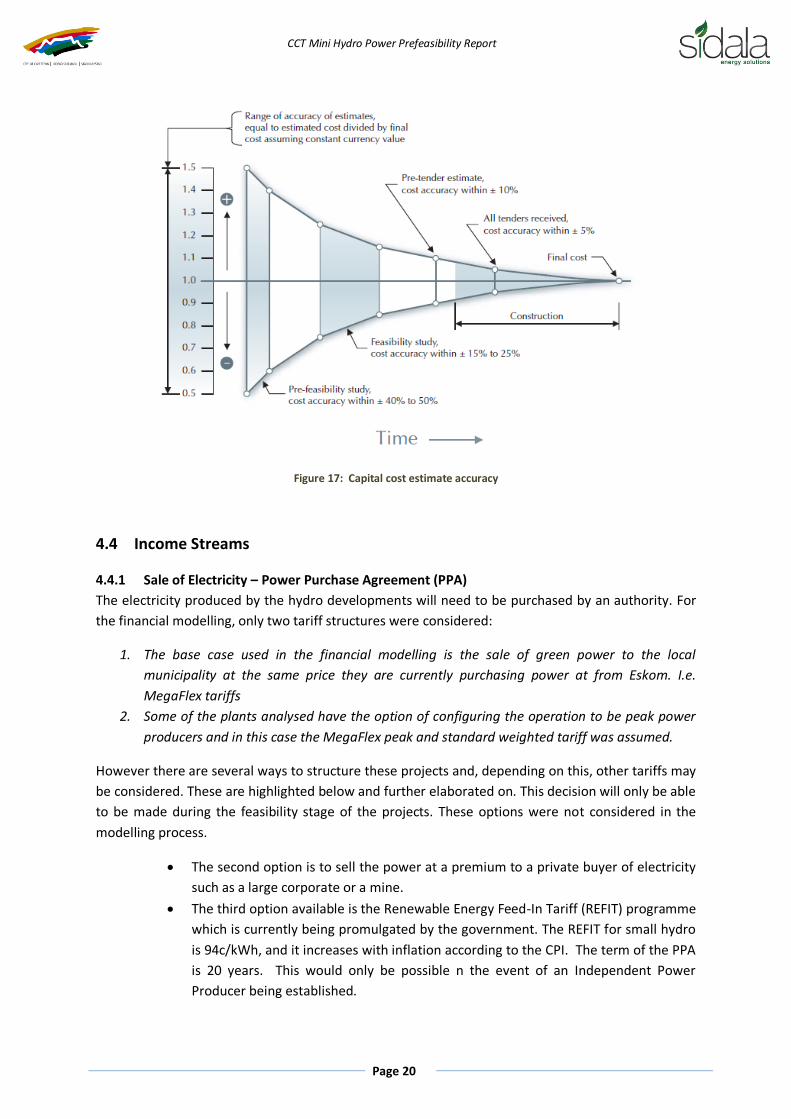
CCT Mini Hydro Power Prefeasibility Report
Page 20
Figure 17: Capital cost estimate accuracy
4.4 Income Streams
4.4.1 Sale of Electricity – Power Purchase Agreement (PPA)
The electricity produced by the hydro developments will need to be purchased by an authority. For
the financial modelling, only two tariff structures were considered:
1. The base case used in the financial modelling is the sale of green power to the local
municipality at the same price they are currently purchasing power at from Eskom. I.e.
MegaFlex tariffs
2. Some of the plants analysed have the option of configuring the operation to be peak power
producers and in this case the MegaFlex peak and standard weighted tariff was assumed.
However there are several ways to structure these projects and, depending on this, other tariffs may
be considered. These are highlighted below and further elaborated on. This decision will only be able
to be made during the feasibility stage of the projects. These options were not considered in the
modelling process.
The second option is to sell the power at a premium to a private buyer of electricity
such as a large corporate or a mine.
The third option available is the Renewable Energy Feed-In Tariff (REFIT) programme
which is currently being promulgated by the government. The REFIT for small hydro
is 94c/kWh, and it increases with inflation according to the CPI. The term of the PPA
is 20 years. This would only be possible n the event of an Independent Power
Producer being established.

CCT Mini Hydro Power Prefeasibility Report
Page 21
4.4.1.1 Eskom MegaFlex
It is assumed that the power plants will be able to sell the power to the City’s Electricity Services
Department (ESD) at the same rate (or at a higher negotiated rate) that ESD is purchasing power at
from Eskom. It is assumed that the city is purchasing power at the Megaflex Tariff.
A power tariff forecast has been compiled that takes into account the average Eskom tariff increase
based on NERSA current approvals as well as a predicted 10% real increase for 5 years and then a 2%
increase after that. This is illustrated in Table 6. This forecast is shown in comparison to the REFIT
tariff for small hydro power in Figure 19.
4.4.1.2 Eskom MegaFlex Peak weighted
The MegaFlex tariff is structured as a time of use which is the same way ESD bills its large industrial
users. Figure 18 shows these times where the red represents peak times, the yellow standard times
and the green off-peak times. There are also seasonal energy rates for winter (June – August) and
summer (September – May).
Figure 18: Time of Use structure
4.4.1.3 ESD
A CCT normal and peak weighted tariff has been included in the comparison for illustrative purposes
but has not been used in the analysis.
4.4.1.4 Renewable Energy Feed-In Tariff (REFIT)
In 2009 the National Energy Regulator of South Africa (NERSA) announced a 20-year Feed-In Tariff
for various renewable energy technologies. The Power Purchase Agreements (PPA) that will be
signed under the REFIT programme will be issued by the newly established Independent System
Market Operator (ISMO) which now stands outside of Eskom. These PPA’s will be 20 year PPA’s that
will be backed by National Treasury. The tariff has been set at ZAR 0.94/kWh for small hydro plants.
For small hydro, the minimum project size qualifying for the REFIT is 1MW and maximum 10MW.
REFIT has not been considered in the analysis.
4.4.1.5 Summary of Tariffs
Table 6 shows the assumptions used in the tariff forecast and Table 7 are the results. Figure 19
below shows these results tabulated. It will be up to the established IPP to negotiate a PPA
agreement with the relevant authority.
Table 6: Power Price assumptions
SA Power Price Forecast Megaflex
10% real for 5 years then 2% real
2009/10 price 30.74 c/kWh

CCT Mini Hydro Power Prefeasibility Report
Page 22
Nersa approved average prices
2010/11 41.57 c/kWh
2011/12 52.3 c/kWh
2012/13 65.85 c/kWh
Inflation 5%
Table 7: Price Forecast
Year Megaflex
Average Increase REFIT
MegaFlex
peak
weighted
average
CCT Peak
weighted
average
CCT
weighted
average
2009/10 30.7
101.7
67.4 51.7
2010/11 41.6 35% 111.6 55.4 67.4 51.7
2011/12 52.3 26% 118.4 69.7 84.8 65.1
2012/13 65.9 26% 125.6 87.8 106.7 82.0
2013/14 75.7 15% 133.3 100.9 122.7 94.3
2014/15 87.1 15% 141.4 116.1 141.2 108.4
2015/16 100.1 15% 150.0 133.5 162.3 124.6
2016/17 115.2 15% 159.2 153.5 186.7 143.3
2017/18 132.4 15% 168.9 176.5 214.7 164.8
2018/19 141.7 7% 179.2 188.9 229.7 176.4
2019/20 151.6 7% 190.1 202.1 245.8 188.7
2020/21 162.3 7% 201.7 216.3 263.0 201.9
2021/22 173.6 7% 214.0 231.4 281.4 216.1
2022/23 185.8 7% 227.1 247.6 301.1 231.2
2023/24 198.8 7% 240.9 264.9 322.2 247.4
2024/25 212.7 7% 255.6 283.5 344.7 264.7
2025/26 227.6 7% 271.2 303.3 368.8 283.2
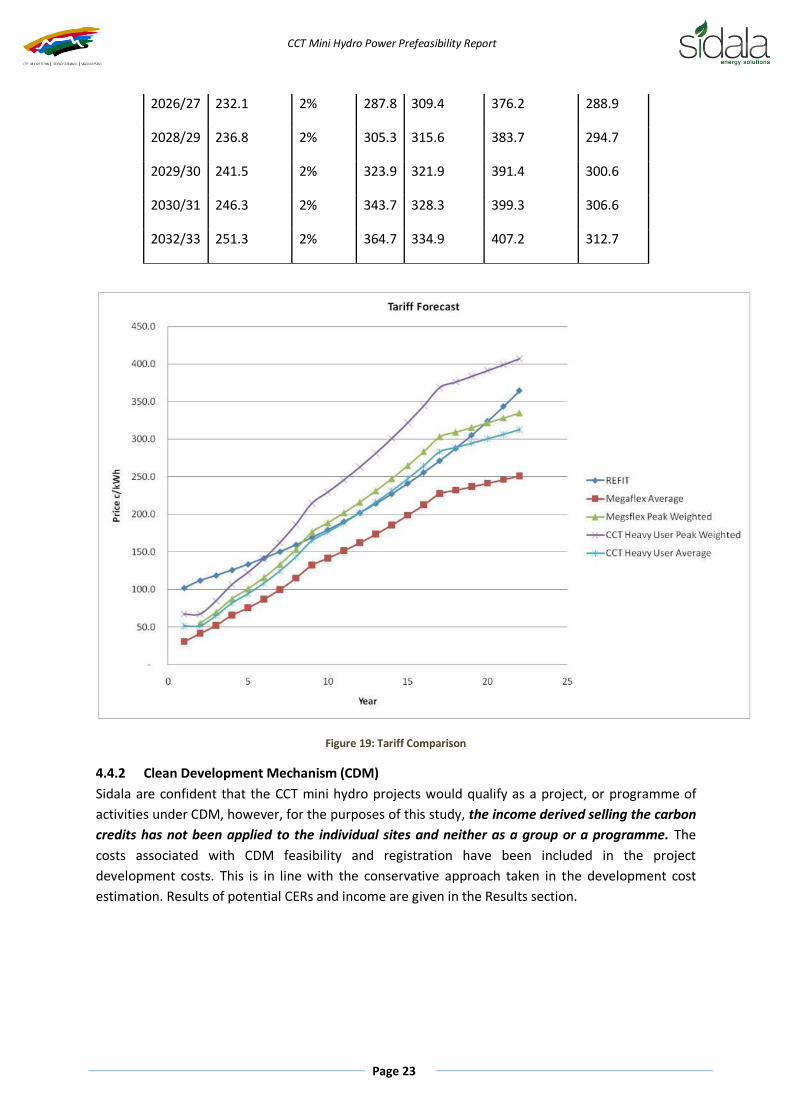
CCT Mini Hydro Power Prefeasibility Report
Page 23
2026/27 232.1 2% 287.8 309.4 376.2 288.9
2028/29 236.8 2% 305.3 315.6 383.7 294.7
2029/30 241.5 2% 323.9 321.9 391.4 300.6
2030/31 246.3 2% 343.7 328.3 399.3 306.6
2032/33 251.3 2% 364.7 334.9 407.2 312.7
Figure 19: Tariff Comparison
4.4.2 Clean Development Mechanism (CDM)
Sidala are confident that the CCT mini hydro projects would qualify as a project, or programme of
activities under CDM, however, for the purposes of this study, the income derived selling the carbon
credits has not been applied to the individual sites and neither as a group or a programme. The
costs associated with CDM feasibility and registration have been included in the project
development costs. This is in line with the conservative approach taken in the development cost
estimation. Results of potential CERs and income are given in the Results section.

CCT Mini Hydro Power Prefeasibility Report
Page 24
4.5 Operation and Maintenance (O&M) Costs
The O&M costs of the existing turbines at the plants are difficult to ring fence out of the normal
operation of the treatment works and if therefore difficult to obtain historic O&M costs. This
exercise would encompass a considerable accounting investigation and is beyond the scope of work
for this report.
For the purposes of analysis a fixed O&M cost/kW installed is used and aims to encompass the
following hydro operation costs, outlined in Table 8. This fixed cost is assumed to be
R500/kW/annum. Considerable cost savings will be found at sites where more than one hydro plant
is planned.
Table 8: O&M costs
Direct Expenses
Power plant
Operational hours
Staff Expenses
Salaries & Wages
Operational Expenses
Water price
Operation and Maintenance
Professional services
Insurance
Rental
Environmental
Wheeling and Grid Costs
Overheads
Admin & General
Staff Expenses
Salaries & Wages
Other staff
Operational Expenses
Auditors Remuneration + Audit Fees
Computer Charges
Legal Fees
Rates and Taxes
Water & electricity Repairs and Maintenance - Building Telephone + Cellular+internet
Training
Travelling
Marketing
Information Technology
Operational Expenses
Outside contract
Webhosting

CCT Mini Hydro Power Prefeasibility Report
Page 25
Telephone
Maintenance
Operational Expenses
Consumables
Licence & Registration
Outside contracts
Repairs & Maintenance - Refurbishments
Surveillance & Security
Major Maintenance
Machinery and Equipment
4.6 Project Finance
The financial modelling of the CCT Hydro projects was done with the assumption that the projects
will be Project Financed. Financing can be a major challenge to IPPs where the owner does not have
sufficient funds for balance sheet or Corporate Financing nor sufficient assets to provide security for
a bank loan. In addition, the developer may not wish to bear all the project risk involved in the
development. In this situation, the owner can try to finance the project by securing loans against
the anticipated cash flow of the project, requiring a series of complex contractual arrangements that
are expensive to set up. This is referred to as limited recourse financing. The principal difference
between balance sheet financing and limited-recourse financing is the way in which the bank loans
are secured. In limited-recourse project financing the future cash flows from the project are the
lenders’ main security.
As the lenders cannot rely on the liquidation value of the project as a means of securing repayment,
they will “take security”. This involves exercising tight control over most aspects of the project
development and may be subject to the following:
Charge over the physical assets
Assignment of the project contracts
Contract undertakings
Shareholder undertakings
Insurance
Bonding
All aspects of the project will be arranged to control the risk for the lenders, who will insist on seeing
evidence of the project’s economic viability and mitigation of all risks. They will require an
independent technical report by a credible consultant and will scrutinize important agreements such
as the power purchase agreement, the operating agreement, shareholders’ agreement, etc.
The lenders will wish contractors, suppliers and operators that have a strong record of
accomplishment in their field, and wherever possible the risk is transferred to third parties. A
contractor working on a turnkey fixed-price basis can be used to minimize the implementation risk.
A long-term Power Purchase Agreement with a secure off-taker mitigates the market risk. The

CCT Mini Hydro Power Prefeasibility Report
Page 26
lenders may also reserve the right to step in and operate the project in the case that it is not paying
its debt.
4.7 Other Financial Assumptions (Inputs)
The following key assumptions were made in the modelling process, the actual values can be found
in Table 9:
Project Development Costs: These are the costs associated with getting the project to financial
closure. This requires work on resource measurement, grid connection studies, EPC structuring,
plant design, licensing and permitting and fund-raising.
Capex contingency: This has been included to reflect any unforeseen capital expenditure required
for a project of this nature.
Project Lifespan: The generally accepted investment lifespan for a renewable energy project of this
nature is 20 years.
Debt Equity Ratio, Interest Rate, Length of Debt Financing and number of instalments: If funded by
the private sector, the current accepted debt to equity ratio for a project of this nature is 70% Debt
and 30% equity. Our research has indicated that this portion of debt would be serviced with an
interest rate of 12%. As these projects are very capex intensive, the levels of this ratio and rate of
interest are crucial to viability of these projects. Furthermore the length of debt financing and the
number of instalments per annum contribute to this viability.
Discount Rate: This is the rate used to discount future cashflows in the business model back to the
start of the project. It is proxy for the weighted average cost of capital (WACC).
Inflation: Inflation has a direct impact on the REFIT tariff, the operating and maintenance costs of
the plant and an indirect effect on the prevailing interest rates of debt. Inflation is taken from
StatSA’s calculation of the Consumer Price Index (CPI).
Depreciation: Although a non-cash flow item, depreciation affects the accounting profitability of the
project and hence the amount of tax paid to SARS. This tax amount is a cashflow item and hence
affects the NPV and IRR of the projects.

CCT Mini Hydro Power Prefeasibility Report
Page 27
Table 9: Financial Assumptions
Renewable Energy Technology Small Hydro Run of River
Project Development Costs ZAR R 2 081 644
PPA R/kWh R 0.3
Operation & Maintenance Cost ZAR installed Watt p.a. R 0.50
CapEx Contingency % 25%
Exchange Rate ZAR/$ $ 6.70
Exchange Rate ZAR/€ € 9.70
Plant Lifespan (years) years 20
Interest Rate % 12.0%
Length of Debt Financing number of years 10
Number of Instalments per annum 1
RSA - CPI % 6.0%
WACC - Discount Rate % 12%
Debt Equity Ratio % 70%
Corporate Tax Rate % 28%
Plant Depreciation number of years 7

CCT Mini Hydro Power Prefeasibility Report
Page 28
5 Steenbras Water Treatment Works (SWTW) Steenbras WTW (Figure 20) treats a maximum of 150 Ml/day receiving water from the Lower
Steenbras Dam. There are a number of sites that have been identified at the works and are further
described.
1. Steenbras Water Treatment Plant to the Break pressure tanks 840 and 810 (SBWTW to 810,
840)
2. Steenbras Lower Dam to Steenbras Water Treatment Works (SB Lower to SBWTW)
3. Steenbras Water Treatment Plant to the Break pressure tank 760 (SBWTW to 760)
Also described in this section, although it does not form part of the treatment works, it is very close
in vicinity. That is
4. Rockview Dam to Steenbras Upper Dam
Figure 20: View of Lower Steenbras and the SWTW

CCT Mini Hydro Power Prefeasibility Report
Page 29
5.1 Steenbras Water Treatment Plant to the Break pressure tanks 840 and 810
(SBWTW to 810, 840)
5.1.1 Description
The clearest potential for power generation where there is no existing turbine is at the Break
pressure tanks 810 and 840 after clean water has left the water treatment works. Hence, this site
potential is described first.
Once the water leaves the Steenbras WTW it flows into a small clearwell reservoir where it is then
distributed into two separate pipelines. One of those pipelines is a 610mm pipe that takes water and
splits it into two break pressure tanks 810 and 840, further down the mountain. Figure 21 shows
these two tanks.
Figure 21: Break Pressure tanks 810 & 840
5.1.2 Data Used
5.1.2.1 Levels
Two main data sources were used in calculating levels. The second column in Table 10 describes the
data given in the Terms of Reference (TOR) whist the third column is the data taken from the
drawing W3-013-103 of treatment works provided by head office.

CCT Mini Hydro Power Prefeasibility Report
Page 30
Table 10: Levels at 810 & 840 [m]
Level TOR Drawing Calculated
Clearwell 282.03-276 280
810 TWL
208.46
840 TWL 206.45 207.26
5.1.2.2 Flowrates
The flow regime experienced here is very similar to the raw water coming into the plant and can be
seen in the flow duration curve (Figure 22). A summary of the flows show that the average flow is
slightly less than the raw water flow. It was noted in the terms of reference that the plant
production could change to 180Ml/day in the future. This has not been planned for here and the
details of this should be clarified in the feasibility study.
Table 11: Flow Rates SBWTW to 810, 840
Min Flow m3/s 0.52 0.52
Min Flow Ml/day 45 45
Max Flow m3/s 1.74 1.74
Max Flow Ml/day 150 150
Average Flow m3/s 1.05 1.02
Average Flow Ml/day 90 87.71

CCT Mini Hydro Power Prefeasibility Report
Page 31
Figure 22: Flow Duration curve Steenbras
5.1.3 Design concept
This design will take all the flows leaving the Clearwell reservoir (average level 280m) through the
existing 610mm pipe onto a single pelton wheel turbine at the level of the existing 840 break
pressure tank (206.45m MSL). Flows of up to 150Ml/day would be realised here.
This design would utilise all the pressure that the tanks are designed to remove from the system.
Minimal civil works here would include the construction of a power house for the wheel at either of
the break pressure tanks. The existing 810mm and 840mm pipes that deliver clean water to Cape
Town would be connected to outlet works of the pelton wheel.
A similar situation here exists as with the raw water inlet to the WTW. The pipes leading to the
break-pressure tanks were most likely not optimised for electricity production and large penstock
losses would most likely be found. For conceptual design purposes, a 10% penstock loss is assumed
and it is also assumed that a new penstock will need to be installed.
It is further noted that there remains the option of installing an “in-line” type reaction turbine in a
sealed system where the water leaving the turbine remains pressured. An example of this would be
a Francis turbine. This should be considered because there is a significant drop in static head from
the break-pressure tanks to the bottom of the mountain. However, it is suggested that no further
head would be gained because it was discovered that, through consultation with operators of the
plant, the remaining head is needed to ensure delivery at the Newlands reservoir. The pressure is
not further broken and at times the water is even re-pressurised using booster pumps.

CCT Mini Hydro Power Prefeasibility Report
Page 32
5.1.4 Design Results
The actual energy delivered of 4.2 GWh is the average yearly output of the new plant operating at a
design capacity of 784 kW. This output was determined using the historical flow rate data since 1997
and can be seen in Table 13. The historical capacity factor is also shown.
Table 12: Design inputs and assumptions
Static Head m 74
Penstock losses % 10%
Rated Head m 66
Design Flow m3/s 1.50
Design Flow Ml/day 130
Turbine type
Pelton
Runner Diameter m 0.58
Turbine Design Efficiency % 87%
Turbine Capacity kW 784
Annual Plant Downtime Losses % 5%
Theoretical Energy Delivered kWh 6 521 722
Actual Energy Delivered kWh 4 266 995
Capacity Factor % 65%
Table 13: Design Results SBWTW to 810, 840
Design Results
Plant Design Capacity kW 784
Annual downtime losses % 5%
Theoretical Energy Delivered kWh 6 521 722
Edelivered 1998 kWh 4 616 640
Edelivered 2000 kWh 4 617 008
Edelivered 2002 kWh 4 106 253
Edelivered 2004 kWh 4 249 142
Edelivered 2006 kWh 4 233 032
Edelivered 2008 kWh 3 791 301
Edelivered 2010 kWh 4 255 592
Average kWh 4 266 995
Capacity Factor Theoretical % 100%
Capacity Factor 1998 % 71%
Capacity Factor 2000 % 71%
Capacity Factor 2002 % 63%
Capacity Factor 2004 % 65%
Capacity Factor 2006 % 65%
Capacity Factor 2008 % 58%
Capacity Factor 2010 % 65%
Average % 65%

CCT Mini Hydro Power Prefeasibility Report
Page 33
5.1.5 Grid Connection
Current Steenbras is not connected to any Municipal or Eskom grid and uses a diesel generator as its
only back-up. The assumption used here is that the line plant will need to be connected to the
closest Eskom Sub-station which is located in Gordon’s bay. A summary of the connection details is
given in Table 14. The line length was measured off Google Earth and a screen shot of the line is
shown in Figure 23.
There may be a closer Municipal Substation or a loop-in grid connect option into a municipal line but
this would need to be further investigated in the Feasibility study. A 22kV line is assumed for
financial modelling purposes but this can only be determined after a full investigation.
Table 14: Steenbras Grid Connection
Steenbras
Generation Capacity 1.4-1.8MW
Feed-in Voltage 22kV
Current back up supply Diesel Generator
Eskom Substation Connection
Closest Eskom Substation Gordon’s Bay Substation
Coordinates 18.87980209580 E
34.15303044270 S
Substation Voltage 66 kV
Distance to Substation (length of line) 4468 m (Figure 23)

CCT Mini Hydro Power Prefeasibility Report
Page 34
Figure 23: Steenbras Grid Connect Eskom Sub-station
5.1.6 Works
The estimation of the infrastructure costs are given in Table 15. These prices are only indicative and
have been estimated using the RETScreen methodology.
Table 15: SBWTW to 810, 840 works
SBWTW to 810, 840 Item Specific Costs Item Cost
Civils R 4 660 000
Power House and Balance of Plant
R 3 500 000
New Penstock designed for max power generation
R 560 000
Access Road/upgrade rail access
R 500 000
Other Civils
R 100 000
Hydro Mechanical Electrical R 7 000 000
M&E – Turbine full turnkey installation. Work here is typical Water-to Wire. (Design Concept for a Single 784 kW Pelton) 784 R 8 932 R 7 000 000
Electricals and Grid Connection R 1 269 000
Transmission line 22kV 5 R 230 000 R 1 150 000
Substation/Other Electricals
R 119 000
Total R 12 929 000

CCT Mini Hydro Power Prefeasibility Report
Page 35
A new penstock is assumed to be installed here delivering only 10% losses. The existing pipe needs
to be assessed to see if it is adequate. This work would merely include a short penstock from the
existing 525 valve and could lead to potential savings.
Bypass systems need to be considered for safe shut down and to ensure continuous water supply to
Cape Town.
5.1.7 Financial Modelling results
The financial modelling of this site assumes that the energy produced will be fed into the grid and
sold to the municipality. Therefore all energy produced is considered here, sold at the MegaFlex
average Tariff. Table 16 shows the total estimated costs for this site. Table 17 shows the key financial
outputs.
Table 16: Total Project Costs SBWTW to 810, 840
SBWTW to 810, 840
Project Development Costs ZAR 2 081 250
Installation Cost ZAR/kW 18 147.76
ZAR 14 221 900
Contingency % 25%
ZAR 3 555 475
Total Capital Cost ZAR 19 858 625
Funding Funding Horizon years 10
Interest Rate % 12.00%
Debt:Equity Ratio % 70%
Debt amount ZAR 13 901 038
Equity amount ZAR 5 957 588
Total Capex
19 858 625
Number of debt instalments per annum
1
Total Number of instalments
10
Total Interest Paid ZAR 10 701 598
Total Operation and Maintenance Costs ZAR 11 023 288
Total Lifetime Costs ZAR 41 583 510
Incremental Energy Production kWh 85 339 909
Actual Energy Production kWh 85 339 909
Incremental Levelised Electricity Cost 0.9 0.49
Real Levelised Electricity Cost 0.8 0.49

CCT Mini Hydro Power Prefeasibility Report
Page 36
Figure 24: Cash Flow and NPV for SBWTW to 810, 840
Table 17: Financial Modelling results SBWTW to 810, 840
Key Outputs SBWTW to 810, 840
Capex Required 19 858 625
Equity Required at Fin Close 5 957 588
PPA Revenue 149 117 267
Operating Costs 12 956 439
EBITDA 136 160 828
Net Cashflow 105 600 606
NPV 11 471 378
Equity IRR 29%
Incremental Levelised Cost of Energy (ZAR/kWh) R 0.49
Real Levelised Cost of Energy (ZAR/kWh) R 0.49
5.1.8 Conclusions and Recommendations
Access for this site is a problem with a very steep slope and no access road. Access is by foot path
only. There is a rail access with max capacity assumed at 5 tonnes. This rail would need to be
upgraded or a new road installed from the bottom of the mountain. The environmental aspects of
this installation would also need to be considered in the Environmental report.
The feasibility design should also include the following investigation:
Whether the existing pipeline is feasible as a penstock for the new system or
whether this should be replaced
Further studies on how to bypass and break pressure in case of plant shut down
Investigation as to whether a Francis turbine based on the pressure requirements of
the distribution system
Do proper flow measuring to find out the daily cycle values and how the cycling
would affect the turbine design and the power output.

CCT Mini Hydro Power Prefeasibility Report
Page 37
5.2 Steenbras Lower Dam to Steenbras Water Treatment Works (SB Lower to
SBWTW)
5.2.1 Description (SB Lower Dam to SBWTW C)
The Lower Steenbras Dam supplies the Water Treatment Works (WTW) through an 810mm steel
pipe transferring a maximum of 150Ml/day. Before the water enters the works it enters the New
Screening chamber where the water is split and 115 Ml/day is fed to two existing Turgo turbines of
capacity 179 kW. Only one turbine functions at a time taking a flow of 57.5 Ml/day and the rest is
bypassed. The remaining 35 Ml/day is bypassed through the old screening chamber where it then
enters the works. Figure 25 show views of Lower Steenbras and the WTW.
Figure 25: View of Lower Steenbras and the WTW
5.2.2 Data used
5.2.2.1 Levels
The following levels were considered in the design. Again the drawing levels were taken from
drawing W3-013-103.
The turbine data sheet (Appendix A Turbine Spec Sheets) shows that the existing turbine rated head
is 34.4m which is the net head after losses between the New Service Reservoir and the Turbine. This

CCT Mini Hydro Power Prefeasibility Report
Page 38
leads to the calculated value of 291.06m as the level of the turbine (note that this calculation does
not take into account losses and is therefore only and indicative value of the turbine level).
Table 18: Steenbras Lower Dam to WTW
TOR Drawing Turbine Data Sheet Calculated
Steenbras Lower FSL 345.8 345.8 - -
Steenbras Lower Limit 330 - - -
New screening chamber 325.46 325.46 - -
Old screening chamber 298.56 298.56 - -
turbine house 295.5 - - 291.06
Water Treatment Plant - 282.06 - -
clearwell 282.03-276 - - -
Rated Turbine Head (existing) - - 34.4 -
5.2.2.2 Flow Rates
The flow rate data was taken from the data provided by Bulk Water Head office and dates back to
1997. The flow data seems quite accurate with few discrepancies. A summary of the flowrates out of
the dam are shown in Table 19 and correlate with the plant conditions given in the TOR. A flow
duration curve has been compiled for all the flows at Steenbras and is shown in Figure 22.
Table 19: Flow rate data for SB Lower Dam to SBWTW C
Min Flow m3/s 0.52
Min Flow Ml/day 45
Max Flow m3/s 1.74
Max Flow Ml/day 150
Average Flow m3/s 1.05
Average Flow Ml/day 90
5.2.3 Current Turbine Operation
The base case used here is the existing installed turbines that are generating for own use on the
plant. They are two 21” Turgo Impulse Turbines that are arranged in Tandem and have a design
capacity of 179 kW each. The current design of the existing turbines makes use of the head drop
from the new screening chamber to the turbine floor (34.4m net head, 0.66m3/s each). An image of
this turbine is shown in Figure 26.

CCT Mini Hydro Power Prefeasibility Report
Page 39
Figure 26: Steenbras Turgo Turbine
Because these two turbines are not synchronised properly and the technology is so old (1940’s), only
one plant is operated at a time with water flowing through the other turbine but not taking the load
and generating. Therefore at any one time, the maximum generation capacity of the plants is
179kW.
Without having details about the current plant electrical demand and electric usage, certain
assumptions have been made. It is assumed that the current plant consumes all electricity that is
generated by the existing turbine. This operational assumption has is shown in Table 20.
Table 20: Current Steenbras Turbine Operation Assumptions
Average Flow 94 Ml/day
Turbine Power Output 179 kW
Turbine Efficiency 80%
Capacity Factor 63%
Theoretical Energy Delivered Current (One turbine) 2 508 864 kWh
Energy Delivered Current 788 196 kWh
Therefore the assumed base power generation for the site is 0.78GWh/annum. If a new design is to
be incorporated it, only the incremental energy delivered will be considered in the financial
modelling, that is only the power generated above 0.78GWh.
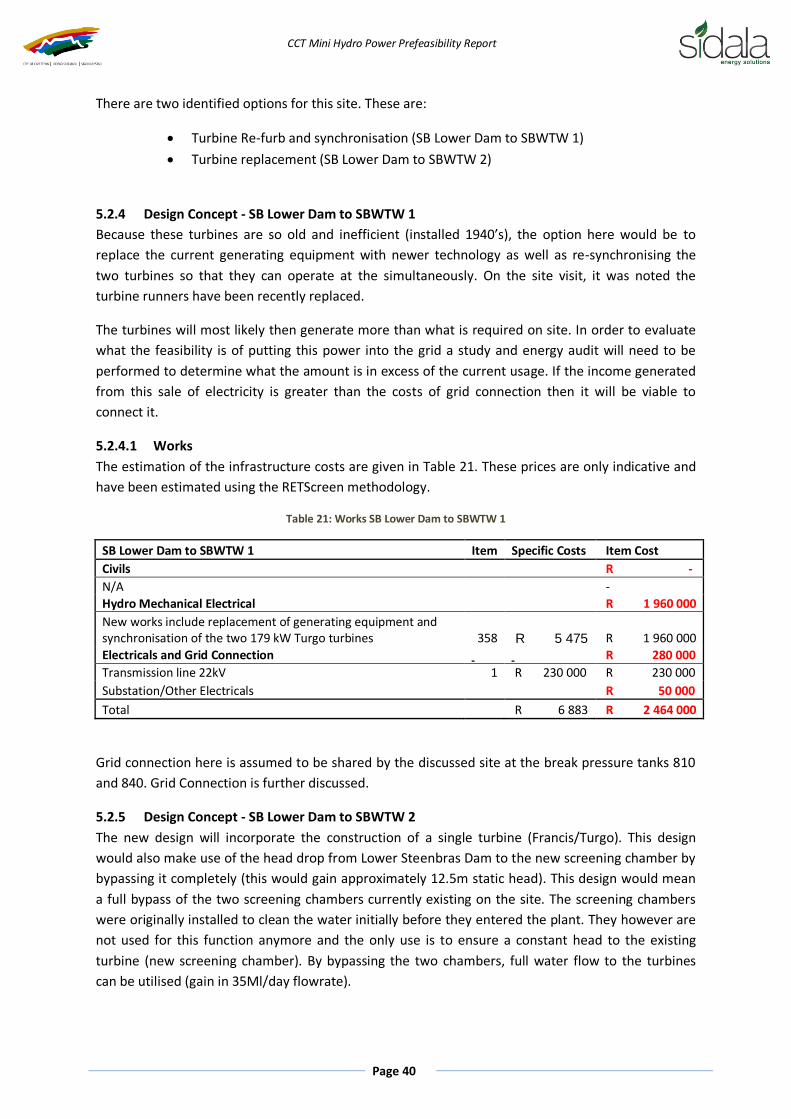
CCT Mini Hydro Power Prefeasibility Report
Page 40
There are two identified options for this site. These are:
Turbine Re-furb and synchronisation (SB Lower Dam to SBWTW 1)
Turbine replacement (SB Lower Dam to SBWTW 2)
5.2.4 Design Concept - SB Lower Dam to SBWTW 1
Because these turbines are so old and inefficient (installed 1940’s), the option here would be to
replace the current generating equipment with newer technology as well as re-synchronising the
two turbines so that they can operate at the simultaneously. On the site visit, it was noted the
turbine runners have been recently replaced.
The turbines will most likely then generate more than what is required on site. In order to evaluate
what the feasibility is of putting this power into the grid a study and energy audit will need to be
performed to determine what the amount is in excess of the current usage. If the income generated
from this sale of electricity is greater than the costs of grid connection then it will be viable to
connect it.
5.2.4.1 Works
The estimation of the infrastructure costs are given in Table 21. These prices are only indicative and
have been estimated using the RETScreen methodology.
Table 21: Works SB Lower Dam to SBWTW 1
SB Lower Dam to SBWTW 1 Item Specific Costs Item Cost
Civils R -
N/A
-
Hydro Mechanical Electrical R 1 960 000
New works include replacement of generating equipment and synchronisation of the two 179 kW Turgo turbines 358 R 5 475 R 1 960 000
Electricals and Grid Connection R 280 000
Transmission line 22kV 1 R 230 000 R 230 000
Substation/Other Electricals R 50 000
Total R 6 883 R 2 464 000
Grid connection here is assumed to be shared by the discussed site at the break pressure tanks 810
and 840. Grid Connection is further discussed.
5.2.5 Design Concept - SB Lower Dam to SBWTW 2
The new design will incorporate the construction of a single turbine (Francis/Turgo). This design
would also make use of the head drop from Lower Steenbras Dam to the new screening chamber by
bypassing it completely (this would gain approximately 12.5m static head). This design would mean
a full bypass of the two screening chambers currently existing on the site. The screening chambers
were originally installed to clean the water initially before they entered the plant. They however are
not used for this function anymore and the only use is to ensure a constant head to the existing
turbine (new screening chamber). By bypassing the two chambers, full water flow to the turbines
can be utilised (gain in 35Ml/day flowrate).

CCT Mini Hydro Power Prefeasibility Report
Page 41
Lower Steenbras Dam is usually full because it is controlled by the inlet from the Upper Steenbras
Dam. Therefore, for the design calculations, the static head of the plant is taken at FSL less the
existing turbine level. The existing 810mm steel pipe is was not optimised for electricity production
when it was originally built and it is therefore highly recommended that further investigation of the
penstock is undertaken. This would involve pressure testing at the new screening chamber and at
the existing turbine inlet.
In order to estimate the size of the turbine required it has been assumed that maximum penstock
losses are estimated at 10%. It is also assumed that a new penstock will need to be installed at the
site. For this initial design has been done for a Francis turbine but because the water entering the
Water Treatment works only needs to be at atmospheric pressure, an impulse turbine such as a
Turgo could also be used.
According to the evaluation of the flow rates experienced by the plant, the chosen design flow rate
for this design is 1.6m3/s (138Ml/day). Choosing the design flow-rate higher than this would result in
a drop in efficiency a resulting drop in energy production over the range of raw water flowrates.
5.2.5.1 Works
The estimation of the infrastructure costs and their description is given bellow in Table 22.
Table 22: Works SB Lower Dam to SBWTW 2
SB Lower Dam to SBWTW 2 Item Specific Costs Item Cost
Civils R 900 000
Install 810mm pipe connecting the existing steel pipe (entering the New screening chamber) to the new turbine at the turbine house floor (length?). This penstock pipe bypasses all screening chambers and connect directly to the turbine inlet
R 350 000
Power House (non required)
R -
Balance of Plant
R 350 000
Other Civils
R 200 000
Hydro Mechanical Electrical R 4 900 000
M&E – Turbine full turnkey installation. Works here is typical Water-to Wire. (Design Concept for a Single 605 kW Francis but also investigate a Turgo) 605 R 8 098 R 4 900 000
Electricals and Grid Connection R 321 000
Transmission line 22kV 1 R 230 000 R 230 000
Substation/Other Electricals
R 91 000
Total R 6 121 000
By using the existing power house, civil costs are reduced. The turbine costs have been estimated for
a Francis turbine but a Turgo should also be investigated however indicative costs show this option
to be +-R1.5mil more expensive.
The replacement of the existing pipeline from the LSD was also investigated but these costs have
come out +- R5mil for a 900mm pipe at 700m (excavation costs ignored) and therefore may be too
costly.

CCT Mini Hydro Power Prefeasibility Report
Page 42
5.2.6 Design Results
The rated head for the refurbishment option (Lower Dam to SBWTW 1) was taken as 34.4m. Because
of the dam level fluctuation a variable head should be taken into account when doing the energy
calculations for the replacement option (Lower Dam to SBWTW 2). The gross static head for this
design was taken as the dam preferred SL less the New Screening chamber level add the existing
rated head 34.4m (=345.8-325.46+34.4=54.74m). Penstock losses were estimated at 15% resulting in
a rated turbine head of 48.m. This with the design flow resulted in a turbine capacity of 649 kW.
When calculating the energy output during for the period 1997-2011 an average dam level of 342 m
was used resulting in a net head of 43.3m. This head is viewed as a conservative estimate because
the dam is most often full.
The resulting energy output for all three cases is shown below in Table 23. By synchronising and
refurbishing the generator equipment it would be possible to double the electric output of the plant
and by re-sizing and replacing the turbine, a further 1.7 GWh can be generated. It is this value that
was used to determine the financial viability.
Table 23: SB Lower Dam to SBWTW Design Summary
SB Lower Dam to SBWTW C
SB Lower Dam to SBWTW 1
SB Lower Dam to SBWTW 2
Static Head m * * 55
Hydraulic losses % * * 15%
Rated Head m 34 34 48
Design Flow m3/s 0.66 1.32 1.60
Design Flow Ml/day 58 115 138
Turbine type
2 xTurgo Turgo Francis
Runner Diameter m 0.53 1.07 0.57
Turbine Design Efficiency % * * 87%
Turbine Capacity kW 179
358
605
Annual Plant Downtime Losses % * *
Theoretical Energy Delivered kWh
2 508 864
2 508 864
5 035 791
Actual Energy Delivered kWh 788 196
1 576 392
2 539 701
Capacity Factor % 31% 63% 50%
Actual Increase from Current Generation kWh -
788 195.81
1 751 506
% Increase % - 100% 222%

CCT Mini Hydro Power Prefeasibility Report
Page 43
Table 24: Design Results SB Lower Dam to SBWTW 2
Design Results
Raw Water
Plant Design Capacity kW 605
Annual downtime losses % 5%
Theoretical Energy Delivered kWh 5 035 791
Edelivered 1998 kWh 2 656 366.51
Edelivered 2000 kWh 2 657 206
Edelivered 2002 kWh 2 469 176
Edelivered 2004 kWh 2 553 944
Edelivered 2006 kWh 2 552 815
Edelivered 2008 kWh 2 184 815
Edelivered 2010 kWh 2 703 587
Average kWh 2 539 701
Capacity Factor Theoretical % 100%
Capacity Factor 1998 % 53%
Capacity Factor 2000 % 53%
Capacity Factor 2002 % 49%
Capacity Factor 2004 % 51%
Capacity Factor 2006 % 51%
Capacity Factor 2008 % 43%
Capacity Factor 2010 % 54%
Average % 50%
5.2.7 Grid Connection
The grid connection assumption made here is that the plant will feed excess electricity into the grid
via the transformer and grid connection at the Break pressure tank 810 and 840. It is assumed that
the distance is 1km and costs for a 22kV line were used, which is a conservative cost.
5.2.8 Financial Modelling and Results
The required electricity needed to run the treatment works is assumed to be 788 196 kWh which
was estimated from the current plant operating conditions. This would need to be confirmed with a
full energy audit of the site. The modelling here is based on the incremental energy value over and
above this.
Based on this assumption, the amount of kWh used in the financial analysis is the total energy
output less the required energy on site. The newly established plant would have to ensure sufficient
electricity available to continue operation of the works. The financial viability of SB LD to SBWTW 1
& 2 is compared using the financial analysis procedure described in Section 4.
Table 25 shows a summary of the inputs used in the financial modelling of the plant for the two
scenarios. To test the financial viability of the plant the energy used analysed is the incremental
energy produced of each option compared to the current production. This financial modelling did
not take into account the current diesel generator costs, merely the current turbine production
compared to the new scenarios.

CCT Mini Hydro Power Prefeasibility Report
Page 44
Table 25: SB LD to SBWTW Financial Summary
SB Lower Dam to SBWTW 1
SB Lower Dam to SBWTW 2
Project Development Costs ZAR 2 081 250 2 081 250
Installation Cost ZAR/kW 6 882.68 18 807.54
ZAR 2 464 000 6 733 100
Contingency % 25% 25%
ZAR 616 000 1 683 275
Total Capital Cost ZAR 5 161 250 10 497 625
Funding Funding Horizon years 10 10
Interest Rate % 12.00% 12.00%
Debt:Equity Ratio % 70% 70%
Debt amount ZAR 3 612 875 7 348 338
Equity amount ZAR 1 548 375 3 149 288
Total Capex ZAR 5 161 250 10 497 625
Number of debt instalments per annum
1 1
Total Number of instalments
10 10
Total Interest Paid ZAR 2 781 342 5 657 056
Total Operation and Maintenance Costs ZAR 5 035 697 8 511 705
Total Lifetime Costs ZAR 12 978 288 24 666 386
Incremental Energy Production kWh 15 763 916 34 882 313
Actual Energy Production kWh 31 527 833 50 646 230
Incremental Levelised Electricity Cost R/kWh 0.82 0.71
Real Levelised Electricity Cost R/kWh 0.41 0.49

CCT Mini Hydro Power Prefeasibility Report
Page 45
Figure 27: SB LD to SBWTW 1
Figure 28: SB LD to SBWTW 2
Figure 27 and Figure 28 show the net cash flow and the NPV for the replacement options. Table 26
below summarises the financial outputs from the modelling process.
Table 26: SBLD to SBWTW Key Financial Outputs
Key Outputs SB Lower Dam to SBWTW 1 SB Lower Dam to SBWTW 2
Capex Required 5 161 250 10 497 625
Equity Required at Fin Close 1 548 375 3 149 288
PPA Revenue 27 544 816 60 951 029
Operating Costs 5 918 806 10 004 401
EBITDA 21 626 011 50 946 628
Net Cashflow 13 683 419 34 791 947
NPV 426 658 2 171 023

CCT Mini Hydro Power Prefeasibility Report
Page 46
Equity IRR 15% 19%
Incremental Levelised Cost of Energy (ZAR/kWh) R 0.82 R 0.71
Real Levelised Cost of Energy (ZAR/kWh) R 0.41 R 0.49
5.2.9 Conclusions and recommendations
Clearly the most feasible option of the replacement option SB LD to SBWTW 2.
For the feasibility Study, the following is recommended
Full energy audit will need to take place to calculate the current energy produced.
Energy Modelling for SB LD to SBWTW 2 needs to take into account:
Variance in head because of varied flow rates in new penstock must be taken into
account
Variance in head because of changing level of SB Lower Dam should be considered
Optimal penstock design to be compared to current design to find savings or
replacement
5.3 Steenbras Water Treatment Plant to the Break pressure tank 760 (SBWTW to
760)
5.3.1 Description
This site was not included in the scope of work outlined. The site visit resulted in the discovery of a
small potential at the 760 lower break pressure tank. There is a second 610mm pipe leaving the
clearwell reservoir at the WTW and the pressure is broken twice, at two separate tanks 710 Upper
and 710 lower. On the drawing W3-013-103, there appears to have been a pelton wheel at the lower
tank but it has been de-commissioned and no design details were sourced. A view of this tank is seen
in Figure 29 and Figure 30.

CCT Mini Hydro Power Prefeasibility Report
Page 47
Figure 29: Water Treatment works to upper 760 break pressure tank
Figure 30: Lower Break pressure tank 760
5.3.2 Data Used
5.3.2.1 Levels
The following levels were considered in the design. Again the drawing levels were taken from
drawing W3-013-103.
Level TOR Drawing Calculated
clearwell 282.03-276
280
710 Upper TWL - 213.36 -
710 Lower TWL - 108.12 -

CCT Mini Hydro Power Prefeasibility Report
Page 48
5.3.2.2 Flowrates
The flow duration curve for the 760 pipe can be seen in Figure 22. A summary of the historical flows
is also given in Table 27.
Table 27: Flow rates SBWTW to 760
Min Flow m3/s 0.012
Min Flow Ml/day 1.0
Max Flow m3/s 0.28
Max Flow Ml/day 24.2
Average Flow m3/s 0.08
Average Flow Ml/day 7.28
5.3.3 Design concept
A 610mm pipe leaves the clearwell reservoir at (average level 280m) and realises a gross static head
drop of 171m to a level of 108m at the lower break pressure tank. The water would then leave the
installed pelton wheel through the existing 760mm pipe line to Cape Town. This site, as with the 810
and 840 pipe has a near constant static head.
5.3.4 Works
A summary of the works required is shown in Table 28
Table 28: Works SBWTW to 760
SBWTW to 760 Item Specific Costs Item Cost
Civils R 2 032 000
Power House and Balance of Plant
R 1 000 000
New Penstock designed for max power generation
R 532 000
Access Road
R 500 000
Hydro Mechanical Electrical R 2 100 000
M&E – Turbine full turnkey installation. Work here is typical Water-to Wire. (Design Concept for a Single 265 kW Pelton) 228 R 8 920 R 2 100 000
Electricals and Grid Connection R 460 000
Transmission line 22kV 2 R 230 000 R 460 000
Substation/Other Electricals
R -
Total R 20 155 R 4 592 000
A possible cost saving could be found if the existing pipeline can act as an efficient penstock to the
plant. If so, works would include upgrading pipe connections and re-routing the pipe to the pelton
wheel from the existing 460 valve. Savings could be in the region of R0.5mil.
It is assumed that minimal turbine house upgrades will need to be done as there was an existing
pelton wheel at this location.

CCT Mini Hydro Power Prefeasibility Report
Page 49
Access needs to be considered as the plant currently has no road access.
5.3.5 Grid Connection
The grid connection assumption made here is that the plant will feed electricity into the grid via the
transformer and grid connection at the Break pressure tank 810 and 840. The distance is 1 km and
costs for a 22kV line were used which is a conservative cost.
5.3.6 Design Summary
A design flow rate of 0.18m3/s was used to maximise energy output. 10% average penstock loss was
assumed. It is noted that these losses can be significant at varying flow rates and would need to be
investigated further. Table 29 shows the design summary and results.
Table 29: Design Summary SBWTW to 760
SBWTW to 760
Static Head m 172
Hydraulic losses % 10%
Rated Head m 155
Design Flow m3/s 0.18
Design Flow Ml/day 16
Turbine type
Pelton
Runner Diameter m 0.22
Turbine Design Efficiency % 91%
Turbine Capacity kW 228
Annual Plant Downtime Losses % 5%
Theoretical Energy Delivered kWh 1 896 047
Actual Energy Delivered kWh 767 260
Capacity Factor % 40%
Energy output has been estimated for the period 1997-2011 for the design capacity of 228kW.
Average yearly output is 0.8 GWh giving an average capacity factor of 40%. Table 30 shows this
historical estimate.
Table 30: Design Results SBWTW to 760
Design Results
Plant Design Capacity kW 228
Annual downtime losses % 5%
Theoretical Energy Delivered kWh 1 896 047
Edelivered 1998 kWh 251 101
Edelivered 2000 kWh 252 699
Edelivered 2002 kWh 981 527
Edelivered 2004 kWh 914 025
Edelivered 2006 kWh 692 315
Edelivered 2008 kWh 920 108
Edelivered 2010 kWh 1 359 048
Average kWh 767 260

CCT Mini Hydro Power Prefeasibility Report
Page 50
Capacity Factor Theoretical % 100%
Capacity Factor 1998 % 13%
Capacity Factor 2000 % 13%
Capacity Factor 2002 % 52%
Capacity Factor 2004 % 48%
Capacity Factor 2006 % 37%
Capacity Factor 2008 % 49%
Capacity Factor 2010 % 72%
Average % 40%
5.3.7 Financial Modelling Results
This plant was modelled in a similar way to the other plant described above. Table 31 shows the
expected project costs and Figure 31 is the NPV and IRR for the site.
Table 31: SBWTW to 760 Project Costs
SBWTW to 760
Project Development Costs ZAR 2 081 250
Installation Cost ZAR/kW 22 170.38
ZAR 5 051 200
Contingency % 25%
ZAR 1 262 800
Total Capital Cost ZAR 8 395 250
Funding Funding Horizon years 10
Interest Rate % 12.00%
Debt:Equity Ratio % 70%
Debt amount ZAR 5 876 675
Equity amount ZAR 2 518 575
Total Capex ZAR 8 395 250
Number of debt instalments per annum
1
Total Number of instalments
10
Total Interest Paid ZAR 4 524 109
Total Operation and Maintenance Costs ZAR 3 204 778
Total Lifetime Costs ZAR 16 124 138
Incremental Energy Production kWh 15 345 206
Actual Energy Production kWh 15 345 206

CCT Mini Hydro Power Prefeasibility Report
Page 51
Incremental Levelised Electricity Cost R/kWh 1.05
Real Levelised Electricity Cost R/kWh 1.05
Figure 31: SBWTW to 760 NPV and IRR
Table 32 below shows the key financial outputs.
Table 32: SBWTW to 760 Key Financial Outputs
Key Outputs SBWTW to 760
Capex Required 8 395 250
Equity Required at Fin Close 2 518 575
PPA Revenue 26 813 190
Operating Costs 3 766 800
EBITDA 23 046 390
Net Cashflow 10 127 031
NPV (1 437 295)
Equity IRR 8%
Incremental Levelised Cost of Energy (ZAR/kWh) R 1.05
Real Levelised Cost of Energy (ZAR/kWh) R 1.05
5.3.8 Conclusions and Recommendations
According to the financial analysis, this site does not yield positive results. The NPV is
however close to zero and with some savings in the Feasibility and perhaps some Capex
savings, this site may well yield positive results.
It is recommended that this site be investigated in the Feasibility Study
The feasibility design should also include the following investigation:
o Whether the existing pipeline is feasible as a penstock for the new system or
whether this should be replaced

CCT Mini Hydro Power Prefeasibility Report
Page 52
o Further studies on how to bypass and break pressure in case of plant shut down
o Do proper flow measuring to find out the daily cycle values and how the cycling
would affect the turbine design and the power output.
o Access is an issue at this site and should be investigated further
5.4 Rockview Dam to Upper Steenbras Dam (Rockview to USD)
5.4.1 Description
Eskom currently operates a pumped storage hydro power scheme by pumping water from the
Kogelberg Dam to the Rockview Dam during times of low demand and weekends. It then uses that
water to generate electricity needed to meet peak electric demands.
Occasionally CCT buys water from the Eskom Scheme taking water out of the Rockview Dam into the
Upper Steenbras Dam located on the other side of the mountain. Water is only fed through this pipe
when there is enough water on the Kogelberg Dam side which is controlled by DWA. The water flows
out of the Rockview Dam into an 875m canal before entering a pipe. A 1691mm ID pipeline starting
at T.O.P. (Top of Pipe) sees a static head drop of 125m over a length of 2051m. Figure 32 below
shows the Rockview Dam with the canal outlet and the intake to the pipe. Figure 33 depicts the inlet
to the Upper Steenbras Dam.
Figure 32: Rockview Dam with canal outlet

CCT Mini Hydro Power Prefeasibility Report
Page 53
Figure 33: Rockiew dam inlet to Upper Steenbras
5.4.2 Data Used
5.4.2.1 Levels
The only reference for the operating levels of this scheme were given in the Terms of Reference and
shown below.
Level TOR
Rockview Top of Dam 509- unconfirmed
Rockview Base of Dam 499.56
Rockview Dam Top of Pipe (TOP) 497.41
Steenbras Upper Dam 372
5.4.2.2 Flow Rates
The flow rate data used is summarised in Table 33 below and shown graphically in Figure 34. The
data was manipulated to give more favourable conditions for power generation. This is explained in
Section 5.4.4.

CCT Mini Hydro Power Prefeasibility Report
Page 54
Table 33: Flow Rate Summary Rockview to USD
Min Flow m3/s 0.1 0.1
Min Flow Ml/day 10.8 10.8
Max Flow m3/s 12.0 3.0
Max Flow Ml/day 1036.8 259.2
Average Flow m3/s 5.6 1.5
Average Flow Ml/day 484.0 130.4
Figure 34: Flow Duration Curve for Water entering Upper Steenbras Dam
5.4.3 Design concept (Rockview to USD 1)
The Hydro Power Plant that would make use of this energy will be placed at the bottom of the pipe
where the water enters the Upper Steenbras Dam.
The first design scenario analysed makes use of the historical flow data and sized a turbine to fit this
flow. The chosen design flow is 5m3/s. Flows of up to 12m3/s are realised although very seldom.
Flows above 5m3/s were ‘bypassed’ in this analysis.
The gross static head of this scheme was taken as 125m and total pipe losses were estimated at 25%
leaving a rated turbine head of 94m. The analysis was performed for a Francis turbine.
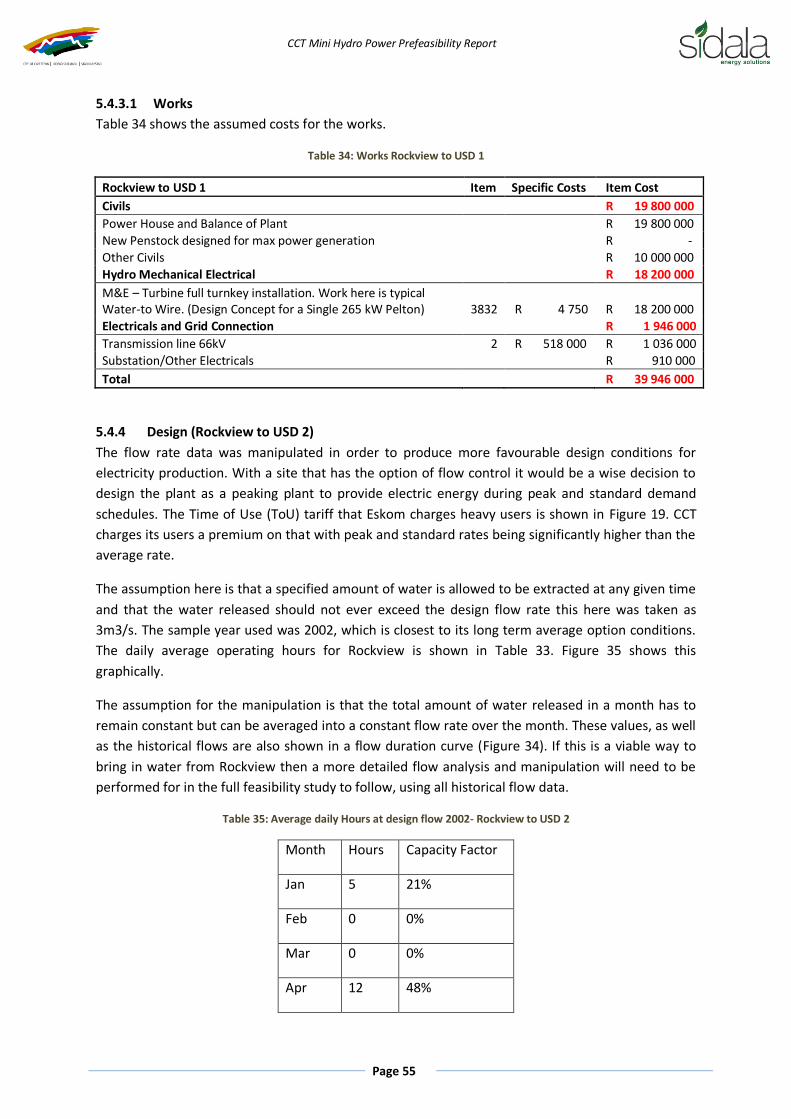
CCT Mini Hydro Power Prefeasibility Report
Page 55
5.4.3.1 Works
Table 34 shows the assumed costs for the works.
Table 34: Works Rockview to USD 1
Rockview to USD 1 Item Specific Costs Item Cost
Civils R 19 800 000
Power House and Balance of Plant
R 19 800 000
New Penstock designed for max power generation
R -
Other Civils
R 10 000 000
Hydro Mechanical Electrical R 18 200 000
M&E – Turbine full turnkey installation. Work here is typical Water-to Wire. (Design Concept for a Single 265 kW Pelton) 3832 R 4 750 R 18 200 000
Electricals and Grid Connection R 1 946 000
Transmission line 66kV 2 R 518 000 R 1 036 000
Substation/Other Electricals
R 910 000
Total R 39 946 000
5.4.4 Design (Rockview to USD 2)
The flow rate data was manipulated in order to produce more favourable design conditions for
electricity production. With a site that has the option of flow control it would be a wise decision to
design the plant as a peaking plant to provide electric energy during peak and standard demand
schedules. The Time of Use (ToU) tariff that Eskom charges heavy users is shown in Figure 19. CCT
charges its users a premium on that with peak and standard rates being significantly higher than the
average rate.
The assumption here is that a specified amount of water is allowed to be extracted at any given time
and that the water released should not ever exceed the design flow rate this here was taken as
3m3/s. The sample year used was 2002, which is closest to its long term average option conditions.
The daily average operating hours for Rockview is shown in Table 33. Figure 35 shows this
graphically.
The assumption for the manipulation is that the total amount of water released in a month has to
remain constant but can be averaged into a constant flow rate over the month. These values, as well
as the historical flows are also shown in a flow duration curve (Figure 34). If this is a viable way to
bring in water from Rockview then a more detailed flow analysis and manipulation will need to be
performed for in the full feasibility study to follow, using all historical flow data.
Table 35: Average daily Hours at design flow 2002- Rockview to USD 2
Month Hours Capacity Factor
Jan 5 21%
Feb 0 0%
Mar 0 0%
Apr 12 48%

CCT Mini Hydro Power Prefeasibility Report
Page 56
May 5 21%
Jun 18 74%
Jul 7 28%
Aug 0 0%
Sep 0 0%
Oct 0 0%
Nov 0 0%
Dec 0 0%
Average 4 16%
Figure 35: Average daily hours operating at design flow
Because the design flow is lower, the water velocity will also be slow resulting n fewer losses. A
value of 15% loss has been selected for the analysis but this should be re-looked in the feasibility
study. The resulting net head is 107m.
5.4.4.1 Works
Because the manipulated flows in this concept are significantly lower and as a result fewer friction
losses are expected, it opens the possibility of extending the pipe to the base of the dam to make

CCT Mini Hydro Power Prefeasibility Report
Page 57
use of the further 10m (unconfirmed) head drop at the dam wall. These costs have however, not
been considered.
Table 36: Works Rockview to USD 2
Rockview to USD 2 Item Specific Costs Item Cost
Civils
Power House and Balance of Plant
R 6 300 000
New Penstock designed for max power generation
R -
Other Civils
R 10 000 000
Hydro Mechanical Electrical R 11 200 000
M&E – Turbine full turnkey installation. Work here is typical Water-to Wire. (Design Concept for a Single 265 kW Pelton) 2166 R 5 172 R 11 200 000
Electricals and Grid Connection R 1 596 000
Transmission line 66kV 2 R 518 000 R 1 036 000
Substation/Other Electricals
R 560 000
Total R 29 096 000
5.4.5 Grid Connection
Figure 50below shows the proximity of the Rockview scheme to the Eskom grid. The line distance is
less than 2kms and the connection would be a loop in system that connects at 66kV.
Figure 36: Rockview Grid Connection
5.4.6 Design Summary
Using 5m3/s as the design flow resulted in a turbine sizing of 3832kW. The resulting annual average
energy generated over the period 1997-2011 is only 2.3GWh, capacity factor 7%. The resulting

CCT Mini Hydro Power Prefeasibility Report
Page 58
turbine size for the second concept is smaller at 2166kW but produced just under double the
amount of electricity.
Table 37 shows the design summary for the Steenbras system.
Table 37: Design Summary Rockview to USD
Rockview to USD1 Rockview to USD 2
Static Head m 125 125
Hydraulic losses % 25% 15%
Rated Head m 94 107
Design Flow m3/s 5.00 2.50
Design Flow Ml/day 432 216
Turbine type
Francis Francis
Runner Diameter m 0.98 0.71
Turbine Design Efficiency % 90% 90%
Turbine Capacity kW 3 832 2 166
Annual Plant Downtime Losses % 5% 5%
Theoretical Energy Delivered kWh 31 889 249 18 022 741
Actual Energy Delivered kWh 2 323 708 3 528 640
Capacity Factor % 7% 20%
Table 38: Design Results Rockview to USD 1
Design Results
Rockview to USD 1 Rockview to USD 2
Plant Design Capacity kW 3 832 2 166
Annual downtime losses % 5% 5%
Theoretical Energy Delivered kWh 31 889 249 18 022 741
Edelivered 1998 kWh 656 707.63 864 104.03
Edelivered 2000 kWh 631 990 828 009
Edelivered 2002 kWh 1 828 946 3 024 484
Edelivered 2004 kWh 4 474 203 7 897 685
Edelivered 2006 kWh 5 725 106 8 061 506
Edelivered 2008 kWh 1 179 958 1 325 393
Edelivered 2010 kWh 1 769 044 2 699 296
Average kWh 2 323 708 3 528 640
Capacity Factor Theoretical % 100% 100%
Capacity Factor 1998 % 2% 5%
Capacity Factor 2000 % 2% 5%
Capacity Factor 2002 % 6% 17%
Capacity Factor 2004 % 14% 44%
Capacity Factor 2006 % 18% 45%
Capacity Factor 2008 % 4% 7%
Capacity Factor 2010 % 6% 15%
Average % 7% 20%

CCT Mini Hydro Power Prefeasibility Report
Page 59
As can be seen, with some simple manipulation of the flows, greater energy can be extracted out of
the water at a smaller design capacity, leading to a higher capacity factor. A full investigation will
need to be undertaken in order to find what level of manipulation can be accommodated.
5.4.7 Financial Modelling and Results
Table 39 below shows the Total costs for the Rockview schemes compared.
Table 39: Rockview Total Costs
Rockview to LSD1 Rockview to LSD 2
Project Development Costs ZAR 2 081 250 2 081 250
Installation Cost ZAR/kW 11 466.99 14 778.58
ZAR 43 940 600 32 005 600
Contingency % 25% 25%
ZAR 10 985 150 8 001 400
Total Capital Cost ZAR 57 007 000 42 088 250
Funding Funding Horizon years 10 10
Interest Rate % 12.00% 12.00%
Debt:Equity Ratio % 70% 70%
Debt amount ZAR 39 904 900 29 461 775
Equity amount ZAR 17 102 100 12 626 475
Total Capex ZAR 57 007 000 42 088 250
Number of debt instalments per annum
1 1
Total Number of instalments
10 10
Total Interest Paid ZAR 30 720 454 22 680 901
Total Operation and Maintenance Costs ZAR 53 900 542 30 462 791
Total Lifetime Costs ZAR 141 627 996 95 231 942
Incremental Energy Production kWh 35 380 883 70 572 793
Actual Energy Production kWh 35 380 883 70 572 793
Incremental Levelised Electricity Cost R/kWh 4.00 1.35
Real Levelised Electricity Cost R/kWh 4.00 1.35

CCT Mini Hydro Power Prefeasibility Report
Page 60
Figure 37: Rockview to USD 1 NPV and Cash Flows
Figure 38: Rockview to USD 2 NPV and Cash Flows
Table 40: Rockview to USD 1 Key Financial outputs
Key Outputs Rockview to USD 1 Rockview to USD 2
Capex Required 57 007 000 42 088 250
Equity Required at Fin Close 17 102 100 12 626 475
PPA Revenue 61 822 195 164 404 350
Operating Costs 63 353 067 35 805 043
EBITDA -1 530 872 128 599 307
Net Cashflow -89 258 325 63 830 156
NPV -39 220 881 -5 075 320
Equity IRR - 10%
Incremental Levelised Cost of Energy (ZAR/kWh) R 4.00 R 1.35
Real Levelised Cost of Energy (ZAR/kWh) R 4.00 R 1.35

CCT Mini Hydro Power Prefeasibility Report
Page 61
5.4.8 Conclusions and Recommendations
As can be seen in the comparison between cashflows, there is a strong motivation to manipulate the
flows in order to generate on peak. However, whether these flows can be manipulated needs to be
better understood.
This site is not considered to be feasible in the short term unless better flow manipulation can be
produced. This seems unlikely because there are multiple parties interested, CCT, DWA and Eskom
who would pump the water to Rockview.

CCT Mini Hydro Power Prefeasibility Report
Page 62
6 Wemmershoek
6.1 Description
The treatment plant receives raw water from two sources, namely the Wemmershoek Dam and the
Theewaterskloof Dam, also referred to as the RSE. A cement lined 1200mm raw water pipeline runs
from the dam to the water treatment works supplying between 60-250Ml/day. Before the raw water
enters the WTW it passes through an existing Turbine House. The flow entering the inlet works is
controlled by two high pressure 21’’ Glen field valves, one per turbine and two high pressure bypass
valves. A portion of the raw water then passes through two Francis spiral type turbines which
generate 130 KVA each, operating at a peak with 28m head. The plant was built in 1958, with the
turbines coming online at the same time. There is the potential to upgrade this facility making use of
all the potential. Wemmershoek WTW is shown below.
.
Figure 39: Wemmershoek Water Treatment Works
6.2 Current Turbine Operation
There are currently two Francis turbines at Wemmershoek which have a 130kVA rating each. It is
assumed that the energy produced in a full year of operation is 1.5 GWh. This is calculated assuming
that the turbine runs at full capacity over a full year. This electricity is used on site which an Eskom
connection in place for the shortfall of needed electricity.
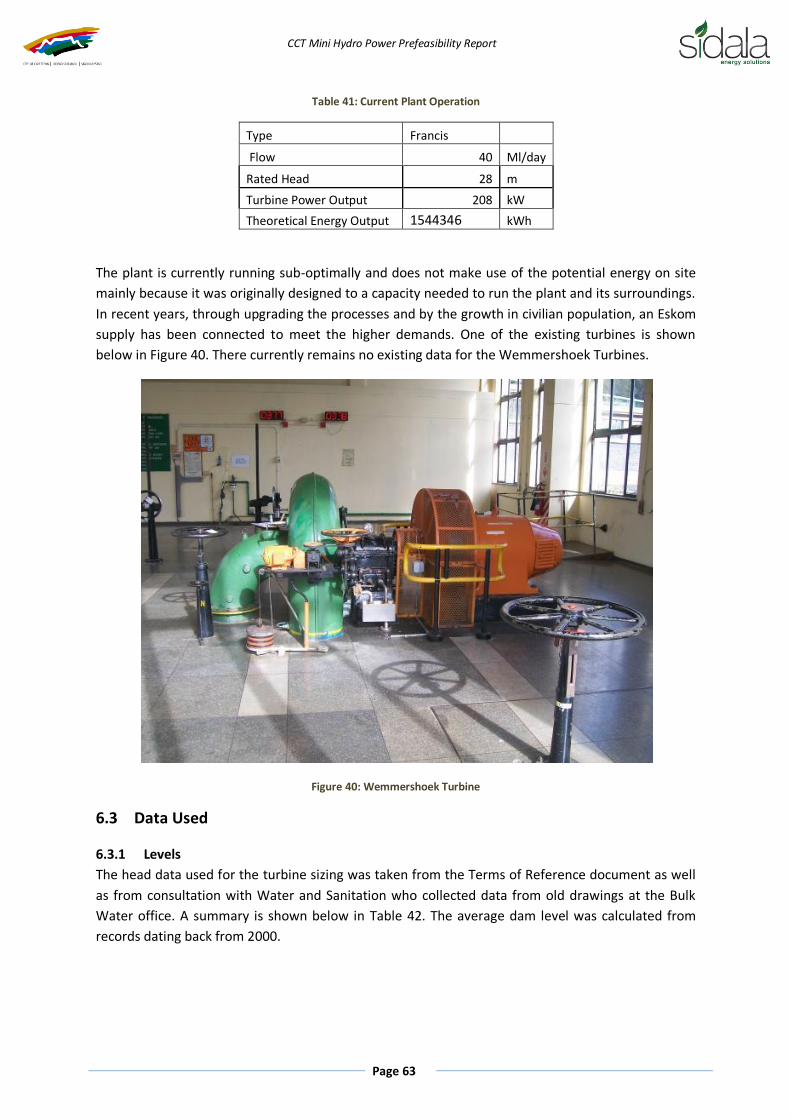
CCT Mini Hydro Power Prefeasibility Report
Page 63
Table 41: Current Plant Operation
Type Francis
Flow 40 Ml/day
Rated Head 28 m
Turbine Power Output 208 kW
Theoretical Energy Output 1544346 kWh
The plant is currently running sub-optimally and does not make use of the potential energy on site
mainly because it was originally designed to a capacity needed to run the plant and its surroundings.
In recent years, through upgrading the processes and by the growth in civilian population, an Eskom
supply has been connected to meet the higher demands. One of the existing turbines is shown
below in Figure 40. There currently remains no existing data for the Wemmershoek Turbines.
Figure 40: Wemmershoek Turbine
6.3 Data Used
6.3.1 Levels
The head data used for the turbine sizing was taken from the Terms of Reference document as well
as from consultation with Water and Sanitation who collected data from old drawings at the Bulk
Water office. A summary is shown below in Table 42. The average dam level was calculated from
records dating back from 2000.

CCT Mini Hydro Power Prefeasibility Report
Page 64
Table 42: Level data Wemmershoek
Levels Supplied Data TOR
Average Dam level 2000-2010 288.11 ?
Level at the base of the dam 242.32 ?
Full supply level 297.18 296.7
Level at the works intake - ?
Francis Turbines Level at the existing turbines 253.59 256.4
Current turbine maximum tail water level 252.07 ?
Current turbine minimum tail water level 249.94 ?
Peak Head - 28
20 year low head - 17.9
A diagram of the dam wall is shown in Figure 41
Figure 41: Wemmershoek Schematic
6.3.2 Flow Rates
The flow rate data was taken from the data provided by Bulk Water Head office and dates back to
1997. The flow data seems quite accurate with few discrepancies. A summary of the flowrates out of
the dam are shown in Table 43. A flow duration curve has been compiled and is shown in Figure 42.
Table 43: Flow rates Wemmershoek
Flow Rates
Min Flow m3/s 0.5
Min Flow Ml/day 40
Max Flow m3/s 2.9

CCT Mini Hydro Power Prefeasibility Report
Page 65
Max Flow Ml/day 250
Average Flow m3/s 1.9
Average Flow Ml/day 166.4
Figure 42: Flow Duration Curve Wemmershoek
6.4 Design concept
The ideal location for the plant would most likely be at the base of the dam. At this point there will
be minimal head loss due to friction and other hydraulic losses. The existing turbines are at a level
about 6m higher than the base of the dam and therefore would require a remaining pressure head
to ensure successful delivery of water to the plant. A Francis turbine would be ideal in this situation
as it utilises the pressure of the water and will operate in an in-line mode.
The benefits of locating the plant at the base of the dam for a few meters of extra head may not out
way the capital costs involved in the construction of a new power house and an extension of the
power line to take the power out of the new plant.
The turbines are currently only using a fraction of the existing water coming into the plant and by
channelling all the water flow available through a replacement turbine, the design flow will be
increased and the power plant will be able to maximise power output.
The design of the replacement turbine has been done using a design flow of 2.5 m3/s (216 Ml/day),
chosen in order to maximise energy production. The static head of 34.5m (=Average Dam Level 2010

CCT Mini Hydro Power Prefeasibility Report
Page 66
– level of existing turbines) was used. Hydraulic and friction losses were estimated at 10% resulting
in a Rated Head of 31.1m.
An estimation of historical energy production (kWh) using the daily flow rates from 1997 has been
produced, however a discrepancy must be noted here. Because the static head is dependent on the
dam level, it is constantly varying. To calculate energy output more accurately this variation in head
needs to be taken into account.
6.5 Grid Connection
Grid connection for the Wemmershoek plant would either be at the local Municipal grid or to the
closest Eskom connection. The table below describes the details about the considered connection
for Wemmershoek. The 66kV grid connect option adds significant project costs to the project and
during the feasibility this should be thoroughly investigated. It is assumed that this is most
conservative grid connection option for the site.
Table 44: Grid Connection Wemmershoek
Wemmershoek
Generation Capacity 500kW-1MW
Feed-in Voltage* 66kV
Current back up supply Eskom
Eskom Substation Connection
Closest Eskom Substation Wemmershoek Substation
Coordinates 19.04408335270E 33.87482423610 S
Substation Voltage 66 kV
Distance to Substation (length of line) 7183 m (Figure 43)
Transformer Capacity ?
Eskom Loop In Connection
Conductor Description Wemmershoek / Tee 66kV OHL
Potential Loop In Line 33°51'23.59"S 19° 2'23.11" E
Distance to Loop-in Connection 4388 m (Figure 44)
Line Capacity ?

CCT Mini Hydro Power Prefeasibility Report
Page 67
Figure 43: Wemmershoek Grid Connect Eskom Sub-station
Figure 44: Wemmershoek grid connect Eskom Loop in

CCT Mini Hydro Power Prefeasibility Report
Page 68
6.6 Works
An estimate of the costs involved in the works is given below in Table 45. It was assumed that the
transmission line would be the loop in option described with a 4.5kM 66kV line.
Table 45: Works Wemmershoek
Wemmershoek Item Specific Costs Item Cost
Civils R 2 800 000
Civil works required to accommodate the replacement turbine.
R 1 000 000
Balance of Plant
R 1 800 000
Hydro Mechanical Electrical R 4 900 000
M&E – Turbine full turnkey installation. Work here is typical Water-to Wire. (Design Concept for a 564kW Francis turbine) 564 R 8 682 R 4 900 000
Electricals and Grid Connection R 1 175 000
Transmission line 66kV 4.5 R 518 000 R 1 035 000
Substation/Other Electricals
R 140 000
Total R 15 726 R 8 875 000
6.7 Design Results
The operation was modelled for the years 1997-2010 with Figure 45 depicting the theoretical power
output for the year 2010.
Figure 45: Wemmershoek Theoretical Power Output 2010
The actual energy delivered of 3.6 GWh is the average yearly output of the new plant operating at a
design capacity of 576kW. This output was determined using the historical flow rate data since 1997
and can be seen in Table 46. The historical capacity factor is also shown.

CCT Mini Hydro Power Prefeasibility Report
Page 69
Table 46: Wemmershoek Design Results
Design Results
Plant Design Capacity kW 576
Downtime Losses % 5%
Theoretical Energy Delivered kWh 4 795 447
Edelivered 1998 kWh 4 568 365
Edelivered 2000 kWh 3 147 276
Edelivered 2002 kWh 4 329 708
Edelivered 2004 kWh 2 670 067
Edelivered 2006 kWh 3 976 373
Edelivered 2008 kWh 3 725 017
Edelivered 2010 kWh 2 755 658
Average kWh 3 596 066
Capacity Factor Theoretical % 100%
Capacity Factor 1998 % 95%
Capacity Factor 2000 % 66%
Capacity Factor 2002 % 90%
Capacity Factor 2004 % 56%
Capacity Factor 2006 % 83%
Capacity Factor 2008 % 78%
Capacity Factor 2010 % 57%
Average % 75%
Table 47 below illustrates the design data used and compares it to the existing turbines on site. By
replacing the existing turbines a new turbine could theoretically generate 75% more power than the
estimated theoretical maximum of the existing turbines.
Table 47: Design Summary Wemmershoek
Wemmershoek C Wemmershoek 1
Static Head m * 35
Hydraulic losses % * 10%
Rated Head m 28 31
Design Flow m3/s 0.46 2.50
Design Flow Ml/day 40 216
Turbine type
Francis Francis
Runner Diameter m 0.71
Turbine Design Efficiency % * 85%
Turbine Capacity kW 207 576
Annual Plant Downtime Losses % 5% 5%
Theoretical Energy Delivered kWh 1 544 356 4 795 447
Actual Energy Delivered kWh * 3 596 066
Capacity Factor % 75%
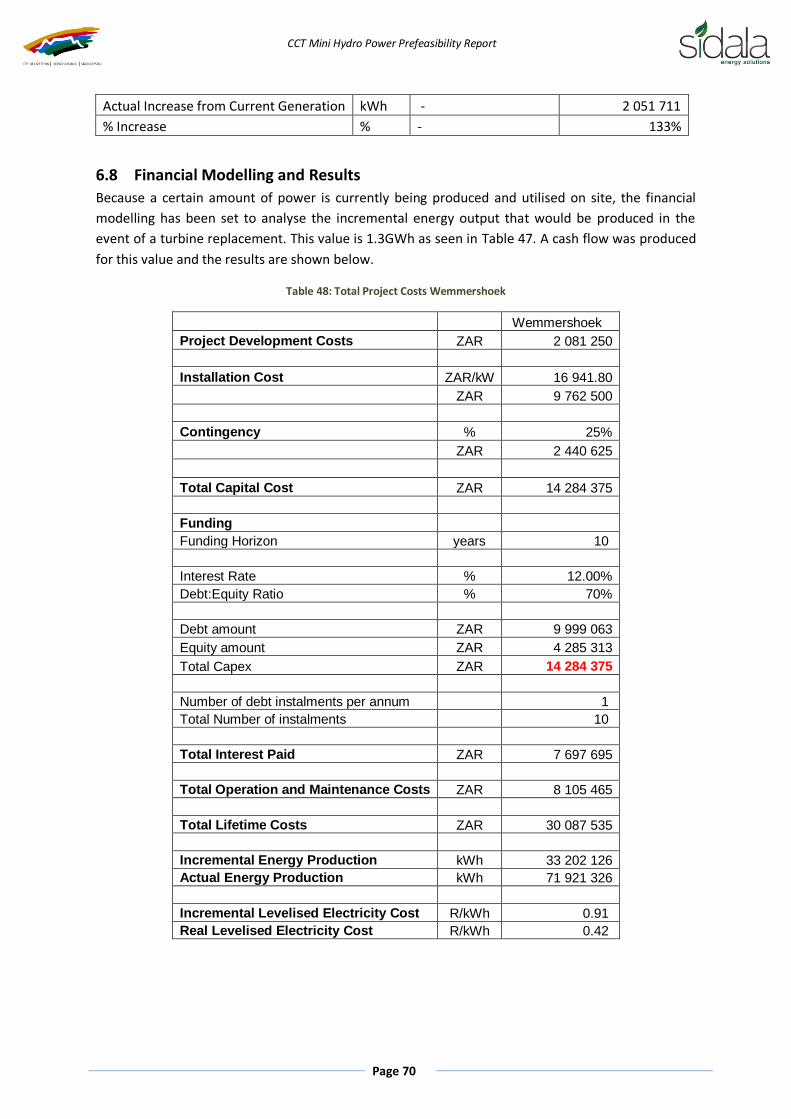
CCT Mini Hydro Power Prefeasibility Report
Page 70
Actual Increase from Current Generation kWh - 2 051 711
% Increase % - 133%
6.8 Financial Modelling and Results
Because a certain amount of power is currently being produced and utilised on site, the financial
modelling has been set to analyse the incremental energy output that would be produced in the
event of a turbine replacement. This value is 1.3GWh as seen in Table 47. A cash flow was produced
for this value and the results are shown below.
Table 48: Total Project Costs Wemmershoek
Wemmershoek
Project Development Costs ZAR 2 081 250
Installation Cost ZAR/kW 16 941.80
ZAR 9 762 500
Contingency % 25%
ZAR 2 440 625
Total Capital Cost ZAR 14 284 375
Funding Funding Horizon years 10
Interest Rate % 12.00%
Debt:Equity Ratio % 70%
Debt amount ZAR 9 999 063
Equity amount ZAR 4 285 313
Total Capex ZAR 14 284 375
Number of debt instalments per annum
1
Total Number of instalments
10
Total Interest Paid ZAR 7 697 695
Total Operation and Maintenance Costs ZAR 8 105 465
Total Lifetime Costs ZAR 30 087 535
Incremental Energy Production kWh 33 202 126
Actual Energy Production kWh 71 921 326
Incremental Levelised Electricity Cost R/kWh 0.91
Real Levelised Electricity Cost R/kWh 0.42

CCT Mini Hydro Power Prefeasibility Report
Page 71
Figure 46: Wemmershoek Cash flow and NPV
As can be seen in Figure 46, the plant gets paid off in the analysed 20 year life span. This analysis is
inherently inaccurate because the analysis was done for the incremental energy produced with the
replacement turbine and the current generation is unknown and can only be estimated.
Furthermore, what has not been factored into this is the fact that the current generating equipment
would most likely have to be replaced in the near future and making the investment yield more
positive results.
As can be seen in Table 48, the real levelised cost of energy is a low 42c/kWh. Key financial outputs
are summarised in Table 49.
Table 49: Wemmershoek Key Financial Outputs
Key Outputs Wemmershoek
Capex Required 14 284 375
Equity Required at Fin Close 4 285 313
PPA Revenue 71 700 451
Operating Costs 9 526 918
EBITDA 62 173 533
Net Cashflow 40 191 463
NPV 1 707 157
Equity IRR 17%
Incremental Levelised Cost of Energy (ZAR/kWh) R 0.73
Real Levelised Cost of Energy (ZAR/kWh) R 0.42
6.9 Conclusions and Recommendations
To understand the true lifetime replacement costs of the turbine a full energy audit of the
site must be performed. The incremental value of energy produced can then be better
estimated and the true investment costs compared.
The feasibility study should also take note of the following:

CCT Mini Hydro Power Prefeasibility Report
Page 72
o Investigate the possibility of installing a turbine at the base of the dam to make use
of potentially higher head.
o According to Figure 45, the most energy produced is during the summer months
which almost doubles the theoretical power output of the turbine during winter.
Perhaps a more efficient operation would include installing two turbines and
operationally only run one of them during the winter months.
o Investigate the installation of a turbine on the RSE water inlet.
This site should be considered for the full feasibility design.

CCT Mini Hydro Power Prefeasibility Report
Page 73
7 Faure Water Treatment Works
7.1 Description
There is an existing turbine installed on the Raw Water Pipeline entering the plant from the DWA
water supply from the Theewaterskloof Dam. The 1675mm pipeline has a static head of 142m and
sees draws of up to 620Ml/day max. Typical flows are between 100 and 500 Ml/day. An aerial view
of the treatment works is shown in Figure 47.
Figure 47: Faure Water Treatment works
7.2 Current Turbine Operation
The existing turbine is rated at 1475 kW and produces enough electricity for the running of the
plant. The remaining raw water is bypassed into the WTW. The existing Turgo Turbine is shown in
Figure 48.

CCT Mini Hydro Power Prefeasibility Report
Page 74
Figure 48: Existing Faure Turgo Turbine
The existing Turgo turbine data sheet can be found in Appendix A Turbine Spec Sheets. The turbine
is currently operated sub optimally running at a constant 100Ml/day, with excess flow being
bypassed to the works. The table below is the assumed turbine operating conditions.
Table 50: Existing Faure operation
Manufacturer Gilbert Gilkes & Gordon Type Turgo Impulse Twin Jet Runner Size 31 in
Flow 1.16 m3/s
Rated Head 130 m
Turbine Power Output 1174 kW
Capacity Factor 60% Theoretical Energy Output 12921000 kWh
Current Energy Production 7772310 kWh
The current energy production was calculated using the historical flow rates and assuming that the
max operation of the turbine is at 100Ml/day. This gives a capacity factor of 60%. It is very important
that this value is confirmed in an energy audit because the following analysis and financial viability is
based on the financial benefits of the energy production over and above that required for current
plant production.
7.3 Data Used
7.3.1 Levels
The only level made available in the terms of reference is the static head between Kleinplaas Dam
and the plant of 142m. The rated turbine head is 130m as taken from the Turbine data sheet. This
rated head was for a design flow rate of 1.45m3/s. The actual head measurements for different flow
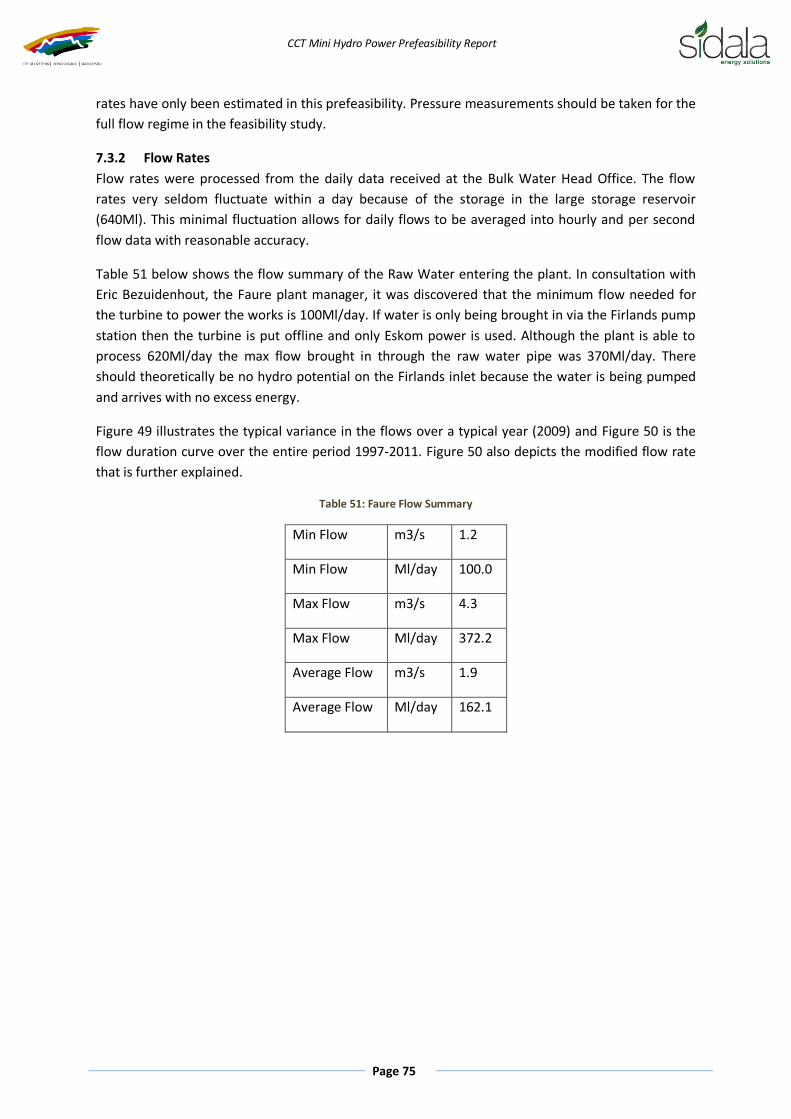
CCT Mini Hydro Power Prefeasibility Report
Page 75
rates have only been estimated in this prefeasibility. Pressure measurements should be taken for the
full flow regime in the feasibility study.
7.3.2 Flow Rates
Flow rates were processed from the daily data received at the Bulk Water Head Office. The flow
rates very seldom fluctuate within a day because of the storage in the large storage reservoir
(640Ml). This minimal fluctuation allows for daily flows to be averaged into hourly and per second
flow data with reasonable accuracy.
Table 51 below shows the flow summary of the Raw Water entering the plant. In consultation with
Eric Bezuidenhout, the Faure plant manager, it was discovered that the minimum flow needed for
the turbine to power the works is 100Ml/day. If water is only being brought in via the Firlands pump
station then the turbine is put offline and only Eskom power is used. Although the plant is able to
process 620Ml/day the max flow brought in through the raw water pipe was 370Ml/day. There
should theoretically be no hydro potential on the Firlands inlet because the water is being pumped
and arrives with no excess energy.
Figure 49 illustrates the typical variance in the flows over a typical year (2009) and Figure 50 is the
flow duration curve over the entire period 1997-2011. Figure 50 also depicts the modified flow rate
that is further explained.
Table 51: Faure Flow Summary
Min Flow m3/s 1.2
Min Flow Ml/day 100.0
Max Flow m3/s 4.3
Max Flow Ml/day 372.2
Average Flow m3/s 1.9
Average Flow Ml/day 162.1
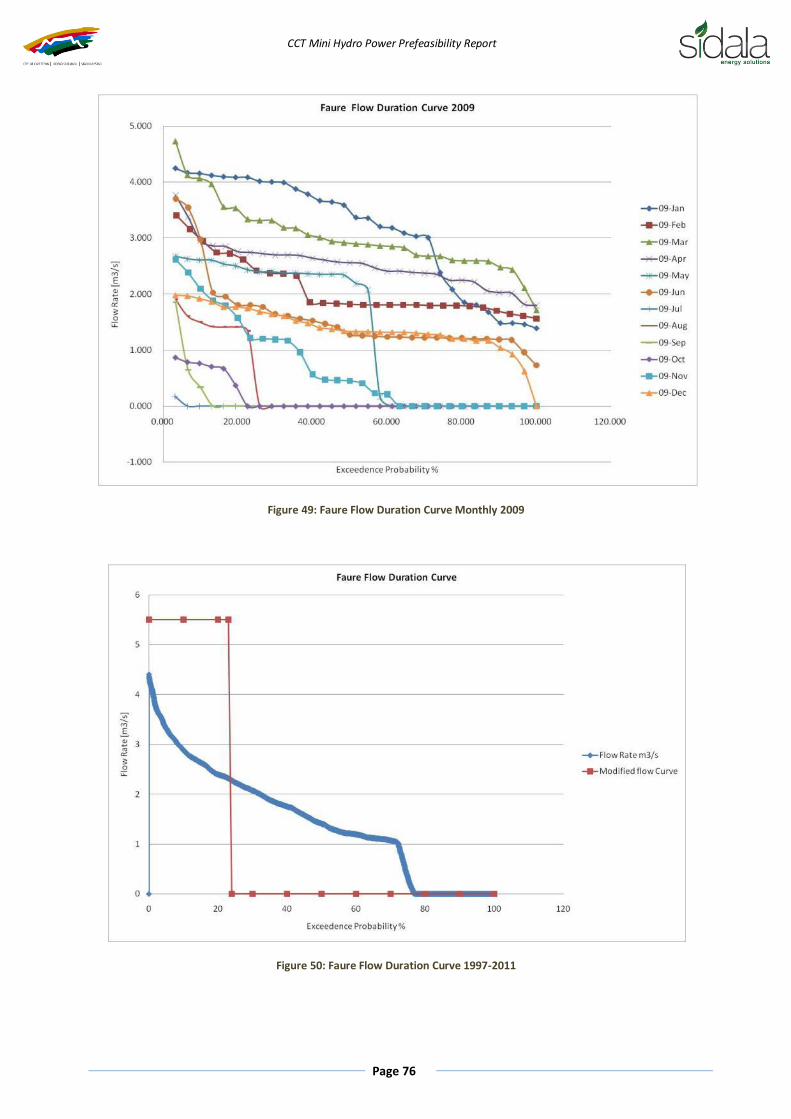
CCT Mini Hydro Power Prefeasibility Report
Page 76
Figure 49: Faure Flow Duration Curve Monthly 2009
Figure 50: Faure Flow Duration Curve 1997-2011

CCT Mini Hydro Power Prefeasibility Report
Page 77
7.4 Design Concept - Increase production to Design Capacity (Faure 1)
It is possible to make use of all the flow coming into the plant and to keep the existing turbine in
place. This would result in the turbine operation capacity increase from 1173 kW currently (average
flow rate of 1.16m3/s, 100Ml/day) to the design capacity of 1475 kW (design flow rate of 1.458m3/s,
126Ml/day). Because of the close proximity of the Eskom Grid Connection, it would be possible to
feed this power back into the grid at very little expense.
7.4.1 Works
The works involved here only entail connecting the existing infrastructure to the Eskom grid. It is
assumed that the plant will be connected to the Firgrove substation and the costs indicated below
only serve as an estimate.
Table 52: Works Faure 1
Faure 1 Item Specific Costs Item Cost
Civils R -
None
R -
Hydro Mechanical Electrical R -
None
R -
Electricals and Grid Connection R 1 595 000
Transmission line 66kV 2.5 R 518 000 R 1 295 000
Substation/Other Electricals
R 300 000
Total R 1 189 R 1 595 000
7.5 Design Concept - Replace Existing Turbine (Faure 2)
Because the turbine is only designed to a flow rate of 1.458 m3/s, there is a significant amount of
water that is being bypassed during times of higher flow. A turbine replacement option would entail
the installation of a larger capacity turbine and generator that will be able to handle higher flow
rates. By doing this the capacity factor of the plant will decrease but there will be an increase in the
total energy delivered.
The turbine was sized at the design flow of 2.5m3/s, chosen to coincide with the existing historical
flow values. The rated head of this concept takes into account the rated head of 130m less a further
5% (124m). This results in a rated capacity of 2441 kW. The energy and turbine efficiency analysis
was done for a standard Francis Turbine but it will be determined in the feasibility study which
turbine is the optimal solution. The power output for the plant based on 2009 values is given in
Figure 51.

CCT Mini Hydro Power Prefeasibility Report
Page 78
Figure 51: Faure 2 Power Output 2009
7.5.1 Works
The estimation of costs for this design concept is given below in Table 53.
Table 53: Works Faure 2
Faure 2 Item Specific Costs Item Cost
Civils R 3 100 000
Civil works required to accommodate the replacement turbine.
R 1 000 000.00
Balance of Plant
R 2 100 000.00
Hydro Mechanical Electrical R 11 200 000
M&E – Turbine full turnkey installation. Work here is typical Water-to Wire. (Design Concept for a 2441 Francis turbine but design should consider replacing with a Turgo) 2441 R 4 588 R 11 200 000
Electricals and Grid Connection R 1 645 000
Transmission line 66kV 2.5 R 518 000 R 1 295 000
Substation/Other Electricals
R 350 000
Total R 15 945 000
7.6 Design Concept - Replace Existing Turbine (Faure 3)
The terms of reference mentioned that using Faure as a peaking plant should also be considered,
this concept aims to analyse its viability. This concept considers the fact that the plant is running at a
very low capacity and there is a reservoir on site that can store 620Ml. The pipe line was also
designed to handle higher flows. This leaves room for the sizing of a turbine that could handle very
high flow rates. However, Table 51 shows that the average flow rate (daily demand) is not sufficient
to run a larger turbine at a continuous operation.
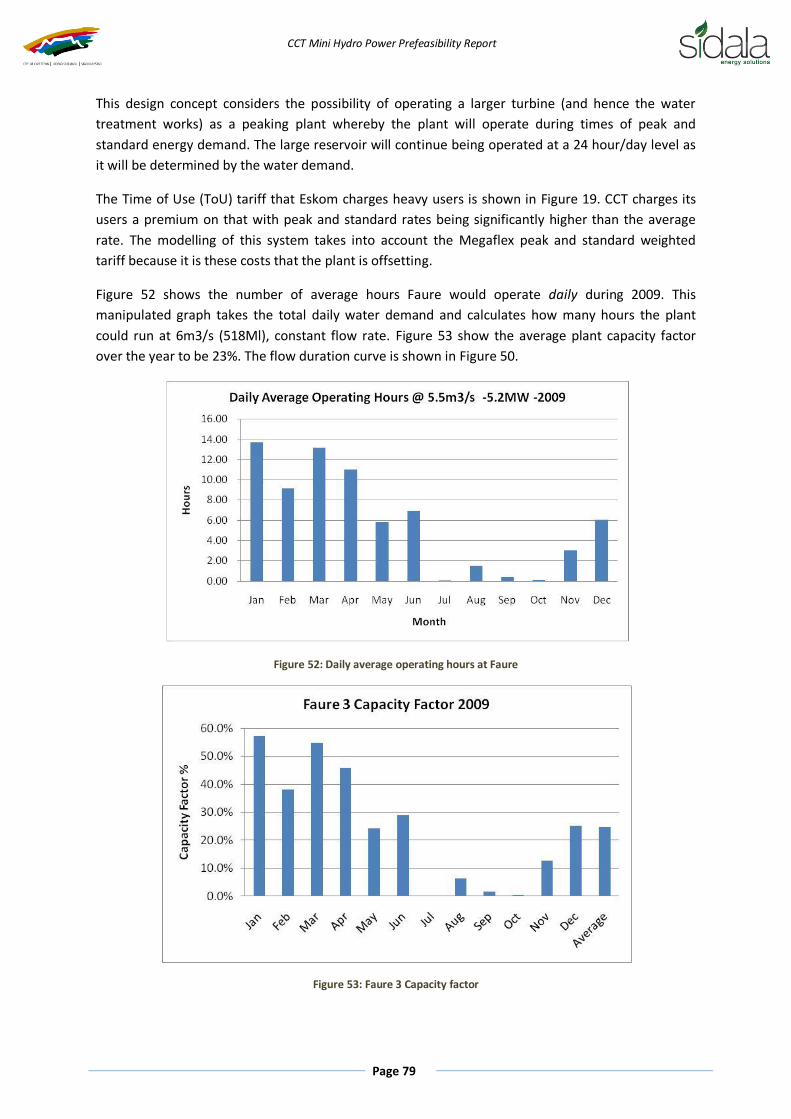
CCT Mini Hydro Power Prefeasibility Report
Page 79
This design concept considers the possibility of operating a larger turbine (and hence the water
treatment works) as a peaking plant whereby the plant will operate during times of peak and
standard energy demand. The large reservoir will continue being operated at a 24 hour/day level as
it will be determined by the water demand.
The Time of Use (ToU) tariff that Eskom charges heavy users is shown in Figure 19. CCT charges its
users a premium on that with peak and standard rates being significantly higher than the average
rate. The modelling of this system takes into account the Megaflex peak and standard weighted
tariff because it is these costs that the plant is offsetting.
Figure 52 shows the number of average hours Faure would operate daily during 2009. This
manipulated graph takes the total daily water demand and calculates how many hours the plant
could run at 6m3/s (518Ml), constant flow rate. Figure 53 show the average plant capacity factor
over the year to be 23%. The flow duration curve is shown in Figure 50.
Figure 52: Daily average operating hours at Faure
Figure 53: Faure 3 Capacity factor

CCT Mini Hydro Power Prefeasibility Report
Page 80
7.6.1 Works
The works for the resulting concept are described in Table 54.
Table 54: Works Faure 3
Faure 3 Item Specific Costs Item Cost
Civils R 5 700 000
Civil works required to accommodate the replacement turbine.
R 1 500 000
Balance of Plant
R 4 200 000
Hydro Mechanical Electrical R 17 500 000
M&E – Turbine full turnkey installation. Work here is typical Water-to Wire. (Design Concept for a 5230 Francis turbine but design should consider replacing with a Turgo) 5230 R 3 346 R 17 500 000
Electricals and Grid Connection R 3 290 000
Transmission line 66kV 2.5 R 518 000 R 1 295 000
Substation/Other Electricals
R 595 000
Total R 26 490 000
7.7 Grid Connection
There is a large Eskom Substation situated about 2.5 km away from the Faure WTW. It has been
assumed for this study that this will be the connection point for the extra generated capacity. Table
55 shows the details of this substation and the line route is depicted in Figure 54. There remains the
possibility of connecting the generator to through a loop in connection to the 66kV line that runs
past the treatment works.
Table 55: Faure Grid Connection
Faure
Generation Capacity 1.475 MW – 5.230MW
Feed-in Voltage 66kV
Current back up supply Eskom
Eskom Substation Connection
Closest Eskom Substation Firgrove Substation
Coordinates 18.78245770740 E 34.04864783400 S
Substation Voltage 132 kV
Distance to Substation (length of line) 2498m (Figure 54)
Transformer Capacity ?

CCT Mini Hydro Power Prefeasibility Report
Page 81
Figure 54: Faure Grid Connect Eskom Sub-station
7.8 Design Summary
Faure 2, because of the lower head losses associated with the lower flow rate will produce more
energy than the concept described in Faure 3 which runs at a higher capacity flow. Here the average
difference for the two plants using the historical flow rates is just under 1 GWh. These outputs are
compared below in Table 56. The historical capacity factor is also shown.
Table 56: Faure Design Results for Replacement Turbine
Design Results
Faure 2 Faure 3
Plant Design Capacity kW 2441 5230
Annual downtime losses % 5% 5%
Theoretical Energy Delivered kWh 20 316 175 43 525 141
Edelivered 1998 kWh 14 399 110 12 749 238
Edelivered 2000 kWh 13 946 906 13 362 586
Edelivered 2002 kWh 12 553 111 11 292 511
Edelivered 2004 kWh 11 297 711 10 335 288
Edelivered 2006 kWh 10 859 261 9 806 652
Edelivered 2008 kWh 16 445 847 15 850 421

CCT Mini Hydro Power Prefeasibility Report
Page 82
Edelivered 2010 kWh 14 617 996 14 715 420
Average kWh 13 445 706 12 587 445
Capacity Factor Theoretical % 100% 100%
Capacity Factor 1998 % 71% 29%
Capacity Factor 2000 % 69% 31%
Capacity Factor 2002 % 62% 26%
Capacity Factor 2004 % 56% 24%
Capacity Factor 2006 % 53% 23%
Capacity Factor 2008 % 81% 36%
Capacity Factor 2010 % 72% 34%
Average % 66.2% 28.9%
Table 57 below illustrates the difference in production from the existing operation to the current
design capacity. This increase is 2 GWh/annum or a 26% increase. Although the current turbine
should theoretically generate 12.9 GWh/annum it could only produce 9.7GWh due to the calculated
76% capacity factor of the plant.
By replacing the turbine (Faure 2) the plant could theoretically could theoretically generate 13.4
GWh (73% more power than the current operation).
The modified plant operation and turbine replacement (Faure 3) results in less energy output per
year, but because it is designed to run during peak electric demands, it may be a wiser investment
option, capturing higher tariffs. This is summarised in Table 57. The choice between the three
options will be determined in the Financial Analysis (Section 7.9).
Table 57: Faure Design Summary
Faure C Faure 1 Faure 2 Faure 3
Static Head m * * * *
Hydraulic losses % * 5% 5% 10%
Rated Head m 130 124 124 117
Design Flow m3/s 1.16 1.46 2.50 5.50
Design Flow Ml/day 100 126 216 475
Turbine type
Turgo Turgo Francis Francis
Runner Diameter m 0.79 0.79 0.71 *
Turbine Design Efficiency % * * 90% 90%
Turbine Capacity kW 1 174 1 475 2 441 5 230
Annual Plant Downtime Losses % * 5% 5% 5%
Theoretical Energy Delivered kWh 12 921 000 12 921 000 20 316 175 43 525 141
Actual Energy Delivered kWh 7 772 310 9 768 276 13 445 706 12 587 445
Capacity Factor % 60% 76% 66% 29%
Actual Increase from Current Generation kWh - 1 995 966 5 673 396 4 815 135
% Increase % - 26% 73% 62%

CCT Mini Hydro Power Prefeasibility Report
Page 83
7.9 Financial Modelling and Results
The table below shows the results from the costing analysis and the inputs into the cashflow
analysis.
Table 58: Faure Total Costs
Faure 1 Faure 2 Faure 3
Project Development Costs ZAR 2 081 250 2 081 250 2 081 250
Installation Cost ZAR/kW 1 189.49 7 184.61 5 571.37
ZAR 1 754 500 17 539 500 29 139 000
Contingency % 25% 25% 25%
ZAR 438 625 4 384 875 7 284 750
Total Capital Cost ZAR 4 274 375 24 005 625 38 505 000
Funding Funding Horizon years 10 10 10
Interest Rate % 12.00% 12.00% 12.00%
Debt:Equity Ratio % 70% 70% 70%
Debt amount ZAR 2 992 063 16 803 938 26 953 500
Equity amount ZAR 1 282 313 7 201 688 11 551 500
Total Capex
4 274 375 24 005 625 38 505 000
Number of debt instalments per annum
1 1 1
Total Number of instalments
10 10 10
Total Interest Paid ZAR 2 303 414 12 936 371 20 749 927
Total Operation and Maintenance Costs ZAR 20 747 634 34 339 249 73 568 013
Total Lifetime Costs ZAR 27 325 423 71 281 245 132 822 940
Incremental Energy Production kWh 39 919 320 113 467 918 96 302 702
Actual Energy Production kWh 195 365 520 268 914 118 251 748 902
Incremental Levelised Electricity Cost R/kWh 0.68 0.63 1.38
Real Levelised Electricity Cost R/kWh 0.14 0.27 0.53
The three scenarios were modelled using two different tariff structures. Faure 2 and Faure 3 were
analysed according to the standard average MegaFlex rates and Faure 3 analysed according to the
standard and peak weighted time of use tariff TOU structure. The results are depicted below.

CCT Mini Hydro Power Prefeasibility Report
Page 84
Figure 55: Faure 1 Cash Flow and NPV
Figure 56: Faure 2 Cash Flow and NPV

CCT Mini Hydro Power Prefeasibility Report
Page 85
Figure 57: Faure 3 Cash Flow and NPV
Table 59 below shows the key financial outputs of the three analysed options. The IRR of the first
option is clearly the highest because the capital costs of installation are so low. The other two
options also yield positive results and it is worth investigating these further.
Table 59: Faure Financial Modelling Key Results
Key Outputs Faure 1 Faure 2 Faure 3
Capex Required 4 274 375 24 005 625 38 505 000
Equity Required at Fin Close 1 282 313 7 201 688 31 015 598
PPA Revenue 69 752 358 198 266 275 224 344 005
Operating Costs 24 386 141 40 361 314 24 869 272
EBITDA 45 366 217 157 904 961 199 474 734
Net Cashflow 38 788 428 120 962 965 140 219 807
NPV 5 084 975 12 276 372 10 236 358
Equity IRR 41% 27% 20%
Incremental Levelised Cost of Energy (ZAR/kWh) R 0.68 R 0.63 R 1.38
Real Levelised Cost of Energy (ZAR/kWh) R 0.14 R 0.27 R 0.53
7.10 Conclusions and Recommendations
The scenario that produces the highest IRR is Faure 1 which would involve running the plant
at its installed capacity and feeding the excess power into the grid. The only infrastructure
requirements here are the grid connection costs. This is a project that could be performed
relatively quickly and will involve minimal investment.
However, with the resizing of the plant (Faure 2 & 3) a further 4GWh can be produced per
annum. An optimisation process needs to be undertaken in the Feasibility stage whereby the
optimum size turbine and plant operation is determined. What also needs to be taken into
account is the future water demand of Cape Town and how this affects Faure which is
currently running under capacity.
What also needs to be taken into account is the varying head with the associated flow. The
actual head measurements for different flow rates have only been estimated in this

CCT Mini Hydro Power Prefeasibility Report
Page 86
prefeasibility. Pressure measurements should be taken for the full flow regime in the
feasibility study.
The concept of Faure 3 was not received well in consultation with Bulk Water. The reasons
being that a Water Treatment works needs to run on a 24 hour basis and the idea of
intermittency is not favourable. Design concept Faure 3 is therefore not recommended for
future consideration.

CCT Mini Hydro Power Prefeasibility Report
Page 87
8 Blackheath Water Treatment Works Blackheath WTW (Figure 58) treats between 120 and 420 Ml/day receiving water from the
Theewaterskloof Dam through a 21km pipeline. There are a number of sites that have been
identified at the works and are further described.
1. Blackheath Raw Water Inlet (BH Raw Water)
2. Blackheath Water Treatment Plant to the Upper Blackheath Reservoir (BHWTW to Upper)
3. Blackheath Lower Reservoir Inlet (BH Upper to Lower)
Figure 58: Blackheath Water Treatment Works
8.1 Blackheath Raw Water Inlet (BH Raw Water)
8.1.1 Description
The Treatment Plant is supplied by a 1500mm pipeline that is 21600m long which brings in flows
that vary between 120 to 420 Ml/d. This pipeline has a 77m static head from the Kleinplaas Dam.
There are existing needle valves on the 1500mm pipe before it enters the treatment works on site
(located underground - Figure 59). It is assumed that these valves are breaking the pressure. There is
also an 1100mm bypass valve also located underground (Figure 60).

CCT Mini Hydro Power Prefeasibility Report
Page 88
Figure 59: 1500mm needle valve
Figure 60: 1100 mm bypass needle valve
8.1.2 Data Used
8.1.2.1 Levels
The only level data obtained is from the Terms of Reference which states that static head from
Kleinplaas Dam is 77m. The pipe is 21km long and would endure significant friction losses.
8.1.2.2 Flow Rates
Table 60 shows a summary of the Raw Water inlet flows. These flow rates represent the plant
operating flows and correlate with the flows from the data provided from Bulk Water Head Office.
The daily flows have been measured and recorded from 1997-2011 and are represented in the flow
duration curve as Stellenbosch Inlet - Figure 61.

CCT Mini Hydro Power Prefeasibility Report
Page 89
Comparing the integrator readings on the site visit to those submitted to Head Office, there is a
slight discrepancy. After consultation with Mr Winston Stanley at the Blackheath reservoir, it was
confirmed that the readings submitted to Head Office were accurate, even though some of the
gauges on site weren’t functional. This flow analysis will need to be confirmed in the feasibility
study.
Table 60: Blackheath Raw Water Flow Rate Summary
Min Flow m3/s 1.4
Min Flow Ml/day 120
Max Flow m3/s 4.9
Max Flow Ml/day 420
Average Flow m3/s 2.6
Average Flow Ml/day 223.8
Figure 61: Flow Duration Curve Blackheath
8.1.3 Design concept
The valves described in Section 8.1.1 could be the location of the installed hydro turbine. Locating
them here would require minimum construction and earthworks. Water passes through the turbine
and carries on its way through the pipe. This setting means that a pressure defined by the network
requirements has to be maintained at the turbine outlet. There is a pressure that needs to be

CCT Mini Hydro Power Prefeasibility Report
Page 90
maintained in order for the water to reach the treatment plant. A reaction turbine such as the
Francis would be the ideal fit in this case.
8.1.4 Grid Connection
The assumption used here is that the in line plant will need to be connected to the closest Eskom
line. A summary of the connection details is given in Table 61. The line length was measured off
Google Earth and a screen shot of the line is shown in Figure 62.
There may be a closer Municipal Substation or a loop-in grid connect option into a municipal line but
this would need to be further investigated in the Feasibility study. A 66kV line is assumed for
financial modelling purposes but this can only be determined after a full investigation.
Table 61: Blackheath Grid Connection
Blackheath
Generation Capacity 1-3 MW
Feed-in Voltage* 66kV
Current back up supply Municipality
Eskom Substation Connection
Closest Eskom Substation Kuilsrivier/Langverwagt substation
Coordinates 18.70001613850 E 33.93502028300 S
Substation Voltage 66 kV
Distance to Substation (length of line) 4652m
Eskom Loop In Connection
Conductor Description Blackheath / Kuilsrivier 66kV OHL
Potential Loop In Line 33°56'59.36"S 18°42'19.35"E
Distance to Loop-in Connection 2464m

CCT Mini Hydro Power Prefeasibility Report
Page 91
Figure 62: Blackheath Grid Connect Eskom Sub-station
8.1.5 Works
The works described in Table 62 below indicate the extent of the construction needed to fit a
turbine in line with the raw water pipe. A power house will need to be sunk in order to
accommodate the turbine and generating equipment and a 2.5 km 22kV line is assumed for
transmission.
Table 62: Works BH Raw Water
BH Raw Water Item Specific Costs Item Cost
Civils R 10 000 000
Power House and Balance of Plant
R 8 000 000
Other Civil Works
R 2 000 000
Hydro Mechanical Electrical R 9 100 000
M&E – Turbine full turnkey installation. Work here is typical Water-to Wire. (Design Concept for a 1096kW Francis Turbine) 1096 R 8 304 R 9 100 000
Electricals and Grid Connection R 799 000
Transmission line 22kV 2.5 R 518 000 R 575 000
Substation/Other Electricals
R 224 000
Total R 18 159
R 19 899 000

CCT Mini Hydro Power Prefeasibility Report
Page 92
8.1.6 Design Summary
The sizing of this plant was performed with the assumption that the pipe losses due to friction etc
were 45%. In real operation this value will be constantly changing making the variable head a major
design consideration. Because this was not modelled in this study the energy output of this
particular design concept will be inaccurate and should only be considered indicative. Special
attention should be paid to this when performing the feasibility design. It is recommended that
pressure transducers should be used to measure the pressure situation at different flow regimes.
A summary of the modelling process is given in Table 63 and the results of the energy modelling on
the historical flow data is given in Table 64.
Table 63: Design Summary BH Raw Water
BH Raw Water
Static Head m 77
Hydraulic/pipe losses % 45%*estimate
Rated Head m 42
Design Flow m3/s 3.40
Design Flow Ml/day 294
Turbine type
Francis
Runner Diameter m 0.82
Turbine Design Efficiency % 86%
Turbine Capacity kW 1 096
Annual Plant Downtime Losses % 5%
Theoretical Energy Delivered kWh 9 119 251
Actual Energy Delivered kWh 6 138 489
Capacity Factor % 67%
Table 64: Design Results BH Raw Water
Design Results
Plant Design Capacity kW 1096
Annual downtime losses % 5%
Theoretical Energy Delivered kWh 9 119 251
Edelivered 1998 kWh 6 145 201
Edelivered 2000 kWh 5 939 949
Edelivered 2002 kWh 4 958 076
Edelivered 2004 kWh 5 689 475
Edelivered 2006 kWh 6 595 763
Edelivered 2008 kWh 7 544 820
Edelivered 2010 kWh 6 096 143
Average kWh 6 138 489
Capacity Factor Theoretical % 100%
Capacity Factor 1998 % 67%
Capacity Factor 2000 % 65%
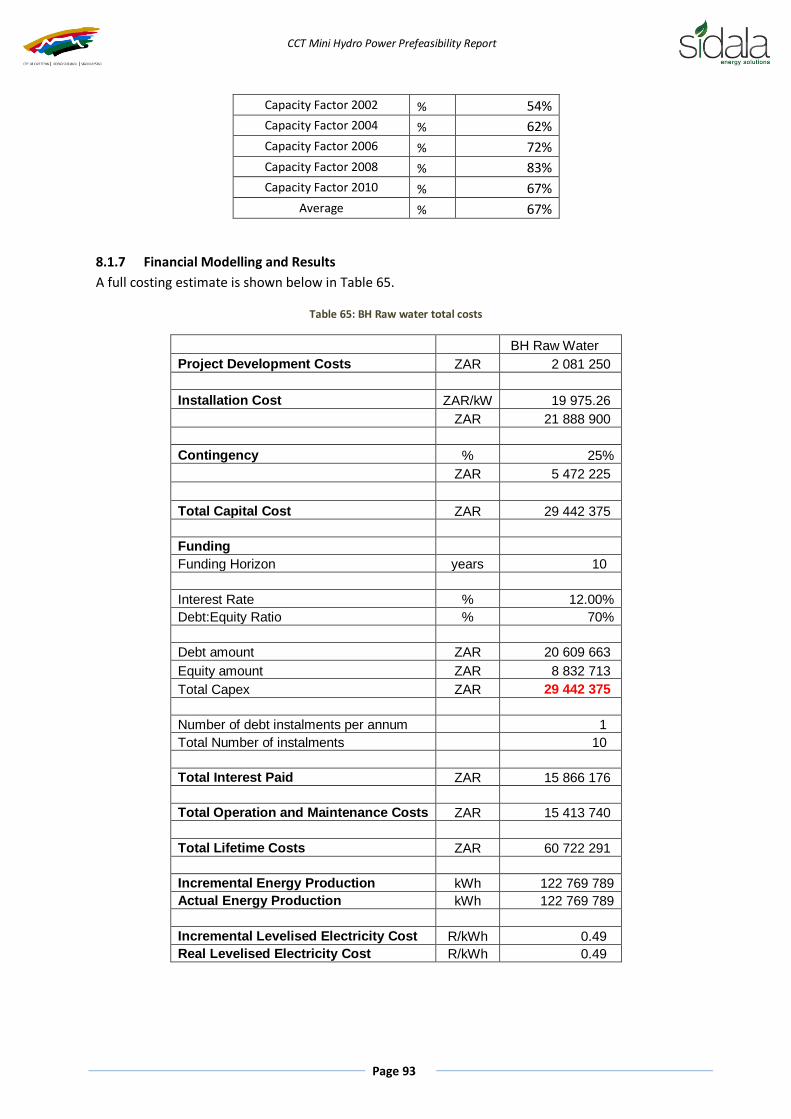
CCT Mini Hydro Power Prefeasibility Report
Page 93
Capacity Factor 2002 % 54%
Capacity Factor 2004 % 62%
Capacity Factor 2006 % 72%
Capacity Factor 2008 % 83%
Capacity Factor 2010 % 67%
Average % 67%
8.1.7 Financial Modelling and Results
A full costing estimate is shown below in Table 65.
Table 65: BH Raw water total costs
BH Raw Water
Project Development Costs ZAR 2 081 250
Installation Cost ZAR/kW 19 975.26
ZAR 21 888 900
Contingency % 25%
ZAR 5 472 225
Total Capital Cost ZAR 29 442 375
Funding Funding Horizon years 10
Interest Rate % 12.00%
Debt:Equity Ratio % 70%
Debt amount ZAR 20 609 663
Equity amount ZAR 8 832 713
Total Capex ZAR 29 442 375
Number of debt instalments per annum
1
Total Number of instalments
10
Total Interest Paid ZAR 15 866 176
Total Operation and Maintenance Costs ZAR 15 413 740
Total Lifetime Costs ZAR 60 722 291
Incremental Energy Production kWh 122 769 789
Actual Energy Production kWh 122 769 789
Incremental Levelised Electricity Cost R/kWh 0.49
Real Levelised Electricity Cost R/kWh 0.49
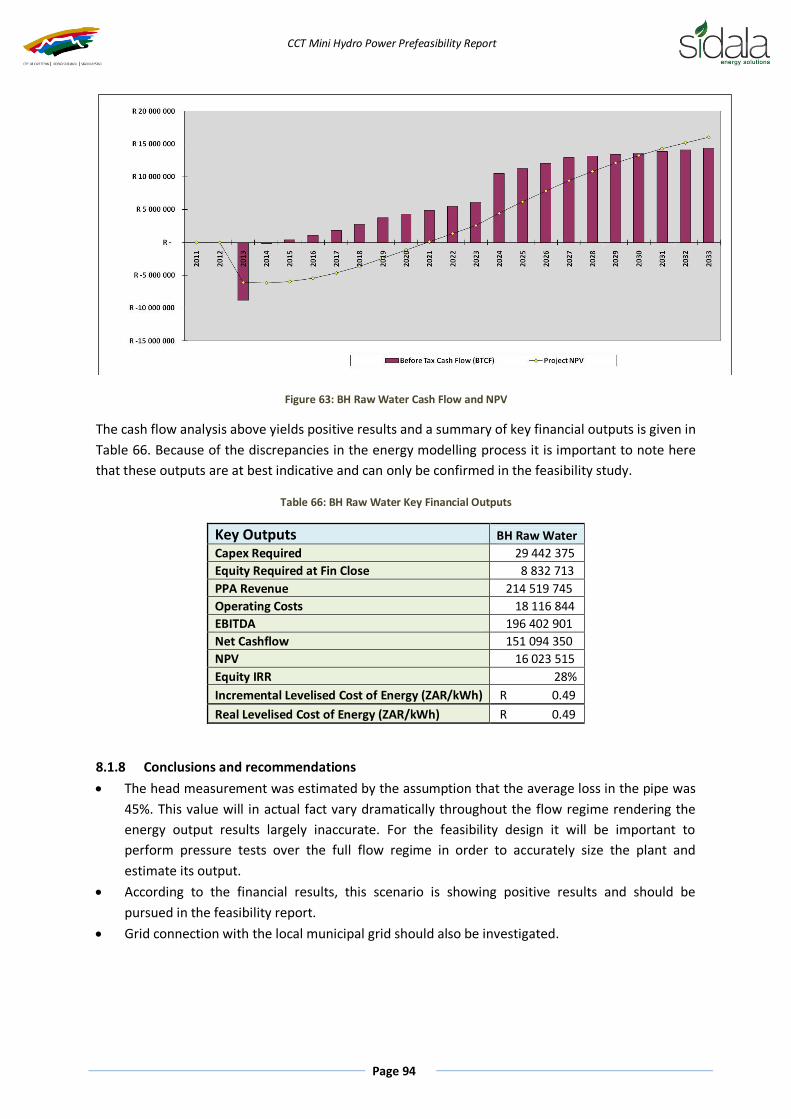
CCT Mini Hydro Power Prefeasibility Report
Page 94
Figure 63: BH Raw Water Cash Flow and NPV
The cash flow analysis above yields positive results and a summary of key financial outputs is given in
Table 66. Because of the discrepancies in the energy modelling process it is important to note here
that these outputs are at best indicative and can only be confirmed in the feasibility study.
Table 66: BH Raw Water Key Financial Outputs
Key Outputs BH Raw Water
Capex Required 29 442 375
Equity Required at Fin Close 8 832 713
PPA Revenue 214 519 745
Operating Costs 18 116 844
EBITDA 196 402 901
Net Cashflow 151 094 350
NPV 16 023 515
Equity IRR 28%
Incremental Levelised Cost of Energy (ZAR/kWh) R 0.49
Real Levelised Cost of Energy (ZAR/kWh) R 0.49
8.1.8 Conclusions and recommendations
The head measurement was estimated by the assumption that the average loss in the pipe was
45%. This value will in actual fact vary dramatically throughout the flow regime rendering the
energy output results largely inaccurate. For the feasibility design it will be important to
perform pressure tests over the full flow regime in order to accurately size the plant and
estimate its output.
According to the financial results, this scenario is showing positive results and should be
pursued in the feasibility report.
Grid connection with the local municipal grid should also be investigated.

CCT Mini Hydro Power Prefeasibility Report
Page 95
8.2 Blackheath Water Treatment Plant to the Upper Service Reservoir (BHWTW to
Upper)
8.2.1 Description
As the water exits the treatment works there is a small 8m drop before it enters the Upper Service
Reservoir. Figure 64 shows the aerial view of this drop.
Figure 64: Drop between the works and the Upper Service Reservoir
8.2.2 Data Used
8.2.2.1 Levels
The only reference to the head at this site is in the Terms of Reference which refers to an 8m drop
between the outlet of the treatment works and the upper reservoir. This drop has been used in the
design. A full investigation of the relative drop will need to be investigated here because of varying
level of the service reservoir.
8.2.2.2 Flow Rates
The flow into the upper service reservoir is the water coming in less the waste water from the works.
This waste water is very minimal and for the purposes of this investigation the same flow data for
the inlet is used. See Section 8.1.2.2.
8.2.3 Design Concept
“Low head” hydro is the term often used for a hydro scheme with a head between 5 and 20 m. A low
head hydro scheme requires a large passage/opening to accommodate a high volume of flow,
making low head turbines inevitably large in size and expensive consequently creating a number of
engineering challenges. In addition, low head schemes suffer from a high head fluctuation due to the
variation in headwater and tail water levels. This variation can mean that a head of 3 m is reduced to
1 m, thus reducing the system reliability and power output.
For this scheme at Blackheath, minimal infrastructure is needed. A power house will need to be built
to house the M&E Equipment as well as an intake structure and draft tube. Because of the low head
at this site a Kaplan Turbine would probably be most suited. The Kaplan is also suited for a large
variance in flow rate.

CCT Mini Hydro Power Prefeasibility Report
Page 96
8.2.4 Grid Connection
The grid connection assumption made here is that the plant will feed excess electricity into the grid
via the transformer and grid connection at the BH Raw Water Power House. It is assumed that the
distance is 0km with minimal connection infrastructure.
8.2.5 Works
This small turbine will require some hydraulic infrastructure as well as a small power house to house
the turbine and generator. For the financial modelling it has been assumed that the grid connection
costs will be covered by the Raw Water plant where the power generated at this Kaplan will be
stepped up and fed into the grid. A full electrical study will be able to determine this viability.
Table 67: Works BHWTW to Upper
BHWTW to Upper Item Specific Costs Item Cost
Civils R 2 000 000
Power House and Balance of Plant
R 2 000 000
Other Civil Works
R -
Hydro Mechanical Electrical R 2 800 000
M&E – Turbine full turnkey installation. Work here is typical Water-to Wire. (Design Concept for a 184kW Kaplan turbine) 184 R 15 228 R 2 800 000
Electricals and Grid Connection R 100 000
Transmission line 66kV 0
Substation/Other Electricals
R 100 000
Total R26 649 R 4 900 000
8.2.6 Design Summary
The actual energy delivered of 1 GWh is the average yearly output of the new plant operating at a
design capacity of 184 kW. This output was determined using the historical flow rate data since 1997
and can be seen in Table 69. The historical capacity factor is also shown. Table 68 is the design
summary.
Table 68: Design Summary (BHWTW to Upper)
BHWTW to Upper
Static Head m 8
Hydraulic losses % 5%
Rated Head m 7.6
Design Flow m3/s 3.40
Design Flow Ml/day 294
Turbine type
Kaplan
Runner Diameter m 0.82
Turbine Design Efficiency % 91%
Turbine Capacity kW 184
Annual Plant Downtime Losses % 5%
Theoretical Energy Delivered kWh 1 530 190
Actual Energy Delivered kWh 1 041 251
Capacity Factor % 68%

CCT Mini Hydro Power Prefeasibility Report
Page 97
Table 69: Design Results BHWTW to Upper
Design Results
Plant Design Capacity kW 184
Annual downtime losses % 5%
Theoretical Energy Delivered kWh 1 530 190
Edelivered 1998 kWh 1 038 823
Edelivered 2000 kWh 999 902
Edelivered 2002 kWh 880 464
Edelivered 2004 kWh 965 396
Edelivered 2006 kWh 1 115 073
Edelivered 2008 kWh 1 254 375
Edelivered 2010 kWh 1 034 727
Average kWh 1 041 251
Capacity Factor Theoretical % 100%
Capacity Factor 1998 % 68%
Capacity Factor 2000 % 65%
Capacity Factor 2002 % 58%
Capacity Factor 2004 % 63%
Capacity Factor 2006 % 73%
Capacity Factor 2008 % 82%
Capacity Factor 2010 % 68%
Average % 68%
8.2.7 Financial Modelling and Results
A full costing estimate is shown below in Table 70.
Table 70: BH Upper Total Costs
BHWTW to Upper
Project Development Costs ZAR 2 081 250
Installation Cost ZAR/kW 29 313.74
ZAR 5 390 000
Contingency % 25%
ZAR 1 347 500
Total Capital Cost ZAR 8 818 750
Funding Funding Horizon years 10
Interest Rate % 12.00%
Debt:Equity Ratio % 70%
Debt amount ZAR 6 173 125

CCT Mini Hydro Power Prefeasibility Report
Page 98
Equity amount ZAR 2 645 625
Total Capex
8 818 750
Number of debt instalments per annum
1
Total Number of instalments
10
Total Interest Paid ZAR 4 752 329
Total Operation and Maintenance Costs ZAR 2 586 391
Total Lifetime Costs ZAR 16 157 470
Incremental Energy Production kWh 20 825 028
Actual Energy Production kWh 20 825 028
Incremental Levelised Electricity Cost R/kWh 0.78
Real Levelised Electricity Cost R/kWh 0.78
Figure 65: BHWTW to Upper NPV and Cash Flows
Figure 65 above shows that the investment yields positive results after about 19 years. The financial
results could definitely be improved if for example, the operating costs from the plant were borne by
the BH Raw Water inlet turbine.

CCT Mini Hydro Power Prefeasibility Report
Page 99
Table 71: BH Upper Key Financial Outputs
Key Outputs BHWTW to Upper
Capex Required 8 818 750
Equity Required at Fin Close 2 645 625
PPA Revenue 36 388 266
Operating Costs 3 039 966
EBITDA 33 348 300
Net Cashflow 19 777 221
NPV 175 233
Equity IRR 14%
Incremental Levelised Cost of Energy (ZAR/kWh) R 0.78
Real Levelised Cost of Energy (ZAR/kWh) R 0.78
8.2.8 Conclusions and recommendations
It is recommended that this plant is developed further and taken to the feasibility study.
Cost savings in the Capex can be found as well as in the development costs and operating
costs that would make the investment more attractive.
8.3 Blackheath Lower Reservoir Inlet (BH Upper to Lower)
8.3.1 Description
From the Upper Service Reservoir there is a 1500mm pipeline dropping from 174.5 to 110.58m MSL.
This pipeline sees a flow of between 100 and 300 Ml/day and the draw closely follows the residential
water demand.
8.3.2 Current Turbine Operation
There is an existing turbine at this inlet that was designed to meet the requirements of the plant.
This turbine is designed to a capacity of 712kW (unconfirmed - gearbox input rating) and is not
operating to its full potential. It is shown in Figure 66.

CCT Mini Hydro Power Prefeasibility Report
Page 100
Figure 66: Blackheath Lower Reservoir inlet Turgo Turbine
No information about the current turbine or its operation could be found. According to the staff at
Blackheath, the current turbine operates at 100Ml/day minimum and usually stays quite constant.
Using this assumption of 100Ml/day operation and using historical flow data, the following are the
calculated turbine outputs and are used as the base case for the design concept. The incremental
energy generated will be used to calculate the financial viability. It is advised that, for the feasibility
study, a full energy audit of the plant is performed in order to find the true incremental/excess
production from the proposed design concepts.
Table 72: Blackheath Lower Res Inlet Turbine Data
Manufacturer Gilbert Gilkes & Gordon
Type Turgo Average Flow 1.16 m3/s
Average Flow 100 Ml/day
Rated Head 59 m
Average Turbine Power Output 537 kW
Theoretical Energy Output 6 219 600 kWh
Current Energy Production 3 294 928 kWh
Capacity Factor 53%
8.3.3 Data Used
8.3.3.1 Levels
The levels used here are the same levels given in the Terms of Reference.

CCT Mini Hydro Power Prefeasibility Report
Page 101
Table 73: Head Levels
Upper Reservoir 174.5 m
Lower Reservoir Inlet 110.58 m
Static Head 63.92 m
8.3.3.2 Flow Rates Table 74: Flow Summary BH Upper to Lower
Min Flow m3/s 1.2
Min Flow Ml/day 100
Max Flow m3/s 3.5
Max Flow Ml/day 300
Average Flow m3/s 1.9
Average Flow Ml/day 167.0
Figure 61 shows the flow duration curve at three gauges over the period 1997-2011. The water that
flows into the Lower Reservoir is the water that is measured flowing from the Upper to the Lower
Reservoir less the water flowing out the High Pressure Outlet that supplies Newlands Reservoir with
water. There is no measuring gauge at the turbine inlet.
8.3.4 Design Concept - Increase Production (BH Upper to Lower 1)
There is a lot of water at this existing turbine that is currently being diverted away from the turbine
to the lower reservoir. This could be fed through the existing turbine and used to generate extra
capacity that could be fed into the grid.
8.3.4.1 Works
The only works that would be required here is a simple grid connection, this has been assumed to be
a 1km line that would connect to other Blackheath turbine transformer where it will be stepped up
and fed into the existing grid. For financial modelling purposes the cost of a 22kV line has been
assumed. It may be found during the feasibility study a turbine refurbishment would be required.
These costs have not been taken into account.

CCT Mini Hydro Power Prefeasibility Report
Page 102
Table 75: Works BH Upper to Lower 1
BH Upper to Lower 1 Item Specific Costs Item Cost
Civils
None
R -
Hydro Mechanical Electrical
None
R -
Electricals and Grid Connection R 370 000
Transmission line 66kV 1 R 230 000 R 230 000
Substation/Other Electricals
R 140 000
Total R 370 000
8.3.5 Design Concept – Turbine Replacement (BH Upper to Lower 2)
Because the turbine is only designed at a flow rate of 1.5 m3/s (unconfirmed – no data sheet
available), there is a significant amount of water that is being bypassed, especially during times of
high flow. This option would entail a complete replacement of the turbine and generating
equipment that will be able to handle higher flow rates.
The capacity of the plant would only nominally increase to 932kW (from 710 kW).
8.3.5.1 Works
Table 76 shows the assumed item costs for this design concept.
Table 76: Works BH Upper to Lower 2
BHUpper to Lower 2 Item Specific Costs Item Cost
Civils R 3 500 000
Civil works required to accommodate the replacement turbine.
R 1 000 000
Balance of Plant
R 2 500 000
Hydro Mechanical Electrical R 7 550 329
M&E – Turbine full turnkey installation. Work here is typical Water-to Wire. (Design Concept for a 932kW Francis turbine but design should consider replacing with a Turgo) 932 R 8 098 R 7 550 329
Electricals and Grid Connection R 370 000
Transmission line 66kV 1 R 230 000 R 230 000
Substation/Other Electricals
R 140 000
Total R 12 248 R 11 420 329
8.3.6 Grid Connection
It is assumed that this plant will be connected to in a similar way to the BH Raw Water to Upper
concept, i.e. stepped up at the Raw Water Power Plant and fed into the grid there. This can only be
confirmed during the feasibility study. For modelling purposes a 1km, 22kV line cost was assumed.
8.3.7 Design Summary
The actual energy delivered of 4.4 GWh is the average yearly output of the new plant operating at a
design capacity of 932 kW. This output was determined using the historical flow rate data since 1997
and can be seen in Table 77. The historical capacity factor is also shown.

CCT Mini Hydro Power Prefeasibility Report
Page 103
Table 77: BH Upper to Lower 2 Energy Results
Design Results
Plant Design Capacity kW 932
Annual downtime losses % 5%
Theoretical Energy Delivered kWh 7 759 567
Edelivered 1998 kWh 4 056 807
Edelivered 2000 kWh 4 566 470
Edelivered 2002 kWh 4 331 297
Edelivered 2004 kWh 4 418 684
Edelivered 2006 kWh 4 525 005
Edelivered 2008 kWh 5 853 234
Edelivered 2010 kWh 3 563 107
Average kWh 4 473 515
Capacity Factor Theoretical % 100%
Capacity Factor 1998 % 52%
Capacity Factor 2000 % 59%
Capacity Factor 2002 % 56%
Capacity Factor 2004 % 57%
Capacity Factor 2006 % 58%
Capacity Factor 2008 % 75%
Capacity Factor 2010 % 46%
Average % 58%
Table 78 below illustrates the difference in production from the existing operation to the existing
turbine design capacity. This increase is 1 GWh/annum or a 32% increase. Although the turbine
should theoretically generate 6.2 GWh/annum it could only produce 4.3 GWh due to the calculated
70% capacity factor.
By replacing the turbine (BH Upper to Lower 2) the plant would generate a slight incremental to its
current design operation (BH Upper to Lower 1) and is likely to be financially unfeasible.
Table 78: Blackheath Upper to Lower Design Summary
BH Upper
to Lower C
BH Upper
to Lower 1
BH Upper
to Lower 2
Static Head m 64 64 64
Hydraulic losses % 5% 7% 7%
Rated Head m 60 60 60
Design Flow m3/s 1.16 1.53 2.00
Design Flow Ml/day 100 132 173
Turbine type
Turgo Turgo Francis
Runner Diameter m * * 0.64
Turbine Design Efficiency % * * 88%

CCT Mini Hydro Power Prefeasibility Report
Page 104
Turbine Capacity kW 537 710 932
Annual Plant Downtime Losses % 5% 0% 5%
Theoretical Energy Delivered kWh 6 219 600 6 219 600 7 759 567
Actual Energy Delivered kWh 3 294 928 4 353 720 4 473 515
Capacity Factor % 53% 70% 58%
Actual Increase from Current Generation kWh - 1 058 792 1 178 587
% Increase % - 32% 36%
Figure 67 below shows the power output for the 3 Blackheath sites. The third site considered in the
comparison is BH Upper to Lower 2. Although this is the least feasible, it is shown for illustration
purposes. BH Upper to Lower 1 should yield very similar results.
Figure 67: Blackheath Power output 3 sites
8.3.8 Financial Modelling and Results
Table 79 below compares the total costs for the two schemes.

CCT Mini Hydro Power Prefeasibility Report
Page 105
Table 79: Total Costs BH Lower Res Inlet
BH Upper to Lower 1 BH Upper to Lower 2
Project Development Costs ZAR 2 081 250 2 081 250
Installation Cost ZAR/kW 573.24 13 472.91
ZAR 407 000 12 562 362
Contingency % 25% 25%
ZAR 101 750 3 140 590
Total Capital Cost ZAR 2 590 000 17 784 202
Funding Funding Horizon years 10 10
Interest Rate % 12.00% 12.00%
Debt:Equity Ratio % 70% 70%
Debt amount ZAR 1 813 000 12 448 941
Equity amount ZAR 777 000 5 335 261
Total Capex ZAR 2 590 000 17 784 202
Number of debt instalments per annum
1 1
Total Number of instalments
10 10
Total Interest Paid ZAR 1 395 723 9 583 714
Total Operation and Maintenance Costs ZAR 9 986 997 13 115 545
Total Lifetime Costs ZAR 13 972 719 40 483 461
Incremental Energy Production kWh 21 175 840 23 571 737
Actual Energy Production kWh 87 074 400 89 470 297
Incremental Levelised Electricity Cost R/kWh 0.66 1.72
Real Levelised Electricity Cost R/kWh 0.16 0.45

CCT Mini Hydro Power Prefeasibility Report
Page 106
Figure 68: BH Upper to Lower 2 NPV and Cash Flow
Table 80 and Figure 68 show the positive results of the investment. Noted here is the particularly
high IRR of 54% being due to the low estimated infrastructure costs.
Table 80: BH Upper to Lower 2 Key financial results
Key Outputs BH Upper to Lower 1
Capex Required 2 590 000
Equity Required at Fin Close 777 000
PPA Revenue 37 001 251
Operating Costs 3 303 029
EBITDA 33 698 222
Net Cashflow 29 712 499
NPV 4 279 048
Equity IRR 54%
Incremental Levelised Cost of Energy (ZAR/kWh) R 0.66
Real Levelised Cost of Energy (ZAR/kWh) R 0.16
8.3.9 Conclusions and recommendations
There is a certain amount of energy that can be fed into the grid. To estimate this potential
accurately, a full energy audit of the treatment works is recommended.
Concept BH Upper to Lower 1 is recommended for further investigation in the Feasibility
study.

CCT Mini Hydro Power Prefeasibility Report
Page 107
9 Summary of Results The following is a list of feasible sites.
Table 81: Feasible Sites
List of Feasible Sites
1 Steenbras Water treatment works to break pressure tanks 810, 840
2 Steenbras Lower Dam to Steenbras Water treatment works 2
3 Wemmershoek water treatment works
4 Blackheath Raw Water Inlet
5 Blackheath Water Treatment Works to Upper Service Reservoir
6 Blackheath Upper reservoir to Lower Reservoir 1
7 Faure water treatment works 2
The plant to be situated at the 760 break pressure tank at Steenbras did not yield positive
investment results but it is still worth investigating further in the feasibility study.
Neither of the Rockview concepts seem feasible at this stage and should not be investigated
at this point in time.
Table 82 is a summary of all the sites that should be investigated further in the feasibility
study following the outcomes of this prefeasibility. Table 83 summarises the financial results
for these sites.
Figure 69 to Figure 72 shows a summary of the Capex, Cost of Electricity, NPV and Equity IRR
for the sites to be further assessed.

CCT Mini Hydro Power Prefeasibility Report
Page 108
Table 82: Summary of design results for sites to be further investigated
SB Lower Dam to SBWTW C
SB Lower Dam to SBWTW 2
SBWTW to 760
SBWTW to 810, 840
BH Raw Water
BHWTW to Upper
BHUpper to Lower C
BHUpper to Lower 2
Wemmers-hoek C
Wemmers-hoek 1 Faure C Faure 2
Static Head m * 55 172 74 77 8 64 64 * 35 * *
Hydraulic losses % * 15% 10% 10% 45% 5% 5% 7% * 10% * 5%
Rated Head m 34 48 155 66 42 7.6 60 60 28 31 130 124
Design Flow m3/s 0.66 1.60 0.18 1.50 3.40 3.40 1.16 2.00 0.46 2.50 1.16 2.50
Design Flow Ml/day 58 138 16 130 294 294 100 173 40 216 100 216
Turbine type
2 xTurgo Francis Pelton Pelton Francis Kaplan Turgo Francis Francis Francis Turgo Francis
Runner Diameter m 0.53 0.57 0.22 0.58 0.82 0.82 0.71 0.79 0.71
Turbine Design Efficiency % * 87% 91% 87% 86% 91% * 88% * 85% * 90%
Turbine Capacity kW 179
605
228
784
1 096
184
537
932
207
576
1 174
2 441
Annual Plant Downtime Losses % * * 5% 5% 5% 5% 5% 5% 5% 5% * 5%
Theoretical Energy Delivered kWh
2 508 864
5 035 791
1 896 047
6 521 722
9 119 251
1 530 190
6 219 600
7 759 567
1 544 356
4 795 447
12 921 000
20 316 175
Actual Energy Delivered kWh
788 196
2 532 311
767 260
4 266 995
6 138 489
1 041 251
3 294 928
4 473 515 *
3 596 066
7 772 310
13 445 706
Capacity Factor % 31% 50% 40% 65% 67% 68% 53% 58% 75% 60% 66%
Actual Increase from Current Generation kWh -
1 744 116 - - - - -
1 178 587 -
2 051 711 -
5 673 396
% Increase % - 221% - - - - - 36% - 133% - 73%

CCT Mini Hydro Power Prefeasibility Report
Page 109
Table 83: Summary of financial results for sites to be further investigated
Key Outputs SB Lower Dam to SBWTW 2
SBWTW to 760
SBWTW to 810, 840
BH Raw Water
BHWTW to Upper
BHUpper to Lower 1
Wemmershoek Faure 2 total
Capex Required 10 497 625 8 395 250 19 858 625 29 442 375 8 818 750 2 590 000 14 284 375 24 005 625 110 122 827
Equity Required at Fin Close 3 149 288 2 518 575 5 957 588 8 832 713 2 645 625 777 000 4 285 313 7 201 688 33 036 848
PPA Revenue 60 951 029 26 813 190 149 117 267 214 519 745 36 388 266 37 001 251 71 700 451 198 266 275 603 042 102
Operating Costs 10 004 401 3 766 800 12 956 439 18 116 844 3 039 966 3 303 029 9 526 918 40 361 314 93 339 250
EBITDA 50 946 628 23 046 390 136 160 828 196 402 901 33 348 300 33 698 222 62 173 533 157 904 961 544 281 910
Net Cashflow 34 791 947 10 127 031 105 600 606 151 094 350 19 777 221 29 712 499 40 191 463 120 962 965 255 770 682
NPV 2 171 023 -1 437 295 11 471 378 16 023 515 175 233 4 279 048 1 707 157 12 276 372 7 130 424
Equity IRR 19% 8% 29% 28% 14% 54% 17% 27% 27%
Incremental Levelised Cost of Energy (ZAR/kWh)
R 0.71
R 1.05
R 0.49 R 0.49
R 0.78
R 0.66
R 0.73
R 0.63
R 0.62
Real Levelised Cost of Energy (ZAR/kWh)
R 0.49
R 1.05
R 0.49 R 0.49
R 0.78
R 0.16
R 0.42
R 0.27
R 0.38

CCT Mini Hydro Power Prefeasibility Report
Page 110
Figure 69: Capex Summary
Figure 70: Cost of Electricity Summary
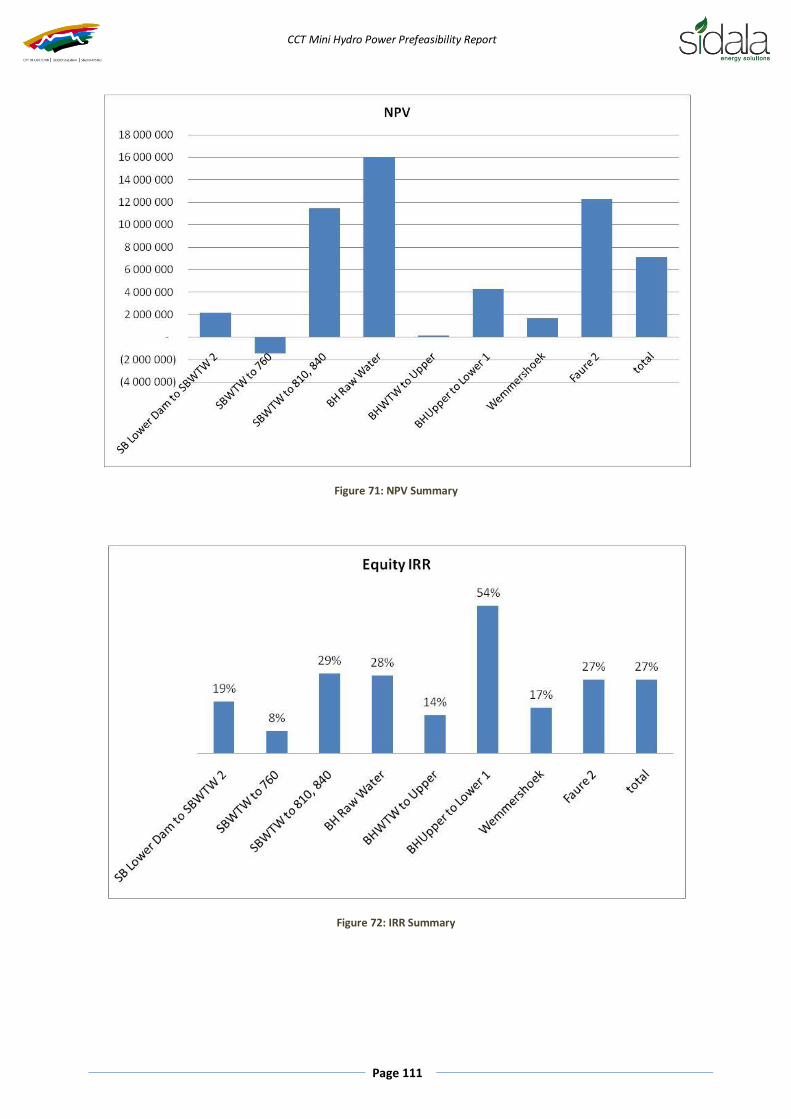
CCT Mini Hydro Power Prefeasibility Report
Page 111
Figure 71: NPV Summary
Figure 72: IRR Summary

CCT Mini Hydro Power Prefeasibility Report
Page 112
10 Project Plan The Project Plan concerns the cycle of the Project, and highlights elements to be considered for
phasing the optimal cycle. A typical project financed greenfields hydropower project is phased as
shown Figure 73:
Figure 73: Project Cycle
Optimization is largely driven by the technical elements, which, during the total cycle of the Project,
include:
Prefeasibility Design
Feasibility Design
Tender Design
Detailed Design (sometimes tender and detailed design are merged into a single item)
Procurement
Contract Management (Project Management, Monitoring, Quality Control)
Contracting
Operation and Maintenance
Each technical item will occur within a phase of the project cycle. Each project phase has a different
intention, and it is important that the technical items are scoped in such a way that the right level of
detail is achieved according to spending levels appropriate to the phase of development.
An alternative is to combine the Tender and Detailed Design components into a single design phase
post financial close. This is shown in Figure 74.
Figure 74: Alternate Project Cycle

CCT Mini Hydro Power Prefeasibility Report
Page 113
This has the following advantages:
Development costs are reduced because the scope and level of detail of the technical work
in the Development Phase is reduced. The more complex design work is then budgeted for
within the Implementation Capex which has a lower risk associated with it, reducing the
financial burden on the project as a whole.
It will allow the Tender and Detail design phases to merge into a single item, also reducing
cost and time.
It leaves flexibility in the final designs so that if an IPP becomes the proponent (in the event
that a PPP is the selected procurement mechanism), the IPP will have the chance to input
into the design process.
However, this approach has challenges in a Project Finance context. Lenders are less likely to be
satisfied with future cashflows based on Capex and production estimates resulting from feasibility
level design. However, in a Corporate Finance structure this approach is acceptable because the
Lender’s security is based on the Proponent’s balance sheet. Hence the phasing of technical
elements is based on the Project structure see section 12.
Given the focus on PPPs in this report, a Project Finance structure is more appropriate. This decision
must however be made by the Proponent after consideration of project structural and finance.
11 Project Leadership and Management
Leadership and Management are performed by the Proponent (or Sponsors/Owners/Shareholder).
This is because the work is core to project ownership and leadership from the head of the project is
therefore critical to ensuring that the final product is in the desired form. In the Private Sector this
role is performed by the Developer.
This role is particularly significant in the Development Phase because this is the most formative stage
in the project cycle. Alignment of low level details during the development of the project with high
level strategic objectives is essential to ensure that the final product is in the desired form.
11.1 Scope
The scope of work of the Proponent is varied and the requirement is for a multi-skilled team with
understanding of financial, technical, commercial, legal, and statutory elements. Management and
communication skills are essential as the Proponent must interact with a large number of individuals
and teams conducting the various components of the Development Phase.
11.1.1.1 Strategic Guidance
The Proponent must provide the high level and long term strategic guidance necessary for the
Project’s success. This includes:
Monitoring Project landscape and ongoing risk assessment and opportunity identification
Managing strengths and weaknesses of the Project
Decision making
Sourcing and entering beneficial alignments with partners and subcontractors

CCT Mini Hydro Power Prefeasibility Report
Page 114
11.1.1.2 Project Management
Management of all Project phases to ensure:
o The high level outputs of each phase occur on time and on budget
o Lower level tasks are feeding into the high level program
o All interdependencies between components are managed
o Sufficient flow of information horizontally and vertically in the Project structure
In the Development Phase this includes, but is not limited to the components:
o Environmental
o Technical
o Carbon
o Legal
o Commercial and Financial
Financial management of the Development budget, payment authorisations etc
Secretarial, ensuring all communications, proofs, are documented etc
11.1.1.3 Financial Modelling
A bankable financial model must be constructed, providing accurate insight into financial
characteristics of the Project. Skilful financial engineering can create significant value for the
Proponent, enabling:
Early recognition of threats to financial viability
Optimal presentation of the Project to financiers
Evaluation of complex agreements with subcontractors and financiers
It is possible to source financial modelling skills externally, but the work is core to the role of the
Proponent and ideally is sourced internally.
11.1.1.4 Commercial Arrangement
The success of the Project hinges on the Proponent’s ability to execute key Project Agreements.
Although assisted by the Project’s Legal Counsel, the Proponent is ultimately responsible for the
sourcing and execution of the requisite commercial arrangements. These include but are not limited
to the Project Documentation and Project Finance Agreements described in Legal TOR. The
Proponent is also responsible for packaging of the Project for financiers and the preparation of Bids
necessary to secure offtake agreements.
11.2 Project Program
A program was constructed to illustrate the path ahead for the Project. It is assumed for illustrative
purposes that the Development Phase begins at the start of 2012. The project cycle from this point
onwards has been estimated as shown in Figure 75.

CCT Mini Hydro Power Prefeasibility Report
Page 115
Figure 75: Project Program
This estimation shows the duration of the individual phases and the project as a whole. Note that
both the Development and Implementation Phases are estimated to take a little over one and a half
years each, and the Operation Phase to commence in the first half of 2015, a little over three years
after the start of the Feasibility Study.
Note also that this is a somewhat simplistic program which considers all the sites under
consideration as a single project. In reality, some of the smaller and less complex sites will progress
more quickly through all phases. This estimation is therefore conservative and is representative of
the most complex site under consideration. All the sites can be expected to be operational within
the timeframe indicated here.
11.3 Development Phase
The Development Phase typically begins following a Prefeasibility Study indicating good potential for
further development. The completion of the Development Phase is marked by the financial close of
the project. At this point the complete detail of the proceeding Implementation Phase is ready for
immediate execution; and the required Capex is committed and available to be drawn down.
Figure 76: Development Phase
The Development Phase typically include the sequenced components:
1. Feasibility Study

CCT Mini Hydro Power Prefeasibility Report
Page 116
2. Tender Design
3. Procurement
The Commercial and Legal component is not in sequence with the other components, but instead
largely tracks the other components.
11.3.1 Feasibility Study
The feasibility study produces certainty on all relevant project components and reduces risk
sufficiently for expenditure on greater levels of design (either Tender or Detailed design). It involves
all work necessary to bring the level of knowledge to the point at which future phases of the Project
can commence and compliance requirements are filled. The work has requirements for technical,
carbon (technical and industry), environmental and legal skills. All statutory requirements are
investigated and applications made to ensure compliance, and outcomes are contained within legal
documentation.
11.3.1.1 Feasibility Design
The Feasibility Design enables the Project to determine the scope of its activities and apply for
environmental authorisation, as well as provide more solid cost and revenue information. The
Feasibility Design expands on the Prefeasibility Design. The typical scope includes:
Assess Head to bankable confidence levels
Assess Flow to bankable confidence levels
Selection of a preferred option from the options identified in the Prefeasibility Design.
Optimisation of the preferred layout and design to feasibility level, including:
o Electromechanical
o Electrical
o Civil
o Hydrological
o Geotechnical
Perform hydraulic modelling of the preferred option
Project production based on preferred option
Compile Bill of Quantities (BOQ) and provide cost estimate to +-10%
Identify major technical risks at each site
Compile program for the implementation of the preferred option
11.3.1.2 Environmental Authorization
The Environmental Authorization work ensures that the Project is environmentally compliant. The
Environmental component is carried out by an EAP and the scope includes:
Notify Authorities of Project
Conduct Public Participation process according to regulations
Draft Basic Assessment Report (BAR)
Submit Basic Assessment Report and manage interaction with the relevant Authority until
ROD

CCT Mini Hydro Power Prefeasibility Report
Page 117
11.3.1.3 Feasibility Design and Environmental Authorization Program
The Feasibility Design and Environmental Authorization determine the duration of the Feasibility
Study. The estimated program for these two components is shown Figure 77.
Figure 77: Feasibility Study Program
11.3.2 CDM
Although not listed nor necessarily a part of the project cycle, the CDM component is considered
here because it is initiated and managed concurrently with technical and environmental components
in the feasibility study. The CDM project can be thought of as a parallel yet separate activity to the
Project. This is in line with the exclusion of CDM income from the financial models when assessing
the viability of the Project. If successful, the CDM revenue is “cream on top” of an already viable
project. The CDM component is usually carried out by a Carbon Consultant and the scope includes:
Confirm Project eligibility under CDM
Select optimal CDM project structure
Prepare Preliminary Estimates of GHG Reductions and Determine Their Market Value
Draft PIN and obtain DNA letter of no objection
Conduct CDM Public Participation according to relevant regulations
Develop Project Design Document (PDD)
Assist with engaging a DOE and facilitate Validation process and Registration
The CDM Project program has been estimated as shown in the figure below. The CDM component is
also not on the critical path for the project and hence does not drive the duration of the
Development or any other phase. The estimated CDM program is shown in Figure 78 alongside the
Project Program.

CCT Mini Hydro Power Prefeasibility Report
Page 118
Figure 78: CDM Program
11.3.3 Tender Design
The purpose of Tender Design is to progress the design to a point at which Implementation contracts
can be procured. This involves production of tender drawings and associated documentation.
11.3.4 Procurement
Electromechanical and Civil implementation contracts must be procured. The tender process
includes:
Publish Tender Documentation
Evaluate bids
Select Preferred Bidder
Negotiate Contract
Draft Contract
Award and execute contract
11.3.5 Commercial and Legal
As mentioned, the Commercial and Legal component largely tracks the phased activities.
Throughout the Development Phase the Project’s Legal Counsel supports the phased activities.
The work of the Legal Counsel consists of drafting, reviewing, negotiating and commenting on:
Project Documentation, such as PPA, Implementation Agreements, Shareholder’s
Agreement etc
Project Finance, which puts in place all the commercial agreements necessary to reach
financial close.
The Project Legal Counsel works in close proximity to the Proponent on the necessary agreements.
The Proponent must ensure all agreements are executed in line with the Project Program.
11.3.6 Development Phase Program
The Development Phase Program is shown in Figure 79.

CCT Mini Hydro Power Prefeasibility Report
Page 119
Figure 79: Development Phase Program
The execution of agreements and first draw down of Capex is possible on the back of successful
completion of all Development Phase work. Financiers will not commit unless it is shown in the due
diligence process that the project is compliant in all respects. If non-compliance is discovered later
in the project cycle the costs are far higher hence Project Finance places high requirements on the
ground work being exhaustively completed during the Development Phase.
11.4 Implementation Phase
The Implementation Phase is concerned with the execution of the Works. It is complete when the
plant reaches full operation.
11.4.1 Detailed Design
Detailed Design involves production of detailed construction drawings and review of manufacturer’s
equipment drawings in order for the contractors to execute the works.
11.4.2 Contracting
Contracting involves the physical execution of the works, including:
Civil Construction
Electromechanical supply and installation
Balance of Plant
There is also a requirement for professional services including Project Management, Construction
Monitoring, quality control and site closure. This is typically performed by the Engineering Consultancy.
11.4.3 Commissioning
The Implementation Phase is complete after commissioning when the plant will be delivering energy
to the grid. Commissioning involves grid synchronisation of the plant, handover to Operators.
CCT Mini Hydro Power Prefeasibility Report
Page 120
12 Project Structure Correct structuring, or commercial arrangement, is central to establishing a successful project. The
structure will determine:
Who the “Proponents” (or Sponsors/Owners/Shareholders) are
The entity which will be the contracting party for all project work, usually a “Project SPV” or
“Project Company”
Risk allocation between Proponents, Subcontractors to the Project Company, and
counterparties to the Project Company
The source, routes and destination of Development Finance, Capex, Opex and income
associated with the project.
It is important that structuring occurs upfront as it can be costly to alter it at a later stage, but most
significantly, momentum of the project can be severely damaged without clear buy in and role
definition among the Proponents. The structure may take a different form in Development,
Implementation and Operation phases. These differences need to be identified as early as possible.
The Legal counsel must document the structure and commercial arrangements as early as possible
to govern all activity going forward.
CCT is currently the Proponent of the Project, and must decide on the mechanism for procurement
of the Project going forward. This may be through either an internal or external mechanism. Key
factors to consider in making this decision are:
Affordability of the mechanism
Value-for-money achieved through the mechanism
Risk assumed by CCT through the mechanism
The scope of this study included consideration of “the optimal manner in which to structure and
manage the project, in order to shift risk and financing from the municipality onto the private sector
providers” with specific focus on a PPP as the mechanism of procurement. As such, PPPs are a
prominent focus in this study.
Firstly, PPPs are briefly introduced in terms of fundamental objectives, legal grounding, proces and
typical characteristics. Secondly, building on this, a specific PPP model has been identified as a
possible structure through which the hydropower potential in the Bulk Water system may be
exploited.
12.1 Introduction to PPPs
Luel Culwick and Christiaan Bode from Sidala attended the PPP Foundation Training Course run by
National Treasury’s PPP Unit in Midrand on the 23rd and 24th June 2011. The PPP Unit has produced
a number of useful publications on PPPs, most particularly the PPP Manual and the Municipal
Service Delivery and PPP Guidelines which are used extensively in this report.
PPPs are structures which provide integration between Public and Private sectors for a collective
good. The public receives higher quality, more cost-effective services from their governing institution
while the private party receives a business opportunity.

CCT Mini Hydro Power Prefeasibility Report
Page 121
A PPP is legally defined as:
A contract between a Public Institution and Private Party
The Private Party performs an institutional function and/or uses state property in terms of
output specifications
Substantial project risk (financial, technical, operational) transferred to the Private Party
The Private Party benefits through: unitary payments from government budget and/or user
fees
A PPP is somewhere between simple outsourcing and full privatisation in terms of the degree of risk
transferred to the Private Party. In outsourcing, the Institution retains purchases goods or services
but retains financial, technical and operational risk. In privatisation, state assets and liabilities are
sold, leaving only the regulatory function to the Institution. In between these two models, a PPP
allows financial, technical and operational risk to be transferred to the private party which has
responsibility for outputs while the Institution retains ownership of assets.
The typical structure of a PPP is shown in Figure 80:
Figure 80: PPP structure
Whatever the PPP type, structure, payment mechanism, or sources of funding, all South African PPPs
are subjected to three tests:
1. Can the Institution afford the deal?
2. Is it a value-for-money solution?

CCT Mini Hydro Power Prefeasibility Report
Page 122
3. Is substantial technical, operational and financial risk transferred to the Private Party?
The PPP process is highly regulated and prescribed as indicated in Figure 81.

CCT Mini Hydro Power Prefeasibility Report
Page 123
Figure 81: PPP Process
This brief introduction is expanded on in greater detail in Appendix C PPPs in South Africa.

CCT Mini Hydro Power Prefeasibility Report
Page 124
12.2 PPP for CCT Small Hydro
A PPP is an external mechanism which CCT can use to procure the hydropower projects. The likely
characteristics of a PPP tailored specifically for the Project are discussed here.
12.2.1 Proposed PPP Structure
Figure 82 shows the proposed PPP structure. It closely resembles the standard form of PPP
agreements.
Figure 82: CoCT PPP Structure
The PPP agreement provides for the commercial use of Public Property (CCT Bulk Water
Infrastructure) by the Private Party (IPP). The terms of the agreement will include the following:
The basis of the agreement is to provide tenure to the IPP over CCT assets required for
hydroelectric generation, which the IPP will develop and operate for a profit. In return, the
IPP will pay CCT for this tenure
It is suggested that the IPP receive tenure over via a lease infrastructure in order to generate
power.
Infrastructure required includes:
o Land on which the plant will be located
o Existing buildings within which plant will be located
o Water conveyance infrastructure
o Existing power generation assets
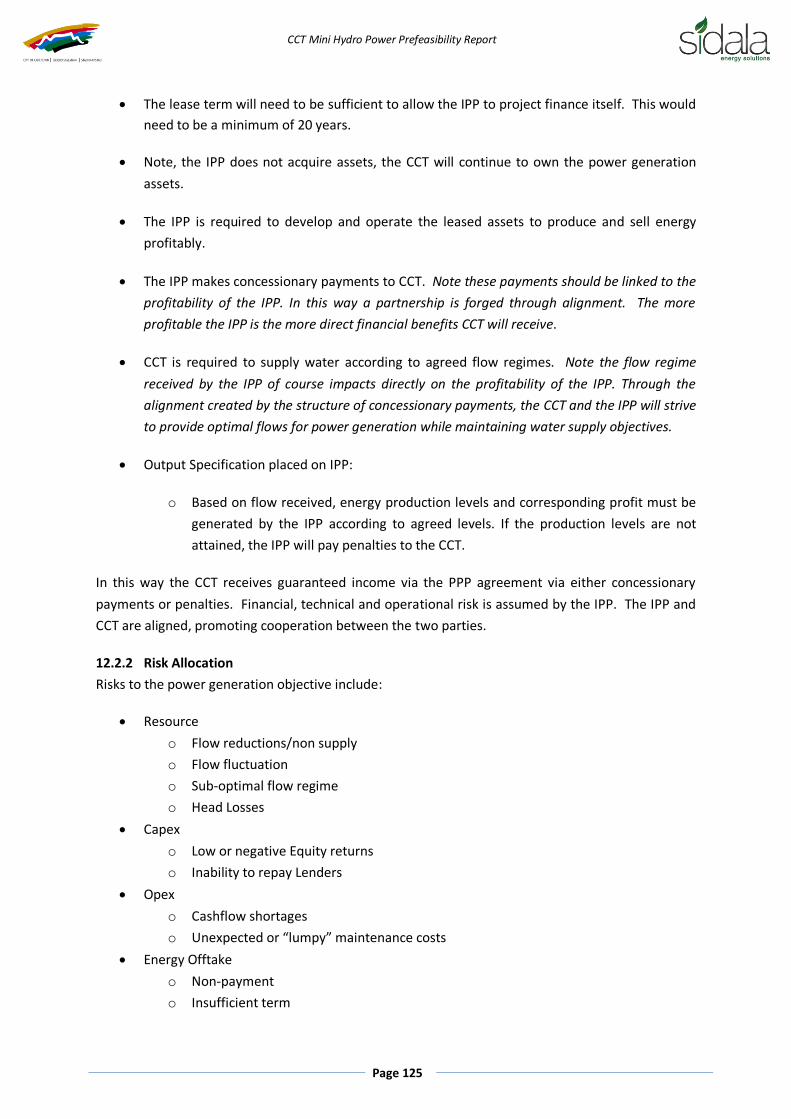
CCT Mini Hydro Power Prefeasibility Report
Page 125
The lease term will need to be sufficient to allow the IPP to project finance itself. This would
need to be a minimum of 20 years.
Note, the IPP does not acquire assets, the CCT will continue to own the power generation
assets.
The IPP is required to develop and operate the leased assets to produce and sell energy
profitably.
The IPP makes concessionary payments to CCT. Note these payments should be linked to the
profitability of the IPP. In this way a partnership is forged through alignment. The more
profitable the IPP is the more direct financial benefits CCT will receive.
CCT is required to supply water according to agreed flow regimes. Note the flow regime
received by the IPP of course impacts directly on the profitability of the IPP. Through the
alignment created by the structure of concessionary payments, the CCT and the IPP will strive
to provide optimal flows for power generation while maintaining water supply objectives.
Output Specification placed on IPP:
o Based on flow received, energy production levels and corresponding profit must be
generated by the IPP according to agreed levels. If the production levels are not
attained, the IPP will pay penalties to the CCT.
In this way the CCT receives guaranteed income via the PPP agreement via either concessionary
payments or penalties. Financial, technical and operational risk is assumed by the IPP. The IPP and
CCT are aligned, promoting cooperation between the two parties.
12.2.2 Risk Allocation
Risks to the power generation objective include:
Resource
o Flow reductions/non supply
o Flow fluctuation
o Sub-optimal flow regime
o Head Losses
Capex
o Low or negative Equity returns
o Inability to repay Lenders
Opex
o Cashflow shortages
o Unexpected or “lumpy” maintenance costs
Energy Offtake
o Non-payment
o Insufficient term

CCT Mini Hydro Power Prefeasibility Report
Page 126
o Insufficient balance sheet of buyer
o Insufficient security, inability to attach public assets
CER Offtake
o Non-payment
o Insufficient term
o Insufficient balance sheet of counterparty
Implementation
o Cost overrun
o Delay
Operational
o Suboptimal operation
o Unplanned, unpredictable unavailability
Production
o Underperforming energy production and therefore CER production
Grid Connection
o Inability to connect
o Connection delay
o Connection unavailability
Compliance
o Environmental non-authorisation
o Water use non-authorisation
o Other non-compliance
Terminal Project Hazards
o Earthquake
o Flood
o etc
In the proposed PPP, the allocation of risks is as shown in Table 84:
Table 84: Risk Allocation
Risk IPP CCT Other
Resource
y
Capex y
Opex y
Energy Offtake y
CER Offtake Y
Implementation Y
Operational Y
Production Y
Grid Connection y
Grid Operator
Compliance y
Terminal Project Hazards y

CCT Mini Hydro Power Prefeasibility Report
Page 127
12.2.3 PPP Inception
The PPP regulations are legally binding and are prescriptive. The project could be brought all the way
to inception if the process is not followed from the start. Therefore it is prudent to begin the
Inception stage of the PPP process if it is only a possibility that the Project may be procured using a
PPP mechanism. This does not mean that the Project will be procured using a PPP mechanism but
that if it is desired, the process followed is compliant.
For this reason some of the activities within the Inception Stage were identified. These are
described below.
12.2.3.1 Project Conception
The first step of the Inception Phase is to categorise the hydropower generation as one of:
Municipal Service
Municipal Support Activity
Commercial use of Municipal Property
The activity of generating power is excluded from the list of activities determined to be Municipal
services. Hence the MSA is not applicable in the procurement of this PPP. This leaves the second
two options. Hydroelectric power generation could be considered as a municipal support activity in
that it is incidental to the municipal service of water and sanitation. Equally, the activity could be
considered to be private sector use of municipal property in the land and relevant water conveyance
and power generation fixed property can be leased to a private party. In either case, MFMA
regulations apply and MSA regulations do not apply.
Under the definition, and as discussed above, the Project as a PPP will include all key exclusions and
inclusions in the PPP definition:
The structure involves a contract between a government institution (CCT) and a private
party (IPP).
CCT grants concession to the IPP to use its assets in return for concession payments by the
IPP to CCT.
The IPP performs construction, management and operation of hydroelectric generation
activities which are either municipal support activities or commercial use of municipal
property.
Substantial risk is transferred to the IPP which finances, manages and operates the
hydroelectric generation activities.
The IPP benefits through sale of electricity and pays concession fees to CCT for use of fixed
property.
The IPP does not receive ownership of public property, but only leases it. Hence the
structure is not privatisation.
The IPP assumes significant risk. Hence the structure is not simple outsourcing.
The IPP conducts its work for a profit. Hence the structure is not a donation or charity.

CCT Mini Hydro Power Prefeasibility Report
Page 128
The proposed structure is therefore a PPP. If it is possible that the Project be procured according to
this structure then the PPP Unit must be notified. The Municipal Desk at the unit will assist CCT in
complying with the appropriate regulations. If the process followed is not compliant significant risk is
introduced to the project because non-compliance may mean that the process will need to be
restarted. Such delays can be extremely costly.
12.2.3.2 Treasury Notification
Luel Culwick and Christiaan Bode from Sidala met with Strover Maganedisa from the Municipal Desk
at National Treasury’s PPP Unit on Thursday 14th July 2011. The meeting involved discussion of the
following points:
Sidala gave a basic description of the project (activities involved, potential generation
potential, Capex estimation)
PPPs in general and a potential PPP structure specifically for the CCT project were
conceptualised with Mr Maganedisa’s assistance.
The Accounting Officer of CCT should meet with the Municipal Desk to discuss the potential PPP.
Prior to the meeting, CCT must provide information to the PPP Unit including:
Prefeasibility study of the Project
Authorisation for commencement of Feasibility Study
Description of CCT’s capacity (within or procured by CCT) to adhere to MFMA regulations
After sufficient time for the PPP Unit to understand the information on the PPP, a meeting between
the Accounting Officer of CCT and the PPP Unit must take place. Discussion points should include:
Definition of the hydroelectric generation as either a municipal support activity or
commercial use of municipal property should be investigated further.
The potential risks associated with the potential PPP both from the perspective of power
generation and water supply.
CCT must also disclose budgetary commitments to the project for development of the
project and internal costs.
The potential for support of the project from the PDF if the appointment of a Transactional
Advisor is necessary.
The PPP Unit will determine how significant the impact on municipal finances, risks and organised
labour resulting from the activity of the IPP are likely to be. Based on this assessment, it may be
possible to gain exemption from:
Procurement of a Transactional Advisor
Full feasibility (PSC) in favour of a simplified feasibility
Simplified procurement (combining RFQ and RFP)
It is important that CCT define its needs and assess internal and external options to justify the use of
a PPP. This may include:
Financial limitations such as challenges in raising the required capex

CCT Mini Hydro Power Prefeasibility Report
Page 129
A desire to focus on core activities such as water supply and in so doing to remove risk
resulting from having to divide focus between core and secondary activities such as power
generation
Disqualification on the basis that CCT is a public entity and it will not be possible to acquire
an offtake agreement with the Single Buyer (ISMO)
The PPP unit will enter the project on the official database, assign an internal project advisor, and
make the following determinations:
Activity type
Feasibility study provisions
Whether the services of a transactional advisor are necessary
The project advisor from the PPP Unit will assist the CCT Accounting Officer to fulfill his/her duties
with respect to establishing a Project Team and Project Officer to drive the project from CCT’s side,
and to budget and apply for funding for a transactional advisor if necessary.
12.2.3.3 Project Team
CCT will need to assemble a team to drive the PPP. This begins with the Project Officer who is
responsible for the management of the Project. Key questions:
Who has the skill set to drive the Project? Is there someone available internally?
How can the Project Officer get decisions from necessary Departments including Water, ECC,
Electricity, other?
What management level will the Project Officer be on to have the necessary authority to
drive the Project?
How can the Project Officer be contracted such that he/she is tied in at least until the
project is in Operation Phase?
The Project Officer will need significant secretarial support in order to meet all requirements.
12.2.3.4 Due Diligence
Before an IPP enters into a PPP agreement with CCT, it will conduct a due diligence. Therefore it is
necessary for obstacles to the proposed PPP be identified as early as possible. Regarding the assets
to be leased, potential obstacles may include:
Land claims
Servitudes
Long Leases and constraints
Environmental and heritage status of the land
Because existing municipal assets are to be incorporated into the PPP, the condition and
maintenance records must be fully understood. Existing municipal assets present uncertainty, and
the IPP will be reluctant to accept performance and availability risk if it does not have access to
detailed information on which to base its due diligence.

CCT Mini Hydro Power Prefeasibility Report
Page 130
This will enable the IPP to set out clear schedules for asset replacement and disposal. The IPP will
decide for itself on the management of assets to maximise the use of assets. This has particular
relevance for the sites with existing hydropower installations.
12.3 PPP and Project Cycles
The PPP cycle is intended to investigate, evaluate, source and manage the execution of a PPP
agreement. It consists of the phases below:
Figure 83: PPP Cycle
The project cycle consists of the development, implementation and operation of the hydropower
projects. It is separate from the PPP cycle, and consists of the phases below:
Figure 84: Project Cycle
The two processes of course relate to each other, as shown in the figure:
Figure 85: PPP and Project Cycle
The blue areas are driven by CCT, while the yellow areas are driven by the IPP. At present, the PPP
process is at inception phase and the project is at the end of the prefeasibility phase. The Project
feasibility phase will commence next. Following this work, sufficient information for the PPP
feasibility phase to begin will be available. After completion of the PPP feasibility, the PPP
procurement will commence, the output of which is a signed PPP agreement between CCT and the
selected IPP. The IPP will then assume the project work, procuring, implementing and operating the
Inception Feasibility ProcurementContract
Management
Prefeasibility Development Implementation Operation

CCT Mini Hydro Power Prefeasibility Report
Page 131
project. The CCT role during these Project phases will be to manage the PPP contract to ensure
delivery and to optimise the partnership.
12.4 Contracting structure and risk management
Although the IPP will assume significant risk, it will in turn transfer portions of this on to
subcontractors. Implementation risk can be transferred away from the IPP through an EPC Wrap or
Turnkey agreement. The EPC Contractor will add a premium for assuming the risk, but from the
proponent’s perspective, the price and delivery date are fixed. An EPC Wrap structure is shown in
Figure 86.
Figure 86: EPC Wrap Structure
CCT can procure the projects internally, but transfer significant risk using the same contracting
technique. This is shown in Figure 87:

CCT Mini Hydro Power Prefeasibility Report
Page 132
Figure 87: Internal Procurement with EPC Wrap contracting structure
This will result in the risk apportioning shown in Table 85:
Table 85: Risk Allocation
Risk CCT Other
Resource y
Capex Y
Opex Y
Energy Offtake Y
CER Offtake Y
Implementation
EPC Contractor
Operational Negotiable
Production
EPC Contractor
Grid Connection Shared with Grid Operator
Compliance Y
Terminal Project Hazards Y
This is contrasted with a traditional contracting structure, shown in Figure 88:

CCT Mini Hydro Power Prefeasibility Report
Page 133
Figure 88: Internal procurement with traditional contracting structure
This results in the risk apportioning shown in Table 86:
Table 86: Risk Allocation
Risk CCT Other
Resource y
Capex Y
Opex Y
Energy Offtake Y
CER Offtake Y
Implementation Y
Operational Y
Production Y
Grid Connection Shared with Grid Operator
Compliance Y
Terminal Project Hazards Y
12.5 Conclusions
The CCT must determine its risk appetite and availability of finance to determine which
procurement mechanism to adopt for the Project.
Consideration of internal and external procurement mechanisms allows CCT to assume or
transfer virtually all of the risks associated with power generation. The proposed PPP
transfers all but Resource risk with the IPP. In addition, the proposed PPP provides relief
from capital shortage to CCT by leveraging Private Sector finance. The PPP will provide long
term, guaranteed income and will enable efficient use of CCT Assets.
On the other end of the scale, using an internal mechanism with a traditional contracting
structure, CCT assumes all the risk and capital requirements.
Internal Procurement using an EPC Wrap contracting structure is a hybrid between the two.

CCT Mini Hydro Power Prefeasibility Report
Page 134
This analysis indicates that the procurement mechanism and contracting structure allows
CCT to select the level of risk assumed. Clear consideration of options will allow the City to
ensure that risks assumed are manageable and that the activities taking place in-house are
determined to be core. The selected procurement mechanism and contracting structure also
can allow the City to develop the projects within available budget.

CCT Mini Hydro Power Prefeasibility Report
Page 135
13 Environmental Authorisation Basic Assessments and Environmental Impact Assessments must be carried out by an independent
Environmental Assessment Practitioner (EAP). The Proponent will need to contract an EAP to
develop the environmental applications.
13.1 Legislation
Although the proposed activities are located within infrastructure which is already disturbed, a small
aspect may trigger an EIA by being an associated aspect.
Generally, the construction of hydroelectric plant and associated listed activities may require an
application under Regulation 386 and/or 387 of the National Environmental Management Act
(NEMA). Schedule R386 defines activities which will trigger the need for a Basic Assessment and R
387 defines activities which trigger a full EIA process. If activities from both schedules are triggered,
then a full EIA process will be required.
In terms of R386, the following activities are potentially associated with the proposed project:
Item 1(a): The construction of facilities or infrastructure, including associated structures or
infrastructure, for the generation of electricity where the electricity output is more than 10
megawatts but less than 20 megawatts.
Item 1(k): The construction of facilities or infrastructure, including associated structures or
infrastructure, for the bulk transportation of sewage and water, including storm water, in pipelines
with -
(i) an internal diameter of 0,36 metres or more; or
(ii) a peak throughput of 120 litres per second or more.
More specifically, if any of the activities listed below are triggered – the project will require a Basic
Assessment process to be done, and no construction may commence before the Environmental
Authorisation has been received.
On sites requiring excavation, it may trigger Activity 29 of the act:
The expansion of facilities for the generation of electricity where:
The electricity output will be increased by 10 megawatts or more, excluding where such
expansion takes place on the original development footprint, or
Regardless the increased output of the facility, the development footprint will be expanded
by 1 hectare or more.
Specifically with respect to the mountainous Steenbras sites where it may be necessary to remove
the old underground pipes and make adjustments to them, Activity 29 may be triggered, but also
potentially Activity 37:
The expansion of facilities or infrastructure for the bulk transportation of water, sewage or storm
water where:

CCT Mini Hydro Power Prefeasibility Report
Page 136
The facility or infrastructure is expanded by more than 1000meteres in length, or
Where the throughput capacity of the facility or infrastructure will be increased by 10% or
more.
Excluding where such expansion:
Relates to transportation of water, sewage or storm water within a road reserve, or
Where such expansion will occur within urban areas but further than 32 metres from a
watercourse, measured from the edge of the watercourse.
Regarding Grid connection, the following Activities may be triggered:
Activity 10
The construction of facilities or infrastructure for the transmission and distribution of electricity –
Outside urban areas or industrial complexes with a capacity of more than 33 but less than
275 kilovolts, or
Inside urban areas or industrial complexes with a capacity of 275 kilovolts or more.
Therefore the power line may trigger this activity if it falls into these thresholds. Another activity
that may be triggered is Activity 39:
The expansion of facilities for the transmission and distribution of electricity where the expanded
capacity will exceed 275 kilovolts and the development footprint will increase.
In addition, Activity 11 may be pertinent:
The construction of:
Canals
Channels
Bridges
Dams
Weirs
Bulk storm water outlet structures
Marinas
Jetties >50 square metres in size
Slipways >50 square metres in size
Buildings >50 square metres in size
Infrastructure or structures covering 50 square meters or more
Where such construction occurs within a watercourse or within 32 metres of a watercourse,
measured from the edge of a watercourse, excluding where such construction will occur behind the
development setback line.

CCT Mini Hydro Power Prefeasibility Report
Page 137
According to the NEMA a full EIA process is required in terms of the following activities listed in
Regulation 387:
1 The construction of facilities or infrastructure, including associated structures or infrastructure, for
(a) the generation of electricity where (ii) the elements of the facility cover a combined area in excess
of 1 hectare.
This activity is not present on any site considered here and it therefore appears highly unlikely that a
full EIA will be required.
Table 87 contains an analysis of the potential requirement for a BA:
Table 87: Activities which trigger BA
Activity 29 Activity 37 Activity 10 Activity 39 Activity 11
SB Lower Dam to SBWTW 2 no no no possible possible
SBWTW to 760 possible no no possible possible
SBWTW to 810, 840 possible no possible possible possible
BH Raw Water no no no no no
BHWTW to Upper no no no no no
BHUpper to Lower 1 no no possible no no
Wemmershoek no no no no possible
Faure 1 no no no possible possible
The above analysis indicates that no activities triggering a BA are definitely present. It is possible
that one or more triggering activities may occur, although this is considered unlikely. It is therefore
possible that no environmental authorisations will be necessary for the development of all the sites
under consideration. The above is, however, a preliminary assessment of potential activities against
specific listed activities which may trigger the need for environmental authorisation. The
assessment could change once more detailed information become available. Following the
completion of the technical feasibility design, a general assessment of activities and potential
triggers of environmental authorisations by an EAP is recommended. This is budgeted for in the
feasibility study.
In addition, the proximity of the Steenbras sites with Gordon’s Bay is a concern because it is a
particularly sensitive area. Therefore Basic Assessments with respect to the Steenbras sites are
provisionally budgeted for in the feasibility study.
13.2 Specialist Studies
The need for Specialist Studies is very limited because the activities will occur within already
disturbed locations, removing the need for Heritage and Visual Impact Studies. Because the activities
occur within man-made conduits, this removes the need for Aquatic and Terrestrial Ecological
Studies.
Necessary studies may include:
Socio-economical Study

CCT Mini Hydro Power Prefeasibility Report
Page 138
Geotechnical Study
At Inception, the required Specialist Studies should be identified and finalised.
EAPs usually quote upfront for Specialist Studies. It is better if these costs are kept out of the initial
proposal, and Specialist Study costs added on separately with full transparency.

CCT Mini Hydro Power Prefeasibility Report
Page 139
14 Clean Development Mechanism
14.1 Context
The Kyoto protocol placed requirements on annex 1 (developed) countries to reduce emissions of
Green House Gasses (GHGs). It is often more cost effective for reductions to be made in developing
countries than in already industrialised countries. Hence global emissions reductions are reduced at
a lower cost. It has been operational since 2006 and had registered more than 1000 projects
equivalent to more than 2,7 billion tonnes of C02 reduction.
Certified Emission Reductions (CERs) or ‘carbon credits’ can be sold at any stage of the development
or implementation of a CDM project. CERs are traded on an internationally regulated market. If the
CER’s are forward sold (i.e. sold at any point prior the issuance of CERs) then the risk of the CERs not
being issued increases for the buyer, and hence a lower price is paid. Payment for CERs will not
occur before issuance of the CERs. However it is possible to acquire funding for development costs
(such as EIA, CDM registration or PDD validation costs) from CER buyers.
A key concept concerning CDM is additionality. The Kyoto protocol defines “additional” reductions
as “Reductions in emissions that are additional to any that would occur in the absence of the
certified project activity.”
The Project will sell electricity into the national grid; displacing grid electricity; which is primarily
coal-based. Hence carbon emissions are reduced as a result of the operation of the Project. It is
possible to quantify and securitize the emissions reductions which can then be traded as Certified
Emissions Reductions (CERs) under the CDM.
14.2 CDM Project Cycle
The sequence of activity for developing and implementing a CDM project is shown in Table 88
Table 88: CDM Project Cycle
Pro
ject
D
evel
op
men
t
Ph
ase
Project Idea Note
Project Design Document
Validation
Registration
Pro
ject
Imp
lem
enta
tio
n P
has
e Monitoring
Verification
Certification
Issuance of CERs

CCT Mini Hydro Power Prefeasibility Report
Page 140
Each stage of the process is described below.
14.2.1 Project Idea Note
This is an optional registration of the project with the DNA, who may or may not issue a “letter of no
objection.” Information requirements for the preparation of the PIN are contained in this report.
14.2.2 Project Design Document
Development of a Project Design Document (PDD) includes a baseline estimate and an analysis of
the net carbon emissions reductions against this business as usual scenario. In the case of hydro
generation plant in South Africa, the baseline is a predominantly coal-fired electricity generation
system. The proposed project will produce annual emissions reductions approximately equal to the
amount of C02 emitted through the coal-fired production of the same quantity of electricity as the
project produces annually.
14.2.3 Host country approval
This is carried out by the Designated National Authority. The process for host country approval can
happen "in parallel" with the validation process but it is required before a project can be submitted
for registration to the Executive Board. To receive host country approval, sustainable development
must be demonstrated. There are three main criteria which are evaluated by the DNA.
Economic: Does the project contribute to national economic development?
Social: Does the project contribute to social development in South Africa?
Environmental: Does the project conform to the National Environmental Management Act principles
of sustainable development?
14.2.4 Validation
Third-party validation of the Project Design Document This step is carried out by a Designated
Operational Entity.
14.2.5 Registration
Once a project is validated and approved by the host country, it is registered by the CDM Executive
Board.
14.2.6 Monitoring
Project performance, including baseline conditions, is measured by the project developer in the
commissioning process and during on-going project operation.
14.2.7 Third-party verification of project performance
An independent third party (DOE) verifies project performance against the validated design and
baseline in order to approve certification.
14.2.8 Certification and issuance of CERs
Based on the host-country approval, the validated project design and baseline, and the verified
project performance, CERs are certified by a DOE and issued by the CDM Executive Board.

CCT Mini Hydro Power Prefeasibility Report
Page 141
14.3 Structure
The scale of the individual sites considered in the Project means that it is not viable to develop a
single CDM project for each site. Hence it is necessary to develop the CDM potential through within
a Program of Activities, or some other structure bundles of the sites to share the costs of CDM
component development. A Carbon Consultant must advise on this.
14.4 PIN
It is not possible at this stage to compile a PIN. The Project and CDM component structure must be
decided before this is possible.
14.5 CER Production and Income
Sidala are confident that the CCT mini hydro projects would qualify as a project, or programme of
activities under CDM, however, for the purposes of this study, the income derived selling the carbon
credits has not been applied to the individual sites and neither as a group or a programme. The
costs associated with CDM feasibility and registration have been included in the project
development costs. This is in line with the conservative approach taken in the development cost
estimation. Results of potential CERs and income are given in the Results section.
These projects would need a carbon consultant familiar with the processes to apply on behalf of the
project. Proponents and stakeholders in the project need to be finalised and the structure of the
project would have to be clear before registering the PIN and moving forward with the CDM aspects
of the project. The assumptions used in the financial modelling of the CDM component are given in
Appendix B.
The total estimated kWh for the sites listed in Table 2 is 35 100 549kWh/annum.
According to the assumptions used in Appendix B, the CDM results shown in Table 89 are applicable.
These results have not been included in the financial modelling. The results are extremely positive
and it is therefore strongly recommended that the CDM aspect of the project be fully investigated.
Table 89: CER Results
Total Energy kWh/annum 35 100 549
Total CERs #/annum 33 633
Total CER Revenue ZAR 70 337 219
Total CER Costs ZAR 7 569 182
Total CER Net Income ZAR 62 768 038

CCT Mini Hydro Power Prefeasibility Report
Page 142
15 Local Socio - Economic Benefits
15.1 Job Creation
15.1.1 Temporary Jobs
Temporary jobs will be created during the Development and Implementation phases. Although,
technical, environmental, carbon and legal work is created in the Development Phase, the
Implementation Phase creates the vast majority of temporary jobs.
The following are certain aspects of the Implementation Phase that would require staffing.
Technical. Local Engineering consultancies do not typically have significant experience in
Small Hydro. This is a result of the fact that the small hydro potential in South Africa is
limited and the industry is still in its infancy. However, this has begun to change as local
consultancies have partnered with international consultancies in order to access the
required expertise.
Construction. This contract presents the largest opportunity for local content in the
Implementation phase. There are a multitude of civil construction firms which are capable
of delivering the civil works. It is possible to procure Civil Contractors with Level 3 or even
Level 2 BEE scores.
Electromechanical. The suppliers of Small Hydro Turbines and ancillary equipment are not
found in South Africa as a rule. Therefore foreign content is necessary for this contract.
Figure 89 shows the benefits derived from the Sol Plaatje site of Bethlehem Hydro, the most recent
private Hydro development in South Africa. The size of the plant was a 4MW plant that involved
heavy civil works.
Figure 89: Bethlehem Hydro socio-economic benefits
To estimate how many temporary jobs will be created in the CCT development depends on which
sites are feasible and the works involved.

CCT Mini Hydro Power Prefeasibility Report
Page 143
Assuming 6.4MW are built in the CCT infrastructure, the jobs created could potentially be 96
employees (assuming 15 jobs/MW). Because these sites could all be built simultaneously, economies
of scale cannot be assumed.
In hydropower projects, the biggest job creation element is found in the procurement of the Civil
Contractor, due to civil construction and earthworks. Because the majority of the sites in this study
do not require significant civil works, this number is most likely to be lower.
15.1.2 Permanent Jobs
Permanent jobs during the Operation Phase for the direct O&M will depend on the structuring of the
project, if this project is to be owned through a PPP structure then the IPP will most likely appoint
permanent staff to run the plant but it the plant is owned by the CCT, the personnel appointed to
run the current turbines would most likely be used to continue operations on the new plants.
15.2 PPP projects
PPP projects must be seen, and tangibly experienced, as directly beneficial to the people in whose
neighbourhoods they operate. Every PPP must therefore be designed, and proactively seek, to
produce a positive local socio-economic impact in any way that is appropriate to the project and its
location. This must be done taking cognisance of relevant Integrated Development Plans. The targets
that may be set in this element need not be limited only to Black People or Black Enterprises, but in
targeting local communities must directly benefit the poor and the marginalised, and must effect
local socio-economic upliftment. This final set of PPP BEE elements must be:
• determined by the Institution on a project-by-project basis during the Feasibility Study
phase;
• communicated with bidders during procurement;
• proposed by bidders in their plans, with costs reflected in their financial models;
• negotiated with the preferred bidder;
• and committed in the PPP Agreement.
Such elements may be itemised individually or, on larger projects, incorporated under a requirement
that the Private Party devise and implement an innovative and effective social responsibility
programme as part of its operations.
15.3 Community Trust
Further local benefits can be created by the project through the creation of a Community Trust. This
trust will own 100% of the shares in an SPV which will own a share of the Project Company. This
share can be any portion but is not likely to be a majority, and is usually between 5% and 25% of the
Project Company. A community SPV is financed by local DFIs such as IDC or DBSA. The proceeds
over and above the financing costs then pass through to the SPV.
A Needs Analysis is conducted by a community intervention consultant to assess the specific
challenges faced by the community. Trustees are selected to determine who/what the Beneficiaries
of the Community Trust will be. Potential areas to be targeted include, but are not limited to:
involvement of, and direct benefits to, non-governmental organisations, religious
institutions, civics, clinics, child-care centres, and the like

CCT Mini Hydro Power Prefeasibility Report
Page 144
employment preference for youth in a targeted geographic area
employment targets for disabled people
employment preferences for women
preference for contracting with SMMEs as suppliers of materials and/or services in a
targeted geographic area
initiatives that will support HIV and Aids education
other local socio-economic impacts appropriate to the project and its location
The establishment of a Community Trust is a powerful way to create local and targeted broad-based
socio-economic benefits.

CCT Mini Hydro Power Prefeasibility Report
Page 145
Appendix A Turbine Spec Sheets
Figure 90: Steenbras Turbine Spec Sheet

CCT Mini Hydro Power Prefeasibility Report
Page 146
Figure 91: Faure Turbine Spec Sheet

CCT Mini Hydro Power Prefeasibility Report
Page 147
Appendix B CDM Assumptions Table 90: CDM Assumptions
Carbon Credit Revenue
Assumptions
Diesel Emissions kg C02 per litre 2.63000 Source: Guidelines to Defra's GHG conversion factors for company reporting
t C02 per litre 0.00263
kg CO2 per kWh 0.26300 Source: Guidelines to Defra's GHG conversion factors for company reporting
t C02 per kWh 0.00026
Total Emission per annum
t C02 per
annum 209 000 000 Source: Eskom Abridged Financial Report, 2007
Total Power Generated kWh 218 120 000 000
t C02 per kWh 0.00096
kg C02 per kWh 0.95819
Certified Emissions Reductions
Sales Price €/TCO2e 10 2010 Price
R/TCO2e 97.00

CCT Mini Hydro Power Prefeasibility Report
Page 148
Exchange Rates ZAR/€ 9.70
ZAR/$ 6.70
Validation Costs € 70 000 A UN accredited auditor will have to validate the project
Verification Costs €/year 15 000
A UN accredited auditor will have to verify that emission reductions have taken
place
Registration costs US $/CER $ 0.10
For the first 15,000 CER's issued per year. (Capped at $350,000). To calculate the
number of CER's issued you can take the average over the 1st 7 years of
operation.
Registration costs US $/CER $ .20 For every issued CER over 15,000 per year
Adaption Fund 2% The EB registry will take 2% of the CER's from the project before they are issued.
Issuance Fee US $/CER $ 10
For the first 15,000 CER's issued per year. (This does not get charged for the 1st
issuance)
Issuance Fee US $/CER $ .20 For every issued CER over 15,000 per year
7 year cycle

CCT Mini Hydro Power Prefeasibility Report
Page 149
Appendix C PPPs in South Africa The PPP Unit has produced a number of useful publications on PPPs, most particularly the PPP
Manual and the Municipal Service Delivery and PPP Guidelines which are used extensively in this
report.
Legal Grounding for PPPs
PPPs are structures which provide integration between Public and Private sectors for a collective
good. The public receives higher quality, more cost-effective services from their governing institution
while the private party receives a business opportunity. A PPP is the mechanism which is intended to
release these benefits.
The characteristics of the PPP regulations are founded in the constitution. “When an organ of state
… contracts for goods or services, it must do so in accordance with a system which is fair, equitable,
transparent, competitive and cost-effective.” The identity of the public institution determines the
legal framework which governs the PPP Development and Implementation. The central legislation
governing PPPs for national and provincial government is Treasury Regulation 16 issued to the Public
Finance Management Act, 1999 (PFMA). PPPs for municipal government are governed by the
Municipal Systems Act, 2000, and the Municipal Finance Management Act, 2003 (MFMA).
Municipalities are not subject to the PFMA or to Treasury Regulation 16. (PPP Manual, 2003)
National Treasury has issued various manuals and toolkits to assist public institutions and private
parties in developing and establishing PPP agreements in accordance with the appropriate
regulations. CCT is identified as a municipal institution and hence the MFMA and MSA form the legal
basis for any PPP into which the municipality may choose to enter. The Municipal Service Delivery
and PPP Guidelines is a useful document developed by National Treasury to assist CCT in Developing
the hydropower potential as a PPP. Numerous elements in this study were taken from this and
other National Treasury publications.
PPP Definition
A PPP is legally defined as:
A contract between government institution and private party
Private party performs an institutional function and/or uses state property in terms of
output specifications
Substantial project risk (financial, technical, operational) transferred to the private party
Private party benefits through: unitary payments from government budget and/or user fees
Two types of PPPs are specifically defined:
1. Where the private party performs a municipal function
2. Where the private party acquires the use of municipal property for its own commercial purposes
Further to this, a PPP is a commercial transaction between a municipality and a private party in
terms of which the private party:

CCT Mini Hydro Power Prefeasibility Report
Page 150
a) Performs a municipal function for or on behalf of a municipality, or acquires the management or
use of municipal property for its own commercial purpose; or both performs a municipal
function for or on behalf of a municipality and acquires the management or use of municipal
property for its own commercial purposes.
b) Assumes substantial financial, technical and operational risks in connection with:
i) The performance of the municipal function
ii) The management or use of the municipal property; or
iii) Both
c) Receives a benefit from performing the municipal function, or from using the municipal property
or both, by:
i) Consideration to be paid or given by the municipality or a municipal entity under the sole or
shared control of the municipality
ii) Charges or fees to be collected by the private party from users or customers of a service
provided to them
iii) A combination of the benefits referred to in subparagraphs (i) and (ii).
The way that a PPP is defined in the regulations makes it clear that:
a PPP is not a simple outsourcing of functions where substantial financial, technical and
operational risk is retained by the institution
a PPP is not a donation by a private party for a public good
a PPP is not the privatisation or divesture of state assets and/or liabilities
a PPP is not the ‘commercialisation’ of a public function by the creation of a stateowned
enterprise
a PPP does not constitute borrowing by the state.
Therefore, a PPP sits somewhere between simple outsourcing and full privatisation in terms of the
degree of risk transferred to the private party. In outsourcing, capitalisation remains with the
institution, purchases goods or services but retains the risk of service delivery itself. In privatisation,
state assets and liabilities are sold, leaving only the regulatory function to government. In between
these two models, a PPP allows financial, technical and operational risk to be transferred to the
private party which has responsibility for outputs but retains ownership of fixed assets.
The typical structure of a PPP is shown below:

CCT Mini Hydro Power Prefeasibility Report
Page 151
Whatever the PPP type, structure, payment mechanism, or sources of funding, all South African PPPs
governed by Treasury Regulation 16 are subjected to three strict tests:
4. Can the institution afford the deal?
5. Is it a value-for-money solution?
6. Is substantial technical, operational and financial risk transferred to the private party?
Exemption from Regulations
PPP Exemption
The application must demonstrate the institution’s capacity to manage the PPP through the phases
and to the standards set by Treasury Regulation 16 without the oversight and approvals of the
relevant treasury.
The following must be addressed:
1. Give a short description of the project.
2. What institutional function and/or use of state property is envisaged?
3. What is the envisaged extent of public funding and/or revenue from users?
4. What is the proposed extent of private sector capital/skill/infrastructure?
5. What risks are to be transferred to a private party?
6. What is the anticipated duration of the PPP agreement?
7. How does the institution propose to determine affordability, value for money and
appropriate risk allocation for the project?

CCT Mini Hydro Power Prefeasibility Report
Page 152
8. Give a short history of similar projects undertaken by the institution.
9. Outline the policy and actual procedures followed to date by the institution in three similar
projects, specifically in relation to approving project feasibility studies, compiling and
approving bid documents, managing the competitive bidding process, evaluating bids,
determining value for money, establishing contract management systems and negotiating
and managing contracts.
10. Outline the institution’s management system for the project, attaching relevant resumés of
key personnel.
11. Submit the curriculum vitae of the appointed project officer, together with his or her job
description.
Institutional Exemption
National Treasury views the past experience of the institution in successfully planning for, procuring
and implementing PPP projects as the key factor in granting an institutional exemption. The
application must therefore demonstrate the capacity of the institution established for procuring and
managing all its possible PPPs through the phases and to the standards set in Treasury Regulation 16
without the oversight and approvals of the relevant treasury. The exemption may be granted for a
specific period, and re-applied for after that. The application must state the extent to which such
institutional capacity relies on the experience of specific individuals.
The following must be addressed:
1. Give a short description of the institution.
2. Motivate the period of time for which an exemption is sought.
3. What institutional function and/or use of state property is envisaged for PPPs?
4. What is the extent of public funding and/or revenues from users, for projects envisaged?
5. What is the extent of private sector capital/skill/infrastructure envisaged?
6. What risks are likely to be transferred to the private sector?
7. Provide a summary of the PPP projects undertaken by the institution to date.
8. Outline the institution’s policy for determining project affordability, value for money and
appropriate risk allocation.
9. Outline the actual procedures established in the institution for approving project feasibility
studies, approving bid documents, managing the competitive bidding process, evaluating
bids, determining value for money, establishing contract management systems, and
negotiating and managing PPP agreements.
10. Outline the institution’s capacity to manage and administer PPPs, attaching relevant
resumés of key personnel.
11. Submit the curriculum vitae of people who will be assigned as project officers for the
institution’s envisaged PPP projects, together with their job descriptions.
PPP Finance
The Municipal Public-Private Partnership Regulations are not prescriptive about the financing
structure of a PPP. It is assumed that these will vary widely from project to project and sector to

CCT Mini Hydro Power Prefeasibility Report
Page 153
sector, and will be closely linked to the funding sources that can be secured for each deal. However,
in most PPPs the private party raises both debt and equity to capitalise the project. This is called
“project financing”. In smaller municipal PPPs, the private sector often obtains any required funding
on the strength of its balance sheet, which is called “corporate financing.”
BEE in PPPs
PPPs are specific targets for the development of BEE practice and the regulations are designed
accordingly. “Code of Good Practice for BEE in Public Private Partnerships” is National Treasury’s
official framework for black economic empowerment in PPPs.
The stated Policy Objectives of the regulations are to:
to achieve meaningful and beneficial direct ownership of substantial equity interests in the
Private Party to a PPP Agreement by Black People, Black Women and Black Enterprises;
to achieve effective participation in the management control of the Private Party and its
subcontractors by Black People and Black Women;
to ensure that a substantive proportion of the Private Party’s subcontracting and
procurement is to Black People, Black Women and Black Enterprises;
to ensure effective employment equity and skills development in the Private Party and its
Subcontractors throughout the PPP project;
to promote positive local socio-economic impact from the project to the benefit of SMMEs,
the disabled, the youth, and non-government organisations within a targeted area of project
operations;
to create jobs; and
for Institutions to be supported in all PPP projects by financial, legal and technical
Transaction Advisors who generally reflect South Africa’s diverse population, and to build
the professional skills and number of Black People and Black Enterprises in these fields.
The diagram below shows the different BEE elements targeted by the regulations in a typical PPP
structure. It is important that all these elements are incorporated into a prospective PPP.

CCT Mini Hydro Power Prefeasibility Report
Page 154
The table below summarizes the requirements and expectations which the relevant treasury will
have with respect to BEE in a PPP.
Code Criteria Indicative Requirement/Comment
A Private Party Equity
A1 Black Equity 40%
A2 Active Equity 55% of A1
A3 Cost of Black Equity Evaluated in Feasibility Study, total
cost of equity to be minimized, cost
of BEE equity shown as a separate
component
A4 Timing of project cash flows to Black Shareholders Evaluated in Feasibility Study, and
reflected in Shareholder’s
Agreement, bids should show how
their funding structures effectively
unlock value for Black Shareholders
early and throughout the project

CCT Mini Hydro Power Prefeasibility Report
Page 155
term
B Private Party management and employment
B1 Black Management Control in the Private Party Commensurate with A1 and A2
B2 Black Women in Management Control in the
Private Party
15% of B1
B3 Employment Equity in the Private Party in compliance with the Employment
Equity Act, 1998
B4 Skills development in the Private Party 1% in addition to the skills
development levy prescribed by the
Skills Development
Levies Act, 1999
C Subcontracting
C1 Percentage participation by Black People and/or
Black Enterprises in the capital expenditure
forecast to be incurred by the Private Party under
the Subcontracts
30%
C2 Percentage participation by Black People and/or
Black Enterprises in the operating expenditure
forecast to be incurred by the Private Party under
the Subcontracts
30%
C3 Percentage of Black Management Control in the
Subcontractors
25%
C4 Percentage of Black Women in Management
Control in the Subcontractors
15% of C3
C5 Employment equity plans of the Subcontractor Compliance with law
C6 Percentage of Subcontractors’ payrolls to be spent
on skills development per annum
1%
C7 Percentage of procurement budget committed by
the Subcontractors to Black Enterprise SMMEs
30%
D Local socio-economic impact Determined by the Institution on a
project-by-project basis during the

CCT Mini Hydro Power Prefeasibility Report
Page 156
Feasibility Study phase
BEE is enforced in procurement processes according to the following weightings:
Transaction Advisor Procurement (10% weighting, minimum 60% on balanced scorecard)
Procurement (10% weighting, minimum 50% on balanced scorecard)
BEE is applied in the PPP Project Cycle according to the following program:
Treasury Approval I (containing a clear and appropriate set of BEE elements, targets,
minimum thresholds, and weightings, duly approved as part of the Feasibility Study)
Treasury Approval IIA (the quality of the BEE component of the preferred bid forms part of
the value-for-money report to be submitted by the Institution, prior to negotiations)
Treasury Approval IIB (Negotiations that follow must seek to maximise BEE benefits in the
final terms of the deal, and to tie up provisions for managing the PPP Agreement post
signature)
Treasury Approval III (PPP Agreement binds the parties to their BEE commitments for the
duration of the PPP, stipulating the consequences of default)
The PPP Process
The PPP process differs slightly between National and Provincial government institutions and
Municipal institutions. The process discussed here is for Municipal institutions according to the
Municipal Service Delivery and PPP Guidelines. The process is described briefly with the intention of
giving an indication of what the development of a PPP will entail. It is recommended that the
Guidelines are consulted in the event that the CCT would like to actively pursue a PPP or a potential
PPP.
Inception Phase
The starting point in any Municipal PPP is determining the nature of the activity to be conducted by
the private party according to legislation. It may be a “municipal service”, a “municipal support
activity”; or “private-sector use of municipal property for commercial purposes”. If it is a municipal
service, then the MSA and MFMA apply; if it is a municipal support activity or private sector use of
municipal property for commercial purposes, then only the Municipal Finance Management Act
(MFMA) applies.
A municipal service is any service that a municipality provides or may provide to or for the benefit of
a community. The following services are listed in the guidelines as municipal services and require a
feasibility study under the MSA:
Ambulance services
Beaches and amusement facilities
Cemeteries
Child care facilities

CCT Mini Hydro Power Prefeasibility Report
Page 157
Cleansing
Electricity and gas reticulation
Housing
Local sports facilities
Local tourism
Markets
Municipal abattoirs
Municipal airports
Municipal health services
Municipal parks and recreation
Municipal public transport
Municipal public works
Municipal roads
Nature conservation
Pollution control
Pontoons, ferries, jetties, piers and harbours
Public transport
Refuse removal, refuse dumps and solid waste disposal
Storm water management systems in built-up areas
Street lighting
Traffic and parking
Water and sanitation services
Municipal Support Activities are reasonably necessary for, or incidental to, the effective
performance of a Municipality’s functions and the exercise of its powers” that do not constitute a
“municipal service”. A non-exhaustive list of examples includes:
Municipal composting activities
Municipal fleet services
Municipal ITC services
Municipal office accommodation
Industrial water supply and industrial wastewater treatment
Meter reading, billing, and revenue management.
The third activity considered is the “use of municipal property for its own *the private party’s+
commercial purposes”. This most frequently involves the lease of land to a private party which then
develops and manages the land commercially. However, the term property refers generally to “fixed
property” which can include a broader range of commercial enterprises.
The MSA defines how a Municipality may provide a service through either an internal or external
mechanism review of its delivery mechanisms. A Municipality must first assess the provision of that
activity through an internal mechanism, after which it may decide to explore the delivery of that
activity by an external mechanism. A PPP is one such external option.

CCT Mini Hydro Power Prefeasibility Report
Page 158
The inception Phase lays the foundation for all following phases in the PPP. The regulations are
exacting and potentially cumbersome, but are intended to ensure that the public institution and
private party can integrate roles in such a way that the PPP objectives are met which is beneficial for
all parties and the nation at large. If projects are determined to be small or low risk, National
Treasury can exempt the institution from certain or all regulatory requirements. It is very important
that all the procedure is followed correctly or else it will be necessary to repeat the process to satisfy
the prescribed process and legal requirements.
Following identification of a potential PPP, National Treasury must be notified. This will include a
discussion of the activity and potential team within the institution which is to execute the project.
The Municipal representative at National Treasury will make determinations in consultation with the
Accounting Officer of the institution, on whom significant responsibility for strategic guidance and
compliance sits. The PPP unit will assign an internal project advisor to assist the municipality, who
will convey Treasury Views and Recommendations in line with project timelines. A Project Officer
and supporting Project Secretariat must be assigned from within the municipality or from external
sources. The Project Officer has the responsibility of ensuring the project is delivered on time and on
budget, and that compliance with regulations in all phases is achieved. Support and empowerment
of the Project Officer is also critical and access to key decision makers is central to this.
Treasury will determine whether a Transactional Advisor must be procured. The role of the
Transactional Advisor is to advise the Municipality on achieving informed decisions concerning the
effective delivery of the service. The process of procuring a Transactional Advisor is clearly defined in
the guidelines, which should be consulted should such services be required. The PPP Unit project
advisor will assist in compiling the TOR for the Transactional Advisor. The scorecard for procurement
of the Transactional Advisor is prescribed using a two envelope method, giving weighting primarily
to technical and price elements (90%), and also to BEE (10%) but with a gatekeeper requirement of
60%.
It is possible to raise funding for the services of a Transactional Advisor. The PDF has been
established as a vehicle for municipalities to source funding for a portion of the adviser costs,
reducing the impact of service-delivery assessment and procurement costs on municipal budgets.
National Treasury’s Project Development Facility (PDF) may fund a significant portion of a project’s
adviser costs for MSA and MFMA feasibility studies, and/or PPP procurement.
Feasibility
A feasibility study is used to decide on the appropriate delivery option for the proposed project. A
Public Sector Comparator (PSC) is a model which compares internal and external mechanisms for
delivery. “Municipal Services” require the use of a PSC, “Municipal Support Services” may require
the use of a PSC while “use of state property” feasibility studies do not require the use of a PSC. All
PPPs require a feasibility study for which the process is prescribed in the regulations, although
adaptations can be agreed with National Treasury.
The figure below shows the cycle of the feasibility study.
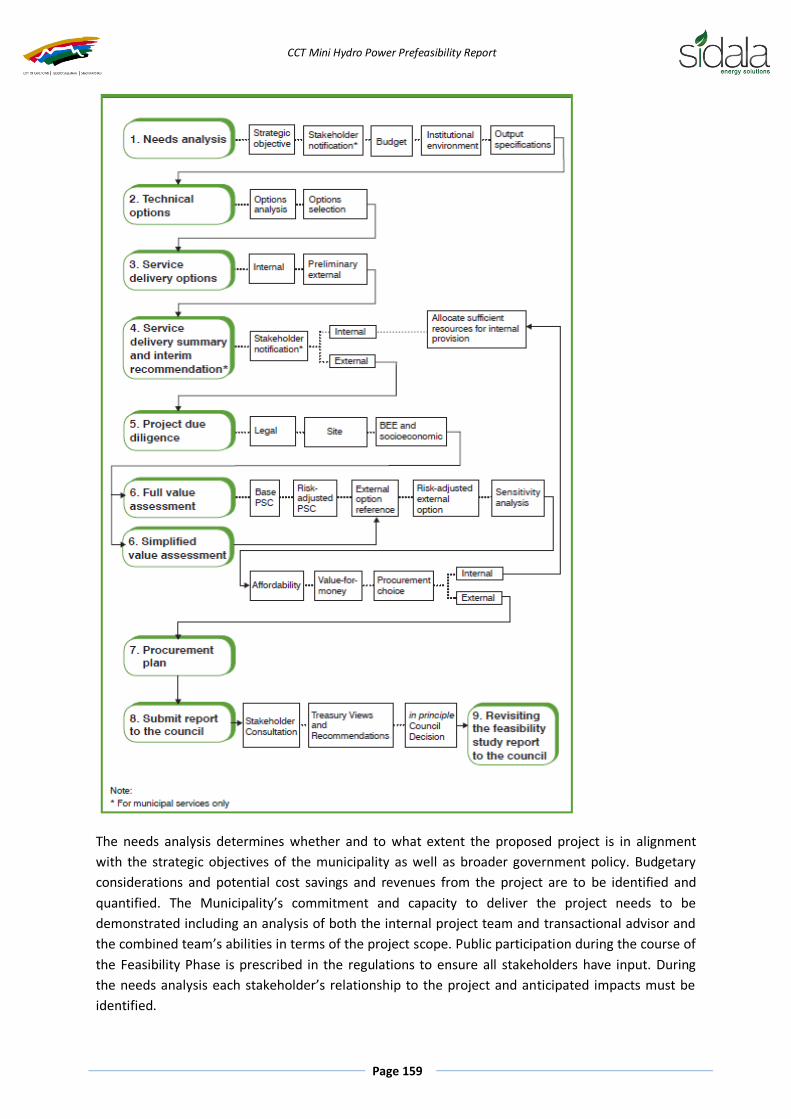
CCT Mini Hydro Power Prefeasibility Report
Page 159
The needs analysis determines whether and to what extent the proposed project is in alignment
with the strategic objectives of the municipality as well as broader government policy. Budgetary
considerations and potential cost savings and revenues from the project are to be identified and
quantified. The Municipality’s commitment and capacity to deliver the project needs to be
demonstrated including an analysis of both the internal project team and transactional advisor and
the combined team’s abilities in terms of the project scope. Public participation during the course of
the Feasibility Phase is prescribed in the regulations to ensure all stakeholders have input. During
the needs analysis each stakeholder’s relationship to the project and anticipated impacts must be
identified.

CCT Mini Hydro Power Prefeasibility Report
Page 160
In conventional procurement the Municipality employs consultants to prepare specifications
describing the infrastructure required to deliver desired outputs. This infrastructure, or input, is then
put out to tender leaving the municipality responsible for the design of the project, all statutory
requirements, and unforeseen costs. The Private Party, however, is only responsible for items
specified within its scope. A key distinction of PPPs as against conventional procurement is that with
a PPP risk is transferred to the Private Party through the specification of outputs as opposed to
inputs. This leaves room for the Private Party to come up with innovative solutions to deliver the
outputs, and requires that the Private Party assume the risk of output delivery.
The Technical Options stage evaluates the various technical options which could meet the required
outputs. This is very project specific and the analysis does not include procurement options, of which
a PPP may be one. Instead, technical options are appraised in terms of a wide range of criteria
including financial, risk, technical, HR capacity and other factors. This appraisal should allow the best
technical solution to be selected.
Following the Technical Options stage, the Service Delivery stage focuses on the method of
procurement. Internal and External options are identified and evaluated. The table below indicates
the elements to be evaluated for different Service Delivery Options.

CCT Mini Hydro Power Prefeasibility Report
Page 161
Following the evaluation of service delivery options, it is necessary to acquire interim
recommendations if the mechanisms under consideration include one or more external options. This
entails creating a summary of the feasibility study to date, attaining municipal manager approval and
notification of local community and labour.
The due diligence stage aims to uncover any issues in the preferred technical solution and service
delivery option that may significantly affect the proposed project. This assessment considers Legal
issues, site enablement issues and BEE and other socioeconomic issues. Legal issues are far more
easily dealt with in the feasibility phase than during procurement. Potential legal issues are
associated with the rights for a Private Party to use public property and ensuring that through the

CCT Mini Hydro Power Prefeasibility Report
Page 162
elected service delivery mechanism, the municipality does not abdicate its constitutional
responsibilities. Site enablement includes all tenure and zoning considerations, as well as potential
title deed registrations such as land claims. Within a PPP structure, BEE requirements are clearly
stated and these must be investigated in depth.
Following the due diligence, a value assessment is conducted which is the analysis which allows the
municipality to make a decision between internal and external mechanisms for service delivery. The
key criteria are:
Is it affordable?
Does it appropriately transfer risk from the municipality to the private party?
Does it provide value for money?
Key terminology is defined in the figure below:

CCT Mini Hydro Power Prefeasibility Report
Page 163
Either a full value assessment or a simplified value assessment will be undertaken depending on the
determination at inception. A simplified value assessment is conducted when an internal mechanism
is not a realistic option for the municipality. This is done in terms of value for money drivers
including the following for a PPP option:
Project objectives expressed as measurable outputs
Incentive for demonstrable innovation by the private party

CCT Mini Hydro Power Prefeasibility Report
Page 164
Transfer of substantial financial, technical and operational risks to the private party
Competitive procurement as to which there are a sufficient number of qualified private
sector firms that may bid
Contract design reflecting good PPP contracting practices to provide for efficient monitoring
and regulation.
In the case of a PPP involving the use of municipal property for commercial purposes by a private
party, value for money is demonstrated through the following drivers:
Increased direct revenue to the municipality
Increased socioeconomic activities within the community
Optimal use of under-performing assets
Job creation
BEE
A full value assessment entails the construction of a PSC. This is encapsulated in the schematic
shown in the figure below:
The process and detail of constructing a PSC are elaborated in detail in the Municipal guidelines,
enabling a thorough comparison of options. This includes thorough project definition, analysis and
quantification of all costs, revenues, assumptions and risk identification and quantification. For the
construction of the external reference model, private sector financing must be modelled to quantify
the cost of capital. An independent assessment of risk perception from the Private Party’s
perspective must be conducted. It is expected that greater value can be liberated through the
private sector’s greater capacity to deal with risks. This may be a corporate finance structure, or a
project finance structure shown below:

CCT Mini Hydro Power Prefeasibility Report
Page 165
The models must be stress-tested through sensitivity analysis. The value assessment provides a
quantitative answer on the expected value for the delivery mechanisms under consideration.
However, qualitative elements such as impacts revealed in stakeholder consultation, allowing the
municipality to focus on core functions and wider benefits must also be considered. If, on the three
key criteria, an external mechanism is preferable, it must be selected and the procurement plan
begun. It is highly recommended that the guidelines are consulted at the point when full value
assessment detail is required.
The procurement plan demonstrates that the municipality has the necessary capacity and budget to
undertake the procurement of the external option. This plan will include:
A project timetable for the key milestones and all approvals which will be required to take
the project from TVR I to TVR III
Confirmation that sufficient funds in the municipality’s budget are available to take the
project to TVR III and into contract implementation
A list of any potential challenges to the project and a discussion on how these will be
addressed by the project team and adviser
The best procurement practice and procedures suited to the project type and structure
The governance processes to be used by the municipality in its management of the
procurement, especially regarding decision-making
The project stakeholders and the extent of their involvement in the external option
The project team with assigned functions
Categories of information to be made available to bidders and how such information will be

CCT Mini Hydro Power Prefeasibility Report
Page 166
developed
A list of required approvals from within and outside the municipality
A Gantt chart of the procurement process, including all approvals and work items necessary
for obtaining these approvals (for procurement documentation as well as, for example, the
land acquisitions and environmental studies to be procured by the municipality)
Contingency plans for dealing with deviations from the timetable and budgets
The bid evaluation process and teams
An appropriate quality assurance process for procurement documentation
The means of establishing and maintaining an appropriate audit trail for the procurement
Appropriate security and confidentiality systems, including confidentiality agreements, anti-
corruption mechanisms, and conflict of interest forms to be signed by all project team
members.
The report must then be compiled with all relevant details and submitted to the municipal council
and to the PPP Unit, which will grant TVRI at this point.
Procurement
All PPPs must be procured in accordance with the requirements of the MSA, MFMA and the National
Treasury regulations and guidelines. However, the regulations are not prescriptive in terms of
procurement processes. It is the responsibility of the accounting officer to design and manage the
procurement process in a way that meets the requirements of the regulations. In addition, with
appropriate motivation, the PPP unit project adviser will approve a simplified procurement process.
Usually, a municipal PPP not requiring the preparation of a PSC should also be a candidate for a
simplified procurement process. However, best practices have been established through experience
of Municipal PPPs.
It is important that the outcomes of the feasibility study are clearly communicated in all
procurement documentation. This includes guiding objectives and outputs expected from the
Private Party. It is crucial that the affordability limits determined in the feasibility study are not
compromised during the procurement phase.
The typical PPP procurement process with indicative timelines is shown in the figure below:

CCT Mini Hydro Power Prefeasibility Report
Page 167
An Expression of Interest can determine the level of interest in the market, and can allow the
Municipality to determine at an early stage the likely success of the Procurement. Private parties will
be able to provide more useful information if the EoI contains greater information on the project
including:
Project Definition
Project Objectives

CCT Mini Hydro Power Prefeasibility Report
Page 168
Value drivers from the municipality’s perspective
Available affordability
Timelines for future phases and communications
Information requirements from private parties such as legal status, relevant track record,
BEE status.
The EOI should be issued early on, probably during the feasibility phase of a PPP.
The Request For Qualification (RFQ) is a likely but not mandatory stage in procurement. The
objectives of an RFQ are to:
Select a limited number of the bidders that are qualified technically, financially and in terms
of BEE.
Set out the rules of participation in the procurement process clearly
Give guidance on the expected kinds of participants in bidding consortiums
It allows the RFP to be issued to a sufficient number of bidders to ensure a healthy level of
competition whilst ensuring that the number of bidders is not so high that proposals are not of
sufficient quality. This number is typically either three or four. In this way commitment and capacity
from bidders during the RFP stage can be assured.
If the RFQ is under-subscribed it may be necessary to restructure the project and issue a new RFQ. It
is undesirable if there are only one or two pre-qualified bidders following an RFQ. If a satisfactory
number of bidders pre-qualify, there is a risk that they will drop out of the procurement before the
RFP. This can be mitigated through the use of a bid-bond.
Potential qualification criteria for the RFQ in the case of a PPP are shown in the figure below:
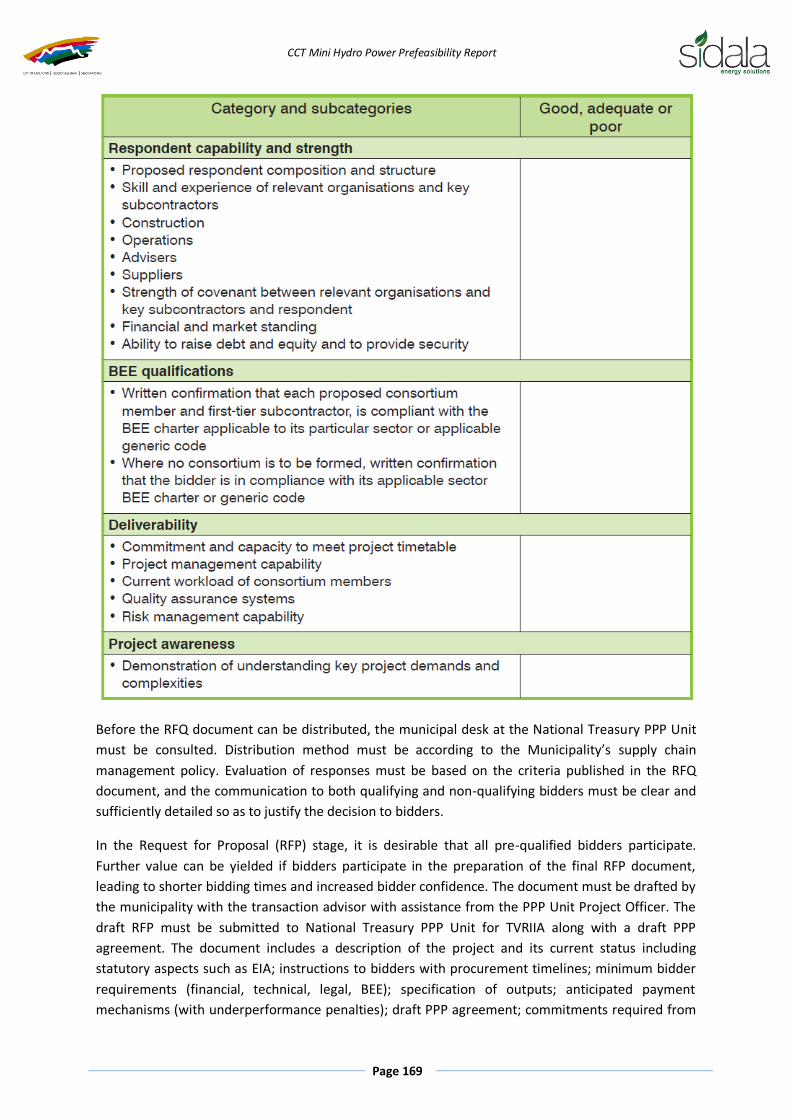
CCT Mini Hydro Power Prefeasibility Report
Page 169
Before the RFQ document can be distributed, the municipal desk at the National Treasury PPP Unit
must be consulted. Distribution method must be according to the Municipality’s supply chain
management policy. Evaluation of responses must be based on the criteria published in the RFQ
document, and the communication to both qualifying and non-qualifying bidders must be clear and
sufficiently detailed so as to justify the decision to bidders.
In the Request for Proposal (RFP) stage, it is desirable that all pre-qualified bidders participate.
Further value can be yielded if bidders participate in the preparation of the final RFP document,
leading to shorter bidding times and increased bidder confidence. The document must be drafted by
the municipality with the transaction advisor with assistance from the PPP Unit Project Officer. The
draft RFP must be submitted to National Treasury PPP Unit for TVRIIA along with a draft PPP
agreement. The document includes a description of the project and its current status including
statutory aspects such as EIA; instructions to bidders with procurement timelines; minimum bidder
requirements (financial, technical, legal, BEE); specification of outputs; anticipated payment
mechanisms (with underperformance penalties); draft PPP agreement; commitments required from

CCT Mini Hydro Power Prefeasibility Report
Page 170
bidders (project structure, financial including financial models, legal, technical, BEE); evaluation
criteria and scoring formula (it is important that these elements are set because they cannot be
changed at the evaluation and adjudication stages).
Following the bid preparation period, the bids received must be evaluated in a transparent and
structured manner, helped through management of the bid by experienced officials.
There are three levels of evaluation:
Technical evaluation teams (TETs), evaluate technical, price, and BEE elements
The bid evaluation committee (EC), evaluate the overall integrated solution
The bid adjudication committee (AC), scores the bids, selects the preferred bidder or
implements a best and final offer (BAFO)
Following selection of preferred bidder TVRIIB must be requested. A BAFO is usually requested if:
The bids are identical or too similar to choose a clear preferred bidder
No single bid meets the municipality’s defined project objectives
It should be avoided if possible because the RFBAFO document needs to be submitted and TVR IIA
requested for a second time, a further process of evaluation and adjudication completed (similar to
RFP), as well as placing additional cost burden on bidders. Finally, a value assessment report must be
compiled and submitted to council.
Moving from preferred bidder to a signed PPP agreement requires a negotiation to bridge any gaps,
provide clarification where necessary and to ensure the agreement is fair and functional. The
negotiations are best conducted in an atmosphere of trust and cooperation. After resolution, TVR III
must be requested with a report which is a continuation of the value assessment report including
contingent liabilities incurred by the municipality and a PPP management plan. After receiving TVR
III, an MFMA section 33 report must be compiled reflecting the views and recommendations of
National Treasury. After financial close of the project, the transactional advisor will produce a close
out report for the municipality and a case study for the public.
Contract Management
Contract management is the process that enables both parties to a contract to meet their
obligations to deliver the objectives of the agreement. It involves building a good working
relationship between the two parties, and continues throughout the life of a contract. Naturally, a
significant emphasis is placed on soft skills to ensure this.
From the perspective of the Municipality, the main aim of contract management is to obtain the
services specified in the output specification and ensure affordability, value for money and
appropriate risk transfer. Alignment between municipality and private party is achieved because
both parties desire achievement of outputs, resulting in an increasingly constructive partnership.
The more severe the effects of a failure to deliver outputs, the more stringent the monitoring plan
needs to be.

CCT Mini Hydro Power Prefeasibility Report
Page 171
According to the MFMA, the responsibility for effective contract management ultimately sits with
the accounting officer. Delegation is made by the Accounting Officer to the Project Officer who
needs to be appointed early in the inception phase and who ideally will continue to manage the
project through future phases. In this was continuity is achieved through all phases of the PPP
project. Succession planning for critical skills is essential as PPP projects will usually outlive
employment periods.
It is the Project Officer’s responsibility to assemble the team to manage the PPP contract. Skill
requirements include:
Expert subject matter knowledge
Design and construction
Business and product assurance
Facilities and services management
Information technology
Statutory safety and regulatory responsibilities
Regulation and law
Human resources
Customer service
Public relations
Finance
Black economic empowerment.
The three main functions of PPP contract management are:
Partnership management, concerning how the municipality and the private party relate to
each other
Service delivery management, the systems and procedures designed to manage risk and
performance
Contract administration, ensuring that all the procedures in the contract and accompanying
documentation are effectively managed
These elements are described in the figure below:

CCT Mini Hydro Power Prefeasibility Report
Page 172
Each element of contract management has application in each phase of a PPP project. The stages of
PPP contract management are:
The procurement stage – from the start of a PPP project until the signing of the contract
The development stage – from the signing of the contract until the commencement of
service delivery
The delivery stage – the period when services are provided and used
The exit stage – the phase towards the end of the life of the project (whether the project
ends through expiry or termination) during which activities are wound up and the
municipality makes new financial and contractual arrangements for continued service
delivery.
A PPP contract will contain written agreement on service, pricing mechanisms, private-party
incentives, contract timetable, means to measure performance, communication routes, referral
procedures, variation management procedures, agreed exit strategy and agreed termination
options. These elements are all established prior to signing of the agreement, meaning that the
foundations for management of the contract are also established prior to signature. The three
elements are further divided in terms of the phases of a PPP project in the figure below:
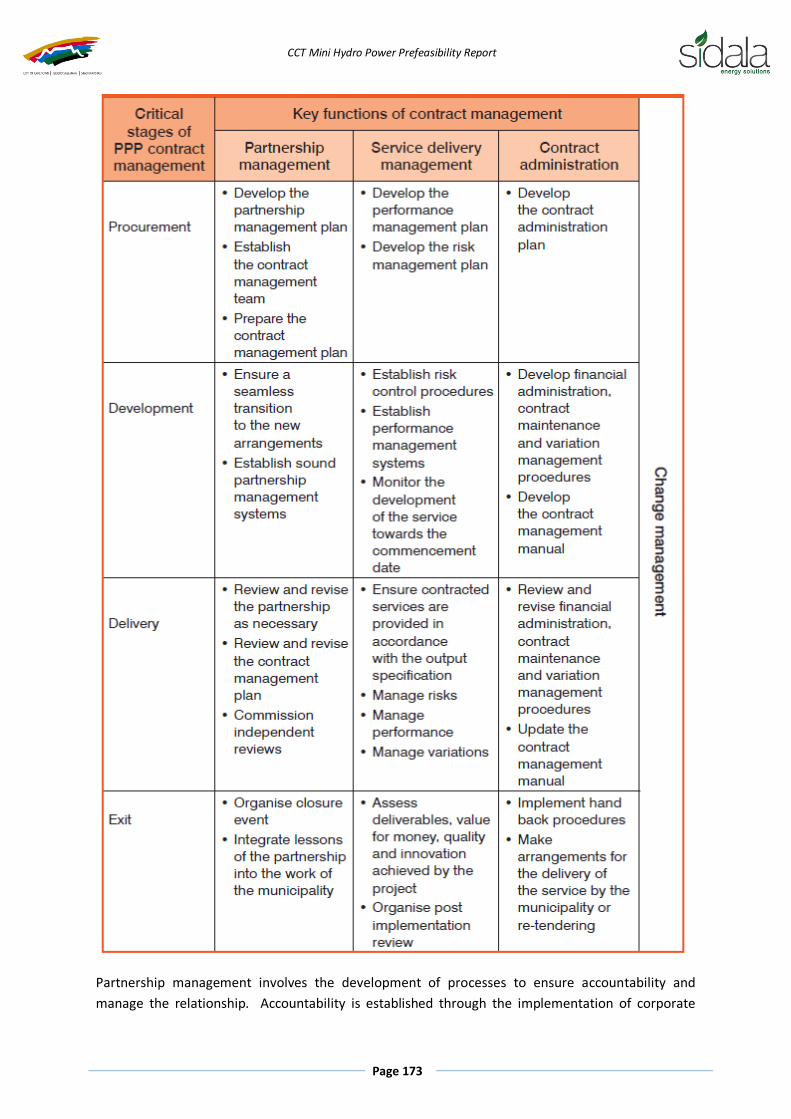
CCT Mini Hydro Power Prefeasibility Report
Page 173
Partnership management involves the development of processes to ensure accountability and
manage the relationship. Accountability is established through the implementation of corporate

CCT Mini Hydro Power Prefeasibility Report
Page 174
governance frameworks, outlined in the King Code. Trust and communication must be encouraged in
strategic, business and operational levels off the PPP activities, and an appropriate system for
dispute resolution between the parties is established and understood.
Service delivery management is divided into two principal categories: risk management, concerning
project exposure to threats; and performance management, concerning delivery and optimization of
outputs. Risk management is established prior to signature of the PPP agreement, and the risk
matrix apportioning established at this stage needs to be upheld following procurement of the
agreement. The Project Officer must ensure that each risk is assigned a responsible party, and that
the party is able to mitigate the risk sufficiently.
Performance management consists of three key elements:
The level of performance in output delivery, must be reasonable and measurable
The method of monitoring performance, this will include monitoring methodology specified
in the performance management plan including user feedback and corrective actions for
deviation
The consequences for the private party of failure to meet the required level of performance,
including both penalties and incentives for exceeding the required level of performance
Both risk and performance management are conducted in a cyclic manner, allowing continual
improvement of the operation and increase of value provided by the PPP to both parties.
Contract administration activities can be broadly grouped into three main categories:
Variation management, enables accommodation of changes to the PPP, can be initiated by
either party and the intention is to distribute costs or benefits fairly
Contract maintenance, ensures that the PPP agreement is kept up to date with changes as
the project progresses
Financial administration, procedures to make and receive financial payments, and keep
records of financial transactions

CCT Mini Hydro Power Prefeasibility Report
Page 175
Appendix D Development Phase TOR
Technical TOR
Background
The sites are within a bulk water supply system, which is a critical municipal service. Thus the
operation of hydroelectric plant within the system must not impact on the availability of the relevant
system components.
Scope
The scope of work is to enhance, refine the Prefeasibility Design through:
1. Head Assessment
2. Hydrology Assessment
3. Feasibility Design (including all required components such as geotech studies and grid
studies)
4. Cost Estimation
5. Production projection
6. Implementation and Operation Phase Design
Head Assessment
Confirm Gross Head at each site either by survey or from existing drawings
Evaluate head losses to quantify Net Head to 95% confidence at required turbine locations
at all relevant flow rates through:
o Long-section analysis of pipelines including consideration of upstream agricultural
supply and leakage.
o Pressure measurements at the required location
Hydrology Assessment
Confirm feasibility findings and conduct detailed analysis of the flow to produce yearly, flow
duration curves. Monthly, daily and hourly flow distributions must also be produced for
each site.
Flood estimate
Investigate integration with Bulk Water system operation for alteration and optimisation of
flows for power generation without any compromise of water supply operations
Feasibility Design
Feasibility Design must be conducted, considering the following general requirements:
1. The consultant must at all junctures be aware that the hydroelectric plant will exist within,
and as a result of the operation of the Bulk Water supply system. Water supply objectives
must remain paramount and ongoing consultation with Bulk Water stakeholders is essential.

CCT Mini Hydro Power Prefeasibility Report
Page 176
2. Availability of the water supply infrastructure must be at levels >99.9% continuously. In the
event of the hydroelectric plant not being able to operate for whatever reason, it shall be
bypassed to allow the water supply operations to continue irrespective.
3. Minimum maintenance and remote operation and monitoring is required
Determine, design and conduct the following:
Selection of a preferred option for each site from, but not limited to, the options identified
in the prefeasibility design taking into account power potential and energy production. The
selection must be made in conjunction with the proponent to optimise:
o Specific cost (R/MW) minimisation and levelised cost of electricity (R/kWh)
o Energy generation maximisation (MWh/annum)
o Project IRR maximisation (Project and Equity IRR)
Optimisation of the preferred layout, including design to feasibility level of the following:
o Electromechanical: Refined turbine selection based on quotations from turbine
manufacturers.
o Electrical: Detailed connection assessment outlining possible losses, single-line
diagram, precise operating mode and integration with the power network. Facilitate
and communicate with Eskom and ESD regarding the grid study initiated by the
client.
o Civil: size according to the selected turbine water conveyance system
(penstock/canal etc), intake structure and possible sedimentation problems, hoisting
facility and access roads/route plan if required. All water conveyance structures
must be designed to minimise losses and where existing infrastructure is in place, a
cost benefit analysis to be performed analysing a replacement option.
o Hydrological: flow modelling, tailwater analysis where necessary, flood potential
and appropriate protection for maximum floods where necessary
o Geotechnical: detailed foundation investigation including, as necessary, test pitting,
core drilling, machine excavations at key foundation points. Surface geological
mapping and profiling of the site, identification of potential construction material
(rock for aggregates and sand filters)Foundation investigation programme for all
necessary sites with particular emphasis on sites with significant civil works
requirements
Design of all components in sufficient detail to obtain quantities for all items contributing
more than 10% to the cost of the works
Perform hydraulic modelling of the preferred option at each site
Identify major risks at each site facing hydroelectric generation objectives, and select
mitigation measures
In conjunction with relevant Bulk Water stakeholders, identify any and all risks facing Bulk
Water objectives as a result of the presence of the hydroelectric plant, and select mitigation
measures

CCT Mini Hydro Power Prefeasibility Report
Page 177
Cost Estimation
Based on the bill of quantities for the preferred option, estimate the cost of all professional services
and works for Implementation to +-10% confidence.
Production Projection
Production estimates resultant from the above must be projected taking into account:
Determine annual energy production
Determine monthly energy production
Determine daily energy production giving distribution for time of generation and potential to
optimise peak, standard and off-peak generation. The consultant is to communicate with
the client regarding the benefits provided in this regard in the expected offtake agreement.
Design of future phases
Design and consider the following for the progression of the project:
Determine Detailed Design requirements
Determine requirements for safeguarding live pipes during execution of works
Determine requirements for civil and electromechanical works including construction site
maintenance in an orderly state during execution of the works and condition following
completion of works with surplus material/debris removal from site etc
Compile Tender Documentation and Tender program
Compile Construction Program
Determine Project Management and construction monitoring requirements during
implementation
Investigate and describe impacts during implementation, operation and decommissioning
phases for environmental applications
Deliverables
All work must be documented in a multi-volume, comprehensive feasibility report. Specific
deliverables include:
Full resource assessment including:
o Quantification of generating head to 95% confidence at all relevant flows for each
site
o Flow Duration curves and monthly, daily and hourly flow distributions for each site
to 95% confidence. 1/50 year flood potential. Potential for optimisation of flow
regimes for power generation and water supply objectives.
Feasibility Design:
o Layout option selection according to specific cost, energy generation, and
investment optimization criteria
o Engineering drawings to feasibility level design according to CoCT Bulk Water
standards considering an expected 30 year project life for: electromechanical,
electrical (including single line diagram), civil, hydrological, geotechnical.

CCT Mini Hydro Power Prefeasibility Report
Page 178
o Bill of Quantities
o Risk and mitigation matrix for each site for risks facing hydroelectric generation
objectives
o Risk and mitigation matrix for each site for risks facing water supply objectives as a
result of the presence of the hydroelectric plant
Cost estimate of all professional services and works for Implementation to +-10%
Energy production projections to 95% confidence, providing annual figures with monthly
variations. Daily variations are to be presented with sufficient detail to determine the
validity and facilitate execution of potential Time of Generation offtake agreement.
Future Phase Design
o Tender Program
o Integration plan safeguarding Bulk Water objectives during Implementation Phase
o Integration plan safeguarding Bulk Water objectives during Operation Phase
o Construction program and professional services required for implementation
o Description of environmental impacts sufficient for environmental impacts
All data must be provided to the client for input into financial models at all times for the continual
assessment of the Project’s viability.
Counterpart Provisions
The following will be provided to the consultant by the client:
Prefeasibility Flow Data in spreadsheet form
Raw Data from central and sites
Infrastructure Drawings and specifications
Pipeline long sections
Contact details and facilitation of meetings with site managers
Water quality standards and minimum requirements
Information Required for Selection Process:
Experience and track record (including intended partners providing specific expertise)
Composition of team and names of individuals that would handle the assignment including
CV’s
Immediate availability
Fee charges including total financial proposal, hourly rate applicable to each individual and
alternative pricing structures
Other charges Conflicts of interest PI cover

CCT Mini Hydro Power Prefeasibility Report
Page 179
Legal TOR
Background
The Proponent is developing the hydroelectric potential in the CoCT Bulk Water system and requires
the services of a Project Legal Advisor. The Project’s Legal Advisor is required to advise and assist the
Client generally on all legal aspects of the Project.
Scope
Project Documentation
Review, comment on, advise and draft if necessary:
Power Purchase agreement
Eskom Inter-Connection Agreement
Electricity generation licence
Implementation Agreement/s:
o EPC Wrap (Turnkey) Agreement or;
o Tender and Detailed Design Agreements
o Construction Monitoring Agreement
o Civil Construction Agreement
o Electromechanical Supply and Installation Agreement
Operation and Maintenance Agreement
Warranty Agreement/s
Shareholders Agreement or equivalent as necessary
Fixed and movable property Lease Agreement/s as necessary
Project Finance
Review, comment on, advise, and draft as necessary:
Financing term-sheet prepared by the Project’s financing institution/s
Assist the Proponent in negotiation of comments and heads of terms raised by the Lenders’
Legal Advisor (LLA)
Common terms agreement relating to common covenants and other terms which apply to
senior and any mezzanine facilities, if applicable
Senior Facilities Agreement, if applicable
Mezzanine Facilities Agreement, if applicable
Intercreditor Agreement governing relations amongst senior and mezzanine lenders. It is
unusual for the Project to be a party to the intercreditor agreement, but counsel must
ensure that there are no unusual or prejudicial intercreditor terms
Account Bank Agreement regulating the role of the Account Bank in relation to project
cashflows
Subordination Agreement in terms of which any financial contributions made by the
Proponent to the Project are subordinated to the claims of the senior and mezzanine lenders
against the Project Company

CCT Mini Hydro Power Prefeasibility Report
Page 180
Various Security Documents whereby the Project provides necessary guarantee to the
Lenders. The structure for provision of the necessary security through guarantees of Project
obligations must be investigated and selected. The Security provided by the Project may
include, but is not limited to:
o Cession of claim on shares and loan claims held in the Project by the Proponent
o Cession of rights to income streams under the PPA and Emissions Reduction
Purchase Agreement (if applicable) held by the Proponent
o As applicable under relevant legislation, Direct Agreement between Lenders and
property owner, CoCT, such as claim on registered long term lease in respect of the
sites. Counsel must bear in mind limitations for attachment of the property of a
Public Institution
o Provision of necessary claim on tangible assets of high value including turbines and
related such equipment
Ancillary
Provide ancillary services required by the Project arising from the Project Documentation and
Project Finance work. Review, comment on, advise and draft as necessary all constitutional aspects
and other documentation in relation to the Project excluded from the specified documentation
above. Services may include, but are not limited to:
Advise on specific BBBEE issues, setting up of BEE shareholding trusts and so forth
Review the Project’s risk matrix providing an assessment and proposed mitigation of all
major risks and issues which may affect the Project
Advise the Proponent on all relevant approvals, permits and regulatory matters which may
have an impact on the Project
Deliverables
All documentation executed
Information Required for Selection Process:
Experience and track record (including intended partners providing specific expertise)
Composition of team and names of individuals that would handle the assignment, CV’s
Immediate availability
Fee charges including total financial proposal, hourly rate applicable to each individual and
alternative pricing structures
Other charges
Conflicts of interest
PI cover

CCT Mini Hydro Power Prefeasibility Report
Page 181
Environmental TOR
Scope
Notify Authorities
Notify the relevant Local, Provincial and National Authorities in accordance with relevant
regulations. The next phase (Public participation) can only take place after the relevant authority
has issued a reference number, hence this process must be conducted timeously.
Public Participation
Below is an overview of the public participation process to be undertaken on behalf of the client by
the EAP. In accordance with the EIA Regulations (2006) and the guideline on Public Participation in
support of the EIA Regulations (developed by DEAT, 2005), the EAP must ensure that the following is
undertaken:
Place site notices
Provide written notices to:
o Adjacent land owners and occupiers
o Owners and occupiers within 100m of boundary of site
o Ward Councilor
o Municipality
o Organisations such as rate payers associations, farmer unions, NGO’s, etc
o Provincial Departments having jurisdiction
Place newspaper adverts (local and/or provincial)
Prepare Interested and Affected Parties (I&APs) Database
Convene a public meeting
Provide I&Aps opportunity to comment on reports
In addition, an authorities meeting must be facilitated by the EAP. The invitation must be extended
to relevant institutions including but not limited to Department of Environmental Affairs and
Tourism (DEAT), South African Heritage Resources Agency (SAHRA), Department of Water Affairs
(DWA), CoCT, National Energy Regulation of South Africa (NERSA) and Department of Energy (DoE).
Provide the attendees with the relevant information and determine the requirements of the various
authorities.
Application Form
Prepare the relevant Application Form and facilitate the signing thereof by CoCT, for submission with
the Basic Assessment Report (BAR) to DEAT.
Basic Assessment Report
Prepare a compliant Basic Assessment Report, containing all relevant information including the
following:
A description of the proposed activity and of any feasible and reasonable alternatives that
have been identified
An identification of all legislation and guidelines that have been considered in the

CCT Mini Hydro Power Prefeasibility Report
Page 182
preparation of the report
Physical size of the activity
Site Access
Site or route plan
Site Photographs
Facility Illustration
Description of the receiving environment
Property Description
Activity Positions
Details regarding the site including – gradient, location in landscape, groundwater, soil and
geological stability, groundcover and cultural /historical features
Land-use character of the surrounding area
Socio Economic Context
Resource use and process details including waste, effluent, emission management, water
use, power supply and energy efficiency
Impact assessment during the construction, operation, decommissioning and closure phases
Assessment of cumulative impacts
EAP Details
Any specific information that may be required by the competent authority
An environmental impact statement which contains:
o A summary of the key findings of the environmental impact assessment
o A comparative assessment of the positive and negative implications of the proposed
activity and identified alternatives
EAP recommendations
Environmental Management Plan (EMP), which complies with regulation 34 of R385
A summary of the findings and recommendations of any specialist report or report on
authorization process
Submit Basic Assessment Report
Submit Basic Assessment Report to the relevant authority.
Deliverables
Compliant public participation process with proof of all activity, representations, comments
and objections complete
Application form for signoff by CoCT prepared
Application form submitted
Basic Assessment Report complete
Basic Assessment Report submitted
ROD received

CCT Mini Hydro Power Prefeasibility Report
Page 183
Counterpart Provisions
Site information necessary for the compilation of the Basic Assessment Report
Technical information necessary for the compilation of the Basic Assessment Report,
including activity during implementation, commissioning, operation, and decommissioning.
Necessary engineering sketches and drawings
Necessary legal documentation associated with pertinent property
Information on existing operations on the sites
Information Required for Selection Process:
Experience and track record (including intended partners providing specific expertise)
Composition of team and names of individuals that would handle the assignment including
CV’s
Immediate availability
Fee charges including total financial proposal, hourly rate applicable to each individual and
alternative pricing structures
Other charges
Conflicts of interest
PI cover

CCT Mini Hydro Power Prefeasibility Report
Page 184
Clean Development Mechanism TOR
Scope
Confirm Project eligibility under CDM
An assessment must be conducted to confirm that the project is eligible to be developed as a CDM
under the guidelines established by multi-lateral and host country institutions for climate change
projects under the Kyoto Protocol. Particular attention must be paid to key issues that are central to
determining a project’s eligibility, the fulfilment of host country sustainable development criteria
and, most importantly, the additionality of the project. (The reduction must be additional to any
“business-as-usual” emission reductions). Consultation with DNA and UNFCCC personnel must be
conducted to discuss the eligibility of the projects.
Select optimal CDM project structure
Investigate and select the most cost-effective structure in which to develop the carbon reduction
value produced by the Project. Individual project development, “Bundling” and “Programme of
Activities” are potential options identified.
Prepare Preliminary Estimates of GHG Reductions and Determine Their Market Value
To assist the client in understanding and quantifying the financial benefits of developing the project
under the CDM, an evaluation must be conducted with and without project (i.e., baseline) scenarios.
This evaluation must provide a preliminary estimate of the amount of carbon credits that would be
generated by the project, and their potential value on the market at current and expected prices.
Obtain DNA letter of no objection
The consultant must, on behalf of the Client, complete the required documentation (e.g. a Project
Idea Note (PIN)) and provide ongoing advice to the Client with respect to obtaining a Letter of No
Objection from the Designated National Authority (DNA).
Public Participation
Conduct Public Participation in accordance with relevant national and UNFCCC regulations.
Develop Project Design Document (PDD)
The consultant must prepare a Project Design Document (PDD) for the project, the formal document
that must be submitted with the methodology submission for independent third-party validation by
a DOE and ultimately submitted to the CDM Executive Board for registration of the project as a CDM
activity. The consultant must ensure that all of the relevant information is presented appropriately.
The Measurement and Verification plan must be assessed and system design supported to ensure
standards acceptable to UNFCCC are incorporated in the technical specification of the project.
Validation and Registration
The consultant must facilitate the engagement of a DOE and the validation process including:
Assist with the contracting of a suitable DOE
Select appropriate team/ review of CVs
Coordinate and attend site-visit
Manage project validation and answer requests for clarification / corrective actions as

CCT Mini Hydro Power Prefeasibility Report
Page 185
applicable
The consultant must facilitate engagement with UNFCCC executive board and the registration
process.
Deliverables
The specific deliverables that will be prepared for this project are:
Confirmation that the project is eligible under CDM
Optimal CDM project/program structure to incorporate the multiple sites identified and
associated development and implementation planned
Projected CER production complete and CDM income quantified
PIN complete
PIN submitted to DNA
Receive Letter of No Objection from the DNA
Assess Measurement and Verification plan
PDD complete
Public Participation complete
PDD submitted to DNA
Receive Host Country Approval from the DNA
Source, engage and contract DOE on behalf of client
Validation of Project
PDD submitted to UNFCCC
Registration of Project
Counterpart Provisions
The following inputs will be provided to the consultant by the client:
Technical inputs regarding the specification of the project, enabling development of the
PDD.
Financial inputs regarding the specification of the project, enabling development of the PDD.
Information on barriers that may be overcome by the registration of the project as a CDM
project, to assist with additionality argument.
Information about the Project Proponent’s sustainable development initiatives, enabling
DNA acceptance for Host Country Approval.
Information and progress reporting on environmental applications and approvals and
process followed. The public participation for Environmental and CDM purposes must occur
simultaneously to save costs and it is the responsibility of the consultant to ensure that the
CDM public consultation occurs alongside the Environmental public consultation.
Information Required for Selection Process:
Number of CDM projects registered by the Consultancy
Experience and track record (including intended partners providing specific expertise)

CCT Mini Hydro Power Prefeasibility Report
Page 186
Composition of team and names of individuals that would handle the assignment including
CV’s
Immediate availability
Fee charges including total financial proposal, hourly rate applicable to each individual and
alternative pricing structures
Other charges
Conflicts of interest
PI cover